- 1CRASH, Centre de Recherche Acoustique-Signal-Humain, Université de Sherbrooke, Sherbrooke, QC, Canada
- 2Mecanum Inc., Sherbrooke, QC, Canada
A semi-empirical model for the assessment and an optimization procedure of the sound absorption coefficient of compressed nonwoven fibrous materials made from recycled Nylon fibers (RNF) is developed. In general, the prediction of the sound absorption properties of materials requires the measurement of non-acoustic parameters by specialized characterization tools that are not always within reach of most laboratories. The objective of the proposed model is to establish empirical relationships between these non-acoustic parameters and the bulk density of RNF materials. These empirical relationships are then substituted into a conventional acoustic model for porous materials, namely, the model of Johnson-Champoux-Allard. The proposed model accurately predicts the sound absorption coefficients of compressed RNF materials based solely on bulk density, thickness, and frequency. This prediction is validated through impedance tube measurements. Moreover, the model is used with a proposed optimization producedure to identify the ideal density and thickness for maximum sound absorption at a specific frequency. Impedance tube measurements on optimized configurations confirm the effectiveness of this optimization process.
1 Introduction
In the current context of sustainable development, engineers and scientists are developing materials having a minimum impact on the environment; they are called green or eco-friendly materials. Some of these materials have shown excellent sound absorption properties compared to conventional materials such as glass and rock wools, with a minimum impact on the environment. In fact, while glass and rock wools are excellent sound absorbers, their recycling is still difficult and their processing is highly energy-consuming (Desarnaulds et al., 2005). An alternative to these wools are fibrous materials made from recycled fibers–this paper focuses on this type of materials. Such materials already replaced successfully glass and rock wools: cotton absorbers made from recycled clothing (shoddies) (Langley et al., 2000) and cellulose insulation made from recycled newspapers and even vegetal wools (Piégay et al., 2021) are a few examples. Reviews of sustainable materials and their applications to noise control can be found elsewhere (Desarnaulds et al., 2005; Langley et al., 2000; Asdrubali, 2006).
The modeling of sound propagation and sound dissipation in traditional porous materials is well known. Reviews can be found elsewhere for fibrous materials (Manning and Panneton, 2013; Lei et al., 2018; Tran et al., 2024a) and general porous media (Allard and Atalla, 2009). For eco-friendly acoustic fibrous materials made from recycled materials, many research works have been published in the past 10 years. Most of these works focus on the characterization of their acoustic properties (ex.: sound absorption coefficient) and on the comparison with traditional glass or mineral wools (Manning and Panneton, 2013; Lorenzana et al., 2002; Lee and Joo, 2003; Kosuge et al., 2005; D’Alessandro and Pispola, 2005; Del Rey et al., 2011; Maderuelo-Sanz et al., 2012). These works show the potential of using fibers from different post-consumer or post-industrial wastes (end-of-life tires, plastic bottles, used carpets, metal shavings, fabrics … ) to fabricate good fibrous sound absorbers. In these works, most of the recycled fibrous materials are nonwoven assemblies, where the fibers are blended and mechanically bonded (ex.: needle punched), thermally bonded or resin bonded. In general, few details are given to link their acoustic performance to their fabrication process, their microstructure or intrinsic parameters with a view to optimizing their sound absorption properties.
Porous materials are frequently acoustically modeled using an equivalent fluid method, assuming the frame is acoustically rigid. Common models for this approach include the 6-parameter Johnson-Lafarge (JL) model and the 5-parameter Johnson-Champoux-Allard (JCA) model. The parameters for these models are static airflow resistivity, open porosity, tortuosity, viscous and thermal characteristic lengths, and static thermal permeability. In the past, numerous theoretical and numerical studies have been conducted to connect these parameters for fiber bundles to their microstructure and acoustic properties, with reviews available elsewhere. (Luu et al., 2017; Pompoli and Bonfiglio, 2020; Tran et al., 2024a) However, such research on acoustic materials made from waste textiles or natural fibers remains limited.
Manning and Panneton (2013) measured the JL parameters in various manufactured samples of shoddies made from waste textiles. They developed empirical formulas that relate the JL parameters to the bulk densities of shoddies, which range from 30 to 180 kg/m3 (or porosity from 86% to 98%), with an average fiber diameter of about 22
For felts made from recycled fibers, Tran et al. used a multiscale numerical approach to link the microstructural features (fiber radius distributions and orientation) to the JL parameters. From their results, they updated the semi-analytical relations of Luu et al. (valid for a single fiber diameter) by including the fiber diameter distribution. Contrary to the latter two studies, this time the relations are based only on microstructural features and not on the bulk density. Also, their relations are validated for fiber diameters varying between 0 and 60
All the previous relations on sustainable materials were experimentally validated against measured JL or JCA parameters and their ability to predict the normal incidence sound absorption coefficient obtained using an impedance tube. A common aspect of these studies is that the average diameter of the fibers is less than 30
In the following, the acoustic model used to describe the porous materials is first presented. Second, experimental characterizations of several RNF assemblies of different densities, ranging from 30 to 180 kg/m3;, are performed. Empirical relationships between each material property (airflow resistivity, open porosity, tortuosity, viscous and thermal characteristic lengths) and the bulk density are developed. Third, the empirical relationships are used in the acoustic model to derive the semi-empirical model for the RNF blend. This semi-empirical model depends only on the bulk density and thickness of the blend, and the frequency. Fourth, design charts for the RNF sound absorbers are obtained from the semi-empirical model to define optimal sound absorption configurations. To facilitate optimization, a straightforward theoretical procedure is finally developed and validated.
2 Theory
The RNF blend is seen as a porous medium made of a solid phase (the fibers) and a fluid phase (here air), see Figure 1. The fluid phase forms a complex network of interconnected pores in which an acoustic wave can propagate and dissipate by thermal and viscous losses. Typically, the fluid phase network is characterized by five macroscopic parameters. Besides the bulk density (
where
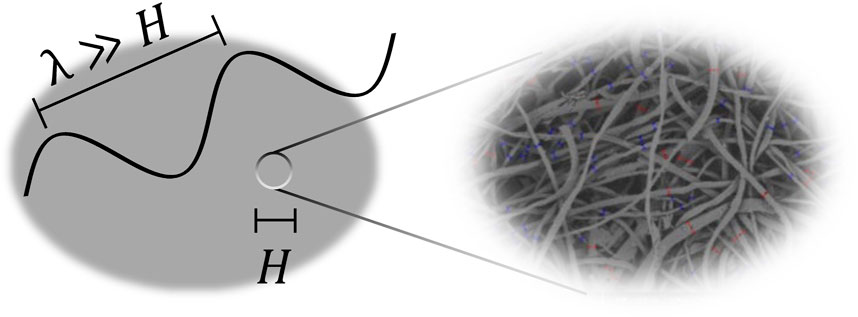
Figure 1. Representation of the acoustic macroscopic scale H on a material sample (large gray disk), where
In the present work, the acoustic response of the RNF blend may differ from the classical behavior of simple fiber assemblies, more particularly at higher compaction levels (i.e., higher densities, lower porosities, and higher tortuosities). Consequently, it is preferred to use the general 5-parameter JCA model instead of a specific model. In this model, the equivalent dynamic density and bulk modulus are given by (Equations 5 of Allard and Atalla (2009))
and
where
Once these two dynamic properties are known, the sound absorption coefficient of a layer of thickness L backed by a hard wall is given by
where c0 is the speed of sound in the fluid, and
2.1 Optimization of sound absorption
The surface impedance in Equation 6 depends on six material parameters (
3 Experimental characterization, material and methods
3.1 Description of the materials
The fibers used in this study come primarily from recycled carpets. The carpets are shredded into short fibers which are then cleaned up and mixed into a homogeneous mixture. Finally, the blend is compacted to reach a given bulk density. Figure 2 shows photos of the mixture. An optical analysis indicates that the diameter d of the fibers ranges typically between 50 and 90
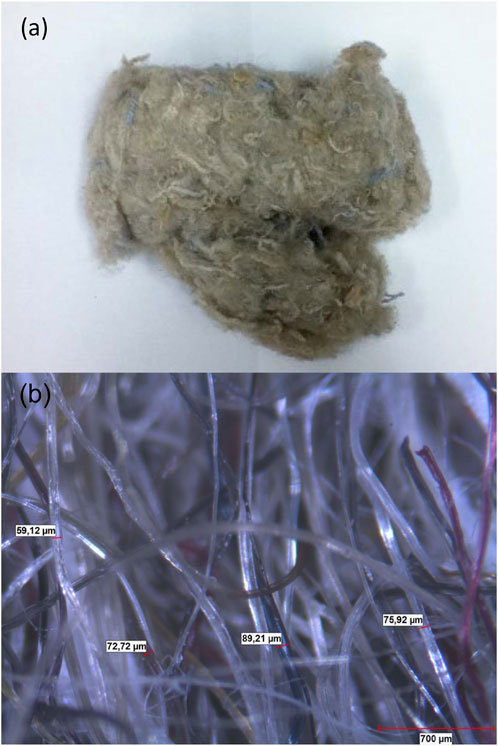
Figure 2. (A) Photos of the studied fiber blend made from recycled carpets. (B) Optical microscope images. The fiber diameters range generally from 50 to 90
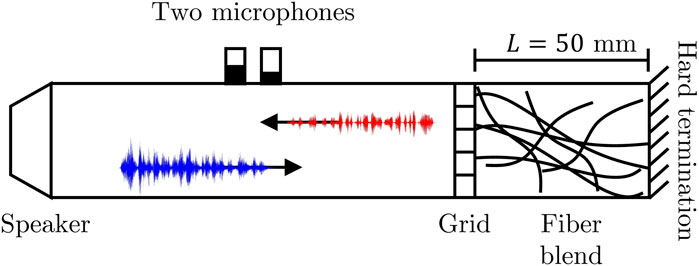
Figure 3. Sketch of the impedance tube with the fiber blend compacted between the grid and the hard wall termination.
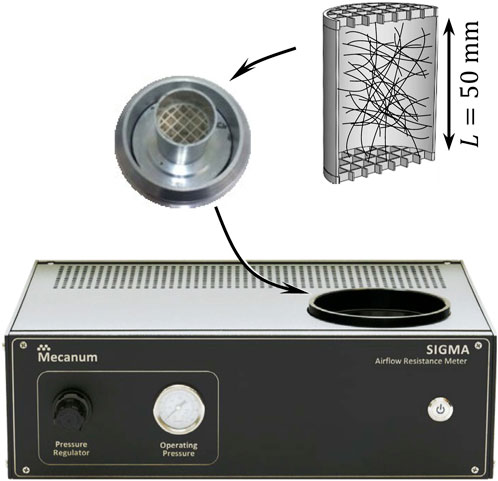
Figure 4. Specimen holder placed in the support of the airflow resistivity meter [Model Sigma-X 2010, Mecanum, inc.].
3.2 Sound absorption coefficient
The normal incidence sound absorption coefficient of a test specimen is measured following the standard test method ISO 10534-2 using a Mecanum’s impedance tube with the transfer-function method. (ISO 10534–2:2023, 2023) A tube of D = 44.44 mm in diameter is used. The valid frequency range of the tube spans from 100 Hz to 4,100 Hz. To test RNF blends at different bulk densities, a given mass M of RNF is compacted in the tube between a fixed grid and the hard termination of the tube, see Figure 3. The grid is acoustically transparent and the thickness of the blends is fixed to L = 50 mm. The bulk density of a compacted RNF blend is then given by
3.3 Bulk density
From the fiber composition detailed above, one can estimate the density of a representative fiber of the blend by
With the measured values on 8 samples, this yields
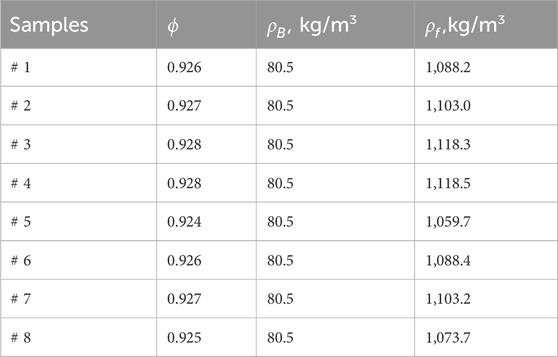
Table 1. Results of the porosity and bulk density tests using the pressure/mass method. The fiber density (last column) is deduced from Equation 7.
3.4 Open porosity
Since the measurement of the open porosity is lengthy, one prefers to use Equation 7 to deduce the porosity of a given compaction of fibers. For the sake of clarity, Equation 7 is rewritten in terms of open porosity in function of bulk density
This equation assumes knowledge of the representative density of the fibers.
3.5 Static airflow resistivity
The static airflow resistivity
where
To control the thickness and the diameter of the compacted fiber blend, the specimen holder shown in Figure 4 is used. A given mass M is carefully compacted in the inner volume of the specimen as homogeneously as possible. This fixes the bulk density of the fiber blend. For this density, the static airflow resistivity is measured with Equation 9. The measurement procedure is repeated for different compactions in the range
with K1 = 924 580 Nsm-4 and K2 = 2.005 obtained from a simplex search method (function fminsearch in Matlab R2012b) with a coefficient of determination 0.9961. Using Equation 7, the previous relation can be rewritten as
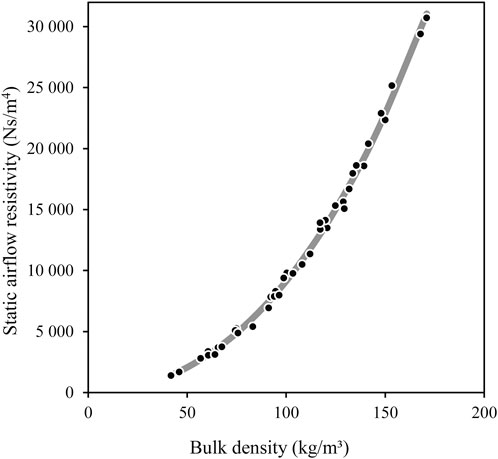
Figure 5. Static airflow resistivity versus the bulk density of the fiber blend. The dots are the measured data and the line is the power law regression with a coefficient of regression of 0.9961.
3.6 Viscous
The viscous and thermal characteristic lengths are two parameters used to accurately model the high-frequency viscous and thermal dissipations of sound waves in open-cell porous materials. The preferred measuring methods for these two parameters are based on ultrasound measurements (Leclaire et al., 1996). In this work, an inverse method using software Foam-X was chosen instead (Atalla and Panneton, 2005; ESI Group, 2024). This is due to the difficulty of having nicely shaped specimens for ultrasound measurements. The inverse method is based on impedance tube measurements. Typically, constrained by the physics of the sound propagation in porous media, the method iteratively searches the unknown parameters of a precursor acoustic model. The precursor model is the JCA model discussed in the Theory section. For a given 50-mm thick compacted RNF blend of bulk density
Based on this procedure, several blends of different bulk densities were tested and their characteristic lengths were identified. The results are presented in Figure 6. Compared to static airflow resistivity measurements, the correlation between bulk density and characteristic lengths is lower. This shows the sensitivity of the inverse method to measurement errors of all input parameters (bulk density, open porosity, resistivity, absorption coefficient, thickness, precursor model). However, the correlation is clearly sufficient to propose an empirical model to relate the characteristic lengths to bulk density. Based on the work by Allard and Champoux (1992), when the interaction between fibers can be neglected (i.e., diluted fiber media where the distance between fibers is large compared to the fiber diameters), the following relationships hold for a diluted fiber perpendicular to the flow:
where l is the length of fiber per unit volume of the fibrous aggregate. One recognizes that
This indicates that the characteristic lengths are inversely proportional to the bulk density. Obviously, at high compaction levels, the diluted medium assumption may not hold anymore for the studied RNF blend, and one can assume that the condition on the characteristic lengths would be
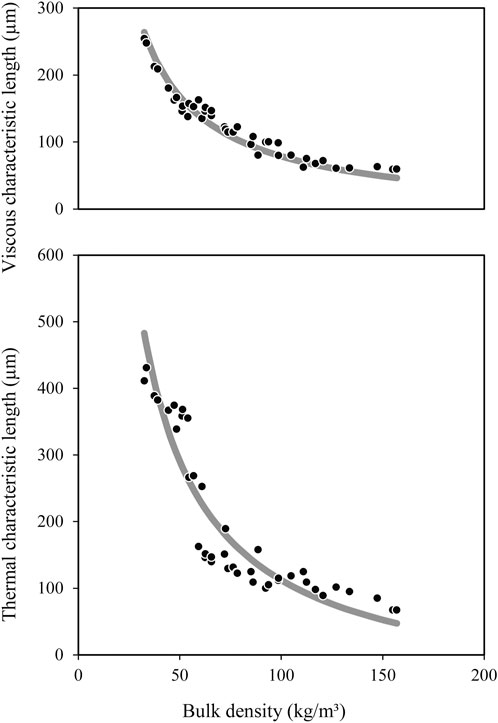
Figure 6. Viscous characteristic length (top) and thermal characteristic length (bottom) versus the bulk density of the fiber blend. The dots are the measured data and the lines are the curve fit models with coefficients of regression of 0.9158 and 0.8117, respectively.
Following Equation 13 and the previous discussion, inverse relationships between the characteristic lengths and the bulk density can be found by a constrained minimization process with constraint
with coefficients of regression of 0.9158 and 0.8117, respectively. At high values of the density ratio
3.7 Tortuosity
Tortuosity is a parameter that indicates how the path of a sound wave in the porous medium deviates from a straight path. If the path is straight,
The preferred method for measuring tortuosity is based on ultrasound techniques (Allard et al., 1994).24 However, as discussed for the characteristic lengths, the inverse method was used to identify the tortuosity of the RNF blend at different compaction levels. The results are shown in Figure 7. One can note two different behaviors in function of the bulk density. Up to a value of 88 kg/m3; corresponding approximately to a porosity of 0.92, the RNF blend can be considered as diluted in terms of tortuosity since
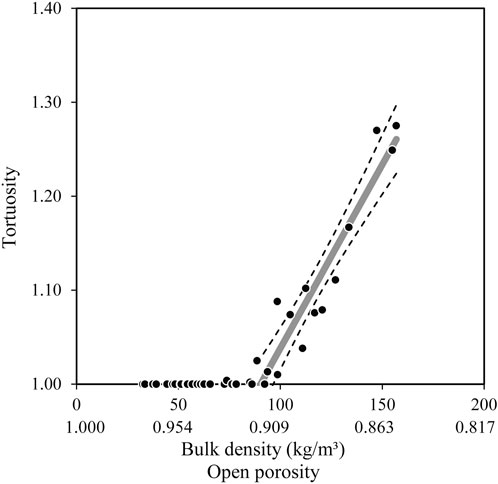
Figure 7. Tortuosity versus the bulk density (and corresponding open porosity) of the fiber blend. The dots are the measured data and the line is the curve fit model with coefficient of regression of 0.8952.
4 Semi-empirical model
The empirical relationships between the macroscopic parameters of the RNF blend and its bulk density developed in the previous section are valid for the studied range of RNF fiber blends. These empirical relationships (Equations 8, 10, 14–16) can be substituted into the JCA equivalent fluid model (Equations 2–4) to form a semi-empirical model. Doing so, the sound absorption coefficient, Equation 5, now depends on the frequency, the thickness, and bulk density of the NCF blend only:
To validate this semi-empirical model, three RNF blends of 30, 120 and 180 kg/m3; are assembled and tested in the acoustical impedance tube described above. Validations are made for 50-mm thick samples. Note that densities 30 and 180 kg/m3; are at the bounds of the range on which the empirical relationships were built. This will test the robustness of the model at its low and high limits. The sound absorption measurements are compared to the predictions obtained with the developed semi-empirical model in Figure 8. Three measurements are done for each density. Good correlations are obtained between the measurements and the predictions of the developed semi-empirical model.
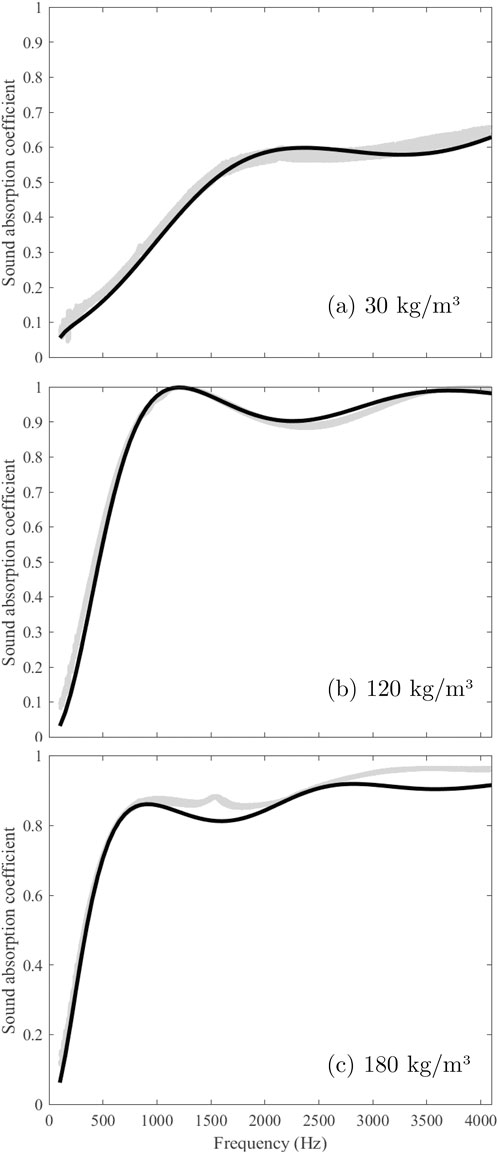
Figure 8. Sound absorption coefficient of three 50-mm thick RNF blend compactions: (A) 30 kg/m3, (B) 120 kg/m3, and (C) 180 kg/m3. The black lines are the model predictions, and the gray areas show the dispersion of the measurements on three different specimens of the same compaction.
5 Optimization procedure
From a noise control point of view, it is always desirable to have a simple solution that is tailored to a given problem. A design engineer would like to know the thickness to use for a given material to reach maximum sound absorption at a given frequency when it is backed by a hard wall. Alternatively, he could want to know the material to use for a fixed thickness to reach maximum absorption at a given frequency. To answer these questions, the engineer needs to test (or simulate when possible) different thicknesses, hoping to find the desired optimal solution. This process is lengthy and may yield no optimal results.
Another optimization process would be to adjust the 5 material parameters to reach a given objective. Such an approach is not realistic because the solution found could not make sense physically. In fact, all the parameters of the material are related to its microstructure. Apart from using a microstructural model and sophisticated simulation tools (Perrot et al., 2008; Tran et al., 2024b), one needs to perform a systematic study on the relationship between sound absorption and the material properties. In the past, some optimization studies on fibrous absorbers have been done. Shoshani and Yakubov (2000) made a numerical investigation to obtain optimal parameters for a sound-absorbing fiber web in terms of thickness, porosity, density and coupling parameter (function of resistivity). Their analysis did not take into account for the fact that the material parameters are linked together in a blend (e.g.,: porosity does not vary independently from resistivity, nor density). While their study gives interesting insights, it cannot be systematically applied in a real situation. More recently, Yang et al. (2011) investigated experimentally the effects of the bulk density on the sound-absorbing behavior of a fiber assembly at different compaction levels using a similar setup as the one used in Figure 3. They noticed that there exists an optimum density at which the sound absorption passes through a maximum at a so-called critical frequency. Nevertheless, they did not make a systematic optimization study to link the critical frequency and optimum density to the material properties and thickness. However, such a systematic study had already been made by Mechel (1988) to obtain design charts for fibrous sound absorbers. Based on a one-parameter equivalent fluid empirical model (here the parameter was resistivity), he observed that the sound absorption coefficient is governed by two non-dimensional parameters:
For the RNF blend under study, the developed semi-empirical model may be used to find the optimal parameters that will maximize the sound absorption of the blend when backed by a hard wall. This is possible since the only material parameter of the model is the bulk density. Once the optimal bulk density is found, the fiber blend is fully determined; there is no need to directly know what the 5 macroscopic parameters are. Consequently, the optimization process could be posed by one of the following expressions:
where
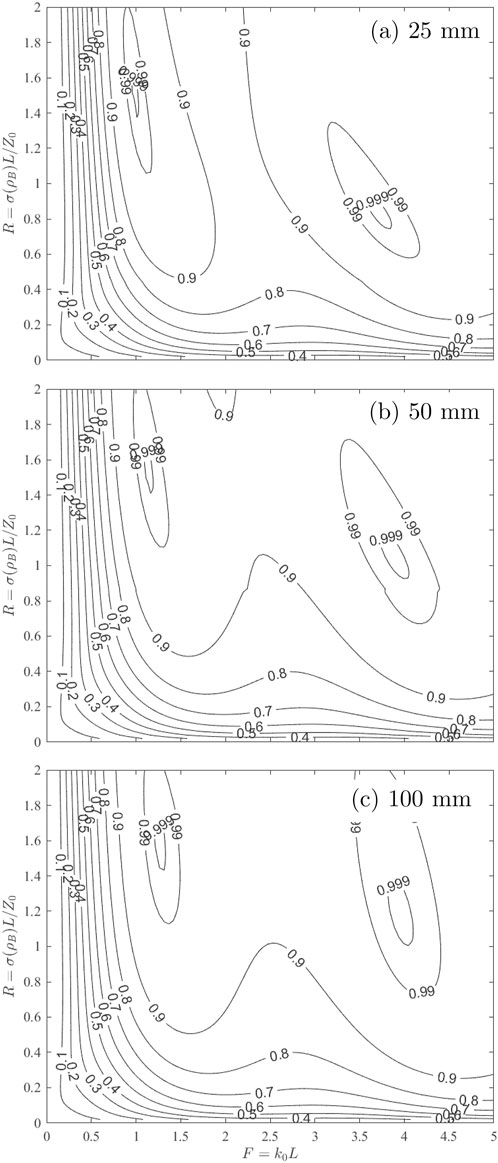
Figure 9. Sound absorption charts as a function of the two non-dimensional parameters R and F for different thicknesses of the RNF blend: (A) 25, (B) 50, and (C) 100 mm.
For each chart in Figure 9, one notes that more than one maximum exists. The first maximum occurs at the so-called critical frequency f1 For this frequency, one can clearly determine the optimal non-dimensional parameters R and F. One can note that the optimal value for R is slightly influenced by the thickness. For the three thicknesses, its optimal values are 1.47, 1.57 and 1.57, respectively. For a thickness of 50 mm and Z0 = 414 Nsm-3, this yields an optimal resistivity of 12 986 Nsm-4 or, using Equation 10, an optimal bulk density of 116 kg/m3;. As for the non-dimensional parameter F, one can note that its optimal value increases with the thickness. For 25, 50, and 100 mm, the optimal values of F are 1.00, 1.12 and 1.27, respectively. For a thickness of 50 mm and c0 = 343 m/s, this yields an optimal frequency of 1,224 Hz. As demonstrated, the charts in Figure 9 can be used to quickly identify a configuration yielding maximum absorption. However, if the thickness has to be fixed to a value not given in Figure 9, one needs to interpolate.
Another, more straightforward, approach is to identify relationships between the bulk density, the thickness and the critical frequency at which the first maximum of sound absorption occurs. To proceed this way, one can obtain the sound absorption coefficient for a range of admissible bulk densities and thicknesses on which the empirical relations were built in the previous section. Here, the sound absorption coefficient
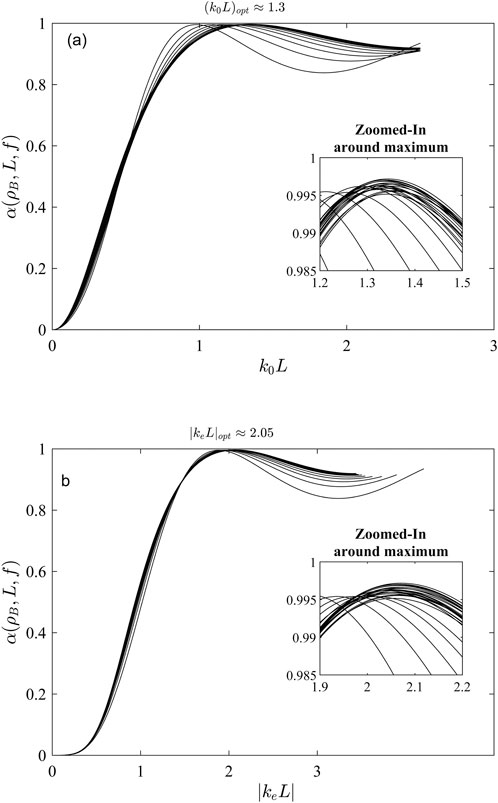
Figure 10. Normal incidence hard backed sound absorption coefficient of the RNF blend in function of non-dimensional parameter (A) k0L (top) and (B) |
The identified optimal value
where A is the amplitude of the pressure wave in the material,
From the previous simulations and discussions, it is clear that a relationship exists between
with
with
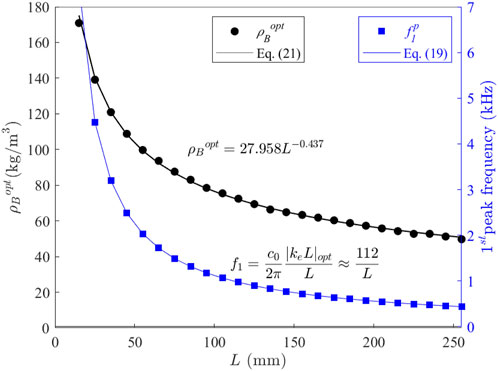
Figure 11. Optimal bulk density
6 Application of the optimization procedure
In the following, Equations 19–21 will be used to find the optimal RNF blend for different sound absorber design objectives.
6.1 Find optimal configuration for maximum absorption at 500 Hz
To find this optimal configuration for
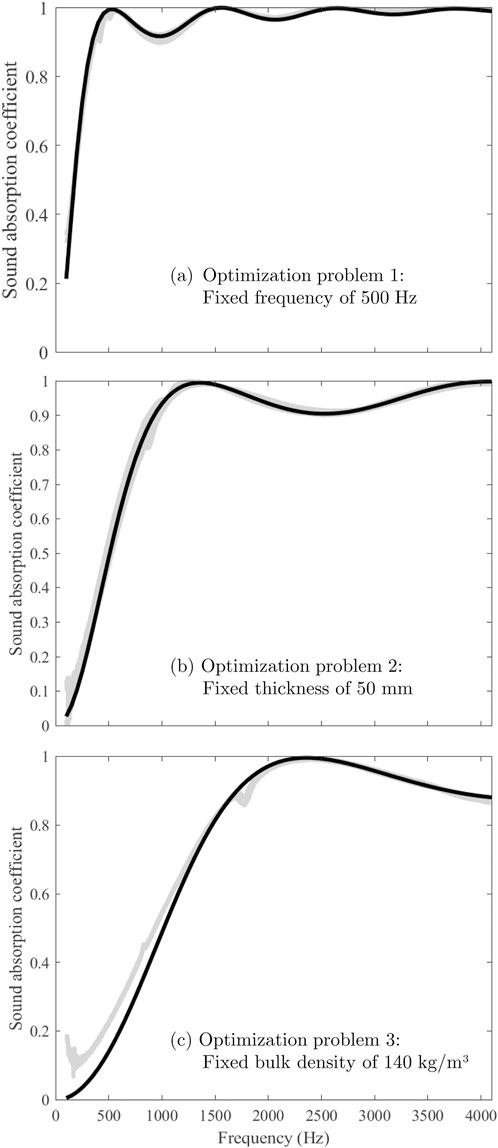
Figure 12. Normal incidence hard backed sound absorption coefficient. (A) Optimization problem 1 with fixed frequency of 500 Hz; (B) Optimization problem 2, with fixed thickness of 50 mm; (C) Optimization problem 3, with fixed bulk density of 140 kg/m3. The black lines are the model predictions, and the gray areas show the dispersion of the measurements on three different specimens of the same compaction.
6.2 Find optimal bulk density for a thickness of 50 mm
To find this configuration, Equation 21 is first used to find the optimal bulk density; this yields
6.3 Find optimal thickness for an optimal density of 140 kg/m3
To find this configuration, Equation 21 is first used to find the thickness; this yields L = 25 mm. Then, Equations 19, 20 are used to obtain the frequency of the first peak in the air domain; this yields
7 Conclusion
In this paper, a semi-empirical model was derived to predict the normal incidence sound absorption coefficient of a Recycled Nylon Fiber (RNF) blend. The semi-empirical model is based on the general five-parameter Johnson-Champoux-Allard (JCA) for porous materials in which the five parameters (i.e., open porosity, airflow resistivity, tortuosity, viscous and thermal characteristic lengths) are replaced by characterized empirical relationships expressed in terms of the bulk density of the blend only. From this semi-empirical model, sound absorption charts were built to help design optimized RNF absorbers. A more systematic design procedure based on equations was also worked out. The procedure allows for a quick determination of the optimal parameters of a mixture to achieve maximum absorption. Three design problems were addressed and validated by experiments 1) to determine the optimal thickness and bulk density to reach maximum absorption at a given frequency, 2) to find the optimal density for a given thickness, and 3) to find the optimal thickness for a given bulk density. While the optimization procedure was developed for RNF absorbers, a similar procedure could be developed for any other fibrous-like sound absorbers. More specifically, the proposed method could be applied to cotton felts which have smaller fiber diameters and are often used in the automotive industry. This could be a simpler way to optimize these felts for sound absorption compared to a complex multi-scale analysis as done elsewhere (Tran et al., 2024b).
Data availability statement
The raw data supporting the conclusions of this article will be made available by the authors, without undue reservation.
Author contributions
JB: Conceptualization, Data curation, Formal Analysis, Investigation, Methodology, Validation, Visualization, Writing–original draft, Writing–review and editing. SE: Conceptualization, Formal Analysis, Methodology, Resources, Supervision, Writing–original draft. RP: Conceptualization, Formal Analysis, Funding acquisition, Methodology, Project administration, Resources, Software, Supervision, Visualization, Writing–original draft, Writing–review and editing.
Funding
The author(s) declare that financial support was received for the research, authorship, and/or publication of this article. The authors acknowledge the financial support of Natural Sciences and Engineering Research Council (NSERC) [funding reference numbers: RGPIN-2018–06113 and RGPIN-2019–06573]. We also extend our gratitude to RECYC-QUÉBEC for awarding a scholarship to Julien Biboud for his master’s research.
Acknowledgments
The authors thank Leigh Textile and Jasztex for providing materials.
Conflict of interest
Author JB was employed by Mecanum Inc.
The remaining authors declare that the research was conducted in the absence of any commercial or financial relationships that could be construed as a potential conflict of interest.
Publisher’s note
All claims expressed in this article are solely those of the authors and do not necessarily represent those of their affiliated organizations, or those of the publisher, the editors and the reviewers. Any product that may be evaluated in this article, or claim that may be made by its manufacturer, is not guaranteed or endorsed by the publisher.
References
Allard, J., and Atalla, N. (2009). Propagation of sound in porous media: modelling sound absorbing materials. John Wiley & Sons.
Allard, J. F., Castagnede, B., Henry, M., and Lauriks, W. (1994). Evaluation of tortuosity in acoustic porous materials saturated by air. Rev. Sci. Instrum. 65, 754–755. doi:10.1063/1.1145097
Allard, J.-F., and Champoux, Y. (1992). New empirical equations for sound propagation in rigid frame fibrous materials. J. Acoust. Soc. Am. 91, 3346–3353. doi:10.1121/1.402824
Asdrubali, F. (2006). Survey on the acoustical properties of new sustainable materials for noise control. Proc. Euronoise Eur. Acoust. Assoc. Tampere 30, 1–10.
Atalla, Y., and Panneton, R. (2005). Inverse acoustical characterization of open cell porous media using impedance tube measurements. Can. Acoust. 33, 11–24.
Bies, D., and Hansen, C. H. (1980). Flow resistance information for acoustical design. Appl. Acoust. 13, 357–391. doi:10.1016/0003-682x(80)90002-x
D’Alessandro, F., and Pispola, G. (2005). Sound absorption properties of sustainable fibrous materials in an enhanced reverberation room. INTER-NOISE NOISE-CON Congr. Conf. Proc. Inst. Noise Control Eng. 2005, 2209–2218.
Delany, M. E., and Bazley, E. (1970). Acoustical properties of fibrous absorbent materials. Appl. Acoust. 3, 105–116. doi:10.1016/0003-682x(70)90031-9
Del Rey, R., Alba, J., Ramis, J., and Sanchís, V. (2011). Nuevos materiales absorbentes acústicos obtenidos a partir de restos de botellas de plástico. Mater. construcción 61, 547–558. doi:10.3989/mc.2011.59610
Desarnaulds, V., Costanzo, E., Carvalho, A., and Arlaud, B. (2005). “Sustainability of acoustic materials and acoustic characterization of sustainable materials,” in Proceedings of the 12th international congress on sound and vibration.
ESI Group (2024). FOAM-X software. Standalone utility for characterizing the Biot properties of open-cell porous materials based on impedance tube measurements. Software.
ISO 10534-2:2023 (2023). Acoustics — determination of acoustic properties in impedance tubes—Part 2: two-microphone technique for normal sound absorption coefficient and normal surface impedance. Standard: International Organization for Standardization.
ISO 9053-2:2020 (2020). Acoustics — determination of airflow resistance—Part 2: alternating airflow method. Standard: International Organization for Standardization.
Kosuge, K., Takayasu, A., and Hori, T. (2005). Recyclable flame retardant nonwoven for sound absorption; RUBA®. J. Mater. Sci. 40, 5399–5405. doi:10.1007/s10853-005-4338-9
Langley, K. D., Kim, Y. K., and Lewis, A. F. (2000). Recycl. reuse mixed-fiber Fabr. remnants:spandex, cotton & Polyest. UMass Lowell, Chelsea Cent. Recycl. Econ. Dev.
Leclaire, P., Kelders, L., Lauriks, W., Melon, M., Brown, N., and Castagnede, B. (1996). Determination of the viscous and thermal characteristic lengths of plastic foams by ultrasonic measurements in helium and air. J. Appl. Phys. 80, 2009–2012. doi:10.1063/1.363817
Lee, Y., and Joo, C. (2003). Sound absorption properties of recycled polyester fibrous assembly absorbers. AUTEX Res. J. 3, 78–84. doi:10.1515/aut-2003-030205
Lei, L., Dauchez, N., and Chazot, J. (2018). Prediction of the six parameters of an equivalent fluid model for thermocompressed glass wools and melamine foam. Appl. Acoust. 139, 44–56. doi:10.1016/j.apacoust.2018.04.010
Lorenzana, M. T., Dafonte, P., Rilo, E., Cabeza, O., and González, J. (2002). “Absorbent characteristics of materials obtained from industrial wastes,” in Proc. Of forum acusticum, seville, Spain.
Luu, H. T., Perrot, C., and Panneton, R. (2017). Influence of porosity, fiber radius and fiber orientation on the transport and acoustic properties of random fiber structures. ACTA Acustica united Acustica 103, 1050–1063. doi:10.3813/aaa.919134
Maderuelo-Sanz, R., Nadal-Gisbert, A. V., Crespo-Amorós, J. E., and Parres-García, F. (2012). A novel sound absorber with recycled fibers coming from end of life tires (elts). Appl. Acoust. 73, 402–408. doi:10.1016/j.apacoust.2011.12.001
Manning, J., and Panneton, R. (2013). Acoustical model for shoddy-based fiber sound absorbers. Text. Res. J. 83, 1356–1370. doi:10.1177/0040517512470196
Mechel, F. (1988). Design charts for sound absorber layers. J. Acoust. Soc. Am. 83, 1002–1013. doi:10.1121/1.396045
Panneton, R. (2007). Comments on the limp frame equivalent fluid model for porous media. J. Acoust. Soc. Am. 122, EL217–EL222. doi:10.1121/1.2800895
Perrot, C., Chevillotte, F., and Panneton, R. (2008). Bottom-up approach for microstructure optimization of sound absorbing materials. J. Acoust. Soc. Am. 124, 940–948. doi:10.1121/1.2945115
Piégay, C., Glé, P., Gourlay, E., Gourdon, E., and Marceau, S. (2021). A self-consistent approach for the acoustical modeling of vegetal wools. J. Sound Vib. 495, 115911. doi:10.1016/j.jsv.2020.115911
Pompoli, F., and Bonfiglio, P. (2020). Definition of analytical models of non-acoustical parameters for randomly-assembled symmetric and asymmetric radii distribution in parallel fiber structures. Appl. Acoust. 159, 107091. doi:10.1016/j.apacoust.2019.107091
Salissou, Y., and Panneton, R. (2007). Pressure/mass method to measure open porosity of porous solids. J. Appl. Phys. 101. doi:10.1063/1.2749486
Santoni, A., Bonfiglio, P., Fausti, P., Marescotti, C., Mazzanti, V., Mollica, F., et al. (2019). Improving the sound absorption performance of sustainable thermal insulation materials: natural hemp fibres. Appl. Acoust. 150, 279–289. doi:10.1016/j.apacoust.2019.02.022
Shoshani, Y., and Yakubov, Y. (2000). Numerical assessment of maximal absorption coefficients for nonwoven fiberwebs. Appl. Acoust. 59, 77–87. doi:10.1016/s0003-682x(99)00015-8
Tran, Q. V., Perrot, C., Panneton, R., Hoang, M. T., Dejaeger, L., Marcel, V., et al. (2024a). Effect of polydispersity on the transport and sound absorbing properties of three-dimensional random fibrous structures. Int. J. Solids Struct. 296, 112840. doi:10.1016/j.ijsolstr.2024.112840
Tran, Q. V., Perrot, C., Panneton, R., Hoang, M. T., Dejaeger, L., Marcel, V., et al. (2024b). Utilizing polydispersity in three-dimensional random fibrous based sound absorbing materials. Mater. Des. 247, 113375. doi:10.1016/j.matdes.2024.113375
Keywords: sound absorption, optimization, recycled fibers, nonwoven, fibrous, bulk density
Citation: Biboud J, Elkoun S and Panneton R (2024) Optimization of sound absorption of recycled Nylon fibrous materials. Front. Acoust. 2:1478414. doi: 10.3389/facou.2024.1478414
Received: 09 August 2024; Accepted: 23 October 2024;
Published: 08 November 2024.
Edited by:
Andrea Santoni, University of Ferrara, ItalyReviewed by:
Antonio Petošić, University of Zagreb, CroatiaArnaud Duval, Treves Product Services & Innovation, France
Walid Larbi, Conservatoire National des Arts et Métiers (CNAM), France
Copyright © 2024 Biboud, Elkoun and Panneton. This is an open-access article distributed under the terms of the Creative Commons Attribution License (CC BY). The use, distribution or reproduction in other forums is permitted, provided the original author(s) and the copyright owner(s) are credited and that the original publication in this journal is cited, in accordance with accepted academic practice. No use, distribution or reproduction is permitted which does not comply with these terms.
*Correspondence: Julien Biboud, anVsaWVuLmJpYm91ZEBtZWNhbnVtLmNvbQ==
 Julien Biboud
 Saïd Elkoun1
 Raymond Panneton