
95% of researchers rate our articles as excellent or good
Learn more about the work of our research integrity team to safeguard the quality of each article we publish.
Find out more
ORIGINAL RESEARCH article
Front. Acoust. , 08 July 2024
Sec. Acoustic Materials, Noise Control and Sound Perception
Volume 2 - 2024 | https://doi.org/10.3389/facou.2024.1423168
This article is part of the Research Topic Perception-driven Acoustic Engineering View all articles
The evaluation of a soundscape is a challenging task as the object of study is not a stationary event of sensation but rather a dynamic and complex scene stretching over a specific period. To do justice to the time dimension in such acoustic scenes, we utilized the Continuous Evaluation Procedure (CEP). Extending common standard instruments asking participants for a singular integral at the end of the sound experience (e.g., on a rating scale), the participants in this study were enabled to continuously evaluate the evolving acoustic scene of accelerating electrified vehicles (EVs) using CEP. With the increasing electrification of powertrains in the automotive industry, acoustic engineers face the challenge of defining innovative sounds using the availabilities of now low-noise emission platforms of EVs that deviate in their noise profiles from familiar but technologically outdated internal combustion engine vehicles (ICEVs), which have defined the general sound schemes for more than a century. To capture dynamic aspects in the quality perception of powertrain noise in EVs, we asked 37 participants to evaluate acoustic recordings of different vehicles in varying acceleration modes in a high-quality three-dimensional (3D) acoustic simulator. Thereby, we revealed much more detailed and time-dependent quality aspects, which do not come forth in an integral singular measure (ISM) where all impressions experienced during the ongoing acoustic scene are blended together. We, therefore, propagate the systematic application of the CEP method when it comes to the qualitative evaluation of transient acoustic scenes. CEP opens the great opportunity to unfold, detect, and analyze dynamic effects in soundscapes and noise profiles, but of any kind of acoustic signal.
Evaluating acoustic scenes, soundscapes and noise profiles poses a great challenge regarding a research study’s design. Compared to stationary stimuli (or constant noise), where properties remain stable over time or the acoustic event is of very brief nature, a soundscape is composed of varying or multiple acoustic properties. Such acoustic stimuli derived from dynamic or environmental scenes, which are per definition of non-stationary sensory quality, show temporal expansion as their acoustic properties develop over time. For example, a piece of music can start off slow and quiet, contain repetitive, monotonous, or disruptive elements, climax in one part of its composition and might fade out slowly or end abruptly. Due to the complex, dynamic and probably even interactive qualities, such acoustic scenes cannot be described adequately by a singular value, as for example, by rating on a Likert scale. Especially for novel soundscapes to which we have only had a few exposures so far, our rating might turn out more volatile as compared to familiar concepts. In the context of automotive acoustics, a vehicle’s acceleration process can be considered as an acoustic scene, which makes its evaluation a challenging task. Unlike relatively stationary sounds, for example, the click of a button, powertrain noise is a non-stationary sensory event of complex nature unfolding across the acceleration process. The rising and load-dependent sound pressure level in a conventional vehicle’s acceleration process is familiar and accepted (see for example, Krishna, 2021 or Clendinning, 2018). Moreover, the noise profiles, naturally generated through the technical conditions of the combustion engine, formed our expectations regarding how a vehicle’s acceleration should sound. Over decades, it strengthened the association between a load-dependent, growling engine noise and the assumed vehicle’s power and is now hard to resolve in the customers’ minds (Cerrato, 2009; Borg, 2014; Clendinning, 2018). With the increasing electrification of powertrain systems in the industry, the question among acoustic engineers arises as to what constitutes a high-quality yet pleasing and sportive acoustic profile for electrified vehicles (EVs). Münder and Carbon (2022) found a significant negative correlation (τ = − 32, p < 0.001) between the perceptibility and qualitative impression of e-powertrain noise. As some participants claimed difficulties in evaluating the transient acoustic scenes—different acceleration scenarios (Münder and Carbon, 2022)—we employed a more sophisticated measurement technique in the present study. This time, we provided a tool that is easy to use and where participants can continuously assess the quality of a dynamically evolving stimulus. With single-value ratings, for example, on a Likert scale, noise characteristics, such as frequency peaks at the beginning or end of the scene, are blended into the rated integral. This potentially leads to specific distinctive properties overwriting the rest or parts of the unfolding signal’s impression. The ratings of different stimuli lose their distinctiveness and do not allow causal interpretation of the specific, time-dependent factors that might have influenced the resulting evaluation. Yet, designers must understand those temporal and causal dynamics that might result in an overall appreciation. By applying the Continuous Evaluation Procedure (CEP) of Muth et al. (2015) we take a closer look at the dynamic effects while participants experience the evolvement of e-powertrain noises. In the present study, we will focus on the evaluation dimensions of Perceived Quality and Perceived Annoyance in e-powertrain noise from EVs in typical acceleration scenarios.
The various (vibro-)acoustic characteristics of vehicles can be subsumed under Noise, Vibration and Harshness (NVH). Compared to vehicles with internal combustion engines (ICEVs, i.e., internal combustion engine vehicles), electrified vehicles (EVs) show a radically different NVH profile (Zeller, 2018; Eisele et al., 2019). For EVs, the vehicle’s powertrain system, as a main NVH phenomena contributor (Qatu, 2012), plays an integral part in the developmental process of vehicle acoustics. Not only do EVs have a significantly lower overall sound pressure level (SPL) (Zeller, 2018; Blickensdorff et al., 2019), but the noise spectrum also deviates drastically from the familiar ICEV broadband noise and ranges in higher frequencies, with tonal components for which the human ear is particularly sensitive (Blickensdorff et al., 2019; Gavric, 2020). Additionally, there are several studies investigating e-powertrain noise and its high-frequent and tonal acoustic profile, suggesting EVs to be perceived as more annoying and less pleasant potentially (Lennström et al., 2013; Lennström and Nykänen, 2015; Swart et al., 2016; Devillers et al., 2020).
In the field of acoustics, there are various definitions regarding sound quality. Only a few definitions address the subjective component of quality perception: aside from the mere physical signal, there needs to be a recipient that perceives and evaluates the sound. The definition of Genuit (1996) considers 1) the physical sound (sound field), as well as 2) psychoacoustics (auditory perception), and 3) psychological aspects (auditory evaluation) as influential factors that compose sound quality. From a perceptional science perspective, the third factor—the auditory evaluation—plays a vital role, as it comprises more than the simple physical sound signal and the biological mechanisms of the human hearing apparatus, such as situational, cognitive, and affective factors (Blauert, 1986; Zeitler, 2007). Stylidis et al. (2015) emphasized the importance of perceived quality for the automotive industry and defined it as a set of value-based perceived quality (VPQ) and technical perceived quality (TPQ). The VPQ thereby includes external factors, customer behavior, branding and core values of the product. In contrast, the TPQ holds physical properties of the given object in different modalities that, among other things, define sound quality as a part of the TPQ (Stylidis et al., 2015). As the mentioned definitions refer to aspects of the overall auditory experience by a recipient, we prefer the term perceived quality to sound quality. The term perceived quality builds onto a holistic concept, while sound quality is often confounded with the mere physical properties of an acoustic event, ignoring the psychological aspects mentioned above. Genuit (2010), moreover, describes different product properties, such as acoustic characteristics that contribute to an overall object-related quality impression. This means the qualitive impression conveyed by acoustic characteristics of a vehicle—in this study, the e-powertrain noise in an acceleration scenario—only depicts parts of an overall experience. Though acoustic properties such as emitted e-powertrain noise are only one of the manifold factors contributing to the overall product experience, their influence is not to be underrated when considering the holistic vehicle experience. Further aspects to be considered in subjective evaluation of acoustic scenes, such as e-powertrain noise from vehicle run-ups, are the customer’s expectations according to the represented driving scenario: in full acceleration scenarios, for example, a louder vehicle feedback is expected (Münder and Carbon, 2022).
Building a bridge to visual perception science, Muth et al. (2015) revealed dynamic effects when employing Continuous Evaluation Procedure (CEP) in the domain of art perception. Applying the CEP facilitates assessing a stream of experience with a high temporal resolution across the whole time slice rather than demanding an instant single assessment (Muth et al., 2015). Muth and Carbon (2013) and van de Cruys and Wagemans (2011) report dynamic effects in regards to pleasurableness or liking found in transitioning from a state of uncertainty to a state of understanding the visual percept as coherent—so to say, a Gestalt. As many factors can influence someone’s evaluation, such as the context (Jakesch et al., 2011), repeated exposure to certain objects or entities (Zajonc, 1968; Bornstein, 1989), or the fluency of perception (Albrecht and Carbon, 2014), it is worth to consider different evaluation methods to gain a profound understanding of how a product is perceived. Therefore, especially in evaluating transient stimuli, it is worthwhile to consider methods with higher temporal resolution to investigate how a product is perceived and experienced, in addition to one-time singular assessments. Moreover, time-dependent effects such as primacy and recency must be considered, as they can color the subjective impression.
The aim of the present study was to shed light on the evaluation process of non-stationary e-powertrain noise scenes itself and capture dynamic effects. Particularly, we wanted to orient to the study of Münder and Carbon (2022), who investigated e-powertrain noise with the Repeated Evaluation Technique (RET) (Carbon and Leder, 2005), but in a more granular way. We followed a so-called Path #2 testing approach (Carbon, 2019): Path#2 means a lab-oriented but ecologically high valid test setting. We realized this by utilizing a sophisticated static acoustic simulator, creating an immersive testing environment to ensure ecological validity while maintaining experimental control. The evaluation process was based on the methodological evaluation approach of the Continuous Evaluation Procedure (CEP) developed by Muth et al. (2015).
In an a priori power analysis for repeated measures ANOVA through G*Power (Faul et al., 2007), we calculated the required sample size to be N ≥ 34 participants, aiming at an error probability of α = 0.05 and statistical power (1–β) of 0.80, assuming a medium effect size. The required sample size was reached, as a final sample of thirty-seven participants (N = 37) took part in this study. The sample was recruited via electronic platforms (mostly email) across different departments of the BMW Group, including the specialist department for acoustics and vibrations. Participation was not compensated and not restricted other than having normal hearing ability. The conduction of the study followed the principles of the Declaration of Helsinki, as well as the ethical principles of the Association of German Professional Psychologists (BDP) and the German Psychological Society (DGPs). Participants had the right to abort the study at any time without giving reasons and to withdraw their data without any consequences. Prior to the experimental testing, the purpose of the study was disclosed to each participant and written consent had to be given to take part in the study. The average age was M = 35.1 years (SD = 11.28; min = 20; max = 60 years); 86% of the participants (n = 32) were male. Overall, 59% (n = 22) of the sample work in the specialist department of acoustics and vibrations, with 16% (n = 6) even specifically working on matters of e-powertrain noise. For their hearing ability, self-reported on a five-point Likert scale (a value of 1 representing very bad hearing and a value of 5 = very good hearing), normal hearing among the participants can be assumed (M = 3.49, SD = 0.69, min = 2, max = 5).
Prior to the testing, we recorded the driving noise of eleven different EVs from various manufacturers on a BMW Group test track with 3D ambisonics recording equipment (Ambeo VR Mic array from Sennheiser with four channels and first-order ambisonics qualities) that is known to create immersive hearing experiences (see Sadia and Carbon, 2023). The microphone array was placed between the two car seats in each vehicle’s front row in a standardized vertical position, comparable to where the ears of car passengers would be. Among the vehicles, there were nine battery electric vehicles (BEVs) and two hybrid electric vehicles (HEVs; operated in electric driving mode only) from different manufacturers spreading across the whole price segment. The recording procedure followed a standardized measurement protocol for three different driving scenarios and was performed by trained professionals: a slow acceleration (0.5 m/s2), a comfortable acceleration (2.5 m/s2), and full acceleration (maximum performance of the respective vehicle; acceleration from 0 to 100 km/h (i.e., 0–28 m/s) ranged from 4.9 s to 10.5 s among the tested EVs in this scenario). While the measurements were conducted, no other driving activities were performed on adjoining test tracks and all measurements were performed on the same test track section which had smooth asphalt. The gathered 3D audio data was then rendered to a suitable format to be replayed in the acoustic simulator. Due to various factors, such as distinctive bird chattering or disturbing noise from loose objects in the vehicles that we found on some of the recordings, not all eleven vehicles were presented in every acceleration scenario. Recordings with such distinctive disturbing noises were excluded from the stimulus set as they could possibly distract the focus from the sole driving noise and the actual evaluation task. In the end, we selected six stimuli for each acceleration scenario with ensured high recording quality.
By utilizing a sophisticated static acoustic simulator, we were able to realistically reproduce the 3D recordings of the driving scenarios. This was realized through the method of wave field synthesis combined with a six-layer 3D audio system of over 150 loudspeakers in the experimental environment, thus maintaining a high degree of ecological validity. Moreover, the set-up provides realistic context information as the simulator is built out of a complete vehicle, physically seating the participant in the driver’s seat of a vehicle cabin. Visuals of a generic roadside environment were projected onto the side windows and the windshield of the simulator to further enhance the immersive impression. To capture a continuous stream of the participant´s experience, we applied the Continuous Evaluation Procedure (CEP; see Muth et al., 2015) by substituting the simulator vehicle’s gear shift in the middle console with a slider bar (100 mm movement range, raw value output range from 74 to 1023; the current value was constantly processed by an ATMEGA processor and sent, using an FTDI serial-to-USB interface; for the specific implementation in the simulator, see. Figure 1). This way, participants were able to continuously adjust their evaluation over time in an ergonomic way while experiencing the transient acoustic scene of an EV acceleration process. For signal processing, we implemented a Raspberry Pi and Python script.
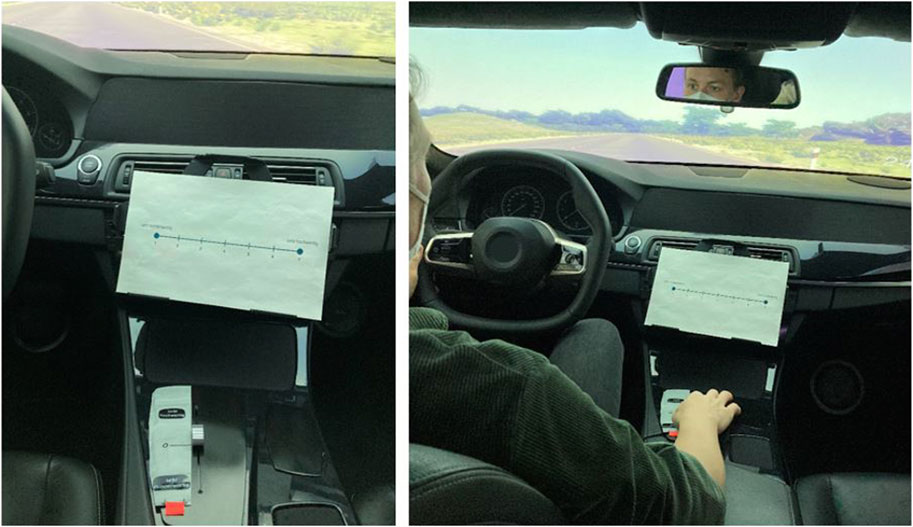
Figure 1. The implemented slider bar with labels in the middle console of the simulator vehicle and print-out of the seven-point Likert scale for the integral singular measure (ISM) evaluation on the dashboard (left picture). Demonstration of the continuous evaluation procedure (CEP) on the slider bar while active simulation of acceleration process (right picture) © by the authors. The person in the picture consented to be photographed and displayed in this manuscript.
After a short introduction about the study’s general purpose and the simulator, the participants were instructed how to execute the evaluation task. The experiment was conducted as a single testing session per participant. While the participant was seated in the driver’s seat of the simulator, the experimenter was in the control room. We ensured mediate interaction with the experimenter by providing an audio connection, but this kind of interaction was held to a bare minimum about task-related matters only. To follow the principles of scenario-based testing (Jakesch et al., 2011) and ensure external validity, each scenario was introduced to the participants before the following scenario. A total of six different stimuli in each acceleration scenario was presented in a randomized order. Each stimulus was played for a maximum of 25 s or limited by its natural length due to the respective acceleration scenario. For example, in the full acceleration scenario, most vehicles reached their maximum velocity before the 25 second end mark. In the first test block, participants evaluated the presented stimuli regarding their perceived quality impression. After all of the three acceleration scenarios had been evaluated, a second test block followed with the task to evaluate the stimuli in each acceleration scenario again, but now regarding their perceived annoyance. Each stimulus was continuously evaluated via the slider bar (CEP) while ongoing presentation of the stimulus and subsequently rated on a seven-point Likert scale (integral singular measure; ISM) before proceeding with the next stimulus. Thereby, we not only gathered continuous evaluation data, but also ISM data. This helps us to qualify further the continuous signal captured through the CEP method with the conventional integral measure of overall evaluation of such dynamic stimuli. For a better understanding, we provide the course of the experimental procedure in Figure 2.
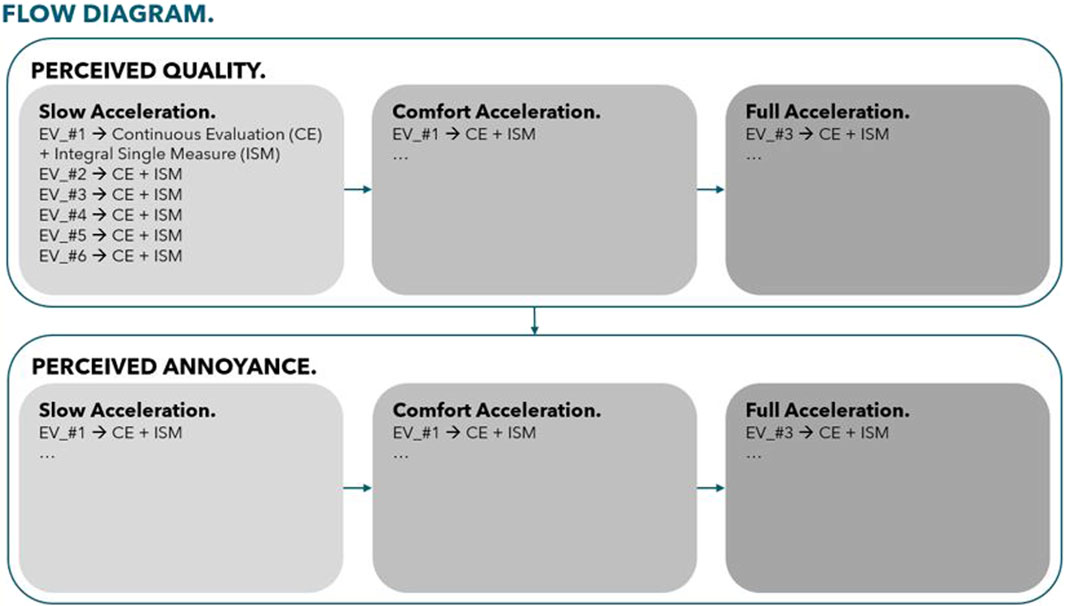
Figure 2. Flow diagram depicting the course of the experiment. In the first test block, the perceived quality of each stimulus was evaluated, in the second the perceived annoyance. In each test block, all three acceleration scenarios were presented in order of increasing acceleration, the order of the stimuli within each scenario was randomized. While presented, each stimulus was evaluated on the continuous slider (continuous evaluation; CEP) and subsequently with an integral singular measure (ISM) rating by the participants. Note that the presentation order of the stimuli in the experiment deviated from this diagram’s exemplification; not all EV recordings were selected for every acceleration scenario (see also description of 3.2 Stimuli). Also, the vehicle descriptions are encoded as the focus of this study is not a comparison of competitors but to investigate capturing dynamics in the perception of vehicle acoustics.
While a stimulus was presented, the participant’s task was continuously adjusting the slider according to their momentary experience. We did not specify any levels, e.g., on a discrete scale, so participants were fully free in using the slider range. Only the starting position of the slider, the minima and maxima for each dimension were defined: for the dimension of perceived quality the starting position for the slider was in the middle, representing an average quality impression and leaving space for higher (pulling the slider up) and lower (pulling the slider down) quality impressions. To evaluate the dimension of perceived annoyance, the participants were instructed to start at the lowest lever position possible representing a (totally) non-annoying state and leaving space to the top to indicate more annoying events over time. The exact labeling of the minima and maxima of the scales, as well as the two evaluation tasks for each stimulus, are schematically depicted in Figure 3. After each stimulus presentation, the participant was asked to return the lever to the starting position to prepare the slider bar for the following stimulus evaluation.

Figure 3. Schematic depiction of the participants’ task for evaluating the two dimensions, perceived quality, and perceived annoyance, respectively. Task A describes the continuous evaluation with the slider, and task B the numeric evaluation on a seven-point Likert scale. The scales for each evaluation range from very low to very high for the dimension of perceived quality and not annoying to very annoying for the dimension of perceived annoyance.
The distribution of the integral singular measure (ISM) ratings for each EV in each acceleration scenario is shown through the violin plots in Figure 4.
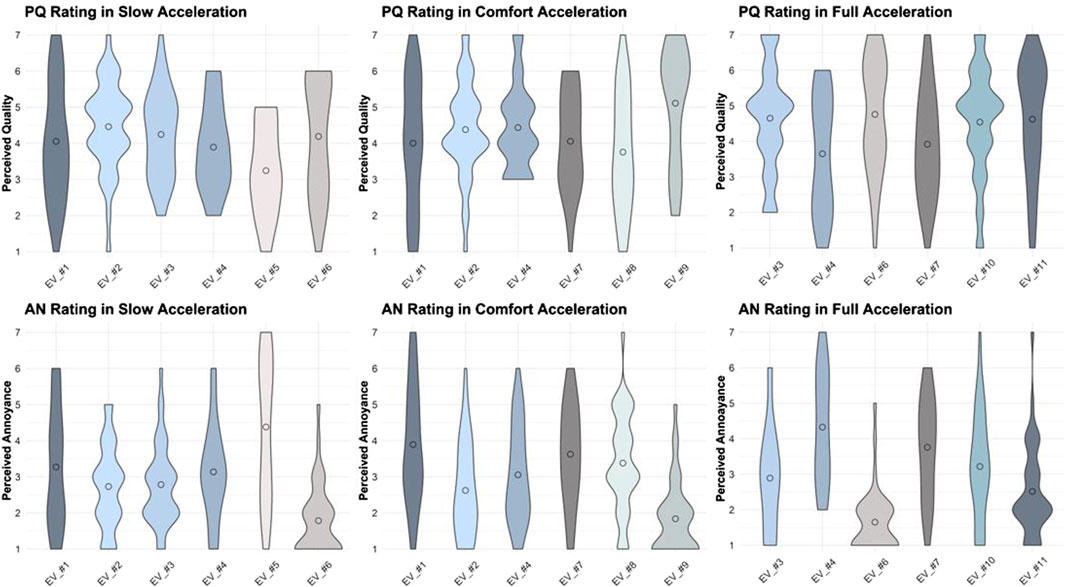
Figure 4. Violin plots depicting the data distribution of the ISM evaluation for each vehicle across all acceleration scenarios for the variables perceived quality (PQ; top row) and perceived annoyance (AN; bottom row). The circles in the graphs indicate the mean value of the ratings for each vehicle in the specific scenario. Note: Not all EV recordings are part of every acceleration scenario (see also description of 3.2 Stimuli).
The graphs show that for most stimuli, the whole span of the rating scale was used, indicating a great interindividuality in the impression of perceived quality. For a few of the stimuli, though, the ratings do not span over the whole scale, indicating that the sample agrees more with one another on the quality impression conveyed by these stimuli: for example, in the dimension of perceived quality in the scenarios of slow acceleration (SA) the stimuli of EV_#41 and EV_#5, and in comfort acceleration (CA) the stimulus of EV_#4. In the dimension of perceived annoyance, the ratings span across the whole scale for less of the stimuli, indicating a bit more consensus among the sample in this dimension. This especially applies to the stimulus of EV_#2 and EV_#6 in the scenario of slow acceleration (SA), in the CA scenario for stimulus EV_#9, and in the full acceleration (FA) for the stimulus of EV_#6. The corresponding statistic values for the ISM ratings can be found in Table 1. In the SA scenario, EV_#2 scored the highest rating in terms of perceived quality and EV_#5 in terms of perceived annoyance, while also being the stimulus perceived as the least qualitative impression. For the CA scenario, EV_#9 scored the highest on the qualitative impression and lowest on perceived annoyance. In contrast, EV_#1 was rated the most annoying in this use case. In the FA scenario, EV_#6 was rated the highest on perceived quality and lowest on perceived annoyance. In contrast, EV_#4 is rated the highest on perceived annoyance while scoring the lowest on perceived quality.
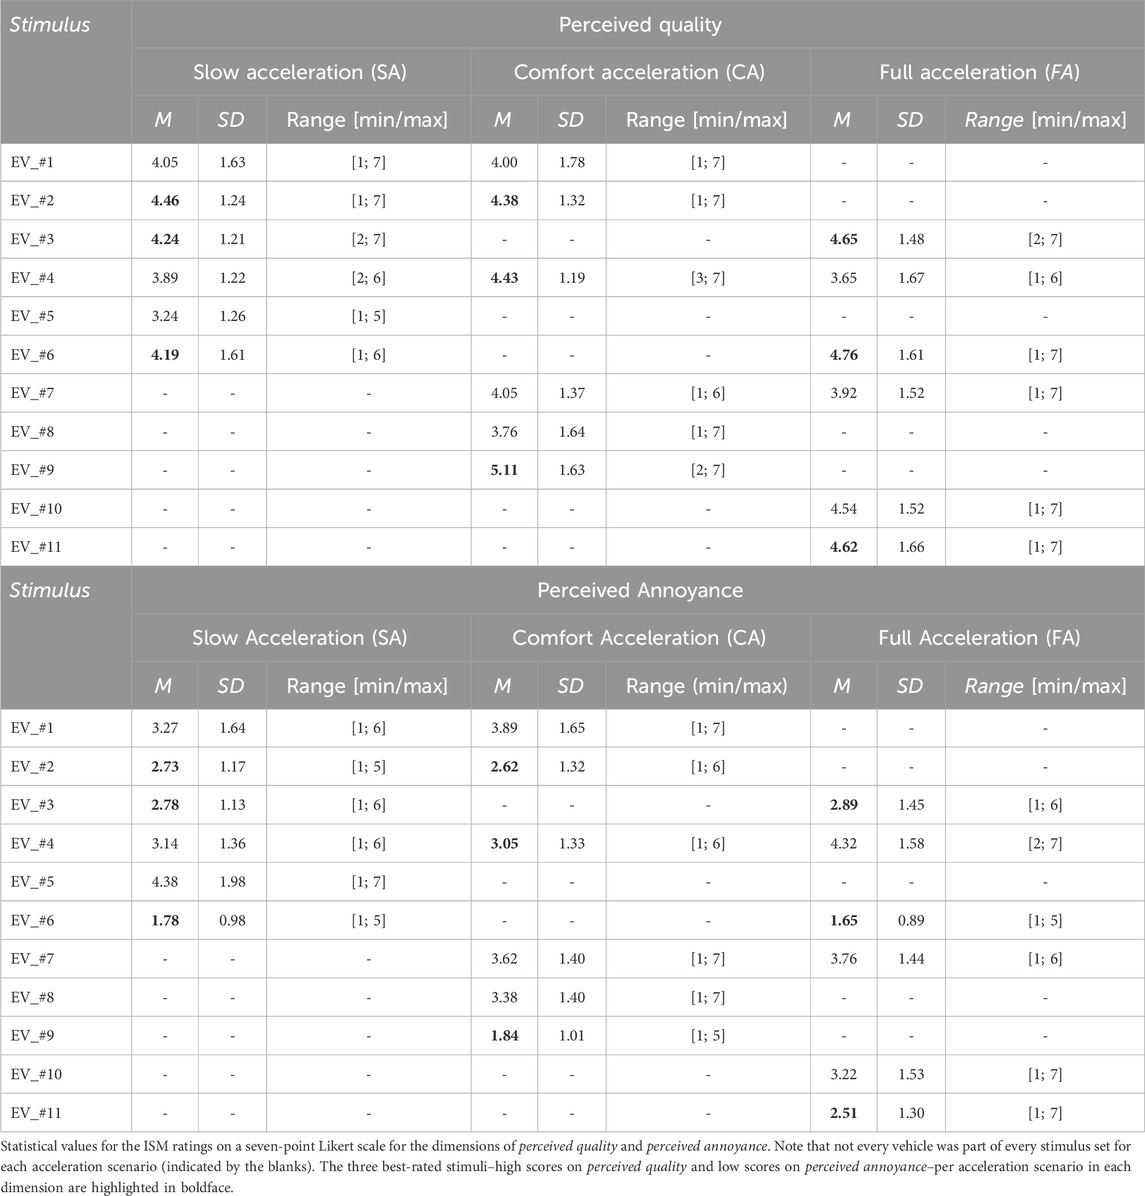
Table 1. ISM ratings for Perceived Quality and Perceived Annoyance in the different acceleration scenarios.
With the gathered ISM ratings, we fitted a linear mixed model for the two key dimensions with the vehicle type as a fixed factor and the participant variable as a random effect for each of the acceleration scenarios, using the lmer-function (Kuznetsova et al., 2017). In the SA scenario EV_#5 was of significantly lower perceived quality (b = - 0.81, t(180) = - 2.83, p = 0.0051**), while at the same time it was perceived as significantly more annoying (b = 1.11, t(180) = 3.72, p = 0.0003***) compared to the other vehicles. In the CA scenario EV_#9 was perceived as of significantly higher quality (b = 1.11, t(180) = 3.83, p < 0.001***), while also being perceived as significantly less annoying (b = - 2.05, t(180) = - 7.32, p < 0.001***). In the FA scenario, similar effects can be found. Detailed results are summarized in Table 2.
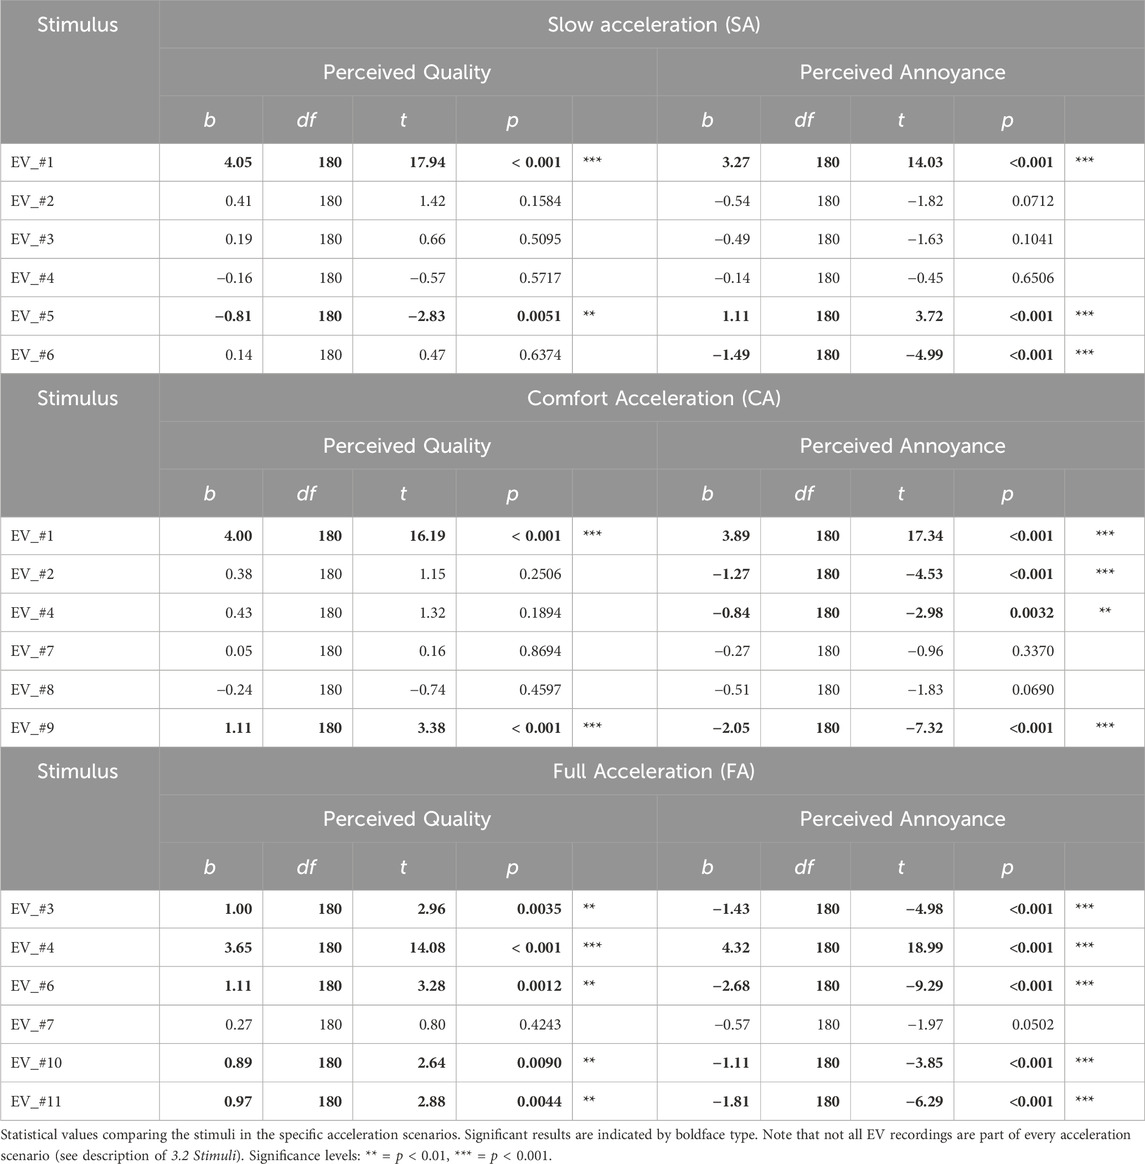
Table 2. Comparison of Perceived Quality and Perceived Annoyance in the different acceleration scenarios.
For an initial visual inspection of the continuous evaluation data, we plotted the slider evaluations from all participants for each stimulus per acceleration scenario. We plotted one graph for each dimension—one for the dimension of perceived quality (Figure 5) and one for perceived annoyance (Figure 6). Both graphs represent the continuous evaluation over the course of the slow acceleration scenario of EV_#5. The overall trend in the perceived quality evaluation of EV_#5 (Figure 5)—indicated by the dashed red regression line—shows a downward trend, meaning the qualitative impression of the emitted e-powertrain noise by EV_#5 decreases over the course of time. The overall mean of the continuous evaluations (thick pink-blue line) indicates that something around the 13 second mark adversely affects the qualitative acoustic impression as the overall trend dips for a couple of seconds until it seems to recover towards the end of the stimulus presentation. The different individual evaluation streams show a high variance, partially or in some cases, even indicating completely opposing impressions.
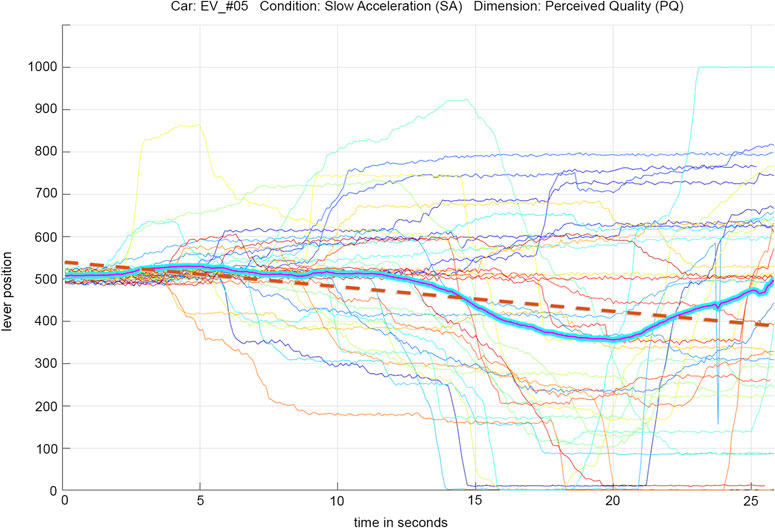
Figure 5. Exemplary visualization of the continuous evaluation streams regarding the variable perceived quality (starting position of the slider in the middle) for EV_#5 in the slow acceleration (SA) scenario. Each colored thin line represents the evaluation stream of a single participant, and the thick pink-blue line indicates the overall mean over time. A regression line (dashed red line) depicts the overall trend of the sample’s evaluation.
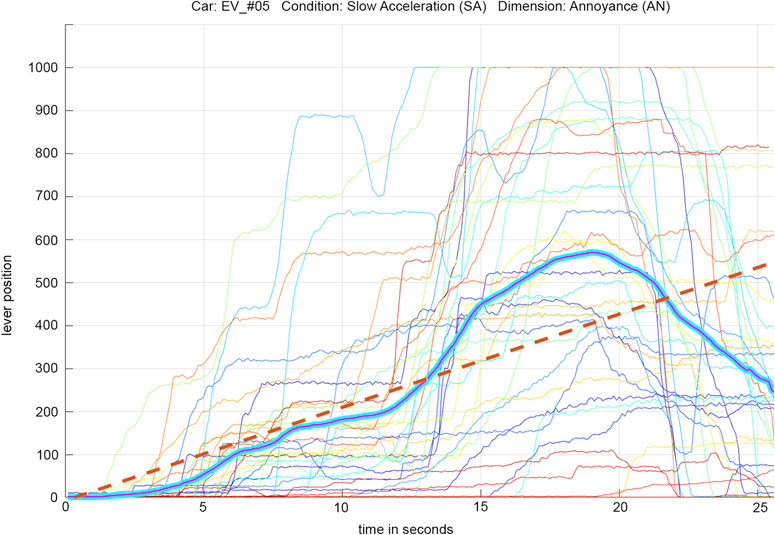
Figure 6. Exemplary visualization of the continuous evaluation streams regarding the variable perceived annoyance (starting position of the slider at the bottom) for EV_#5 in the slow acceleration (SA) scenario. Each colored thin line represents the evaluation stream of a single participant, and the thick pink-blue line indicates the overall mean over time. A regression line (dashed red line) depicts the overall trend of the sample’s evaluation.
The overall trend in the perceived annoyance evaluation of EV_#5 (Figure 6)—indicated by the dashed red regression line—shows an upward trend, meaning the perceived annoyance of the emitted e-powertrain noise by EV_#5 increases over time. While the overall mean of the continuous evaluations for the perceived annoyance dimension rapidly increases around the 13 second mark, the overall mean for the perceived quality (Figure 5) falls off and consecutively dips. Though the perceived annoyance seems to increase after a few seconds, at this point, something seems to be remarkably annoying in the acoustic profile in the slow acceleration of EV_#5 as almost all levers were pulled up.
As a next step, we looked at the gradients, that is, the numerical differentiations, for each vehicle and acceleration condition (Figure 7). Those plots highlight changes in the perceived quality and perceived annoyance, making the dynamics even more salient. For the vehicle-condition combinations that were perceived as least annoying in the ISM ratings (EV_#06 for SA, EV_#09 for CA and EV_#06 for FA), the graphs are relatively flat but reveal subtle dynamics throughout the acceleration process and occasional peaks, where the participants seemed to have noticed something. For the vehicle-condition combinations that were rated as most annoying in the ISM ratings (EV_#05 for SA, EV_#01 for CA and EV_#04 for FA), the utilized CEP measure reveals the unfolding dynamics. Instead of a relatively flat graph with subtle dynamics as in the least annoying stimuli, the graphs for the most annoying stimuli show a broader range and more fluctuations. EV_#05 in the SA scenario (please compare to Figure 6) shows fluctuations starting after 3 seconds, with a very distinct, steep slope starting at the 11-s mark, and the most distinct peaks around the 14 second mark. In contrast, EV_#01 in the CA scenario starts to be very annoying rapidly and soon after launch but does not cause any more disturbances after the five second mark. A similar pattern is visible for EV_#01 in the full acceleration condition.
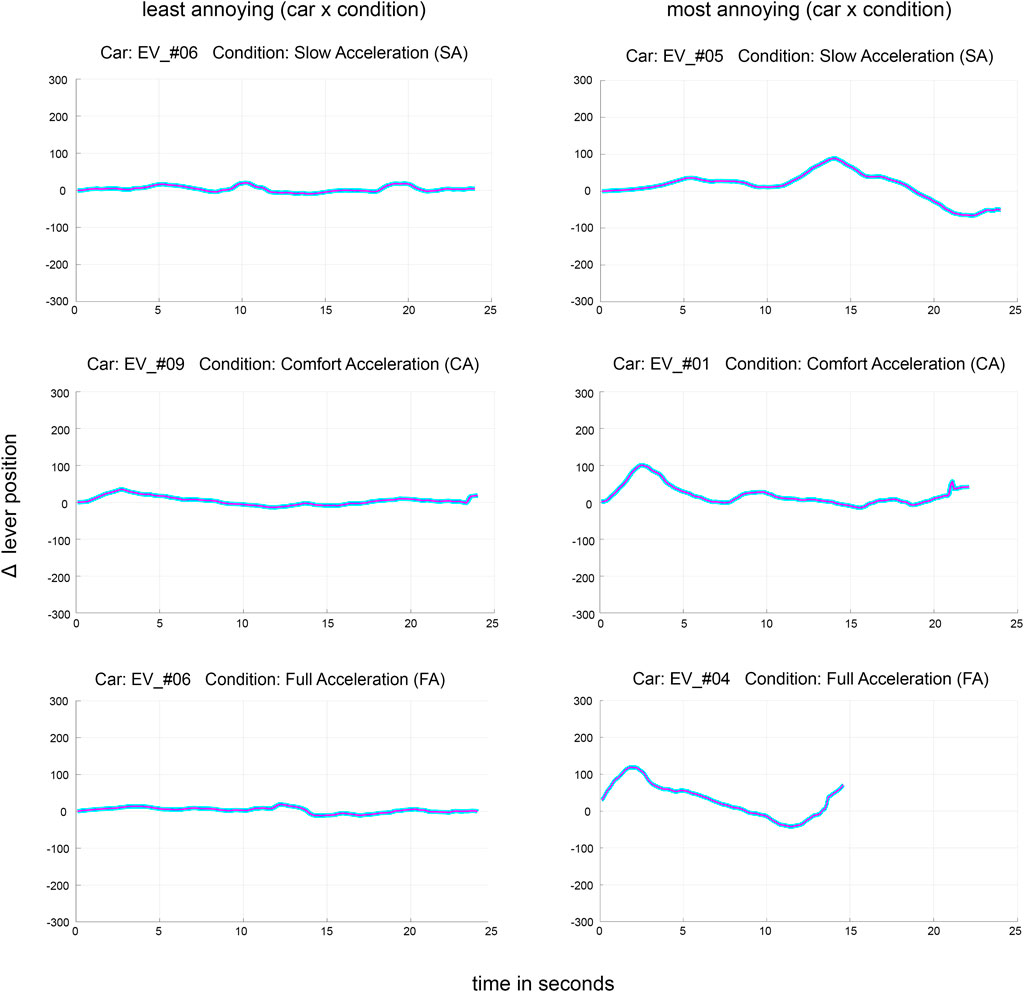
Figure 7. The gradients (numerical differentials for the CEP data over time) for the vehicles perceived as least annoying (left column) and as most annoying in each acceleration condition (SA, CA, FA; from top to bottom). Positive values indicate a rise in perceived annoyance and vice versa.
Additionally, we analyzed the acoustic profiles of the stimuli through Campbell diagrams. These Campbell diagrams provide information about acoustic parameters, such as sound pressure level (SPL), frequency spectra and tonal components as, for example, distinct engine orders, and therefore, how the acoustic scene unfolds over time objectively regarding their physical parameters. In Figure 8 the depiction of the acoustic signal and the corresponding CEP diagram on the perceived quality of EV_#5 in the SA scenario is depicted. The stream diagrams from the continuous evaluation and the Campbell diagrams display the temporal resolution on the x-axis. Although Campbell diagrams do not claim to give indications of how the acoustic stimuli would be evaluated and perceived by a human percipient, with this comparison, we want to emphasize that for purposes of deriving insights on perceptional qualia, such as the perceived quality of driving noise, ask for different methods than mere objective analyses of physical parameters.
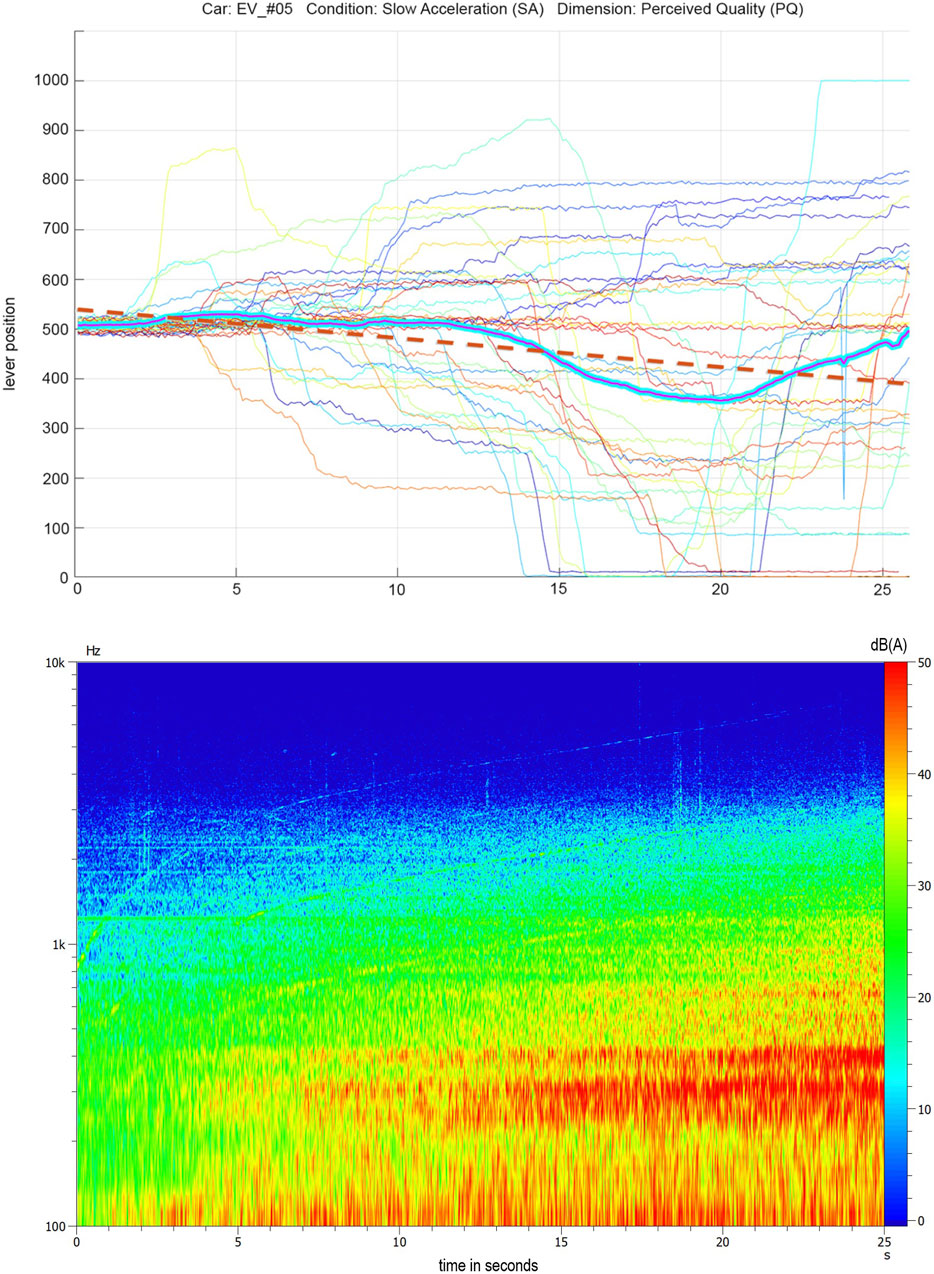
Figure 8. CEP diagram of the continuous evaluation regarding the variable perceived quality in slow acceleration (SA) scenario of EV_#5 (top graph) and corresponding Campbell diagram for acoustic analysis (lower graph).
Also, it can be difficult to determine why specific stimuli would be perceived as significantly less or more annoying than others. For example, when comparing the Campbell diagrams of the stimuli EV_#1 and EV_#2 in Figure 9, where EV_#2 was perceived as significantly less annoying in the comfort acceleration scenario according to our data (see Table 1; Table 2). From a brief visual comparison, one could find it difficult to decide, which of the two stimuli might be significantly more annoying than the other: EV_#1 seems to show stronger distinct engine orders, while EV_#2 shows distinct engine orders in the higher frequency spectrum and strong resonances in the lower frequency spectrum spanning over almost the entire acoustic scene. But which of these physical parameters are diminishing the subjective qualitative impression the most could be challenging to determine by solely looking at Campbell diagrams. Also, dynamic perceptual effects can not be derived from this depiction of the acoustic parameters.

Figure 9. Campbell diagrams for EV_#1 and EV_#2 in the comfort acceleration (CA) scenario. Note that the stimulus of EV_#1 already ends after 22.5 s as the vehicle reached its top speed at that point in time.
To compare the two different evaluation methods in this study, we furthermore compared the parameters of the continuous evaluations from the CEP slider for each stimulus with the average ISM ratings (see Table 3). As the participants’ task was to evaluate the presented stimuli on two different scales—first continuously with the slider bar (signal output ranging from 0 to 1000) and second on a seven-point Likert scale—it is not permissible to simply translate the ISM ratings onto the continuous scale. Nevertheless, by looking at the rank orders of CEP and ISM data, for perceived quality as well as perceived annoyance, we see that both measures match well. In the SA scenario, EV_#06 is the least annoying regarding both measures. The same holds for EV_#09 in the CA scenario and EV_#06 in the FA scenario. For the dimension of perceived quality, the two measures seem to slightly differ as in the CEP evaluation EV_#6 was perceived as of highest quality, while with the ISM evaluation EV_#2 scored highest in the SA scenario. In the other two scenarios both measures show high correspondence again as in the CA scenario EV_#9 is perceived as of highest quality with both measures and rank order is aligned, and in the FA scenario EV_#6 is perceived as of highest quality with both evaluation measures. The correspondence of both measures is a promising indicator for reliability, as both measures arrive at very similar results by very different means.
The added benefit of CEP is visible in the temporal dynamics that are plotted in Figure 7 or as well in Figure 5 and Figure 6 on the individual level. The process of appreciation becomes tangible and differences between vehicles with similar integral measures become apparent. For acoustic engineers, the revealed perceptual dynamics can be helpful in tackling the causes of disturbing noise, as well as guiding interventions in refining the e-NVH profiles.
Per vehicle and acceleration scenario, low scores of perceived annoyance seem to go along with higher scores in perceived quality. From the ISM data, a significant negative correlation of τ = − 36, p < 0.001 (Kendall’s Tau for rank-based data) can be derived for the two key variables overall. These associations differ among the scenarios: τ = − 28, p < 0.001 for the slow acceleration, τ = − 38, p < 0.001 for the comfort acceleration and τ = − 41, p < 0.001 for the full acceleration scenario.
From the ISM rating data, we can derive information about whether the stimuli were perceived as of significantly more or less quality, as well as if they were perceived as significantly more or less annoying than others. Though the ISM values provide us with an overview of the most qualitatively preferred and least annoying e-powertrain noise, these rankings lack temporal information about the course and development of the subjective assessments. The participant’s individual overall “percept” is merged into a singular value. Thereby, it does not allow any differentiation, as for example, about whether a specific stimulus might have been very annoying at the beginning, at the end, or just throughout the entire acoustic scene. Especially when further analyzing specific acoustic properties, such as frequency peaks or tonalities, to further specify refinement measures for a specific e-powertrain, the ISM is not sufficient to point out which aspects are specifically diminishing the qualitative impression. The continuous evaluation approach provides the potential to analyze the criticality of different NVH phenomena and to identify acoustic characteristics that define a high qualitative impression. Therefore, the employed continuous evaluation provides a goal-oriented methodological approach suitable to tackle such problems in the applied field and can give first indications which NVH phenomena should be avoided. As shown in this study, CEP can deliver valuable insights on specific aspects that might need refinement due to its high temporal resolution of the subjective evaluation. The high correspondence of the evaluations’ rank order in ISM and CEP indicates the continuous evaluations to be reliable. Moreover, our results confirm a significant negative correlation of τ = −.36, p < 0.001 (Kendall’s Tau for rank-based data) between perceived annoyance and perceived quality overall, similar to the significant negative correlation between the perceptibility of e-powertrain noise in acceleration scenarios and perceived quality of τ = −.32, p < 0.001 as found by Münder and Carbon (2022). With this potential negative medium effect of e-powertrain noise on the overall qualitative impression of an EV’s acoustic profile, the identification of dynamic effects in its subjective evaluation can be very helpful in the refinement of e-NVH and should be considered in the acoustic design process. However, we would like to point out that our sample shows a high level of expertise with 59% of the participants working specifically on matters of vehicle acoustics. As shown in the study of Münder and Carbon (2022) the expertise level might influence one’s evaluation. In our study we utilized a widely spread repertoire of stimuli from across the whole automotive market. For the refinement of a specific e-powertrain configuration the stimulus set should focus on a more aligned set of stimuli, as for example, varying powertrain configurations within the same vehicle, in future studies. Also, specifically defined NVH-phenomena should be focused on and varied in their appearance throughout the acoustic scene, to systematically compare whether the general existence of the phenomenon or, for example, its loudness effects the qualitative impression, or if it is the specific timing that is decisive. Continuous evaluation data achieved by applying the CEP can be compared with the acoustic measurement data to derive insights on how the specific physical properties, such as frequency peaks or the onset of specific orders, impact the subjective evaluation. A methodological limitation in this study to be considered is the time lag between the individual’s perception and their action on the evaluation slider. The actual adjustment of the slider is probably time-delayed, as the participant must become conscious of their impression first. Moreover, a continuously accompanying evaluation of an acoustic scene requires more focus and attention of the participants as well as a more thorough data analysis on the researchers’ side. In contrast, an evaluation with an integral singular measure rating is rather time and cost-efficient. Our data indicates the concepts of perceived quality and perceived annoyance to be perceived highly interindividually. Therefore, as in our study, future research should aim for a sufficient sample size when investigating such interindividual concepts, which is defined by each participant, as general trends in perception can only be derived with robust and reliable statistics. Furthermore, it would be interesting to investigate the effect of additional vibrational feedback on the participants’ perception of EV interior soundscapes. With the emphasis on the level-correct reproduction of 3D sound recordings in our utilized acoustic simulator, such multimodal effects would be interesting to consider and add in future studies.
In the present study, we obtained an integral singular measure (ISM) rating on the dimensions of perceived quality and perceived annoyance of e-powertrain noise, and continuous evaluation data (CEP) throughout the respective acceleration process. Thereby, we were able to unfold the dynamics of our participants’ experience of a non-stationary acoustic signal. Rather than assessing our participants’ overall impression in retrospect—as done through singular measurement ratings – we captured their subjective evaluation while they experienced the acoustic scene. By applying such continuous evaluation techniques, researchers and acoustic engineers have the chance to analyze subjective evaluations of non-stationary acoustic events and scenes with higher timely resolution. Thereby, the dynamic perceptional effects of specific acoustic properties can be identified. In the context of automotive acoustics, such methods should be pursued in future research as they can bring further insights into the interplay of the different (e-)NVH characteristics and provide a great tool to refine a vehicle’s NVH profile while already considering the resulting perceptional impressions of the resulting product.
The datasets presented in this article are not readily available because of proprietary reasons. Requests to access the datasets should be directed to bWFyYS5tdWVuZGVyQHVuaS1iYW1iZXJnLmRl.
Ethical approval was not required for the studies involving humans because the study was in full accordance with the ethical guidelines of the University of Bamberg. It was approved by an umbrella evaluation for psychophysical testing of the University of Bamberg ethics committee (Ethikrat der Universität Bamberg) on 18 August, 2017. All participants were informed about their data protection rights and approved the usage of their data prior to the questionnaire. The studies were conducted in accordance with the local legislation and institutional requirements. The participants provided their written informed consent to participate in this study. Written informed consent was obtained from the individual(s) for the publication of any potentially identifiable images or data included in this article.
MM: Conceptualization, Formal Analysis, Investigation, Methodology, Project administration, Visualization, Writing–original draft, Writing–review and editing. G-JM: Resources, Writing–review and editing. MHR: Formal Analysis, Methodology, Software, Visualization, Writing–review and editing. C-CC: Conceptualization, Formal Analysis, Methodology, Writing–review and editing.
The authors declare that no financial support was received for the research, authorship, and/or publication of this article.
The authors would like to thank all colleagues who were involved in the acquisition of acoustic recordings and supported the technical realization in the experimental environment. Furthermore, the authors would like to thank the reviewers for their valuable feedback on the initial draft of this paper.
Authors MM and G-JM were employed by BMW Group.
The remaining authors declare that the research was conducted in the absence of any commercial or financial relationship that could be construed as a potential conflict of interest.
The authors declared that they were an editorial board member of Frontiers, at the time of submission. This had no impact on the peer review process and the final decision.
All claims expressed in this article are solely those of the authors and do not necessarily represent those of their affiliated organizations, or those of the publisher, the editors and the reviewers. Any product that may be evaluated in this article, or claim that may be made by its manufacturer, is not guaranteed or endorsed by the publisher.
1The vehicle descriptions are anonymized and encoded as we are focusing on comparing different evaluation methods to capture dynamic effects in the perception of vehicle acoustics in this study rather than providing a comparison of different competitors in the field.
Albrecht, S., and Carbon, C.-C. (2014). The fluency amplification model: fluent stimuli show more intense but not evidently more positive evaluations. Acta Psychologica 148 (148), 195–203. doi:10.1016/j.actpsy.2014.02.002
Blauert, J. (1986). “Aesthetic and cognitive aspects of noise engineering,” in Proc. InterNoise, 3–14.
Blickensdorff, J., Boulliung, M., Burkard, M., Dold, C., Emretsson, B.-G., Genuit, K., et al. (2019). Akustik. in: H. Tschöke, P. Gutzmer, and T. Pfund (Eds.). Elektrifizierung des Antriebsstrangs. Berlin, Heidelberg: Springer Berlin Heidelberg, 307–363.
Borg, K. L. (2014). Introduction: constructing sociotechnical environments—aurality, air quality, and automobiles. Air Qual. Automob. Technol. Cult. 55 (2), 287–298. doi:10.1353/tech.2014.0049
Bornstein, R. F. (1989). Exposure and affect: overview and meta-analysis of research, 1968-1987. Psychol. Bull. 106 (2), 265–289. doi:10.1037//0033-2909.106.2.265
Carbon, C.-C. (2019). Empirical approaches to studying art experience. J. Percept. Imaging 2 (1), 010501-1–010501-7. doi:10.2352/J.Percept.Imaging.2019.2.1.010501
Carbon, C.-C., and Leder, H. (2005). The Repeated Evaluation Technique (RET). A method to capture dynamic effects of innovativeness and attractiveness. Appl. Cogn. Psychol. 19 (5), 587–601. doi:10.1002/acp.1098
Cerrato, G. (2009). Automotive sound quality - powertrain, road and wind noise. Sound Vib. 43 (4), 16–24.
Clendinning, E. A. (2018). Driving future sounds: imagination, identity and safety in electric vehicle noise design. Sound. Stud. 4 (1), 61–76. doi:10.1080/20551940.2018.1467664
Devillers, E., Gning, P., Degrendele, K., and Le Besnerais, J. (2020). Sound quality aspects of electric vehicles. ATZ Worldw. 122 (07-08), 26–31. doi:10.1007/s38311-020-0254-5
Eisele, G., Kauth, M., Steffens, C., and Glusk, P. (2019). “Automotive megatrends and their impact on NVH,” in Internationales Stuttgarter Symposium. M. Bargende, H.-C. Reuss, and A. Wagner (Wiesbaden: Springer Fachmedien Wiesbaden), 523–539.
Faul, F., Erdfelder, E., Lang, A.-G., and Buchner, A. (2007). G*Power 3: a flexible statistical power analysis program for the social, behavioral, and biomedical sciences. Behav. Res. Methods 39 (2), 175–191. doi:10.3758/bf03193146
Gavric, L. (2020). “NVH refinement issues for BEV,” in Automotive acoustics conference 2019. Editor W. Siebenpfeiffer (Wiesbaden: Springer Fachmedien Wiesbaden), 1–9.
Genuit, K. (1996). “Objective evaluation of acoustic quality based on a relative approach,” in Proceedings - Institute Of Acoustics, 3233–3238.
Genuit, K. (2010). The future of NVH research - a challenge by new powertrains. SAE Technical Paper Series (36). doi:10.4271/2010-36-0515
Jakesch, M., Zachhuber, M., Leder, H., Spingler, M., and Carbon, C.-C. (2011). Scenario-based touching: on the influence of top-down processes on tactile and visual appreciation. Res. Eng. Des. 22 (3), 143–152. doi:10.1007/s00163-010-0102-5
Krishna, G. (2021). Understanding and identifying barriers to electric vehicle adoption through thematic analysis. Transp. Res. Interdiscip. Perspect. 10, 100364. doi:10.1016/j.trip.2021.100364
Kuznetsova, A., Brockhoff, P. B., and Christensen, R. H. B. (2017). lmerTest package: tests in linear mixed effects models. J. Stat. Softw. 82 (13). doi:10.18637/jss.v082.i13
Lennström, D., Lindbom, T., and Nykänen, A. (2013). “Prominence of tones in electric vehicle interior noise,” in Proceedings InterNoise.
Lennström, D., and Nykänen, A. (2015). “Interior sound of today's electric cars: tonal content, levels and frequency distribution,” in SAE 2015 Noise and Vibration Conference and Exhibition, June 22, 2015 (Warrendale, PA: SAE International 400 Commonwealth Drive).
Münder, M., and Carbon, C.-C. (2022). Howl, whirr, and whistle: the perception of electric powertrain noise and its importance for perceived quality in electrified vehicles. Appl. Acoust. 185, 108412. doi:10.1016/j.apacoust.2021.108412
Muth, C., and Carbon, C.-C. (2013). The aesthetic aha: on the pleasure of having insights into Gestalt. Acta Psychol. 144 (1), 25–30. doi:10.1016/j.actpsy.2013.05.001
Muth, C., Raab, M. H., and Carbon, C.-C. (2015). The stream of experience when watching artistic movies. Dynamic aesthetic effects revealed by the Continuous Evaluation Procedure (CEP). Front. Psychol. 6, 365. doi:10.3389/fpsyg.2015.00365
Qatu, M. S. (2012). Recent research on vehicle noise and vibration. Int. J. Veh. Noise Vib. 8 (4), 289–301. doi:10.1504/ijvnv.2012.051536
Sadia, S., and Carbon, C.-C. (2023). Looking for the edge of the world: how 3D immersive audio produces a shift from an internalised inner voice to unsymbolised affect-driven ways of thinking and heightened sensory awareness. Behav. Sci. (Basel, Switzerland) 13 (10), 858. doi:10.3390/bs13100858
Stylidis, K., Wickman, C., and Söderberg, R. (2015). Defining perceived quality in the automotive industry: an engineering approach. Procedia CIRP 36, 165–170. doi:10.1016/j.procir.2015.01.076
Swart, D. J., Bekker, A., and Bienert, J. (2016). The comparison and analysis of standard production electric vehicle drive-train noise. Int. J. Veh. Noise Vib. 12 (3), 260. doi:10.1504/IJVNV.2016.080140
van de Cruys, S., and Wagemans, J. (2011). Putting reward in art: a tentative prediction error account of visual art. i-Perception 2 (9), 1035–1062. doi:10.1068/i0466aap
Zajonc, R. B. (1968). Attitudinal effects of mere exposure. J. Personality Soc. Psychol. 9 (2), 1–27. doi:10.1037/h0025848
Keywords: perceived quality, dynamic evaluation, automotive, acoustic perception, association, e-powertrain, electrified vehicle
Citation: Münder M, Müller G-J, Raab MH and Carbon C-C (2024) Unfolding dynamics in the perception of interior vehicle acoustics via continuous evaluation procedure (CEP). Front. Acoust. 2:1423168. doi: 10.3389/facou.2024.1423168
Received: 25 April 2024; Accepted: 06 June 2024;
Published: 08 July 2024.
Edited by:
Antonio J. Torija Martinez, University of Salford, United KingdomReviewed by:
Antonio Petošić, University of Zagreb, CroatiaCopyright © 2024 Münder, Müller, Raab and Carbon. This is an open-access article distributed under the terms of the Creative Commons Attribution License (CC BY). The use, distribution or reproduction in other forums is permitted, provided the original author(s) and the copyright owner(s) are credited and that the original publication in this journal is cited, in accordance with accepted academic practice. No use, distribution or reproduction is permitted which does not comply with these terms.
*Correspondence: Mara Münder, TWFyYS5NdWVuZGVyQHVuaS1iYW1iZXJnLmRl
Disclaimer: All claims expressed in this article are solely those of the authors and do not necessarily represent those of their affiliated organizations, or those of the publisher, the editors and the reviewers. Any product that may be evaluated in this article or claim that may be made by its manufacturer is not guaranteed or endorsed by the publisher.
Research integrity at Frontiers

Learn more about the work of our research integrity team to safeguard the quality of each article we publish.