- 1Ricerca sul Sistema Energetico – RSE S.p.A, Milano, Italy
- 2e-Bio Center, Università degli Studi di Milano, Department of Environmental Science and Policy, Milano, Italy
- 3Department of Management, Information and Production Engineering, University of Bergamo, Dalmine, Italy
Research in the field of bioelectrochemical systems is addressing the need to improve components and reduce their costs in the perspective of their large-scale application. In this view, innovative solid separators of electrodes, made of biochar and terracotta, are investigated. Biochar-based composites are produced from giant cane (Arundo Donax L.). Two different types of composite are used in this experiment: composite A, produced by pyrolysis of crushed chipping of A.donax L. mixed clay; and composite B, produced by pyrolysis of already-pyrolyzed giant cane (biochar) mixed with clay. Electrical resistivity, electrical capacity, porosity, water retention, and water leaching of the two composites types (A and B) with 1, 5, 10, 15, 20, and 30 mass percentages of carbon (w/w) are characterized and compared. Less than 1 kΩ cm of electrical resistance is obtained for composite A with a carbon content greater than 10%, while physical and electrical performances of composite B do not significantly change. SEM micrographs and 3D microcomputed tomography of different composite materials are provided, demonstrating a different matrix structure of carbon in the terracotta matrix. The possibility of suitably decreasing electric resistance and increasing water retention/leaching of composite A opens the way for a new class of resistive materials that can be simultaneously used as electrolytic separators and as external electric circuits, allowing a compact microbial fuel cell design. A proof of concept of such an MFC design was provided for different tested composites. Although all the anolytes become anaerobic, only the MFCs equipped with the composite A30% were able to produce power, reaching the maximum power peak in correspondence to resistance of about 1 kΩ. The low, but significant, produced power (about 40 mW m−2, cathode area) confirm that the proposed solution is particularly suitable for nutrient recovery and environment pollution bioremediation, where energy harvesting is not requested.
Introduction
Microbial electrochemical systems (MESs) are new biotechnologies exploring bioelectrochemical phenomena from the perspective of their possible application for generating energy (Santoro et al., 2017), fuels, or value-added chemicals (Viggi et al., 2017; Tiquia-Arashiro and Pant, 2020). MESs are particularly promising for the remediation of environmental pollution (Ng et al., 2016), offering a flexible platform for the desalination processes (Elmekawy et al., 2014). Many other possible engineering functions are currently under investigation, based on the general principle that natural microorganisms catalyze one, or both, anodic and cathodic reactions, on carbon electrodes (Tiquia-Arashiro and Pant, 2020). Biodegradable substrates can be oxidized by microorganisms at the anode, generating an electrical current. Bacteria growing on a porous cathode can substitute expensive catalysts (such as platinum or carbon-based catalysts) to increase the oxygen reduction reaction in fuel cells (Zhang et al., 2012; Cristiani et al., 2013; Milner et al., 2016). The electrons exchanged during the redox reactions, thanks to the created or imposed potential difference between electrodes, flow in an external electric circuit. The latter is usually composed of metal collectors, plastic insulators, and resistors. However, the relatively high economic and environmental costs of such components hinders the large-scale applications of MESs. The same problems affect polymeric electrolytic separators used as ion-exchange membranes, whose costs and environmental concerns can be higher than those of electrodes. Several separators were investigated as an effective and low-cost alternative to well-known ion-exchange polymeric Nafion®. As an example, it was reported (Kondaveeti et al., 2014) that polypropylene membranes can make better performing MFCs than Nafion®, allowing a maximum voltage of 0.477 V across an external resistance of 1,000 Ω, corresponding to a power density of 121 mW m−2. This kind of membrane exhibited a relatively small internal ohmic resistances of 2–11 Ω. Higher performances (280 mW m−2) were achieved during 280-days operation with single-chamber bottle-type microbial fuel cells (Kondaveeti et al., 2018) and 488 mW m−2 was obtained in polarization analysis with 6 mm distance between electrodes in single-chamber MFCs (Kondaveeti et al., 2017). The architecture of components, indeed, plays a key role in facilitating the transport of ions between electrodes and membrane properties. In particular, the porosity substantially influences the overall MES performance, as disserted in a recent review (Bakonyi et al., 2018). This work also underlined the difficulty of comparing the performance of different MFC types and separators, due to the difficulties in exactly reproducing experimental conditions and environments, including inoculum origin, feedstock source, anode potential, electrode material properties, electrode distances, electrolyte quality, reactor configuration, pH, and temperature.
Nevertheless, it is relevant to note that polymeric membranes are strongly affected by carbonate fouling and biofouling (Kondaveeti et al., 2018). Various other materials have been offered as alternative separators, such as salt bridges, glass fibers, earthenware (Behera et al., 2010, Ajayi and Weigele, 2012; Winfield et al., 2013; Daud et al., 2020), and composite plastic membranes (Mathuriya and Pant, 2018). All those materials can equally contrast oxygen and substrate crossovers, also controlling fouling. Among the others, separators made of terracotta (earthenware) can offer several advantages (Pasternak et al., 2015).
In a recent work (Daud et al., 2020), sintered green ceramic pellets from clay with 30 vol% starch powder content (pore forming) were applied as the separator in small squared MFCs (volume of 16 ml), typically used for MFC laboratory tests, having an internal resistance between electrodes of 75 Ω. The cathode of these MFCs was platinum-doped and the achieved power density was as high as 2,250 mW m−2 (6.0 A m−2), with Coulombic efficiency of about 50%, under batch mode operation.
Several other ceramic MFC configurations were recently investigated, exploiting the natural porosity of terracotta and avoiding the use of expensive catalysts such as platinum.
Tubular Microbial Fuel cells (MFCs), with the carbon anode placed on the outer surface and a carbon cathode inside a cylinder made of terracotta, immersed into wastewater, is a configuration that allows perfect separation between the waterside (external) and the airside (inner volume of the cylinder). Several applications were approached with such systems, where the terracotta (ceramic fired clay, which has typical pore sizes of 60–500 nm) acts as a porous medium that allows electrolytes’ mobility. Using small scale terracotta-MFC modules of roughly 10 cm height and 1 cm diameter in stacked systems, electricity was harvested from urine and other wastewaters to power DC motors and other devices (Walter et al., 2016). The same MFC design was utilized as a self-powered wastewater electrolyzer for electrocoagulation of heavy metals, caustic production at the cathode (pH > 10), and CO2 sequestration (Ramírez-Moreno et al., 2014). Deposited salts and stripped ammonia can be thus recovered and utilized as fertilizers for agriculture in a circular-economy approach [Behera et al., 2010; Sengupta et al., 2015].
The earthen pot was effective for proton transfer in such low-cost MFCs, giving a comparable performance with respect to much more sophisticated MFCs, even if it was found that the major limitation comes from the low carbon cathode potential (Santoro et al., 2015). Nevertheless, several studies and experiments have been addressed to demonstrate the effectiveness of such low performing MES systems for water and soil remediation with promising performances (Kappler et al., 2014; Prado et al., 2019; Goglio et al., 2019a; Goglio et al., 2019b; Schievano et al., 2019). Furthermore, a recent work (Neethu et al., 2019) underlined that a novel membrane developed from clay and activated carbon derived from coconut shells performed better than the Nafion® 117 membrane, doubling the power density of an MFC. This new type of membrane showed an increased proton diffusion coefficient.
Electroactive biogenic charcoal (biochar), produced from residual biomasses, is an environmentally friendly and efficient solution proposed for electrodes (Prado et al., 2019). The biochar achieved from giant cane (Arundo donax L.) is particularly attractive as a suitable and largely available source, at relatively low costs, therefore being a great candidate for MES systems (Goglio et al., 2019a; Goglio et al., 2019b; Schievano et al., 2019). The feedstock sources and heat treatment parameters (temperature, residence time, atmosphere of pyrolysis reactor) are major parameters determining the electrochemical and structural properties of biochar (Longhi et al., 2016; Goglio et al., 2019a, Goglio et al., 2019b). A suitable combination of these parameters allows the achievement of biochar characterized by high conductivity, porosity, and ions conductivity (Giudicianni et al., 2014). Nitrogen and other macro-micro-nutrients were already recovered from wastewater in single-chamber air-breathing microbial fuel cell systems, entrapped in the porosity of biochar-based cathodes produced by the pyrolysis of giant cane (Marzorati et al., 2018). The mechanical fragility of biochar-based MFCs was an underlined issue, in that case, precluding its possible scaling-up.
Aiming at strengthening and improving the design of biochar-based MFCs for recovering nutrients and environment pollution at a large scale, robust biochar-terracotta composites were studied in this work. These composites were produced by a single and double step pyrolysis of Arundo donax L., mixed with clay in varying ratios, and subsequently thermally treated.
Porosity, electrical resistance/ionic conductivity, and water permeability of differently pyrolyzed and differently mixed with terracotta composites were characterized.
The target is to create, for the first time, a new class of composite materials that have the double function of ions and electrons conductor, making MFCs suitable for large-scale environmental applications.
Suitable balancing of the water retention, electric conductivity, and porosity of components permits the design of compact biochar-based MFCs for applications in different soil and water environments. These parameters are crucial to guarantee the settlement and life of the microbiological pool operating in the system. In the case of soil remediation, for instance, the harvesting power is not requested, and the remediation process enhanced by microorganisms is relatively slow. In this case, a low water retention capability of the MFC system could be a concern, as the soil humidity can strongly vary in time, debarring MFC’s performance against pollutants. In water environments, on the other hand, an excessive flow through the MFC could contrast the anaerobic condition of the anode and, consequently, the water purification process. Lastly, pores of a micrometric dimension allow microorganisms to reach and colonize anodic and cathodic electrodes.
Materials and Methods
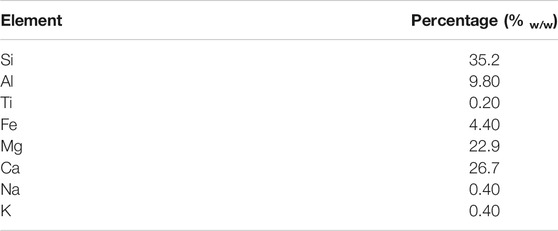
Giant canes (Arundo donax L.), collected in Cascina Marianna (Landriano, PV) from the experimental fields of the Università degli Studi di Milano were used to produce biochar. The clay used to produce terracotta was a commercial powder (BDIH, Italy) with a slightly alkaline pH and good ionic conductivity. Its elemental composition is illustrated in Table 1.
Two types of composite (A and B) and different percentages of carbon mixed with clay (1, 5, 10, 15, 20, and 30% mass percentages of carbon (w/w), clay balance) have been tested. Biochar-terracotta composites of type A and B differ in the preparation procedure.
Cylindrical samples of each composite type (A and B) with a diameter of 4 cm were molded. In a first test, samples of different thicknesses (4, 8, and 12 mm) were tested with a relatively low carbon content (1, 5, and 10%). In a second test, samples with higher carbon content (15, 20, and 30%) with the selected thickness of 8 mm were used. Each sample was built and tested at least in duplicate.
Composite A Preparation (One Step of Pyrolysis)
Composite A was prepared by mixing raw plant chippings of giant cane with clay and pyrolyzing the molded samples. Chippings were pulverized at a size of 0.5–1 mm and uniformly molded with clay in the samples. The pyrolysis was performed with the following protocol: slow heating of the oven hosting the samples (5°C/min) up to 900°C, 1 h held at 900°C and, finally, cooling down to 25°C. Nitrogen was flowing constantly at 14 NL/h during the pyrolysis treatment.
Composite Type B (Two Steps of Pyrolysis)
Composite type B was prepared from already pyrolyzed giant cane (biochar) mixed with clay and pyrolyzed again (two steps of pyrolysis). Raw, dried giant cane chippings were first pyrolyzed as it is, at a low temperature (350°C) and under nitrogen atmosphere (14 NLh−1). The obtained biochar was crushed at a size of 0.5–1 mm, and the powder was then mixed with clay and molded as cylindrical samples. Subsequently, samples were pyrolyzed again. This second step of pyrolysis follows the same procedure as for Composite A.
Analyses
Electrical Resistivity
An estimation of the electrical resistivity ρ of each composite sample after the pyrolysis in dry and wet conditions was measured, in different ways. Dry samples were analyzed carrying out potentio-dynamic polarization curves in the range of 0–0.5 V, with a scan rate of 0.01 V s−1. The distance between the counter electrode and working electrodes connected to the sample was 1 cm, approximating in this way an electrochemical cell with electrodes area of ∼1 cm2 (sample section) at a distance of 1 cm. A linear interpolation (Rint) of voltammetry data (Eq. 1), normalized for the sample thickness, was used to estimate ρ.
Measurements on dry and wet samples, 8 mm thick, were also performed using the multimeter Fluke 8808 A, pushing 1 cm squared plate contacts connected to the multimeter orthogonal to the testing sample. The measured resistance R was normalized to the length of 1 cm, to calculate the resistivity ρ, by Eq. 2, where A is the area of the electrode contact (1 cm2) and l is the distance between the electrodes (8 mm). 1.25 is, therefore, the constant value normalizing the measures in resistivity (Ω cm).
Electrical Capacitance
Measures of the electrical capacitance of the 8 mm thick dry and wet samples were performed using the capacimeter device LC100-A. The measurements were performed at a frequency of 820 kHz.
Water Retention
The water retention capacity (WC) is correlated to macroporosity of the composites. It was evaluated weighting the dried samples (at the start of analysis) and after leaving samples in water for 24 h. The water retention is expressed as the mass of water absorbed per mass of dried sample.
Wwet and Wdry are the mass of the dried and wetted samples, respectively.
Water Leaching
Water leaching in 24 h of wet samples was tested with a set-up of three different water column pressures (0.5, 1, and 1.5 m height) (Supplementary Material Figure S1). This test was performed posing samples on the bottom of tubes filled with a water column of 0.5, 1, and 1.5 m, simulating possible conditions of the environments where MFCs could be used (soils, water conducts, etc.). Water leaching was estimated as grams of water leached from each sample after 24 h.
Surface Analysis
Optical observations of the composite sample surfaces were performed using Olympus Stereo Microscope SZ. Scanning Electron Microscopy (SEM) Zeiss SEM EVO 50 microscope was used to analyze the morphology of the pyrolyzed samples.
3D Microcomputed Tomography Analysis
3D microCT (microtomography) technique was applied, and digitalized 3D objects of samples were generated. The used microCT is based on an open type X-ray source 160 kVp @ 200 μA, a flat panel detector, and a high-precision air-bearing rotating stage. For detailed information regarding components of the microtomography unit, it is referred to as Santini (Santini et al., 2013). The objects to be investigated were placed on the stage and rotated by small angular steps. 2D radiographs were acquired at each rotation step. X-ray tube voltage and amperage, step angle, and acquisition time were adapted to the measurement task and amounts of 120 kV, 14 μAtarget, 0.075°, and 1.5 s, respectively. During acquisition, the projections were corrected for charge accumulation of the detector, the so-called “dark-field”, and were normalized by “bright-field” correction. The latter characterizes the nonuniform system response due to variation in detector sensitivity and X-ray source flux density. The normalized projections are, then, reconstructed using standard filtered back-projection algorithms. Here, the volume reconstruction is computed by the commercial software VGStudio MAX®. The resolution of the obtained 3D microCT objects was determined with a special calibration and amounts 15.856 μm (Santini et al., 2016).
For the binarization of volumes in solid and void spaces, a watershed algorithm on the high gradient magnitude was applied using the commercial software Avizo®. The subdivision in single pores was obtained by a combination of watershed, distance transform, and numerical reconstruction algorithm. Hereby, the marker extent factor was set to 4 and the connectivity to 26. This operation was conducted in 3D.
Results
The optical micrograph images of the two types of composites (A and B) are reported in Supplementary Figure S2. The granular structure of the biochar achieved from the pyrolysis of the sole giant cane chippings, before (a) and after (b) crushing, is illustrated in the SEM micrographs of Figure 1. Traces of the cellular structure are clearly visible in the pyrolyzed chippings of giant cane, while it is completely missed in the biochar after crushing.
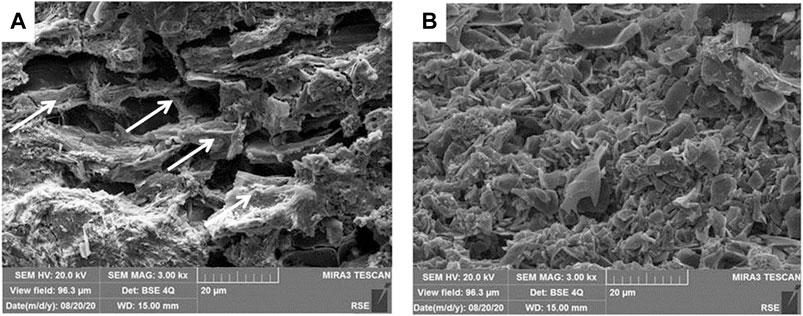
FIGURE 1. SEM micrographs (800×) of pyrolized chippings of A.Donax L. before crushing (A) and after crushing (B). Arrows indicated the preserved structure of the cellulosic vegetal wall.
Microstructure of Composites
The different microstructures of the composites A and B are well evidenced by the documentation of the microCT volumes reported in Figures 2 and 3 and in Supplementary Figure S3.
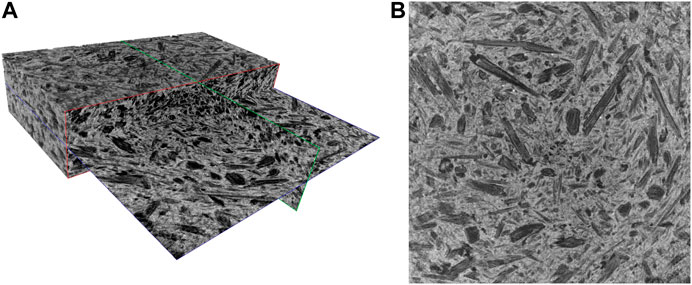
FIGURE 2. 3D microCT render (A) and representative slice (B) of the composite A30%. The volume has a dimension of 20.6 × 20.6 × 4.8 mm3.
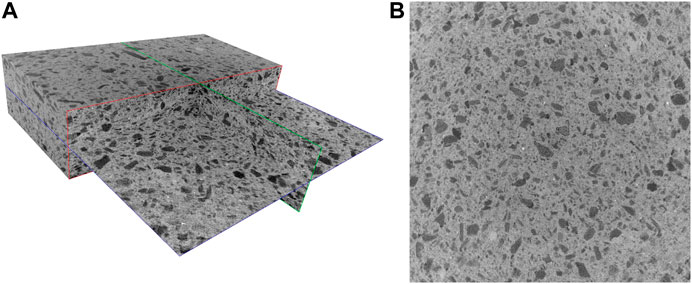
FIGURE 3. 3D microCT render (A) and representative slice (B) of the Composite B30%. The volume has a dimension of 20.6 × 20.6 × 4.8 mm3.
Figures 2 and 3 depict a 3D rendering of the structures of composites A30% and B30%, respectively. The pore size distribution and porosity of representative rectangular cuboid sub-volumes (having dimensions of 20.6 × 20.6 × 4.8 mm3) were determined. Figure 4 shows the pore size’s probability density functions of composites A30% and B30%.
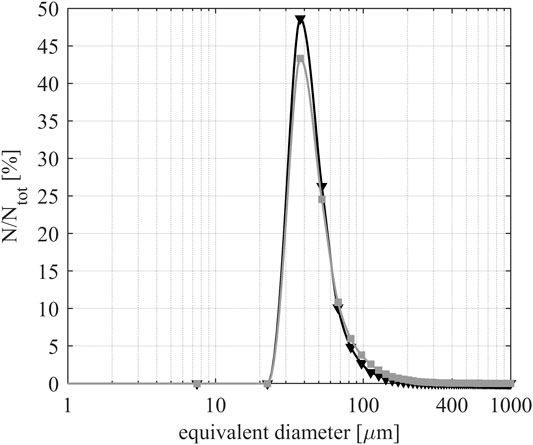
FIGURE 4. Probability density functions of the pore space of composites A30% (black) and B30% (gray).
The given pore sizes correspond to the diameter of volume-equivalent spheres. Both composites have similar-sized pores. For the determination of the porosity, voxels assigned to each class were counted. The porosity is obtained by ϕ = VporesV−1. The values of four different composites are summarized in Table 2 and their representative slices are shown in Supplementary Figure S3.
It is worth stressing that a filamentous-globular structure of the vegetal giant cane is partially preserved in the sample of Composite A (dark areas), while carbon results are more smoothed and uniformly mixed with terracotta in Composite B. The increased content of filamentous carbon in the terracotta and matrix is evidenced for Composite A05%, A10%, and A30% and for Composite B30% is evidenced by the microCT slices shown in Supplementary Figure S3. Such structures, rather absent in the more compact and uniform composite B, formed a sort of connected porous network through the terracotta matrix in composite A (Figure 2).
Electrical Resistivity and Capacity
Dry Samples
More than nine orders of magnitude space the values of electrical resistivity ρ of the pure biochar (few Ω cm) from the value of the (insulating) clay (>109 Ω cm, the limit of instrumentation) of dry samples. The electrical resistance of the composite B was always greater than 1000 kΩ cm for all samples, sticking by terracotta ones. On the contrary, several orders of magnitude separate the resistivity value of composite A vs the pure clay, in all conditions. The ρ value was reduced to less than 1 kΩ cm, increasing the carbon content, but it was highly variable depending on the point of the measurement. The averages of ρ values for composite A of different carbon percentages were reported in Table 3.

TABLE 3. Electric resistivity (ρ) and capacitance (C) estimated on dry and wet samples of composite A with a thickness of 8 mm.
The variation of ρ values, induced by changing the carbon percentage in the range 1–30% and the sample thickness (4 mm, 8 mm, 12 mm), is shown at a logarithmic scale in the histograms of Supplementary Figure S4, for both composites A and B. The decrease was drastic and proportional to the carbon percentage for composite A samples. Data were more dispersed for composite B, and the tendency to reduce the resistivity value increasing the carbon percentage was not as evident as for the composite A, where the dispersion of data was evident for samples of different thicknesses, particularly high only for samples with a minimal percentage of carbon, up to 10%.
Wet Samples
Electrochemical systems typically work with conductive water solutions and preserve wet conditions when microbial biofilm develops. Therefore, the resistivity was also measured on wet samples for both composite A and B. Tests were carried out after the water capacity test with 8 mm thick samples. The water conductivity was 0.5 mS cm−1. This condition simulates a freshwater environment penetrating the porous composites. Filling the pores, the conductive solution tightly connects the single carbon particle of the composites influencing, in this way, the electric resistivity and capacity of the materials. The average data of capacitance C and resistivity ρ of composite A from the measurement performed in wet conditions are reported in Table 3. The logarithm of ρ averages, plotted in function of carbon percentage, is also shown in the graphic of Figure 5. Two relevant linear tendencies were evidenced for this graphic. The first underlines a linear changing of ρ of several orders of magnitude when low percentages of carbon were added to terracotta. The second underlines a linear tendency of ρ to quickly decrease close to the value of the pure biochar for carbon contents higher than 10%.
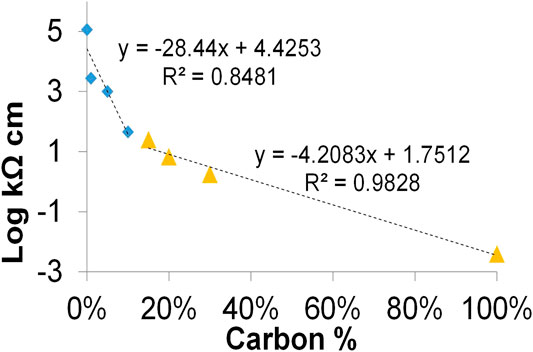
FIGURE 5. Graphic of the average of the electrical resistivity for composite A measured at different carbon %. The linear equation and regression coefficient (R2) for values in the range 0–10 % (blue rhomboid points) and 15–100 % (orange triangles) are reported.
The resistivity decreases more than one order of magnitude for wet samples and stabilizes at similar values, inferior to 1 kΩ, for samples having a carbon content higher than 10%. These data confirm the increase of electric contacts, due to the presence of a (slightly) conductive solution filling the void space of materials.
The strong decrease of the electrical resistance of composite A is obviously due to the presence of a connected filamentous structure of biogenic carbon particles in composite A, documented in Figure 2. Stable and numerous electrical contacts between the single carbon particles were formed during the pyrolysis process, pressed in the porous terracotta matrix, which is still the main component of the composite. For composite B (Figure 3), the clay isolated the carbon particle before the pyrolysis, hindering the stabilization of tight electrical contacts during the pyrolysis process. Indeed, the values of material resistivity of composite B did not express a net correlation with the carbon percentage, remaining in the range of MΩ and sticking close to the values of the pure clay.
Electrical Capacitance
The average electrical capacitance measured for all wet samples with 8 mm of thickness is shown in Table 3. Values were negligible, or very low, for all dry samples of both composite A and B, but they significantly increased with the increase of carbon content for composite A, confirming the presence of an increasing hygroscopic conductive carbon surface in this compound.
Water Retention Capacity and Leaching
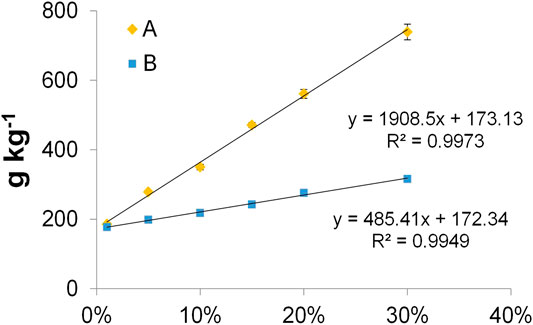
The porosity of the different mixes is in direct correlation with the water retention capacity of the samples. Indeed, water fills the micro and macropores of the material, penetrating the composite. Data of water absorbed after 24 hours of immersion are reported in Supplementary Table S1. This parameter directly correlates with the increase of carbon percentage for all samples, as shown in the graphic of Figure 6. Due to the higher intrinsic porosity of biochar than terracotta, it is an expected behavior. However, the water adsorption raised almost one order of magnitude for composite A while it almost doubled for composite B.
The higher capacity of water retention of composite A than B, at the same carbon/clay percentage, indicates that the pyrolysis of a mix of giant cane chippings and clay induces the formation of larger pores inside the composite than the pyrolysis of biochar and clay. This agrees with porosities calculated from microCT data.
The role of the difference in the porosity of biochar formed in a single step of pyrolysis (composite A) and in two steps pyrolysis (composite B) is also underlined by the water leaching, measured at 0.5, 1, and 1.5 m of a water column. The water leaching was always lower than 0.01 ml h−1 for the sole biochar samples and similar values were found for all tested samples of composite B (Data in Supplementary Table S2). On the contrary, water leaching increased more than one order of magnitude for composite A under a water pressure of 1.5 m when the carbon percentage increased in the samples from 1 to 10%. Data of an enhanced water leaching related to the pressure increase for composite A are reported in Supplementary Table S2 (averages of replicates), and relative histograms are plotted in the graphics of Supplementary Figure S5. The kinetics of water leaching through different sample sections (4, 8, and 12 mm) of composite A are shown in Figure 7. Graphics evidence that the linear increase of water leaching stabilizes among sample thicknesses, increasing the carbon percentage to 10%.
Discussion
The achieved data are congruent and suggest that the pyrolysis of raw residual biomass, if mixed with clay, produces a solid material (composite A) that is differently performing than one (composite B) produced by pyrolysis of pre-pyrolyzed biomass and clay, in terms of porosity, electrical conductivity, water retention, and leaching.
The structured and connected carbon network of composite A (Figure 2 and Supplementary Figure S1) can justify its lower resistivity in comparison with composite B. Numerous electrical contacts among filamentous carbon particles are built in the matrix of composite A under the pressure of gas bubbles forming and entrapped in the terracotta during the pyrolysis process of biomass. An even greater decrease of the electrical resistivity of Composite A is, therefore, expected with an increase of the biomass percentage over 30%, and with further optimization of the pyrolysis parameters. Such a phenomenon cannot occur for composite B, where the clay envelops already-structured biochar particles, working as a perfect insulator among them. Biochar, indeed, does not change the structure during the second step of pyrolysis and does not produce additional gas. In agreement with this explanation, the electrical resistivity and capacity of composite B do not show any correlation with their carbon percentage content, remaining in the range of MΩ and sticking close to the values of the pure clay in all cases, also occurring when carbon represents the main component of the composite.
On the other hand, it can be remarked that the biochar from giant cane has a relatively low resistivity value (4 Ωcm), which slightly differs from the value (2.8 Ωcm) of resistivity of carbon cloth commonly used in microbial fuel cells. This conductive biochar was recently tested as an air-cathode electrode of microbial fuel cells targeted to nutrients’ recovery from wastewaters (Marzorati et al., 2018). In those experiments, the charge transfer between the electrodes was catalyzed by bacteria settled in the biochar. The current generated, even if low, was sufficient to sustain the bioelectrochemical process.
Two orders of magnitude separate the values of electrical resistivity characterizing the composite A30% (2.4 kΩ cm) vs the pure biochar (3.6 Ω cm), and several orders of magnitude in the other cases. This relevant difference makes both composites A and B unattractive for their exploitation as MES electrodes.
Analyzing the results from another perspective, composite A turns out to be more suitable as an advanced electrolytic separator for an MES. It can allow anodic bacteria to colonize the pores of biochar larger than a few microns, which are absent in the pure terracotta. A pure terracotta separator, indeed, impedes the microbial transfer from the anodic chamber to the cathode (Goglio et al., 2019a; Goglio et al., 2019b). Suitably selecting the carbon percentage, it could be possible to control, or enhance, the passage of water and the microorganisms inside the MES system. A similar condition as in the membraneless microbial fuel cells could be reproduced, where the growth of bacteria on the aerobic cathode (as well on the anode) impedes the incoming of oxygen in the anolyte [Rago et al., 2017; Rago et al., 2018]. Another advantage of this new type of separator could be the improved mechanical property of the system, allowing compact designs and miniaturization. Besides, another recent work (Neethu et al., 2019) proved that composite materials of biochar and terracotta can be a cost-effective alternative to Nafion®117 for microbial fuel cells, enhancing ionic hopping inside the material.
Most relevantly, the possibility of reducing electrical resistivity of composite A by simply changing its biogenic carbon percentage lends itself best to be used as the electric connection between the anode and cathode of a MES, replacing the standard external circuit made of a resistor and metal wires. Common electrical resistance usually ranges between 0.1 and 1 kΩ: these values are simply achievable mixing a relatively low percentage of carbon with clay (>30%).
The current between the two electrodes (anode and cathode) can be thus suitably limited by tuning the thickness of the separator, as well as the composition ratio of carbon and clay, in function of the application and the environment for it to be applied on. The possibility of using composite A as a performing electrolytic separator between two electrodes in an innovative MFC concept is sketched in Figure 8.
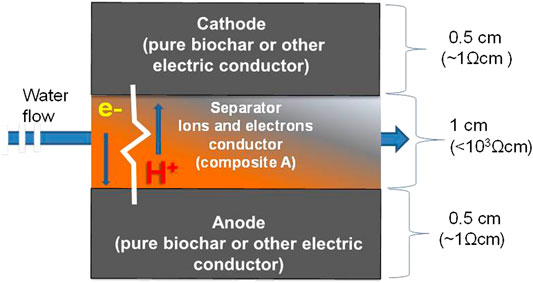
FIGURE 8. Schematic of a composite solid MES unit, whose electrodes are physically separated by a composite A made of a suitable mix of biochar and terracotta having an electrical resistance of about 1 kΩ.
Based on the achieved results of water leaching, it can be assumed that using a layer of composite A of less than 1 cm and less than 30% of carbon as separator in an MFC, the water permeability could be high enough to allow the total wetting of the material and continuous water transport across the system, under a relatively low pressure of water. Such a configuration could also be suitable for application in a flowing MFC system, even for tubular or arbitrary shaped and scaled cells.
Proof of Concept of the New Conductive Separator
As a simple proof of concept, the performance of different composite separators was tested in single-chamber MFCs (Supplementary Figure S4). Each selected composite sample (0%, A30%, and B30%) was used to physically connect the anode (carbon cloth of 3 cm) and the air cathode (a titanium grid with an estimated projected surface of about 1 cm2) of each MFC, avoiding any external electric circuit. For this, the side of the separator facing the anolyte was tightly pressed to a strip of the carbon cloth, while the other face of the separator was pressed to the titanium grid exposed to air.
The test consisted of checking the capability of the MFCs to produce power across the separator. If the resistance of the separator is too high, the electrodes operate in an open circuit condition. Consequently, the MFC cannot work. On the contrary, when the ohmic resistance of the composite converges with the internal resistance of the MFC, the circulating current is maximized, and the power can peak. Anaerobic conditions at the anode are necessary to create an electromotive force between a more negative anode and a more positive cathode.
Experiments were carried out with a medium of anoxic activated sludge collected from the Milano-Nosedo wastewater plant (Milano, Italy), enriched with 1 g L−1 of sodium acetate as fuel. Tests lasted nine days. Conductivity and pH of the solution (anolyte) were measured at the beginning and at the end of the test, in each MFC (Supplementary Table S4). No significant differences were detected for these parameters among the MFCs.
The potential of the anode and the cathode were measured vs an Ag/AgCl electrode (3 M, Amel, Italy) immersed in the anolyte just for the time of the measurements, on a daily basis. Results are plotted in the graphics of Figure S8 and data are reported in Supplementary Tables S5–S7.
Results show that anodes, similar in all MFCs, become anaerobic in a few days. Cathode potentials were almost constantly positive in the case of MFCs with composite A30% and in one case of composite B30% (which probably suffered because of significant cracks inside the terracotta matrix), while it became negative in the other cases. Possibly, a scarce wetted condition of terracotta and composite B30% separators impeded a good contact with the cathode (airside), so that the measure was most significantly influenced by the negative redox potential of the anolyte, where the reference electrode was immersed.
On the last day of the test, a polarization curve from the MFC voltage to 10 mV between anode and cathode (anode used as working and cathode as counter electrode) was acquired for each MFC.
Only the MFCs with the composite A30% were able to produce power, although very low (about 0.04 μW), reaching a maximum power peak in correspondence of resistance of about 1 kΩ, as shown in the graphics of Figure 9. For the other cases, as expected, data suggest that an open circuit condition between electrodes prevailed.
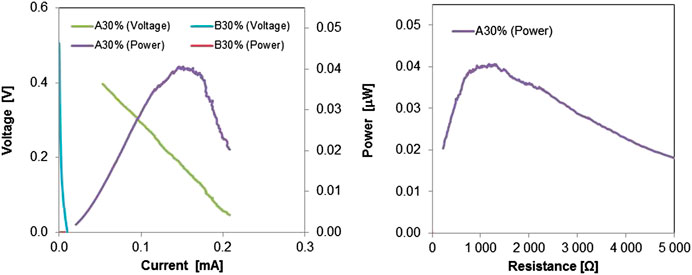
FIGURE 9. Power curves of single-chamber MFCs equipped with a composite 30%A and 30%B, respectively, connecting the anode to the cathode instead of the external circuit. The power curve plotted vs the corresponding resistance is also plotted.
The produced power density is estimated in 40 mW m−2, normalized to the projected cathode surface. The same power density was achieved in MFCs from previous tests with lignocellulosic separators having an internal resistance of around 60–90 Ω (Marzorati et al., 2018). Unequivocally higher performance (2,250 ± 21 mW m−2) were noticed with most optimized MFCs using other types of electrolytes and an external circuit connecting electrodes with a resistance of 1000 Ω (Daud et al., 2020). Here it is important to underline as a proof of concept, that the composite A30%, among the tested ones, acted as an external circuit of about 1,000 Ω, in the terms shown in the schematic of Figure 8.
At the end of the experiment, composite samples were collected from the MFCs for observations. The side exposed to the anolyte of each separator showed that a visible rich biofilm had grown (Supplementary Figure S7).
Each operated composite sample was then dried in an oven for 30 min and fixed by gold before being observed by Scanning Electron Microscopy. SEM micrographs of the transversal section of each tested composite separator (0%, A30%, and B30%) are reported in Figure 10.
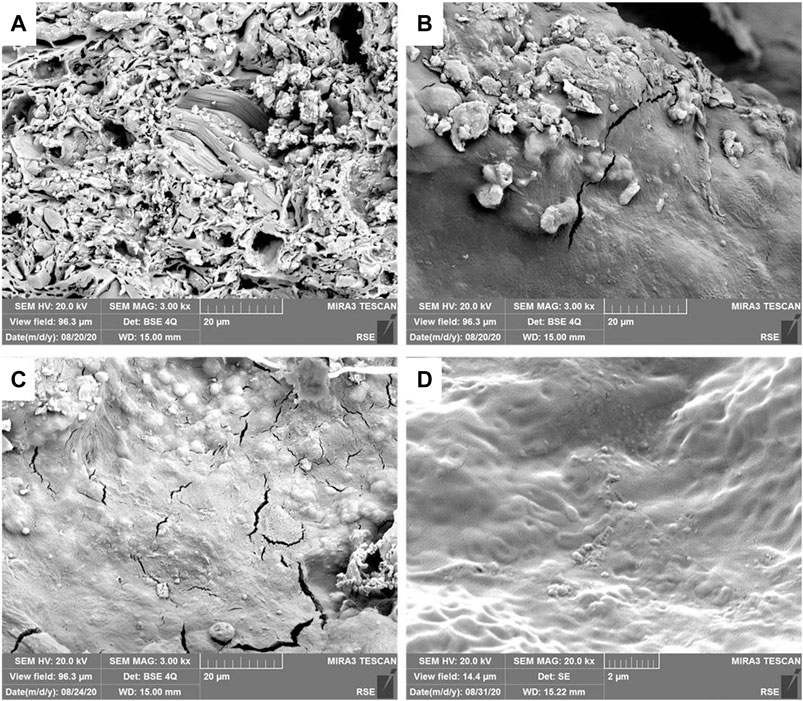
FIGURE 10. SEM Micrographs of transversal section of composite after the operation in the MFCs. (A) terracotta (0%); (B) composite B30%; (C) composite A30%; (D) composite A30% at higher magnitude, most evidently showing bacteria shapes.
Biofilm was not found inside the terracotta sample, as expected. More biofilm was detected on one of the composite B30%, which presented cracks inside and more positive cathode potential. Traces of biofilm were also detected in the carbon component of the other sample of the B30% composite. A consistent layer of biofilm and abundant bacteria on the surface were documented through the entire section of the composites A30%, whose cathode sides were also the most wetted ones. For the electrical conductivity, this last result is relevant, because wet conditions across the MFC system can be crucial to maintain microbial fuel cells operating in environmental applications, such as in the soil, where the humidity variation can strongly affect the MFC performance.
Although the experiment was short and the used MFC system was low performing, the results clearly underline the suitability of Composite A as an electrolytic and electric conductor in an MFC, as sketched in Figure 8.
Furthermore, the simple preparation of composite A through a single step of pyrolysis of raw biomass and clay enhances its attractiveness for cost-effective MESs.
Terracotta and biochar are widely recognized materials for use in agriculture, i.e. as soil fertility promoters or plant containers, respectively. Considering the possibility of remediating soil and water, as well as recovering nutrients with the microbial fuel cell technology, the large-scale application of terracotta-biochar composite in MFCs is particularly promising in the perspective of a circular economy concept.
Conclusion
A new composite material, produced by the pyrolysis of raw biomass mixed with clay, can cover the double function of ion and electron conductors. Mixing a relatively low biomass proportion with clay (i.e. 30% w/w carbon, balance clay), it is possible to produce solid and porous biochar-terracotta composites whose electrical resistivity can decrease to less than 1,000 Ω and reduces when wetted by water. Such electrical resistance falls in the range usually used for connecting the electrodes of MFC through an external circuit.
This new composite allows, therefore, a new and revolutionary concept of microbial fuel cells including the electric circuit inside the electrolytic separator.
Eliminating the necessity of external electric circuits, simple and robust devices can be produced, based solely on natural components (residual biomass and clay), that could simplify the large-scale application of MFC technology for environmental application, such as bioremediation of water and soils and recovery of nutrients for agriculture in a circular economy concept.
The low cost of the components (biochar and terracotta) and the low technological level required for their preparation (clay and residual biomass to be pyrolyzed) could allow a large-scale production and re-use of this MES type in low technological contexts as well as in industrialized countries (Li et al., 2011).
Data Availability Statement
The original contributions presented in the study are included in the article/Supplementary Material, further inquiries can be directed to the corresponding author.
Author Contributions
AG and SM drove the research and were responsible with AS for data collection and Empirical Results, SF-S drove analysis and was responsible for 3D microCT, and revised the full manuscript. PC was responsible for the concept and drove and revised the manuscript. All authors contributed to the article and approved the submitted version.
Funding
This work was financed by the SIR 2014 Grant (PROJECT RBSI14JKU3), Italian Ministry of University and Research (MIUR) and the Research Fund for the Italian Electrical System (Decree: MISE, April 16, 2018).
Conflict of Interest
The authors declare that the research was conducted in the absence of any commercial or financial relationships that could be construed as a potential conflict of interest.
Acknowledgments
The contribution of Andrea Parozzi for the resistance and capacitance tests is gratefully acknowledged.
Supplementary Material
The Supplementary Material for this article can be found online at: https://www.frontiersin.org/articles/10.3389/fenrg.2020.581106/full#supplementary-material
References
Ajayi, F. F., and Weigele, P. R. (2012). A terracotta bio-battery. Bioresour. Technol. 116, 86–91. doi:10.1016/j.biortech.2012.04.019
Bakonyi, P., Koóka, L., Kumar, G., Tóth, G., Rózsenberszki, T., Duc, D., et al. (2018). Architectural engineering of bioelectrochemical systems from the perspective of polymeric membrane separators: a comprehensive update on recent progress and future prospects. J. Membr. Sci. 564, 508–522. doi:10.1016/j.memsci.2018.07.051
Behera, M., Jana, P. S., and Ghangrekar, M. M. (2010). Performance evaluation of low cost microbial fuel cell fabricated using earthen pot with biotic and abiotic cathode. Bioresour. Technol. 101, 1183–1189. doi:10.1016/j.biortech.2009.07.089
Cristiani, P., Carvalho, M. L., Guerrini, E., Daghio, M., Santoro, C., and Li, B. (2013). Cathodic and anodic biofilms in single chamber microbial fuel cells. Bioelectrochemistry 92, 6–13. doi:10.1016/j.bioelechem.2013.01.005
Daud, S. M. , Daud, W. R. W., Bakar, M. H. A., Kim, H. B., Somalu, M. R., Muchtaer, A., et al. (2020). Low-cost novel clay earthenware as separator in microbial electrochemical technology for power output improvement. Bioproc. Biosyst. Eng. 43, 1369–1379. doi:10.1007/s00449-020-02331-7
Elmekawy, A., Hega, C., and Pant, D. (2014). Review on the near-future integration of microbial desalination cell with reverse osmosis technology. Energy Environ. Sci. 12, 3921–3933. doi:10.1039/x0xx00000x10.1039/c4ee02208d
Giudicianni, P., Cardone, G., Sorrentino, G., and Ragucci, R. (2014). Hemicellulose, cellulose and lignin interactions on Arundo donax steam assisted pyrolysis. J. Anal. Appl. Pyrolysis 110, 138–146. doi:10.1016/j.jaap.2014.08.014
Goglio, A., Marzorati, S., Rago, L., Pant, D., Cristiani, P., and Schievano, A. (2019a). Microbial recycling cells: first steps into a new type of microbial electrochemical technologies, aimed at recovering nutrients from wastewater. Bioresour. Technol. 277, 117–127. doi:10.1016/J.BIORTECH.2019.01.039
Goglio, A., Tucci, M., Rizzi, B., Colombo, A., Cristiani, P., and Schievano, A. (2019b). Microbial recycling cells (MRCs): A new platform of microbial electrochemical technologies based on biocompatible materials, aimed at cycling carbon and nutrients in agro-food systems. Sci. Total Environ. 649, 1349–1361. doi:10.1016/j.scitotenv.2018.08.324
Kappler, A., Wuestner, M. L., Ruecker, A., Harter, J., Halama, M., and Behrens, S. (2014). Biochar as an Electron shuttle between Bacteria and Fe(III) minerals. Environ. Sci. Technol. Lett. 1, 339–344. doi:10.1021/ez5002209
Kondaveeti, S., Kakarla, R., Kim, H. S., Kim, B., and Min, B. (2018). The performance and long-term stability of low-cost separators in single-chamber bottle-type microbial fuel cells. Environ. Technol. 39 (3), 288-297doi:10.1080/09593330.2017.1299223
Kondaveeti, S., Lee, J., Kakarla, R., Kim, H. S., and Min, B. (2014). Low-cost separators for enhanced power production and field application of microbial fuel cells (MFCs). Electrochimica Acta 132, 434–440. doi:10.1016/j.electacta.2014.03.046
Kondaveeti, S., Moon, J. M., and Min, B. (2017). Optimum spacing between electrodes in an air-cathode single chamber microbial fuel cell with a low-cost polypropylene separator. Bioproc. Biosyst. Eng. 40, 1851–1858. doi:10.1007/s00449-017-1838-3
Li, W.-W., Sheng, G.-P., Liu, X.-W., and Yu, H.-Q. (2011). Recent advances in the separators for microbial fuel cells. Bioresour. Technol. 102, 244–252. doi:10.1016/j.biortech.2010.03.090
Longhi, M., Marzorati, S., Checchia, S., Sacchi, B., Santo, N., Zaffino, C., and Scavini, M. (2016). Sugar-based catalysts for oxygen reduction reaction. Effects of the functionalization of the nitrogen precursors on the electrocatalytic activity. Electrochimica Acta 222, 781–792. doi:10.1016/j.electacta.2016.11.036
Marzorati, S., Goglio, A., Fest-Santini, S., Mombelli, D., Villa, F., Cristiani, P., and Schievano, A. (2018). Air-breathing bio-cathodes based on electro-active biochar from pyrolysis of giant Cane stalks. Int. J. Hydrogen Energy 44 (9), 4496–4507. doi:10.1016/j.ijhydene.2018.07.167
Mathuriya, A. S., and Pant, D. (2018). Assessment of expanded polystyrene as a separator in microbial fuel cell. Environ. Technol. 40 (16) 2052–2061. doi:10.1080/09593330.2018.1435740
Milner, E. M., Popescu, D., Curtis, T., Head, I., Scott, K., and Yu, E. H. (2016). Microbial fuel cells with highly active aerobic biocathodes. Journal of Power Sources 324, 8–16. doi:10.1016/j.jpowsour.2016.05.055
Neethu, B., Bhowmick, G. D., and Ghangrekar, M. M. (2019). A novel proton exchange membrane developed from clay and activated carbon derived from coconut shell for application in microbial fuel cell. Biochem. Eng. J. 148, 170–177. doi:10.1016/j.bej.2019.05.011
Ng, K. S., Head, I., Premier, G. C., Scott, K., Yu, E., Lloyd, J., et al. (2016). A multilevel sustainability analysis of zinc recovery from wastes. Resour. Conserv. Recycl. 113, 88–105. doi:10.1016/j.resconrec.2016.05.013
Pasternak, G., Greenman, J., and Ieropoulos, I. (2015). Comprehensive study on ceramic membranes for low-cost microbial fuel cells. ChemSusChem 9 (1) 88–96. doi:10.1002/cssc.201501320
Prado, A., Berenguer, R., and Esteve-Núñez, A. (2019). Electroactive biochar outperforms highly conductive carbon materials for biodegrading pollutants by enhancing microbial extracellular electron transfer. Carbon 146, 597–609. doi:10.1016/J.CARBON.2019.02.038
Rago, L., Cristiani, P., Villa, F., Zecchin, S., Colombo, A., Cavalca, L., et al. (2017). Influences of dissolved oxygen concentration on biocathodic microbial communities in microbial fuel cells. Bioelectrochemistry 116, 39–51. doi:10.1016/J.BIOELECHEM.2017.04.001
Rago, L., Zecchin, S., Marzorati, S., Goglio, A., Cavalca, L., Cristiani, P., et al. (2018). A study of microbial communities on terracotta separator and on biocathode of air breathing microbial fuel cells. Bioelectrochemistry 120, 18–26. doi:10.1016/j.bioelechem.2017.11.005
Ramírez-Moreno, M. J., Romero-Ibarra, I. C., Ortiz-Landeros, J., and Pfeiffer, H. (2014). “Alkaline and alkaline-earth ceramic oxides for CO 2 capture, separation and subsequent catalytic chemical conversion,” in CO2 sequestration and valorization. doi:10.5772/57444
Santini, M., Fest-Santini, S., and Foltyn, P. (2016). On the local mass transfer rates around arbitrary shaped particles calculated by X-ray computed microtomography: prospective for a novel experimental technique. Int. Commun. Heat Mass Tran. 79, 135–139. doi:10.1016/j.icheatmasstransfer.2016.11.001
Santini, M., Guilizzoni, M., and Fest-Santini, S. (2013). X-ray computed microtomography for drop shape analysis and contact angle measurement. J. Colloid Interface Sci. 409, 204–210. doi:10.1016/j.jcis.2013.06.036
Santoro, C., Arbizzani, C., Erable, B., and Ieropoulos, I. (2017). Microbial fuel cells: from fundamentals to applications. A review. J. Power Sources 356, 225–244. doi:10.1016/j.jpowsour.2017.03.109
Santoro, C., Artyushkova, K., Gajda, I., Babanova, S., Serov, A., Atanassov, P., et al. (2015). Cathode materials for ceramic based microbial fuel cells (MFCs). Int. J. Hydrog. Energy 40 (42), 14706–14715. doi:10.1016/j.ijhydene.2015.07.054
Schievano, A., Berenguer, R., Goglio, A., Bocchi, S., Marzorati, S., Rago, L., et al. (2019). Electroactive biochar for large-scale environmental applications of microbial electrochemistry. ACS Sustain. Chem. Eng. 7 (22), 18198–18212. doi:10.1021/acssuschemeng.9b04229
Sengupta, S., Nawaz, T., and Beaudry, J. (2015). Nitrogen and phosphorus recovery from wastewater. Curr. Pollution Rep. 1, 155–166. doi:10.1007/s40726-015-0013-1
Tiquia-Arashiro, S.M., and Pant, D. (2020). Microbial Electrochemical technologies. Boca Raton, FL: CRC Press, 518. doi:10.1201/9780429487118
Viggi, C. C., Simonetti, S., Palma, E., and Aulenta, F. (2017). Enhancing methane production from food waste fermentate using biochar: The added value of electrochemical testing in pre-selecting the most effective type of biochar. Biotechnol Biofuels 10, 303–313. doi:10.1186/s13068-017-0994-7
Walter, X. A., Gajda, I., Forbes, S., Winfield, J., Greenman, J., and Ieropoulos, I. (2016). Scaling-up of a novel, simplified MFC stack based on a self-stratifying urine column. Biotechnol Biofuels 9, 93. doi:10.1186/s13068-016-0504-3
Winfield, J., Greenman, J., Huson, D., and Ieropoulos, I. (2013). Comparing terracotta and earthenware for multiple functionalities in microbial fuel cells. Bioproc. Biosyst. Eng. 36 (12) 1913–1921. doi:10.1007/s00449-013-0967-6
Keywords: biochar, terracotta, electrical resistivity, composite materials, 3D tomography, bioelectrochemical systems, microbial fuel cells, microbial electrochemical systems
Citation: Cristiani P, Goglio A, Marzorati S, Fest-Santini S and Schievano A (2020) Biochar-Terracotta Conductive Composites: New Design for Bioelectrochemical Systems. Front. Energy Res. 8:581106. doi: 10.3389/fenrg.2020.581106
Received: 07 July 2020; Accepted: 02 November 2020;
Published: 03 December 2020.
Edited by:
S. Venkata Mohan, Indian Institute of Chemical Technology (CSIR), IndiaReviewed by:
Makarand M. Ghangrekar, Indian Institute of Technology Kharagpur, IndiaSanath Kondaveeti, Konkuk University, South Korea
Copyright © 2020 Cristiani, Goglio, Marzorati, Fest-Santini and Schievano. This is an open-access article distributed under the terms of the Creative Commons Attribution License (CC BY). The use, distribution or reproduction in other forums is permitted, provided the original author(s) and the copyright owner(s) are credited and that the original publication in this journal is cited, in accordance with accepted academic practice. No use, distribution or reproduction is permitted which does not comply with these terms.
*Correspondence: Pierangela Cristiani, cGllcmFuZ2VsYS5jcmlzdGlhbmlAcnNlLXdlYi5pdA==
 Pierangela Cristiani
 Andrea Goglio
 Stefania Marzorati
 Stephanie Fest-Santini
 Andrea Schievano