- School of Statistics and Information, Shanghai University of International Business and Economics, Shanghai, China
On 18 December 2015, the 40-years old U.S. crude oil export ban was repealed. Since then U.S. crude and oil producers were allowed to reach the global market. In this paper, we study if the crude oil market efficiency increases after the lift of the export ban via the Centered Detrending Moving average Analysis (CDMA) and the Detrended Fluctuation Analysis (DFA). We examine the time-varying market inefficiency from 2011 to 2020 with different rolling windows. The results indicate that WTI becomes inefficient after the lift in medium-term. Though in short and long-term, there is evidence for the improvement of the degree of market efficiency. Generally, the WTI market presents mixed efficiency behavior at different time horizons. In 1-year window, the degree of efficiency on Brent decreased while there isn't enough evidence to conclude that Brent market efficiency increased or decreased in medium and long term. In this sense, the lift of the ban might have significant impact on WTI but not on Brent.
1. Introduction
Crude oil is one of the most important commodity in global economy. And crude oil market is increasingly connected to other financial markets. The market efficiency on crude oil market is crucial to price discovery, forecasting and investment management. There is a large number of literature on crude oil market weak-form efficiency.
The presence of long-range dependence in asset returns implies potential predictability, which contradicts the weak form of efficient market [1]. Hurst exponent is a popular measure of long range memory and has been widely applied to the test of weak form efficiency on crude oil market. Alvarez-Ramirez et al. [2] impose Rescaled Range (R/S) analysis on WTI from 1981 to 2002 and report the long-run memory. Serletis and Andreadis [3] get a similar conclusion with data from 1990 to 2001. Jiang et al. [4] verify the weak-form efficiency of the crude oil futures market from 1983 to 2012 with the Detrended Fluctuation Analysis (DFA) and Detrending Moving average Analysis (DMA).
One can conclude that the crude oil market is weak-form efficient in the long run, though over short time horizons the market might need a certain time to digest the information [4]. Tabak and Cajueiro [5] document that WTI and Brent become more efficient from 1983 to 2004. Via DFA, Alvarez-Ramirez et al. [6] find mixed scaling behavior in crude oil markets. The prices exhibit short-term predictability, while for large time horizons reflect non-correlated behavior. Wang and Liu [7] report that short-term, medium-term and long-term behaviors of WTI crude oil market were generally turning into efficient behavior over time. Mensi et al. [8] find efficiency degree of WTI and Brent varies through time. Jiang et al. [4] uncover that the market is inefficient during turbulent events, including the oil price crash in 1985 and the Gulf war. Gu and Zhang [9] verify the non-linear relationship between multifractality and inefficiency in crude oil market. Kristoufek [10] reports that the WTI remains efficient except several periods, while Brent crude oil shows more inefficiency.
Notice that the crude oil market is affected by economic conditions [11], political events [12], policy changes [13, 14] and other factors, dynamics of the efficiency on crude oil market during events and crisis is of cardinal significance to investors as it indicates possible abnormal returns. This study focuses on the time-varying efficiency on crude oil market before and after the policy shift.
In 1970s the United States government enacted prohibitions on the export of crude oil to handle concerns on possible energy shortage [15]. The ban restricted most crude oil exports from U.S. to other countries. On 18 December 2015, President Obama signed a provision that lifted the 40-years old oil export ban. After the lift, the lead-lag relationship between WTI and Brent has changed [14] and the two benchmarks reconnected closely [13, 14]. However, the impact of this policy shift on crude oil market efficiency is still open to question.
In this paper we explore whether the crude oil market efficiency changes after the lift using WTI Brent daily price. We assess the time-varying market efficiency via the Centered Detrending Moving average Analysis (CDMA) and DFA. To compare the difference of market efficiency before and after the lift, we separate the whole sample into two time periods by the lift, then implement the Wilcoxon signed-rank test. We investigate the time-varying long range dependence over rolling windows. For the sake of consistency, we carry out the whole procedure with three rolling window sizes.
The paper is organized as follows. Section 2 presents the Data. Section 3 describes the Methodology. Section 4 shows the Results, and section 5 Concludes and Discusses.
2. Data
We investigate the daily closing spot prices from the U.S. Energy Information Administration (EIA) website. The data spans from 14 October 2011 to 6 March 2020 with 2098 observations, which is plotted in Figure 1. Note that the vertical black line marks the date of 18 December 2015 when the lift was officially announced. Thereby the whole period is divided into two segments before and after the lift with the same 1049 sample sizes. The Brent and WTI price showed an impressive decrease of 60% from July 2014 to March 2015. Since 2016 until 2018 the price has steadily increased.
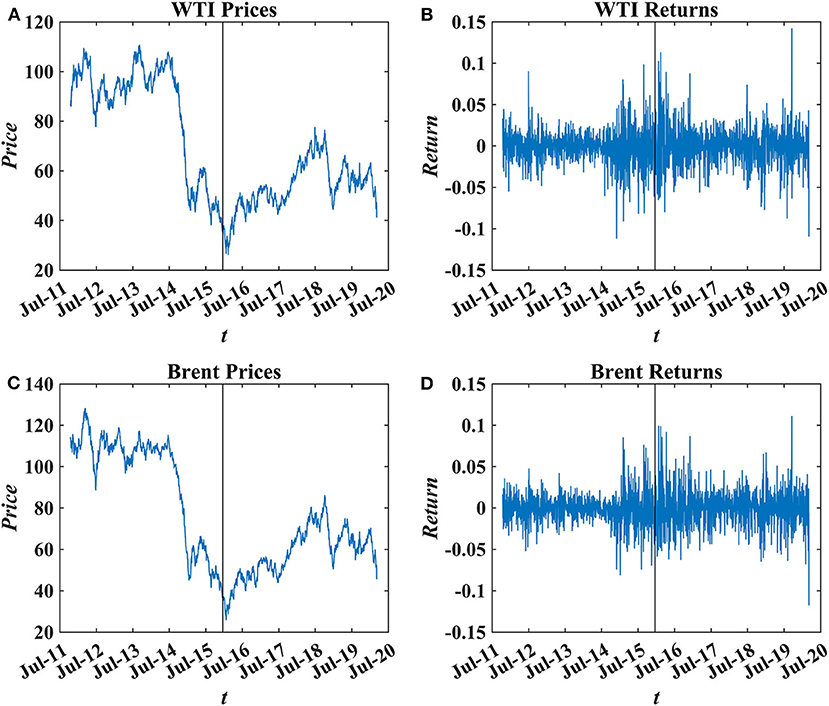
Figure 1. The daily spot prices and returns for WTI and Brent. The vertical line marks the lift of the export ban. (A) WTI prices. (B) WTI returns. (C) Brent prices. (D) Brent returns.
We employ daily returns for the analysis which are defined as the log difference in price:
where p(t) is the spot price at time t. The logarithm returns are illustrated in Figure 1. In 2014 and 2016 the process exhibits volatility clustering.
3. Methodology
3.1. Hurst Exponent Estimation Methods
We examine the market efficiency via the centered detrended moving average analysis (CDMA) and DFA. The two methodologies show comparable performance for the detection of long range correlation in time series [16–18], and have been widely used to determine the Hurst exponent in financial markets [19, 20].
3.1.1. The Detrended Fluctuation Analysis
The Detrended Fluctuation Analysis is a popular method to determine the long-range dependence in time series [21].
For a given time series x(t), t = 1, 2, ⋯ , N, compute the cumulative sum sequence
Detrend the integrated profile X(t) by subtracting the local trend in each box of length s and get the residual series ϵ(t):
where is the polynomial fit of X(t). Then separate the residual series ϵ(t) into Ns non-overlapped subseries with size s, where Ns = ⌊N/s−1⌋. Obtain the fluctuation function via
Repeat the procedure above with different box size s. Thus, one can determine the power-law relationship between F(s) and box size s for long-range correlated time series
where H is an estimation of Hurst exponent. If H>0.5, the time series x(t) displays long-range dependent structure. When H < 0.5, x(t) has long-range dependent structure. While H = 0.5 implies non-correlated behavior, which corresponds to weak-form efficiency in financial market.
3.1.2. The Detrending Moving Average Analysis
The DMA algorithm [22] is similar to DFA. Recently the understanding of DMA has been deepened and improved [23–27]. With DMA, one constructs the moving average function within a moving window with size s [28],
where s = s1+s2+1, s1 = ⌈(s−1)(1−θ)⌉, s2 = ⌊(s−1)(1−θ)⌋ and θ is the position parameter with range of 0 to 1 (forward, centered, and backward moving average analysis for θ = 0, θ = 0.5, and θ = 1, respectively).
We apply θ = 0.5 (CDMA) in this study.
3.2. The Rolling Window Technique
The rolling window technique has been successfully used to assess time dependent efficiency in financial markets [7, 8, 29–33], predict crash in stock market [34], and evaluate the level of stability of financial firms [35].
The length of the subsample analyzed at each time is defined as the rolling window size. This technique works as follows [34]: (i) compute the Hurst exponent of the first subsample with a certain rolling window size. Thus, one can probe the local long range correlation at time t = 1. (ii) Move the time window with a specific number of observations, namely the step size. (iii) Repeat the process until end of whole sample. Thereby one can calculate the local Hurst exponent. Time series before a given time t contributes to the local Hurst exponent at time t [34].
4. Results
We use CDMA and DFA to observe the long memory feature and time-varying inefficiency in WTI and Brent spot markets with rolling window technique. Rolling window size of DMA/DFA methods should be large enough to guarantee statistical significance and small enough to maintain the sensitivity to local changes [34–36]. Rolling window size under one trading year is recommended in case of possible seasonal periodicity and business cycles [34]. Another regular choice is 4-years window size [5, 7, 8, 10, 29], which corresponds to the political cycles in most countries [29]. Some studies apply an in-between size (2 years) [37, 38].
For the sake of consistency, we study market efficiency at different time horizons. We estimate the local Hurst exponent using three window sizes with a step size of one point: 250 datapoints (almost within 1 year), 500 datapoints (almost within 2 years), and 1,000 datapoints (almost within 4 years).
The choice of box size s is also essential for the detrending procedure. A too small or too big box size s can result in inaccurate estimate of local trend and curvature of the fluctuation function [16]. While box size s≧5, the slope of log-log fluctuation plot can be almost approximated by a linear curve [25, 34]. Accordingly we set the range as [5, L/10]. Figure 2 shows the fluctuation function F vs. s on 18 December 2015 with different rolling window sizes. Generally the CDMA curves seems quite straight. The DFA curves exhibit mild curvature.
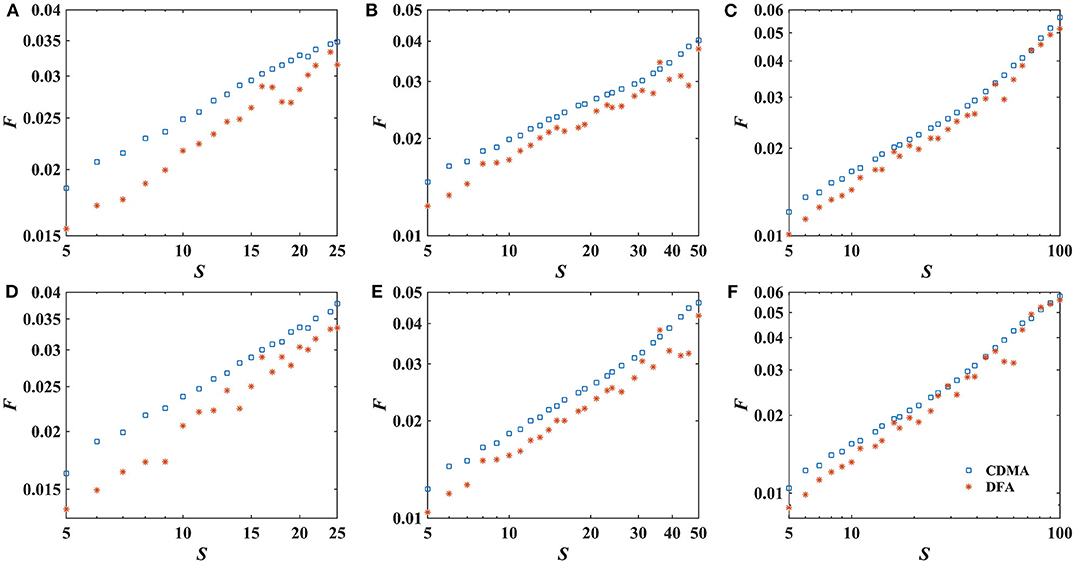
Figure 2. Fluctuation function F with different rolling windows on 18 December 2015. (A–C) Depict the fluctuation function of WTI. (D–F) Illustrate the fluctuation function of Brent. From left to right, each column corresponds to 1, 2, and 4 years window.
There are various methods used to study market efficiency. Traditionally variance ratio test, unit root test as well as long memory estimation by the Hurst exponent are popular procedures [39]. Except those methods, researchers have developed different measurements based on fractality measures [40]. Kristoufek and Vosvrda introduced Efficiency Index to measure capital market efficiency [41], then extended and applied to commodity futures [42], gold, currencies [43], and cryptocurrencies [44]. Gu et al. [45] use δH = |H−0.5| to quantify the degree of market inefficiency, while H is the Hurst exponent. Smaller δH implies a more efficient market. In this paper, we apply δH to estimate market inefficiency, which is a simple and effective measurement.
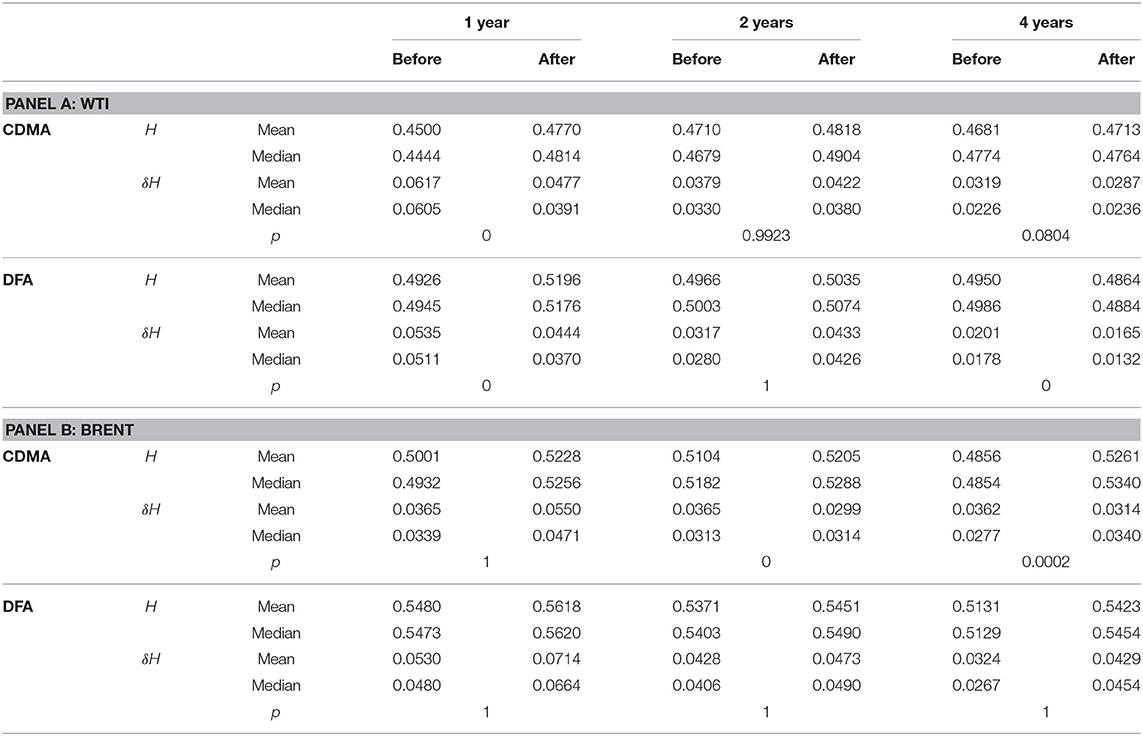
The dynamics of local Hurst exponents and market inefficiency δH are shown in Figure 3. The black vertical line represents the lift of the U.S. crude oil export ban on 18 December 2015. The corresponding histograms are illustrated in Figure 4. Then we report the statistics of Hurst exponent and δH Table 1.
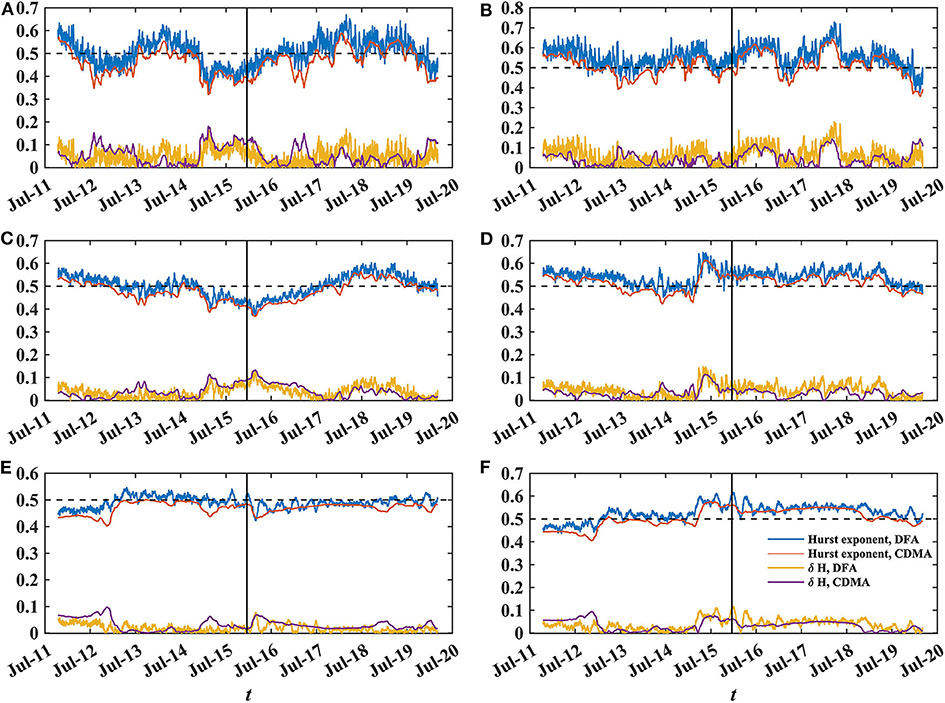
Figure 3. Time-varying Hurst exponent and δH of WTI (left panel) and Brent (right panel). The black line marks the lift of the ban. (A,B) 1 year rolling window. (C,D) 2 years rolling window. (E,F) 4 years rolling window.
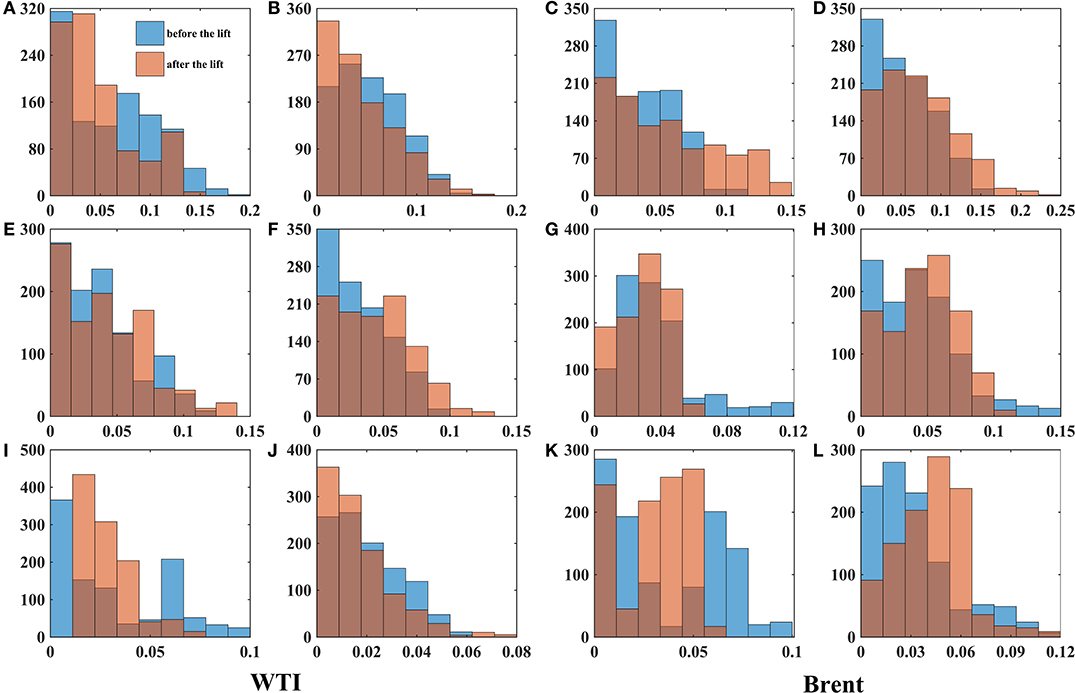
Figure 4. Histograms of δH. The first and second columns correspond to results of WTI via CDMA and DFA respectively. The third and fourth columns correspond to the results of Brent via CDMA and DFA respectively. (A–D) Corresponds to a rolling window size of 1 year. (E–H) 2 years rolling window. (I–L) 4 years rolling windows.
The local Hurst exponent moves around 0.5 and δH is generally < 0.15. Both the mean and median of local δH is extremely close to 0. All these indicate that the crude oil markets are almost efficient with different degrees [2–5, 10].
4.1. Long Memory of WTI and Brent Within Rolling Windows
Here we give a quick look at the time-varying market efficiency of WTI and Brent. With rolling window of 1 year, the market displays higher fluctuation compared with longer time horizons (see in Figures 3A,B). The WTI returns shows short range correlation between 2012 and 2013 as well as 2014 and 2017. The Hurst exponent of Brent moves above 0.5. Both WTI and Brent display mixed behavior which reveals inefficiency of market at short time horizon.
In the case of 2-years rolling window, WTI demonstrates a mixed pattern of long and short-term correlation (see in Figure 3C). Local Hurst exponent is in the range of 0.35 to 0.55. It decrease substantially from 2014 and gravitates around 0.55 since 2018. Obviously Brent returns display long-range memory (see in Figure 3D). The market is not weak-form efficient since it possesses long memory features.
With rolling window of 4 years, WTI exhibits extremely weak short range correlation until 2012 (see in Figure 3E), which is similar to Kristoufek's [10] work with longer step of 5 days. Since then our findings are slightly distinct. The cause might be the different step size. Basically the local Hurst exponent of WTI oscillates around 0.5, while Brent presents apparent long-range memory property (see in Figure 3F).
As is shown in Table 1 and Figure 4, value of Hurst exponent and δH is more and more concentrated with window size enlarging. The inefficient behavior on crude oil markets at short time horizon are not surprising. The oil market is extremely fragile to economic and political factors as well as policy shift, which might cause the short time inefficiency. The smoother curve for the larger rolling window sizes implies the existence of weak-form efficiency in the crude oil market at longer time horizon. Over a long enough time, market participants could absorb the new information, resulting a weak-efficient market. Our findings is in line with work of Jiang et al. [4], Tabak and Cajueiro [5], Alvarez-Ramirez et al. [6], Wang and Liu [7], Gu and Zhang [9], and Kristoufek [10].
4.2. The Effects of the Lift
To investigate if the market efficiency dynamics change after the policy shift, we compare market inefficiency δH before and after the lift of export ban. Results in Table 1 and Figure 4 show a mild difference of δH between the two sub-periods.
Prior to hypothesis testing, we examine the distribution of local δH. Noticed that the histograms (see in Figure 4) show that the data are not normally distributed. Conducting the Lilliefors test for normality, we also reject the null hypothesis of normality at the 1% significance level. Hence commonly used paired t test isn't appropriate for the analysis of the data.
Here we implement the right-tailed Wilcoxon signed-rank test on δH to check if the market efficiency increased after the lift. The Wilcoxon signed-rank test is a non-parametric statistical hypothesis test to analyze differences between two samples. Different from the paired t test, it does not require normal distribution of the data. The null hypothesis and alternative hypothesis are formulated as
H0: The market inefficiency δH median is no greater than that after the lift.
H1: δH median before the lift is greater than that after the lift.
If H0 is rejected, we conclude that the market efficiency increased after the lift.
As is shown in Table 1, in the case of WTI for 1 year window the p value = 0 indicates a rejection of the null hypothesis at 5% significance level. There is enough statistical evidence to conclude that for 1-year rolling window size, the median market inefficiency δH before the lift is greater than that after the lift, which implies the increase of market efficiency. For 2-years window the result suggests that the null hypothesis cannot be rejected at 5% significance level, which means that the market efficiency of WTI didn't increase after the lift. However, at large time window the result is interesting. The result of DFA provides evidence that the market efficiency improved. For the result of CDMA, the p−value = 0.0804 indicates that the null hypothesis cannot be rejected at 5% significance level though 10% significance level leads to opposite conclusion.
For Brent at the smallest time window, both CDMA and DFA results show that the null hypothesis cannot be rejected, which means that the market efficiency of Brent didn't improve after the lift. At larger time windows, via CDMA one concludes that the market efficiency increased after the policy shift while via DFA one obtains totally different results.
5. Conclusion
We studied whether or not the crude oil market moved toward efficiency after the lift of the U.S. export ban. We comprehensively examine the time-varying long-range dependence of WTI and Brent crude oil spot prices from 2011 to 2020 based on CDMA and DFA methods. Then we split the whole sample into two sub periods with the same sample sizes and carry out Wilcoxon signed rank test. To increase the reliability of the result, we estimate the time-varying Hurst exponents and market inefficiency with different rolling windows.
Our findings indicate that over long horizons the crude oil markets are close to weak form efficient with time-varying short-time inefficiency, which is consistent with other earlier studies [5–8, 10]. We also find a slightly lower degree of efficiency on Brent, which means a higher level of predictability.
The result of Wilcoxon signed rank test suggests that after the lift, degree of market efficiency of WTI increased in short term, while Brent market efficiency decreased. For the result of medium term, WTI efficiency declined after the lift. And within largest time windows, degree of efficiency of WTI is highly possible to improve after the lift. Consider that, investors with different or multiple time horizons (asset holding period) are suggested to adjust investment strategies accordingly. For arbitragers, there might exist arbitrage opportunity after the lift in medium time horizon.
However, CDMA and DFA get totally different results on Brent crude oil market in medium and long term. This might be caused by the difference between the two methods. Another possible explanation is that the change of Brent market efficiency after the lift is too small to be detected. From results of the two methods, we can hardly determine whether the market efficiency on Brent increased or not. The lift of the ban might only affect WTI in medium and long term.
In addition to the U.S. energy policy, the supply and demand situation and infrastructure issues also count for the WTI crude oil price and market efficiency [15, 46, 47]. With the hydraulic fracturing and horizontal drilling techniques, oil production from shale region in U.S. rose dramatically and led to the shale boom, while inadequate transportation infrastructures restricted the U.S. crude supply to the refining centers. Since mid-2013, new pipelines and rail transport eased this issue [48]. The effects of export ban, shale boom and transportation bottleneck on WTI market efficiency should be fully explored in future studies.
Data Availability Statement
Publicly available datasets were analyzed in this study. This data can be found here: https://www.eia.gov.
Author Contributions
The author confirms being the sole contributor of this work and has approved it for publication.
Funding
This work was supported by the National Natural Science Foundation of China (Grant No. 11805119).
Conflict of Interest
The author declares that the research was conducted in the absence of any commercial or financial relationships that could be construed as a potential conflict of interest.
Acknowledgments
The author would like to thank the reviewers for their constructive comments.
References
1. Fama EF. Efficient capital markets: a review of theory and empirical work. J Finance. (1970) 25:383–417. doi: 10.2307/2325486
2. Alvarez-Ramirez J, Cisneros M, Ibarra-Valdez C, Soriano A. Multifractal Hurst analysis of crude oil prices. Phys A Stat Mech Appl. (2002) 313:651–70. doi: 10.1016/S0378-4371(02)00985-8
3. Serletis A, Andreadis I. Random fractal structures in North American energy markets. Energy Econ. (2004) 26:389–99. doi: 10.1016/j.eneco.2004.04.009
4. Jiang ZQ, Xie WJ, Zhou WX. Testing the weak-form efficiency of the WTI crude oil futures market. Phys A Stat Mech Appl. (2014) 405:235–44. doi: 10.1016/j.physa.2014.02.042
5. Tabak BM, Cajueiro DO. Are the crude oil markets becoming weakly efficient over time? A test for time-varying long-range dependence in prices and volatility. Energy Econ. (2007) 29:28–36. doi: 10.1016/j.eneco.2006.06.007
6. Alvarez-Ramirez J, Alvarez J, Rodriguez E. Short-term predictability of crude oil markets: a detrended fluctuation analysis approach. Energy Econ. (2008) 30:2645–56. doi: 10.1016/j.eneco.2008.05.006
7. Wang Y, Liu L. Is WTI crude oil market becoming weakly efficient over time? New evidence from multiscale analysis based on detrended fluctuation analysis. Energy Econ. (2010) 32:987–92. doi: 10.1016/j.eneco.2009.12.001
8. Mensi W, Beljid M, Managi S. Structural breaks and the time-varying levels of weak-form efficiency in crude oil markets: evidence from the Hurst exponent and Shannon entropy methods. Int Econ. (2014) 140:89–106. doi: 10.1016/j.inteco.2014.10.001
9. Gu R, Zhang B. Is efficiency of crude oil market affected by multifractality? Evidence from the WTI crude oil market. Energy Econ. (2016) 53:151–8. doi: 10.1016/j.eneco.2014.10.014
10. Kristoufek L. Are the crude oil markets really becoming more efficient over time? Some new evidence. Energy Econ. (2019) 82:253–63. doi: 10.1016/j.eneco.2018.03.019
11. Basistha A, Kurov A. The impact of monetary policy surprises on energy prices. J Futures Markets. (2015) 35:87–103. doi: 10.1002/fut.21639
12. Zhang X, Yu L, Wang S, Lai KK. Estimating the impact of extreme events on crude oil price: An EMD-based event analysis method. Energy Econ. (2009) 31:768–78. doi: 10.1016/j.eneco.2009.04.003
13. Luong PV, Mizrach B, Otsubo Y. Location basis differentials in crude oil prices. Energy J. (2019) 40:41–58. doi: 10.5547/01956574.40.SI2.pluo
14. Yang Y, Shao Y, Shao H, Song X. The time-dependent lead-lag relationship between WTI and Brent crude oil spot markets. Front Phys. (2020) 8:132. doi: 10.3389/fphy.2020.00132
15. Colgan JD, Van de Graaf T. A crude reversal: the political economy of the United States crude oil export policy. Energy Res Social Sci. (2017) 24:30–5. doi: 10.1016/j.erss.2016.12.012
16. Shao YH, Gu GF, Jiang ZQ, Zhou WX, Sornette D. Comparing the performance of FA, DFA and DMA using different synthetic long-range correlated time series. Sci Rep. (2012) 2:835. doi: 10.1038/srep00835
17. Shao YH, Gu GF, Jiang ZQ, Zhou WX. Effects of polynomial trends on detrending moving average analysis. Fractals. (2015) 23:1550034. doi: 10.1142/S0218348X15500346
18. Kiyono K, Tsujimoto Y. Nonlinear filtering properties of detrended fluctuation analysis. Phys A Stat Mech Appl. (2016) 462:807–15. doi: 10.1016/j.physa.2016.06.129
19. Carbone A, Castelli G, Stanley HE. Time-dependent Hurst exponent in financial time series. Phys A Stat Mech Appl. (2004) 344:267–71. doi: 10.1016/j.physa.2004.06.130
20. Yang YH, Shao YH, Shao HL, Stanley HE. Revisiting the weak-form efficiency of the EUR/CHF exchange rate market: evidence from episodes of different Swiss franc regimes. Phys A Stat Mech Appl. (2019) 523:734–46. doi: 10.1016/j.physa.2019.02.056
21. Peng CK, Buldyrev SV, Havlin S, Simons M, Stanley HE, Goldberger AL. Mosaic organization of DNA nucleotides. Phys Rev E. (1994) 49:1685. doi: 10.1103/PhysRevE.49.1685
22. Alessio E, Carbone A, Castelli G, Frappietro V. Second-order moving average and scaling of stochastic time series. Eur Phys J B. (2002) 27:197–200. doi: 10.1140/epjb/e20020150
23. Carbone A, Kiyono K. Detrending moving average algorithm: frequency response and scaling performances. Phys Rev E. (2016) 93:063309. doi: 10.1103/PhysRevE.93.063309
24. Kiyono K, Tsujimoto Y. Time and frequency domain characteristics of detrending-operation-based scaling analysis: exact DFA and DMA frequency responses. Phys Rev E. (2016) 94:012111. doi: 10.1103/PhysRevE.94.012111
25. Kiyono K. Theory and applications of detrending-operation-based fractal-scaling analysis. In: 2017 International Conference on Noise and Fluctuations (ICNF). Vilnius: IEEE (2017). p. 1–4. doi: 10.1109/ICNF.2017.7985951
26. Höll M, Kiyono K, Kantz H. Theoretical foundation of detrending methods for fluctuation analysis such as detrended fluctuation analysis and detrending moving average. Phys Rev E. (2019) 99:033305. doi: 10.1103/PhysRevE.99.033305
27. Nakata A, Kaneko M, Shigematsu T, Nakae S, Evans N, Taki C, et al. Generalized theory for detrending moving-average cross-correlation analysis: a practical guide. Chaos Solit Fract. (2019) 3:100022. doi: 10.1016/j.csfx.2020.100022
28. Arianos S, Carbone A. Detrending moving average algorithm: a closed-form approximation of the scaling law. Phys A Stat Mech Appl. (2007) 382:9–15. doi: 10.1016/j.physa.2007.02.074
29. Cajueiro DO, Tabak BM. The Hurst exponent over time: testing the assertion that emerging markets are becoming more efficient. Phys A Stat Mech Appl. (2004) 336:521–37. doi: 10.1016/j.physa.2003.12.031
30. Alvarez-Ramirez J, Alvarez J, Rodriguez E, Fernandez-Anaya G. Time-varying Hurst exponent for US stock markets. Phys A Stat Mech Appl. (2008) 387:6159–69. doi: 10.1016/j.physa.2008.06.056
31. Anagnostidis P, Varsakelis C, Emmanouilides CJ. Has the 2008 financial crisis affected stock market efficiency? The case of Eurozone. Phys A Stat Mech Appl. (2016) 447:116–28. doi: 10.1016/j.physa.2015.12.017
32. Bariviera AF. The inefficiency of Bitcoin revisited: a dynamic approach. Econ Lett. (2017) 161: 1–4. doi: 10.1016/j.econlet.2017.09.013
33. Alvarez-Ramirez J, Rodriguez E, Ibarra-Valdez C. Long-range correlations and asymmetry in the bitcoin market. Phys A Stat Mech Appl. (2018) 492:948–55. doi: 10.1016/j.physa.2017.11.025
34. Grech D, Mazur Z. Can one make any crash prediction in finance using the local Hurst exponent idea? Phys A Stat Mech Appl. (2004) 336:133–45. doi: 10.1016/j.physa.2004.01.018
35. Morales R, Di Matteo T, Gramatica R, Aste T. Dynamical generalized Hurst exponent as a tool to monitor unstable periods in financial time series. Phys A Stat Mech Appl. (2012) 391:3180–9. doi: 10.1016/j.physa.2012.01.004
36. Sensoy A. Generalized Hurst exponent approach to efficiency in MENA markets. Phys A Stat Mech Appl. (2013) 392:5019–26. doi: 10.1016/j.physa.2013.06.041
37. Wang Y, Wu C. Long memory in energy futures markets: further evidence. Resour Policy. (2012) 37:261–72. doi: 10.1016/j.resourpol.2012.05.002
38. Jin X. Time-varying return-volatility relation in international stock markets. Int Rev Econ Finance. (2017) 51:157–73. doi: 10.1016/j.iref.2017.05.015
39. Lim KP, Brooks R. The evolution of stock market efficiency over time: a survey of the empirical literature. J Econ Surv. (2011) 25:69–108. doi: 10.1111/j.1467-6419.2009.00611.x
40. Jiang ZQ, Xie WJ, Zhou WX, Sornette D. Multifractal analysis of financial markets: a review. Rep Prog Phys. (2019) 82:125901. doi: 10.1088/1361-6633/ab42fb
41. Kristoufek L, Vosvrda M. Measuring capital market efficiency: global and local correlations structure. Phys A Stat Mech Appl. (2013) 392:184–93. doi: 10.1016/j.physa.2012.08.003
42. Kristoufek L, Vosvrda M. Commodity futures and market efficiency. Energy Econ. (2014) 42:50–7. doi: 10.1016/j.eneco.2013.12.001
43. Kristoufek L, Vosvrda M. Gold, currencies and market efficiency. Phys A Stat Mech Appl. (2016) 449:27–34. doi: 10.1016/j.physa.2015.12.075
44. Kristoufek L, Vosvrda M. Cryptocurrencies market efficiency ranking: not so straightforward. Phys A Stat Mech Appl. (2019) 531:120853. doi: 10.1016/j.physa.2019.04.089
45. Gu R, Shao Y, Wang Q. Is the efficiency of stock market correlated with multifractality? An evidence from the Shanghai stock market. Phys A Stat Mech Appl. (2013) 392:361–70. doi: 10.1016/j.physa.2012.09.008
46. Zhang B. Are the crude oil markets becoming more efficient over time? New evidence from a generalized spectral test. Energy Econ. (2013) 40:875–81. doi: 10.1016/j.eneco.2013.10.012
47. Scheitrum DP, Carter CA, Revoredo-Giha C. WTI and Brent futures pricing structure. Energy Econ. (2018) 72:462–9. doi: 10.1016/j.eneco.2018.04.039
Keywords: oil prices, spot market, Hurst exponent, market efficiency, WTI, Brent, detrended fluctuation analysis, detrending moving average analysis
Citation: Shao Y (2020) Does Crude Oil Market Efficiency Improve After the Lift of the U.S. Export Ban? Evidence From Time-Varying Hurst Exponent. Front. Phys. 8:551501. doi: 10.3389/fphy.2020.551501
Received: 13 April 2020; Accepted: 19 August 2020;
Published: 02 October 2020.
Edited by:
Wei-Xing Zhou, East China University of Science and Technology, ChinaReviewed by:
Ladislav Kristoufek, Institute of Information Theory and Automation (ASCR), CzechiaKen Kiyono, Osaka University, Japan
Copyright © 2020 Shao. This is an open-access article distributed under the terms of the Creative Commons Attribution License (CC BY). The use, distribution or reproduction in other forums is permitted, provided the original author(s) and the copyright owner(s) are credited and that the original publication in this journal is cited, in accordance with accepted academic practice. No use, distribution or reproduction is permitted which does not comply with these terms.
*Correspondence: Yinghui Shao, eWhzaGFvQHN1aWJlLmVkdS5jbg==
 Yinghui Shao