 Deelan Sudhir Doolabh1
 Philippe Selhorst1
 Carolyn Williamson1,2,3,4Denis Chopera5
 Melissa-Rose Abrahams1,4*
- 1Division of Medical Virology, Faculty of Health Sciences, University of Cape Town, Cape Town, South Africa
- 2National Health Laboratory Service, Cape Town, South Africa
- 3Wellcome Centre for Infectious Diseases Research in Africa (CIDRI-Africa), Cape Town, South Africa
- 4Institute of Infectious Disease and Molecular Medicine, University of Cape Town, Cape Town, South Africa
- 5Africa Health Research Institute (AHRI), Durban, KwaZulu-Natal, South Africa
Introduction: Elucidation of mechanisms that drive HIV latency is essential to identifying cure strategies. While host mechanisms associated with viral persistence on antiretroviral therapy (ART) have been well studied, less is known about the viral properties that influence latency. The viral promoter element, the 5’ long terminal repeat (LTR), has been shown to affect the number of latently infected cells shortly after infection. Here we investigated the role of subtype C LTR genotypic variation on the establishment of latency in a dual reporter HIV-1 infection model.
Methods: The LTR U3 and R regions from 11 women with acute/early subtype C HIV infection were cloned into the dual reporter pRGH plasmid. Latency potential was calculated based on the expression of fluorescent reporter genes in Jurkat E6–1 cells measured by flow cytometry as the proportion of latent (mCherry +ve cells)/proportion of active (eGFP +ve mCherry +ve cells) infection. Reversal of latency was performed using PMA/Ionomycin stimulation 24 hours before fixing of cells. LTR transcriptional capacity, in the presence and absence of a heterologous subtype C Tat, was measured for the same LTRs cloned into a pGL4.10 luciferase expression vector following transfection of HEK293T cells.
Results: The majority of proviruses were latent at day 8 post-infection, yet the proportion of latently infected cells varied significantly across participants. We observed a median latent:active infection ratio of 1.79 (range 0.86–2.83) across LTRs with the hierarchy of latency potential remaining consistent across repeat experiments. The median latent:active infection ratio decreased by a median of 3-fold following PMA/Ionomycin stimulation to 0.55 (range 0.46–0.78) indicating that a proportion of latently infected cells could produce viral proteins upon activation. Latency potential did not correlate with LTR transcriptional capacity.
Conclusions: We found intra-subtype level differences in the latency potential of LTRs from South African women independent of their transcriptional capacity, suggesting that HIV-1 LTRs have intrinsic properties that influence the proportion of latently infected cells shortly after infection. The inability to reactivate viral expression in all latently infected cells supports the complex nature of mechanisms driving latency and the need for continued advancements in methods used to study these mechanisms.
1 Introduction
A broadly implementable cure for HIV has yet to be discovered. The primary obstacle to achieving a cure is long-term viral persistence in the form of a highly stable latent reservoir during suppressive antiretroviral therapy (ART) (1, 2). Primate studies have demonstrated HIV latency to be established within days of infection (3) and, in humans, this pool of latently infected cells is estimated to decay at a very slow rate, with a half-life of 44 months (4). An expanded and detailed understanding of the mechanisms that drive viral latency is essential to informing effective cure strategies.
Host mechanisms influencing viral latency have been well characterized and include viral integration site, orientation of viral integration, cellular activation state, transcriptional interference, and epigenetic factors [reviewed in (5)]. Strategies aimed at reversing some of these mechanisms include the use of latency-reversing agents (LRAs) like histone deacetylase inhibitors (HDACi) and protein kinase C (PKC) agonists, yet these have demonstrated poor efficacy to date [reviewed in (6)]. There is limited information on the viral factors associated with the development of latency, and the identification of these factors may inform alternative approaches to limiting or clearing latently infected cells. The HIV 5’ long terminal repeat (LTR) serves as the promoter of viral transcription and is potentially a key determinant of latency as it contains multiple functional domains involved in regulating the production of mRNA transcripts during the viral life cycle. This 634 base pair promoter element is made up of three discreet segments, the unique 3’ (U3), repeat (R) and unique 5’ (U5) regions (7). While this structure exists in partial form on either end of viral RNA transcripts, two identical and complete LTRs are generated on either end of the DNA viral genome during reverse transcription, of which the 5’LTR acts as the viral promoter. Essential components include the TAR element to which the Tat protein binds and upregulates viral transcription, and the modulatory (with upregulatory and negative regulatory properties), enhancer and core promoter regions.
Genetic diversity in the HIV-1 LTR has been associated with differences in viral promoter activity. Higher transcriptional capacities were reported for subtype C and CRF01_AE LTRs in comparison to other HIV-1 subtypes, largely due to the presence of additional NFκB sites in these subtypes (8–10). Also in a subtype comparison, subtype D and F LTRs displayed the highest propensity for latency and subtype AE the lowest in an in vitro latency model (11). Notably, more subtle genetic differences in the LTR may also impact viral latency as shown by Duverger et al., who reported variation in an AP-1 site shortly upstream of the LTR transcriptional start site to impact the extent of latency and most recently Madlala et al., demonstrated that transcriptional capacity of the LTR differed across individuals and correlated with clinical markers of disease progression (12, 13).
We hypothesized that variation in the LTR of people living with HIV (PLWH) impacts the extent to which viruses establish latent infection. Using a dual reporter HIV latency model (11), we show significant differences in the proportion of latently infected cells for a range of LTR genotypes from 11 women with acute/early subtype C HIV infection (14). Differences were independent of LTR transcriptional capacity as measured in an independent luciferase reporter system.
2 Materials and methods
2.1 LTR samples
HIV-1 LTRs from acute/early viruses of 11 women from the CAPRISA 004 microbicide trial (15) were analyzed. The U3 and R regions of participant LTRs were amplified from genomic DNA isolated from peripheral blood mononuclear cells infected with plasma from these women (16) and cloned into the pGL4.10 promoterless luciferase reporter vector (Promega, WI, USA). Briefly, a 768 base pair region including the partial 3’ LTR (HXB2 position 8862–9629, including 5’LTR equivalent HXB2 position 1–544) was amplified from genomic DNA using nested, two-step PCR and the Expand High Fidelity Enzyme (Roche, Switzerland) with outer primers SQ15FC (5’-GAGAGCGGTGGAACTTCTGG-3’) and Nef_OR (5’-AGGCAAGCTTTATTGAGG-3’) and inner primers XhoI_3’LTR (5’-TATATCTCGAGAACTGAGCCAGCAGCAGAG-3’) and Nef_OR_3’LTR (5’-GCGAGGCTCAAGGCAAGCTTTATTGAGG-3’). Cycling conditions were, for inner PCR, 95˚C for 2 minutes; 10 cycles of 95˚C for 15 seconds, 52˚C for 30 seconds and 72˚C for 45 seconds; 15 cycles of 95˚C for 15 seconds, 55˚C for 30 seconds and 72˚C for 1 minute; with final elongation of 72˚C for 7 minutes and for outer PCR, 95˚C for 2 minutes; 10 cycles of 94˚C for 15 seconds, 58˚C for 30 seconds and 72˚C for 45 seconds; 15 cycles of 95˚C for 15 seconds, 58˚C for 30 seconds and 72˚C for 1 minute; with final elongation of 72˚C for 7 minutes. PCR products were inserted into the pGL4.10 vector using restriction enzyme cloning and FastDigest XhoI and HindIII enzymes (Thermo Scientific, MA, USA).
This work was approved by the University of Cape Town (025/2004; 574/2016) and University of KwaZulu-Natal Research Ethics Committees (E013/04). Informed consent was obtained from all CAPRISA 004 cohort participants.
2.2 Construction of recombinant LTR-pRGH plasmids
Dual reporter pRGH plasmids (LAI-gagiGFP-CMVmCherry-deltaEnv), wild type pRGH-WT (Supplementary Figure 1) and pRGH-ΔU3 (3’) plasmids (Supplementary Figure 2), expressing mCherry under the control of a CMV promoter and gag-eGFP under the control of an HIV-1 LTR (11), were obtained through the NIH AIDS Reagent Program, Division of AIDS, NIAID from Ivan Sadowski and Viviana Simon (catalogue #’s 12427 and 12430). Recombinant LTR-pRGH plasmids containing the U3 and R regions (HXB2 position 9086–9621, 5’LTR equivalent HXB2 position 1–536) were generated using restriction-free cloning using primers pRGH_LTR_F (5’-CCATCTCGAGGTGCCTTTAAGACCAATGAC-3’, HXB2 position 9006–9035) and pRGH_LTR_R (5’-TACCAACAGTACCGGATTGC-3’, specific to pGL4.10 clone) and the Phusion High-Fidelity PCR Kit (New England Biolabs, MA, USA) with cycling conditions of 98˚C for 30 seconds; 35 cycles of 98˚C for 10 seconds, 60˚C for 30 seconds and 72˚C for 5 minutes; and final elongation of 72˚C for 5 minutes. Amplicons were purified using the QIAquick PCR Purification Kit and restriction enzyme digested with FastDigest XhoI and HindIII (Thermo Scientific), followed by a second purification step. LTRs were then introduced into the pRGH plasmid by PCR after combining 125ng of the patient-specific LTR amplicon, 10–50ng of the pRGH-ΔU3 (3’) plasmid, 1X Phusion HF buffer, 0.02U/μl final concentration Phusion High-Fidelity Polymerase, and 200μM each dNTPs in a final reaction volume of 50μl. PCR cycling conditions were: 98˚C for 2 minutes; 18 cycles of 98˚C for 10–30 seconds, 60˚C for 30–50 seconds and 72˚C for 8 minutes; followed by a final elongation step at 72˚C for 5 minutes. The resulting reaction was digested with 10–20 units of FastDigest DpnI (Thermo Scientific) for 1–2 hours. Digested products were transformed into XL-10 Gold Ultra-Competent Cells (Agilent Technologies, CA, USA) according to manufacturer instructions and recombinant LTR-pRGH plasmids were confirmed first by colony PCR, and thereafter by restriction enzyme digestion and Sanger sequencing following small-scale plasmid preparation using the QIAprep® Spin Miniprep Kit (Qiagen, WI, USA).
2.3 Construction of control reporter pRGH plasmids
Flow cytometry compensation controls expressing either mCherry or eGFP were constructed to correct for overlap of fluorescence signal in the emission spectra of these markers. To generate the eGFP-only expressing pRGH construct, pRGH-ΔCMV/ΔmCherry, the CMV promoter and mCherry gene were deleted from the parent plasmid [pRGH (LAI-gagiGFP-CMV-mCherry-deltaEnv)] by restriction enzyme digestion with FastDigest BlpI and XhoI restriction enzymes (Thermo Scientific) for 2 hours at 37˚C. The resulting linear vector DNA was gel-purified using the QIAquick Gel Extraction Kit (Qiagen) as per manufacturer instructions and sticky ends were blunted using the Thermo Scientific CloneJET PCR Cloning Kit (Thermo Scientific) with 625ng vector DNA and 0.5 units/μl of DNA blunting enzyme at 70˚C for 5 minutes. Blunt ends were ligated using the Thermo Scientific T4 DNA Ligase Self Circularization of Linear DNA Kit (Thermo Scientific) by combining 100ng of blunted linear DNA with polyethylene glycol (PEG 4000) at a final concentration of 5% (w/v) and incubating overnight at 16˚C. Resulting ligated vector DNA was transformed into E. coli XL10-Gold® Ultracompetent Cells (Agilent Technologies) and incubated at 32˚C overnight. Colonies with the desired modified constructs were identified first using colony PCR and thereafter using restriction enzyme digestion with FastDigest KpnI (Thermo Scientific) and Sanger sequencing following small-scale plasmid preparation using the QIAprep® Spin Miniprep Kit (Qiagen).
The mCherry-only expressing pRGH construct, pRGH-ΔeGFP, was generated by removal of the eGFP gene from the parent plasmid (pRGH (LAI-gagiGFP-CMV-mCherry-deltaEnv)) using inverse PCR and the Phusion High-Fidelity PCR Kit (New England Biolabs, MA, USA). Primers for the inverse PCR, ^eGFP-pRGH-FP (5’-AGCCAAAATTACCCTATAGTGCAGAACCTC-3’, HXB2 position 1174 – 1203) and ^eGFP-pRGH-InvPCR(R) (5’-GACCTGGCTGTTGTTTCCTGTGTCAC-3’, HXB2 position 1148 - 1173) were designed to amplify the region from the start of the p24 and end of the p17 region of the gag, respectively. The following thermal cycling conditions were used: 98˚C for 2 minutes; 35 cycles of 98˚C for 10 seconds, 67˚C for 50 seconds and 72˚C for 8 minutes; and final elongation of 72˚C for 10 minutes. Resulting PCR products were restriction enzyme digested with FastDigest DpnI (Thermo Scientific), to remove unmodified template DNA followed by self-circularization of 5μl of undigested product using the T4 DNA Ligase Self Circularization of Linear DNA Kit (Thermo Scientific) and PEG 4000 at a final concentration of 5% (w/v) incubated overnight at 16˚C. Confirmation of modified vector construction was performed as described for the pRGH-ΔCMV/ΔmCherry construct.
2.4 Pseudovirus generation
To generate recombinant LTR-pRGH pseudoviruses, Lipofectamine 3000 (Thermo Scientific) transfection reagent was used to co-transfect HEK293T cells (a human embryonic kidney cell line, ATCC CRL321) with recombinant pRGH constructs and the pHEF-VSVg envelope expressing plasmid. Briefly, for each pRGH construct, 8μg of the recombinant pRGH plasmid and 2μg of the pHEF-VSVg plasmid (4:1) was mixed with 5μl of the P3000 Reagent and 12μl of Opti-MEM-Reduced Serum Media (Gibco, Thermo Scientific) in a 15ml conical tube. A mixture of 5μl of the Lipofectamine 3000 Reagent and 125μl of Opti-MEM was added to the plasmid mixture, followed by vortexing and room temperature incubation for 15 minutes. The final mixture was added to 1.2 × 10⁶ HEK293T cells in wells of a 6-well plate in a final volume of 2ml Dulbecco’s Modified Eagle’s Medium (DMEM) supplemented with 10% heat-inactivated fetal bovine serum (FBS) (Thermo Scientific) and 50μg/ml gentamicin antibiotic (Lonza) (referred to as complete DMEM). Plates were incubated for 48 hours at 37˚C with 5% CO2 followed by harvesting of virus in culture medium by centrifugation at 887× g for 8 minutes and storage at −80˚C until use.
2.5 Measuring latency potential of participant LTRs
A total of 1 × 10⁶ Jurkat E6–1 cells (17) were infected with recombinant LTR pseudoviruses in a final volume of 2ml of DMEM supplemented with 10% FBS and 4μg/ml Polybrene following spinoculation at 500× g for 90 minutes at room temperature. An inoculum required to achieve 10–20% eGFP expressing cells on day one post-infection was used and infections were performed in three independent repeat experiments. Infected cultures were maintained over an eight-day period at 37 ˚C with 5% CO2 with replacement of 1ml of culture medium with fresh medium every two days until day six post-infection. On day seven post-infection, cultures were split over two wells of a 6-well plate, and one well treated with phorbol 12-myristate 13-acetate (PMA) and Ionomycin at final concentrations of 4ng/ml and 1μM in Dimethyl Sulfoxide (DMSO), respectively (stimulated) and the other was treated with the equivalent volume of DMSO only (unstimulated control) and made up to a final volume of 2ml complete DMEM. CEM.NKR CCR5+ cell (18–20) infections were carried out as with Jurkat E6–1 cells with the following exceptions: (i) a total of 5 × 10⁵ cells were infected in a final volume of 1ml, (ii) spinoculation was carried out at 1000× g for 90 minutes, and (iii) cultures were maintained with replacement of 500μl every two days until day 6 post-infection followed by splitting of cultures over two wells of a 12-well plate on day seven and making up to a final volume of 1ml with addition of stimulators/DMSO. Cells were harvested for acquisition of fluorescent signals on day eight post-infection by centrifugation at 887× g for 8 minutes at room temperature and fixed in 1% (v/v) paraformaldehyde for 10 minutes at room temperature. Compensation control pseudoviruses, pRGH-ΔCMV/ΔmCherry and pRGH-ΔeGFP, were likewise infected, but at one and four days prior to acquisition, respectively. On day three post-infection, pRGH-ΔeGFP pseudovirus infected cells were stimulated with PMA/Ionomycin to achieve high levels of mCherry expression.
mCherry and eGFP expressing cells were measured using flow cytometry with signals acquired on either a Becton Dickinson (BD) FACSCalibur using BD CellQuest Pro software for eGFP titration experiments or a BD LSRFortessa using FACSDIVA software for all other data acquisition. Data were analyzed on FlowJo version 10.2 (Treestar Inc.). For samples run on the FACSCalibur, a total of 40 000 live events were recorded. Dead cells were excluded as determined by the forward scatter area versus side scatter area profiles [FSC-A/SSC-A] of the cells. Cells were then gated on eGFP expression based on uninfected cell populations (Supplementary Figures 3A, B). For all samples run on the LSRFortessa, a total of 100 000 total events were recorded and cells were first gated on time to ensure there were no shifts in fluorescence intensity during the run. Dead cells were excluded as before, and doublet events were excluded based on the forward scatter area versus forward scatter height profiles [FSC-A/FSC-H] of the cells. Finally, cells were gated for single or co-expression of eGFP and mCherry based on uninfected cell controls (Supplementary Figures 3C–E). Latency potential was calculated as:
2.6 Measuring basal and Tat-induced LTR transcriptional capacity
A total of 2 × 10⁴ HEK293T cells were co-transfected with 100–200ng of recombinant pGL4.10 LTR plasmids, 25–100ng of the Renilla luciferase expressing pRL-SV40 vector (Promega) and a Tat-TOPO construct (pcDNA™3.1/V5-His-TOPO vector containing the tat gene of a rapid disease progressor, CAP63, from the CAPRISA 002 cohort) (21) at 0, 10, 25, 50 and 100ng, respectively. Transfections were performed using PolyFect transfection reagent (Qiagen) at 20μg/ml per well in a total volume of 200μl complete DMEM in a 96-well plate. After 48 hours at 37 ˚C with 5% CO2, Firefly luciferase luminescence was measured in relative light units (RLU) using the Dual-Glo Luciferase Assay Reagent (Promega) in a GLOMAX® 96-Microplate Luminometer. Thereafter, Dual-Glo Stop & Glo Reagent (Promega) was added, and Renilla luciferase luminescence readings were acquired. Transfection efficiency was controlled for by normalizing Firefly luciferase luminescence readings against Renilla luciferase expression. To control for inter-experiment variation, LTR transcriptional capacity was calculated as a response ratio relative to the activity of the BaL isolate LTR and expressed as a factor of BaL activity. LTR transcriptional capacity was calculated as the relative response ratio:
FLL: Firefly luciferase luminescence
RLL: Renilla luciferase luminescence
p: Participant LTR
b: BaL LTR
n: Negative control (pGL4.10 with no LTR)
2.7 Sequence analysis
Sanger sequencing was performed at the Central Analytical Facilities, University of Stellenbosch, South Africa, using the ABI3000 Genetic Analyzer and BigDye terminator reagents (Applied Biosystems, CA, USA). Sanger sequences were assembled using Sequencher v5.3 and visualized and aligned in AliView (v1.21). Pairwise DNA distances were calculated in MEGA 7 and nucleotide differences in cloned participant LTR sequences were visualized using Geneious Prime 2023.2.1 (http://www.geneious.com/). A consensus subtype C LTR was generated using Consensus Maker
(https://www.hiv.lanl.gov/content/sequence/CONSENSUS/consensus.html) and a curated web alignment of 373 subtype C LTR sequences from up to and including 2016 (HXB2 position 1–532) obtained from the Los Alamos National Laboratories Sequence Database (http://www.hiv.lanl.gov/).
2.8 Statistical analyses
GraphPad Prism 7.0a (GraphPad Software, La Jolla California USA, www.graphpad.com) was used for generating graphs and performing statistical tests. Spearman correlation (CI=95%) tests were performed, and statistical significance was calculated using the Wilcoxon matched-pairs signed rank test. Where multiple comparisons were made, a one-way analysis of variance (ANOVA), followed by a Tukey multiple comparison test was carried out. A p-value of<0.05 was considered significant.
3 Results
3.1 Generation of a recombinant LTR-RGH pseudovirus panel
A panel of 11 subtype C HIV partial LTRs from women with acute/early infection (median estimated duration of infection of 4 weeks, range 3–12 weeks) was investigated (Table 1). The RGH (Red-Green-HIV-1) dual reporter latency model (11) was used, which makes use of a recombinant plasmid, pRGH, harboring a gag-eGFP gene under the control of the HIV LTR and an mCherry gene under the control of a constitutive cytomegalovirus (CMV) promoter. A 650bp fragment including the U3 and R regions (HXB2 position 9086–9621, 5’LTR equivalent HXB2 position 1–536) of each LTR in our panel was amplified and inserted into the pRGH-ΔU3 (3’) plasmid, replacing the corresponding regions of the 3’LTR of the LAI genome contained in the plasmid. Sequencing of the cloned LTRs revealed that they differed by 5.26–11.33% (median nucleotide pairwise DNA distance = 7.74%, with Maximum Likelihood evolutionary model) (Supplementary Table 1).
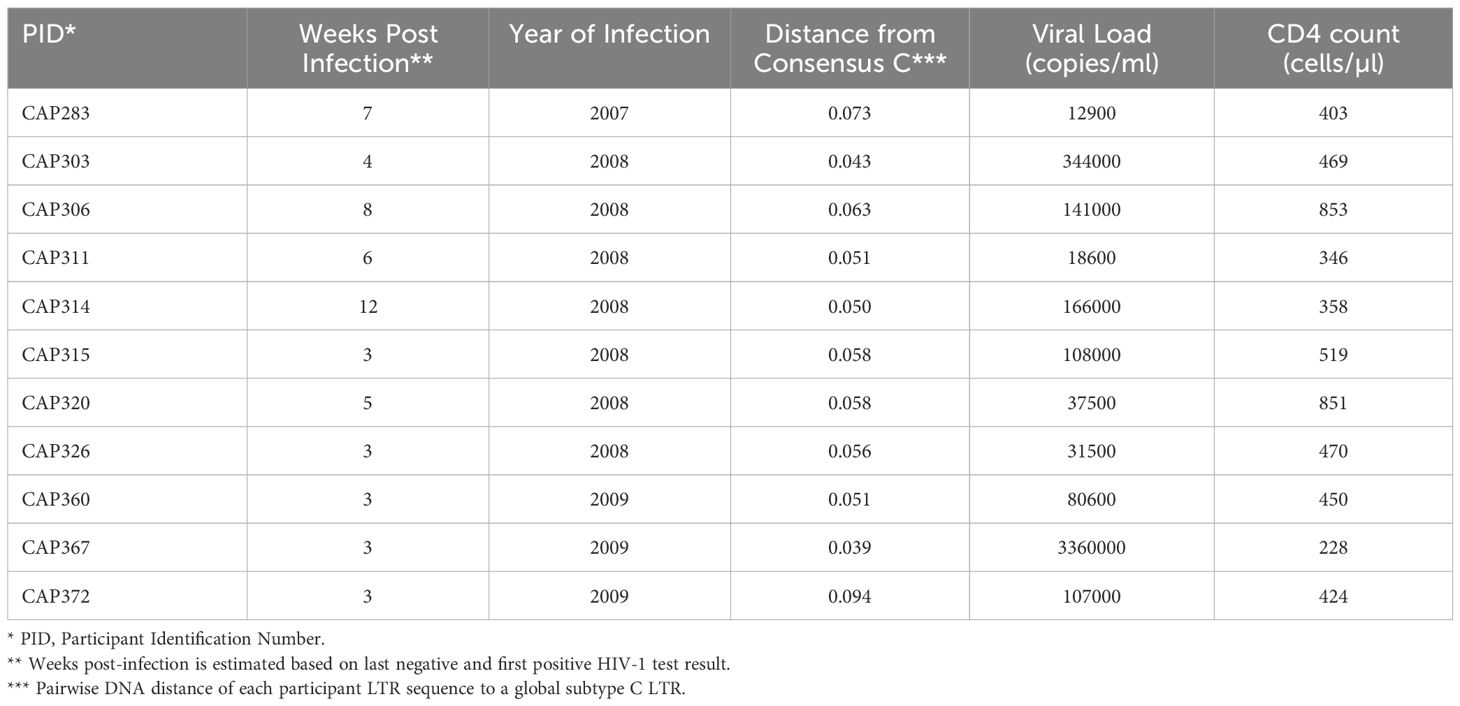
Table 1 11 CAPRISA 004 participants selected for inclusion in the LTR panel.
Following infection of Jurkat E6–1 cells with recombinant LTR-RGH pseudoviruses, simultaneous detection of eGFP and mCherry fluorescent signals by flow cytometry was indicative of active viral expression, while expression of mCherry alone signified viral integration with no HIV-1 expression, indicative of latent infection. To compensate for fluorescence spectral overlap between these markers (Supplementary Figure 4) the eGFP-only expressing construct, pRGH-ΔCMV/ΔmCherry, and mCherry-only expressing construct, pRGH-ΔeGFP, were generated using inverse PCR and were confirmed to express only the desired markers (Figure 1A, middle and bottom panels).
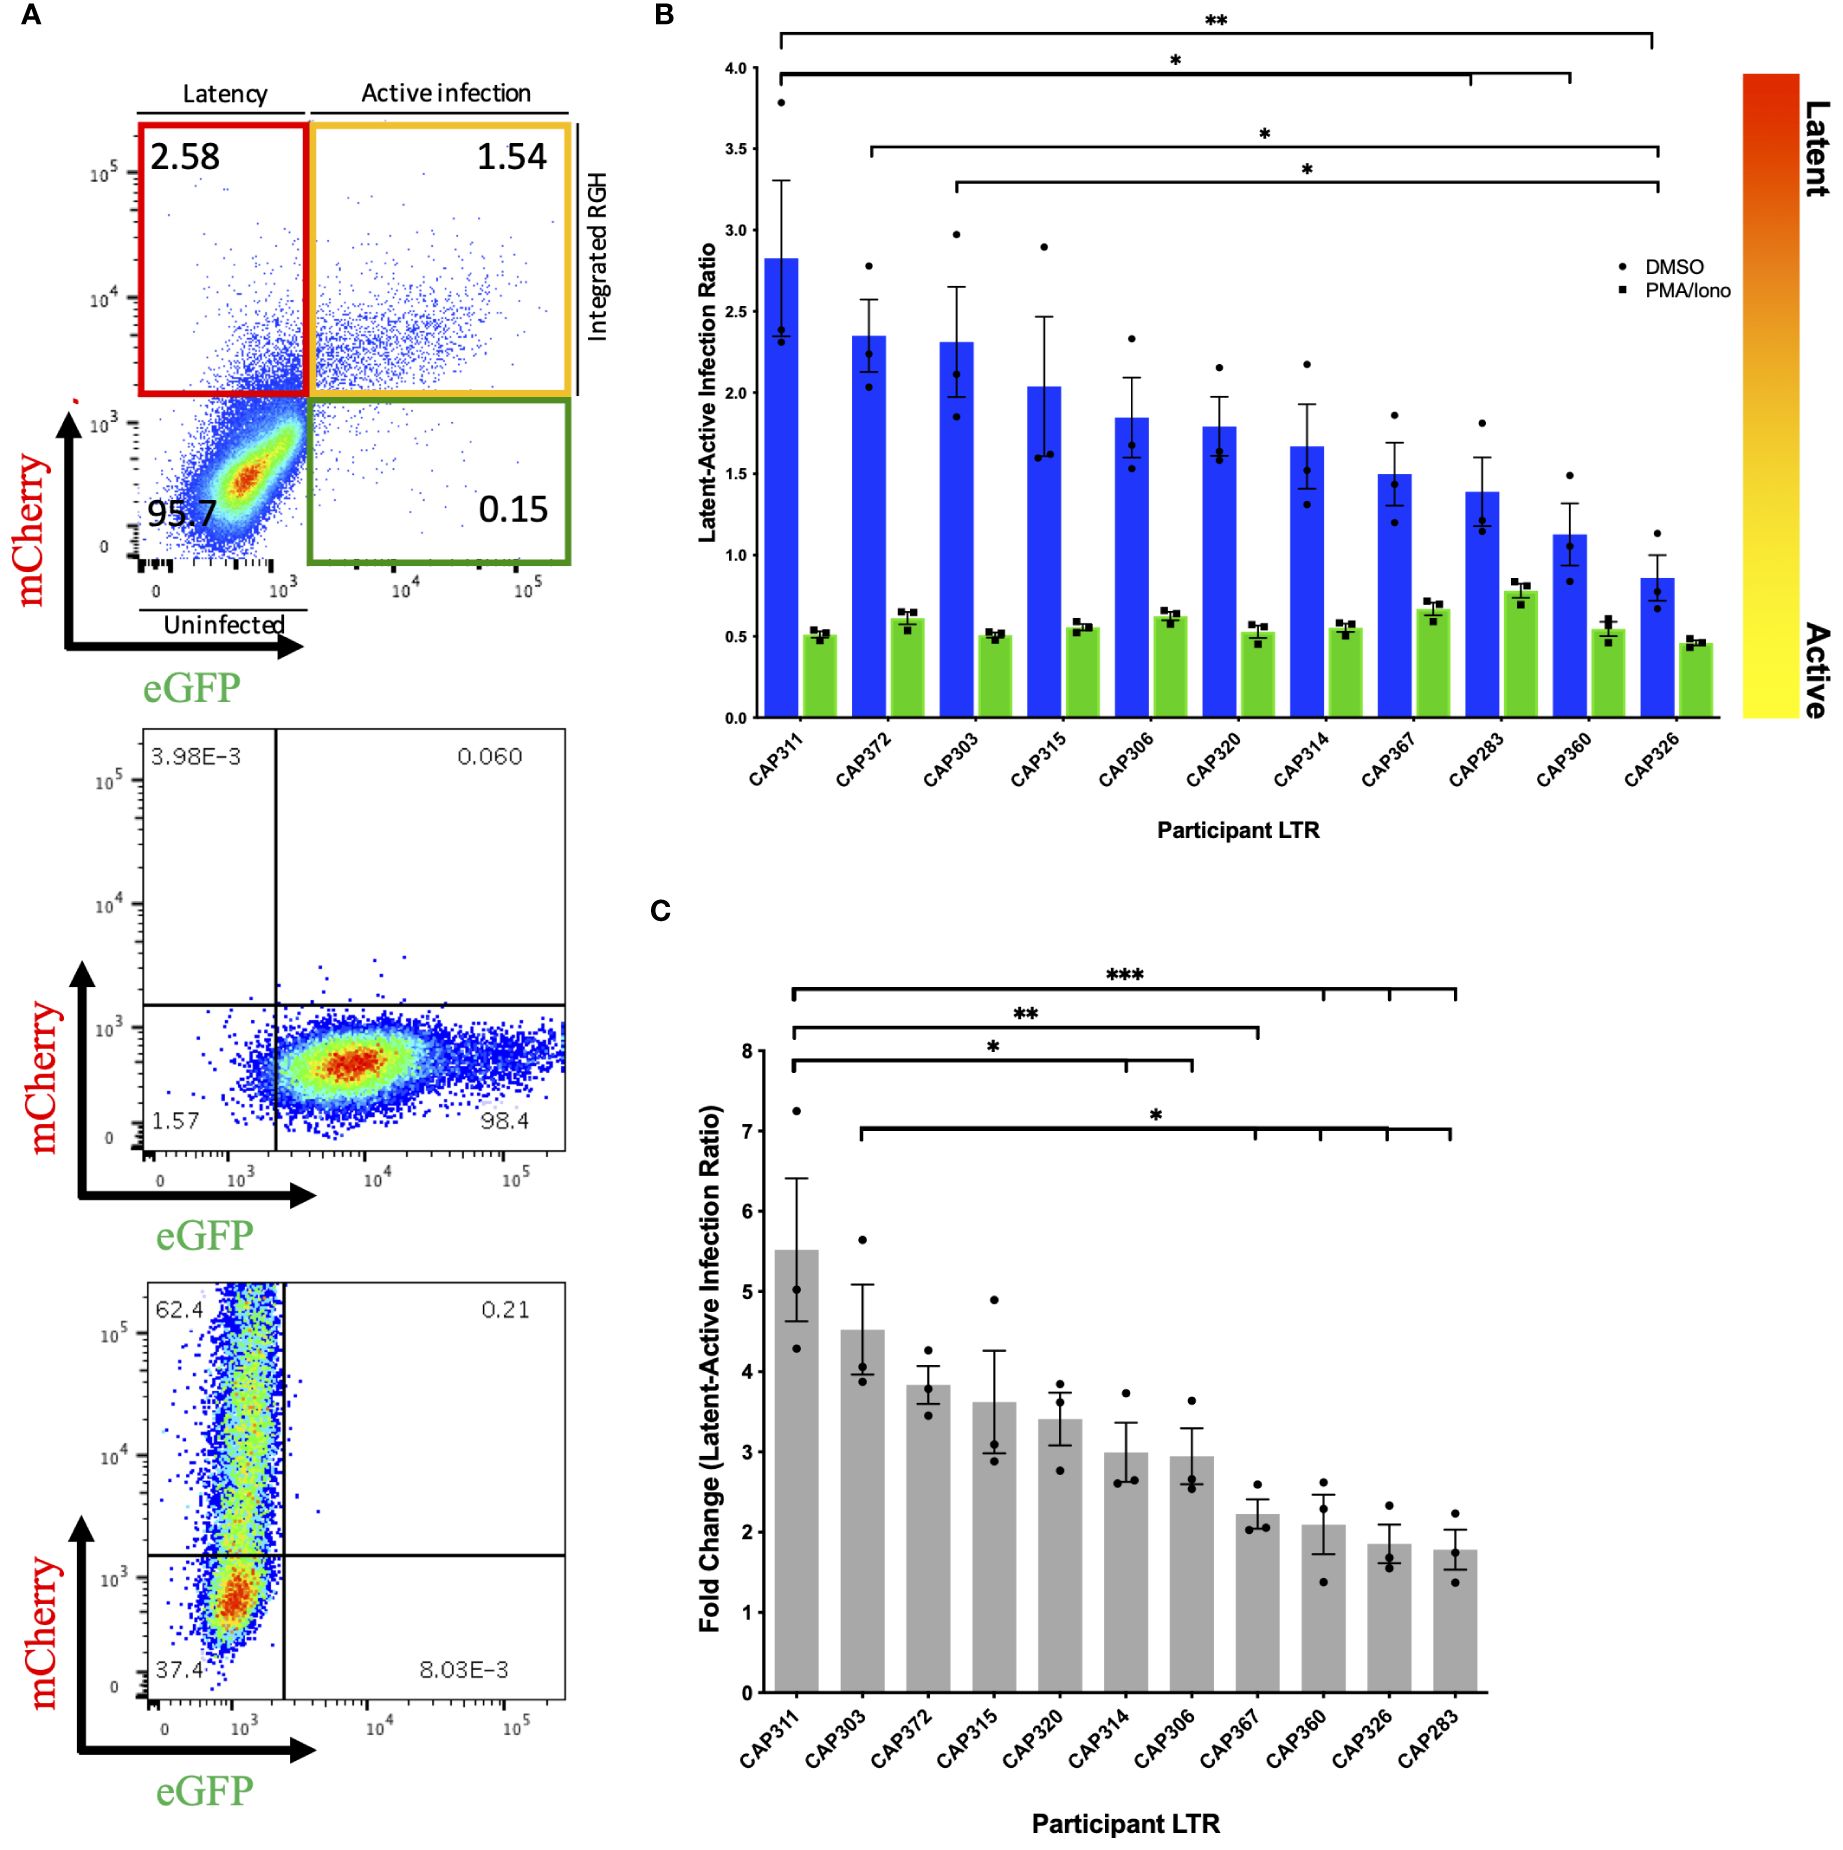
Figure 1 Differences in latency observed across participant HIV-1 LTRs in Jurkat E6–1 cells. (A) Top panel: Representative pseudocolour dot plot of an LTR-RGH pseudovirus infected population of Jurkat E6–1 cells. Cells within the upper left, red quadrant represent infected cells containing integrated RGH DNA with transcriptionally active CMV promoters but silent LTRs (latent infection). Cells within the upper right yellow quadrant represent infected cells containing integrated RGH DNA with transcriptionally active CMV promoters and LTRs (active infection). Cells within the bottom left quadrant expressed neither fluorescent protein and were considered uninfected. Middle and bottom panel: Pseudocolour dot plots of Jurkat E6–1 cells infected with pRGH-ΔCMV/ΔmCherry (middle panel) and pRGH-ΔeGFP (bottom panel) pseudoviruses. Cells were infected and analyzed by flow cytometry 1 and 4 days post-infection, respectively. Cells infected with pRGH-ΔeGFP were stimulated with PMA/Ionomycin on day 3 post-infection. (B) Jurkat E6–1 cells were infected with each of the participant LTR-RGH pseudoviruses. At 7 days post-infection, cells were treated with either DMSO or PMA/Ionomycin for 24 hours and analyzed by flow cytometry. Latency potential is expressed as the ratio of latently (mCherry only) to actively (mCherry and eGFP) infected cells. Bars are ordered by decreasing latency potential. Error bars represent standard errors of the results of three independent repeat experiments. (C) Fold change in latency potential 24 hours post PMA/Ionomycin stimulation. Error bars represent standard errors of the results of three independent repeat experiments. Bars are ordered by decreasing fold change. (*p< 0.05, **p< 0.001, ***p< 0.0001; one-way ANOVA, followed by a Tukey multiple comparison test).
We infected Jurkat E6–1 cells with recombinant LTR-RGH pseudoviruses at a multiplicity required for 10–20% eGFP positive cells one day post-infection to prevent multiple viral integration events per cell (11). As the recombinant LTR-RGH pseudoviruses contained a Gag-eGFP fusion protein, early eGFP signals were representative of the virus inoculum and not associated with de novo viral protein production driven by the viral LTR. Multi-day infection experiments with the pRGH-WT pseudovirus revealed that eGFP signals from the virus inoculum waned and stabilized at four to eight days post-infection after an initial spike, depending on the amount of virus added (Supplementary Figure 5). Similar kinetics of eGFP signals were seen in CEM.NKR CCR5+ cells (data not shown). The proportions of actively (yellow) and latently (red) infected cells were therefore measured at day 8 post-infection in subsequent experiments.
3.2 LTR genotypes are associated with a range of viral latency in vitro
We measured the latency potential of participant LTRs in our panel, where latency potential was defined as the proportion of cells actively transcribing viral proteins relative to those with viral integration in the absence of viral protein production following infection of Jurkat E6–1 cells (Figure 1A, top panel). After seven days of infection, cells were treated with either DMSO (unstimulated) or PMA and Ionomycin (stimulated) and fluorescent protein expression was measured on day 8. In three independent experiments, the median latent:active infection ratio across LTR-RGH pseudoviruses was 1.79 with a range of 0.86–2.83 (Figure 1B, blue bars), indicating that the majority of infected cells were not actively producing viral proteins. Furthermore, latency potential differed significantly across participants and was not influenced by the total number of infected cells (Supplementary Figure 6). The latency potential of CAP311 was significantly higher than that of three other participants, while the latency potential of CAP326 was significantly lower than that of three other participants, including CAP311 (one-way ANOVA, followed by a Tukey multiple comparison test).
Stimulation with PMA and Ionomycin decreased the latent:active ratio to below 1 in all cases with a median ratio of 0.55 (range: 0.46–0.78) indicating that at least a proportion of silent LTRs were transcriptionally competent and reactivatable (Figure 1B, green bars). Latency potential decreased by a median of 3-fold following stimulation, in keeping with previous reports for this model (11), and ranged from a 1.78 to a 5.52-fold decrease across LTRs, indicating that participant LTRs were activated to different extents (Figure 1C). The hierarchy of fold change in latency potential closely mirrored that of latency potential with the same LTRs represented in the top and bottom four LTRs of the hierarchy. The LTR with the highest latency potential, CAP311, also displayed the highest fold change in latent:active infection ratio following stimulation, which was significantly different from six other LTRs. The LTR with the second-highest fold change (and third highest latency potential), CAP303, displayed a significantly greater fold change in latency potential as compared to four other LTRs in the panel. After stimulation, we also observed an increase in the percentage of cells expressing mCherry from a median of 2.5–9.8% (Supplementary Table 2). This was previously reported for this model (11) and indicated that not all infected cells were expressing fluorescent markers even when expression was expected to be constitutive. As a result, the percentage of actively infected cells (yellow quadrant) was on average 3.5–3.8% higher than the total percentage of infected cells (red plus yellow quadrant) prior to stimulation across experiments, indicating a direct shift in cells from the uninfected or GFP-only expressing population to the actively infected cell population. Such a shift in both the red and yellow fluorescent cell populations post-stimulation may obscure an accurate representation of the proportion of cells in which latency was reversible in this model as some cells were not previously counted as infected. The GFP-only expressing cell population represented on average less than 1% of the total cell population across experiments (average of 0.16% pre-stimulation and 0.48% post-stimulation). We hypothesize that this population represented cells with a defective CMV-mCherry cassette or with persistent residual GFP signal from virus inoculum as reported by Dahabieh et al. for infection of primary cells (11). These were therefore not considered to be capable of productive infection and were not included in latency potential ratio calculations. We repeated this set of experiments in an alternate CD4+ T-cell line, CEM.NKR CCR5+ cells, however, we were unable to reactivate latent proviruses (Supplementary Figure 7), even at increased PMA concentrations (data not shown).
To investigate the presence of previously reported features that may influence LTR-associated latency potential, we compared LTRs to a subtype C consensus (Supplementary Figure 8). Participant CAP303, CAP320 and CAP360 each harbored a 15–21bp insertion in the modulatory region (LEF-1 domain between HXB2 site 326–327), with CAP320 harboring an additional NF-κB-like motif inserted in this site, upstream of the canonical three sites in the enhancer region. While participant CAP303 showed one of the highest latency potentials of the panel, the latency potentials of these three participants were spread throughout the hierarchy, indicating no obvious advantage/disadvantage of the insertions on latency as measured in this model. One participant LTR, CAP372, had a single base pair difference from consensus in the AP-1 binding site within the enhancer region. The AP-1 site has previously been shown to be important in viral latency (12). This individual’s LTR displayed the second highest latest potential of the panel (Figure 1).
3.3 Basal and Tat-induced LTR transcriptional capacity do not correlate with latency potential
To evaluate whether highly transcriptionally active LTRs have a greater resistance to silencing and therefore lower latency potential, we measured luciferase activity of recombinant pGL4.10 reporter plasmids harboring a luciferase gene under the control of the 3’LTRs from our panel. Basal transcription was measured following transfection of HEK293T cells with recombinant pGL4.10 plasmids only and Tat-induced transcriptional capacity was measured following co-transfection with a separate plasmid that expressed a subtype C Tat protein (Tat-TOPO) at optimal input of 50ng (Supplementary Figure 9). All transcriptional capacity values were normalized to a BaL-LTR control plasmid.
Significantly higher levels of transcriptional capacity were observed across participant LTRs following Tat induction (p-value = 0.001) with a mean 4.8-fold increase compared to basal activity (Figure 2A). Tat-induced LTR transcriptional capacity ranged broadly from 1.61 to 15.83-fold BaL-LTR activity (median = 8.9-fold) compared to 0.65–2.4-fold BaL-LTR activity (median = 1.9-fold) in the absence of Tat. Basal and Tat-induced LTR transcriptional capacity correlated across participants (Spearman correlation test, p = 0.009, r = 0.75) indicating that the selected tat gene upregulated transcription similarly in all individuals (Figure 2B). However, no significant correlation was observed between latency potential and basal or Tat-induced LTR transcriptional capacity for our LTR panel (Spearman correlation tests, basal p = 0.25, r = −0.38, Tat-induced p = 0.42, r = −0.27) (Figures 2C, D). Interestingly, participant CAP372 who harbored the polymorphism in the AP-1 site had the lowest transcriptional capacity of the panel.
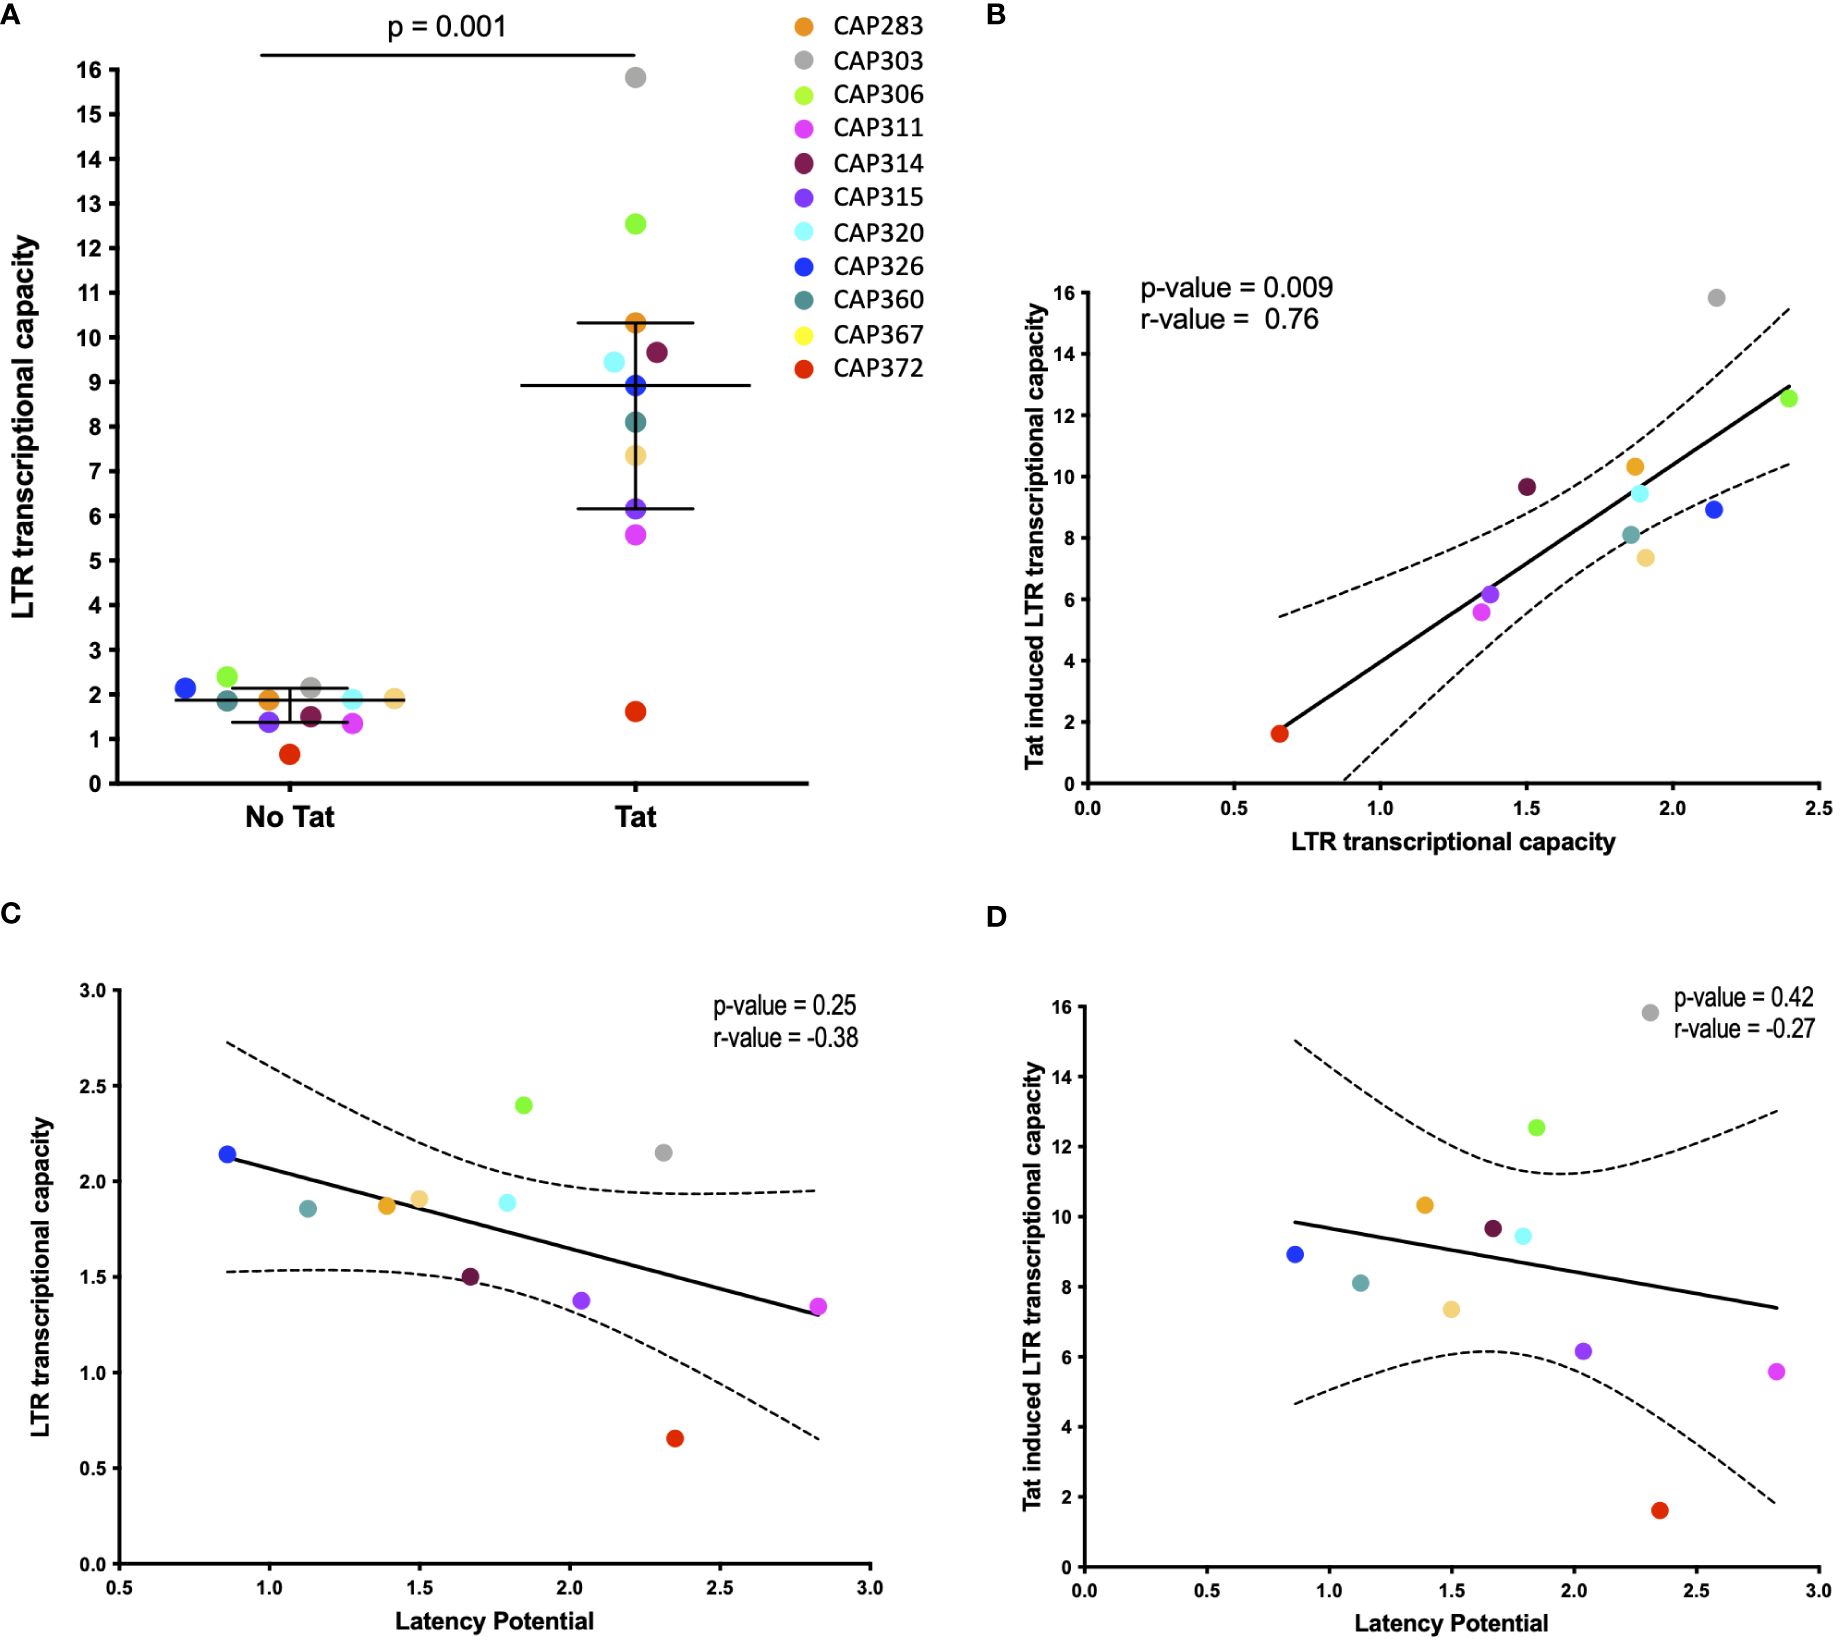
Figure 2 Basal and Tat-induced LTR transcriptional capacity. (A) Scatter plot of transcriptional capacity of participant derived LTR sequences in the absence and presence of the HIV-1 Tat protein. HEK293 cells were transfected with each of the pGL4.10 LTR clones or co-transfected with 50ng of a Tat-TOPO plasmid. A Renilla luciferase-expressing vector was used to normalize transfection efficiency in all cases. LTR activity was measured by determining the luciferase production at 48 h post-transfection and expressed as a relative response ratio to the HIV-1 subtype B BaL strain’s normalized LTR luciferase expression. The median with interquartile range is shown (p = 0.001; Wilcoxon matched-pairs signed rank test). (B–D) The association of basal and Tat-induced LTR transcriptional capacity (B), latency potential and basal LTR transcriptional capacity (C), and latency potential and Tat-induced LTR transcriptional capacity (D) is shown by Spearman correlation tests. Dashed curves indicate the 95% confidence intervals. Basal transcriptional capacity was measured in four independent experiments and Tat-induced activity was measured in two independent experiments.
4 Discussion
Viral latency facilitates the persistence of HIV infection during suppressive antiretroviral therapy. Interruption of therapy results in reversal of latency and subsequent viral rebound. Viral mechanisms underlying latency are not well understood, yet transcriptional silencing of the viral LTR has been implicated in its development (22) [reviewed in (23)]. We hypothesized that differences in LTR genotype in PLWH would influence the extent of HIV transcriptional silencing. To test this hypothesis, we measured the proportion of latently:actively infected CD4+ T cells shortly after infection with recombinant RGH pseudoviruses harboring LTRs of 11 women with acute/early HIV subtype C infection. To our knowledge, the influence of inter-participant LTR diversity on HIV latency has not previously been demonstrated.
We observed that the hierarchy of latency potential across the LTRs in our panel was consistent across repeat experiments, indicating that there is likely an inherent property of the HIV LTR genotype that influences the extent to which latency establishment occurs. In all but one case, the majority of infected cells were not actively producing viral proteins after infection, indicating the general capacity of HIV to establish latency early. This bias toward latent infection is in keeping with previous studies using the RGH model (11) and with studies using primary cells (24, 25). In the RGH model specifically, lack of viral protein production was associated with cellular activation state and NFκB levels (26). In this model, Gag-eGFP is produced under the control of the viral LTR and therefore all pseudovirus particles generated produce eGFP signal. We found that day 8 post-infection was optimal for measuring latency as detection of Gag-eGFP fluorescent signal at this point was indicative of de novo protein production. However, it is possible that latency was established even earlier and could not be distinguished from residual eGFP from virus inoculum.
Latency was reversible following stimulation with PMA and Ionomycin, albeit in only a portion of cells (median latent:active infected cell ratio decreased 3.2-fold from 1.79 to 0.55). LTRs with the highest latency potential showed the greatest fold change in latent:active infected cell ratio following stimulation and the opposite was true for LTRs with lowest latency potential. This would be expected if the majority of transcriptional silencing was dictated by LTR-genotype as opposed to alternative silencing mechanisms. Since latency potential ratios were stimulated to a similar level across LTRs, this supports the potency of the activators used, and indicates that the maximum level of activation possible was likely reached. Whether or not this is a consequence of the artificial in vitro system or the CD4+ T-cell line used, is unknown. PMA and Ionomycin are activators of the protein kinase C pathway, which upregulates the production of transcription factors such as NF-kB and NFAT (27, 28). It is possible that PMA/Ionomycin stimulation was insufficient to reverse all transcriptionally silent LTRs, yet it is also likely that not all silencing was facilitated by a mechanism reversible by these activators. Furthermore, the possibility that eGFP expression was lacking due to deletion or mutation in the eGFP cassette cannot be excluded. Attempts to reproduce our experiments in an alternate T-cell line, CEM.NKR CCR5+ cells, were unsuccessful as latency reversal was not achieved under similar conditions of stimulation. These cells may have been resistant to the activators used or in an already partially activated state, hence latency reversal was not achieved even at higher PMA concentrations. Alternatively, the mechanism of latency in these cells may have differed from that in the Jurkat E6–1 cell line, and thus alternate mechanisms of reversal may have been required, e.g., use of other LRAs. It is also possible that production of the eGFP-Gag protein was less efficient in this cell-line leading to lack of detection of this marker pre- and post-stimulation. These observations highlight the importance of understanding the intracellular mechanisms of transcriptional silencing as each mechanism may require a different mode of reversal. Furthermore, consistent with previous findings for this model (11), the overall increase in the proportion of mCherry expressing cells (HIV-infected but not producing viral proteins) following PMA/Ionomycin stimulation, indicated that not all infected cells were expressing mCherry constitutively and that the total numbers of infected cells (most likely latently infected cell totals in this case) were therefore underestimated. While the CMV promoter is a strong promoter, it can be silenced via histone modifications as demonstrated in myeloid cell lineages (29, 30). A recent study by Kim et al. using a quadruple reporter latency model reported stability of the PGK promoter for constitutive fluorescent marker expression and reduced promoter interference, demonstrating this promoter as an attractive alternative to the CMV promoter (25).
Subtype-level differences in HIV LTRs such as additional NF-kB sites in subtype C or an additional TATAA box sequence in CRF01_AE have been reported to influence viral replicative fitness (9, 31). Studies investigating LTR signatures associated with the capacity to establish latency are limited, yet capacity for HIV latency establishment was shown to differ across subtypes according to the sequence of the LTR AP-1 binding motif (12). Interestingly, this site was highly conserved within our panel except for one participant LTR harboring a single nucleotide difference from consensus C in this motif that displayed one of the highest latency potentials and the lowest transcriptional capacity in our panel. The impact of polymorphisms in this AP-1 site within a subtype is unknown, yet subtype-level differences were proposed to be due to differences in transcription factor interactions at this site (12). This nucleotide difference may therefore influence latency through altering transcription factor binding capacity.
We evaluated whether LTR transcriptional capacity correlated with latency potential for our participant LTR panel, with the hypothesis that a highly transcriptionally active LTR may be more resistant to transcriptional silencing. Transcriptional capacity as measured by LTR-driven luciferase expression differed across participant LTRs, in the presence and absence of Tat induction. This is in keeping with recent reports by Madlala et al. (13). However, we found no correlation between transcriptional capacity and latency potential in our panel. It is important to note that the tat gene used in our transcriptional capacity experiments was not autologous to the participant LTRs nor was it the same tat harbored by the pRGH plasmid and therefore may not effectively represent the in vivo LTR transcriptional capacity of the autologous virus or fully relate to latency potential in our selected model. In addition, despite being a constant for all genotypes, we cannot rule out that the use of the CAP63 tat may have confounded our measurement of Tat-mediated transcriptional capacity as the selection of tat has been reported to influence LTR transcriptional activity for a given genotype (13).
Mechanisms of latency are multifactorial and while we demonstrated that LTR genotype influenced latency potential, an increased sample size and mutagenesis studies would be needed to further define the exact viral features responsible for these changes. Furthermore, latency establishment is influenced by a variety of intra- and extracellular mechanisms, some likely acting in synergy and not all targeting the viral LTR [reviewed in (5)]. While use of a CD4+ T-cell line with standardized conditions will limit variability between experiments, the use of primary cells as opposed to a cell-line would be most in vivo relevant. Indeed, the developers of the RGH model report the same bias toward latent infection in primary cells, yet these cells could not be infected without prior activation (11) and their use was therefore not explored in our study.
Our study demonstrates that for a range of participant LTR genotypes, HIV can establish latency rapidly and extensively in a CD4+ T cell-line. Genotype variation was shown to influence the proportion of latently infected cells in a manner independent of transcriptional capacity and via unknown mechanisms. While our observations were made in a cohort of women living with HIV, we cannot assume that the same relationship would be identified in men. The lack of LTRs from men infected with HIV is therefore a limitation of this study as sex differences in the HIV transmission bottleneck have previously been reported (32). Furthermore, the efficiency of recruitment or binding of intracellular factors responsible for transcriptional silencing, such as histone modifiers, may play a role, yet this was not explored in this study. Identification of these viral factors, and further exploration of latently infected cells from PLWH, could provide useful insights into targets for prevention or reversal of latency, thereby contributing to HIV cure strategies.
Data availability statement
The datasets presented in this study can be found in online repositories. The names of the repository/repositories and accession number(s) can be found below: https://www.ncbi.nlm.nih.gov/genbank/, accession: PP500775–PP500785.
Ethics statement
The studies involving humans were approved by The University of Cape Town Human Research Ethics Committee (025/2004; 574/2016). The studies were conducted in accordance with the local legislation and institutional requirements. The human samples used in this study were acquired from The CAPRISA 004 acute infection cohort (University of KwaZulu-Natal Research Ethics Committees (E013/04). Informed consent was obtained from all CAPRISA 004 cohort participants.
Author contributions
DD: Formal analysis, Investigation, Visualization, Writing – original draft, Writing – review & editing. PS: Formal analysis, Investigation, Resources, Writing – review & editing. CW: Funding acquisition, Resources, Supervision, Writing – review & editing. DC: Conceptualization, Funding acquisition, Resources, Writing – review & editing. MA: Project administration, Supervision, Visualization, Writing – original draft, Writing – review & editing.
Funding
The author(s) declare financial support was received for the research, authorship, and/or publication of this article. This work was supported by the South African Department of Science and Technology/National Research Foundation’s Centre of Excellence in HIV Prevention (grant UID: 96354). Dr. DC was supported by an NRF Research Career Advancement Fellowship. Dr. PS was supported by post-doctoral funding from the Clinical Infectious Diseases Research Initiative (CIDRI) and the Claude Leon Foundation.
Acknowledgments
We thank the CAPRISA 004 study team for the clinical samples used in this study. The following reagents were obtained through the NIH HIV Reagent Program, Division of AIDS, NIAID, NIH: pRGH-WT, ARP-12427, and pRGH-ΔU3 (3’), ARP-12430, contributed by Ivan Sadowski and Viviana Simon, plasmid pHEF Expressing Vesicular Stomatitis Virus (VSV-G), ARP-4693, contributed by Dr. Lung-Ji Chang, Jurkat (E6–1) Cells, ARP-177, contributed by ATCC (Dr. Arthur Weiss) and CEM.NKR CCR5+ Cells, ARP-4376, contributed by Dr. Alexandra Trkola.
Conflict of interest
The authors declare that the research was conducted in the absence of any commercial or financial relationships that could be construed as a potential conflict of interest.
Publisher’s note
All claims expressed in this article are solely those of the authors and do not necessarily represent those of their affiliated organizations, or those of the publisher, the editors and the reviewers. Any product that may be evaluated in this article, or claim that may be made by its manufacturer, is not guaranteed or endorsed by the publisher.
Supplementary material
The Supplementary Material for this article can be found online at: https://www.frontiersin.org/articles/10.3389/fviro.2024.1393475/full#supplementary-material
References
1. Chun TW, Stuyver L, Mizell SB, Ehler LA, Ann Mican JM, Baseler M, et al. Presence of an inducible HIV-1 latent reservoir during highly active antiretroviral therapy. Proc Natl Acad Sci. (1997) 94:13193–7. doi: 10.1073/pnas.94.24.13193
2. Finzi D, Blankson J, Siliciano J, Margolick J, Chadwick K, Pierson T, et al. Latent infection of CD4+ T cells provides a mechanism for lifelong persistence of HIV-1, even in patients on effective combination therapy. Nat Med. (1999) 5:512–7. doi: 10.1038/8394
3. Whitney JB, Hill AL, Sanisetty S, Penaloza-Macmaster P, Liu J, Shetty M, et al. Rapid seeding of the viral reservoir prior to SIV viraemia in rhesus monkeys. Nature. (2014) 512:74–7. doi: 10.1038/nature13594
4. Siliciano JD, Kajdas J, Finzi D, Quinn TC, Chadwick K, Margolick JB, et al. Long-term follow-up studies confirm the stability of the latent reservoir for HIV-1 in resting CD4+ T cells. Nat Med. (2003) 9:727–8. doi: 10.1038/nm880
5. Cary DC, Fujinaga K, Peterlin BM. Molecular mechanisms of HIV latency. J Clin Invest. (2016) 126:448–54. doi: 10.1172/JCI80565
6. Zerbato JM, Purves HV, Lewin SR, Rasmussen TA. Between a shock and a hard place: challenges and developments in HIV latency reversal. Curr Opin Virol. (2019) 38:1–9. doi: 10.1016/j.coviro.2019.03.004
7. Krebs FC, Hogan TH, Quiterio S, Gartner S, Wigdahl B. Lentiviral LTR-Directed Expression, Sequence Variation, and Disease Pathogenesi. Available online at: www.hmc.psu.edu/wigdahl.
8. Bachu M, Yalla S, Asokan M, Verma A, Neogi U, Sharma S, et al. Multiple NF-κB sites in HIV-1 subtype C long terminal repeat confer superior magnitude of transcription and thereby the enhanced viral predominance. J Biol Chem. (2012) 287:44714–35. doi: 10.1074/jbc.M112.397158
9. Jeeninga RE, Hoogenkamp M, Armand-Ugon M, De Baar M, Verhoef K, Berkhout B. Functional differences between the long terminal repeat transcriptional promoters of human immunodeficiency virus type 1 subtypes A through G. J Virol. (2000) 74:3740–51. doi: 10.1128/JVI.74.8.3740-3751.2000
10. van der Sluis RM, Pollakis G, van Gerven ML, Berkhout B, Jeeninga RE. Latency profiles of full length HIV-1 molecular clone variants with a subtype specific promoter. Retrovirology. (2011) :8:73. doi: 10.1186/1742-4690-8-73
11. Dahabieh MS, Ooms M, Simon V, Sadowski I. A doubly fluorescent HIV-1 reporter shows that the majority of integrated HIV-1 is latent shortly after infection. J Virol. (2013) 87:4716–27. doi: 10.1128/JVI.03478-12
12. Duverger A, Wolschendorf F, Zhang M, Wagner F, Hatcher B, Jones J, et al. An AP-1 binding site in the enhancer/core element of the HIV-1 promoter controls the ability of HIV-1 to establish latent infection. J Virol. (2013) 87:2264–77. doi: 10.1128/JVI.01594-12
13. Madlala P, Mkhize Z, Naicker S, Khathi SP, Maikoo S, Gopee K, et al. Genetic variation of the HIV-1 subtype C transmitted/founder viruses long terminal repeat elements and the impact on transcription activation potential and clinical disease outcomes. PloS Pathog. (2023) 19(6):e1011194. doi: 10.1101/2023.02.09.527959
14. Doolabh DS. The Influence of HIV-1 Subtype C LTR Genotype on Latency Potential. University of Cape Town (2018). Available at: http://hdl.handle.net/11427/29620.
15. Karim QA, Karim SSA, Frohlich JA, Grobler AC, Baxter C, Mansoor LE, et al. Effectiveness and safety of tenofovir gel, an antiretroviral microbicide, for the prevention of HIV infection in women. Sci (1979). (2010) 329:1168–74. doi: 10.1126/science.1193748
16. Selhorst P, Combrinck C, Ndabambi N, Ismail SD, Abrahams MR, Lacerda M, et al. Replication capacity of viruses from acute infection drives HIV-1 disease progression. J Virol. (2017) 91(8):e01806-16. doi: 10.1128/JVI.01806-16
17. Weiss A, Wiskocil RL, Stobo JD. The Role Of T3 Surface Molecules in the Activation of Human T Cells: A Two-Stimulus Requirement for IL 2 Production Reflects Events Occurring at at Pre-Translational Level. J Immunol. (1984) 133:123–8. doi: 10.4049/jimmunol.133.1.123
18. Howell DN, Andreotti PE, Dawson JR, Cresswell P. Natural killing target antigens as inducers of interferon: studies with an immunoselected, natural killing-resistant human T lymphoblastoid cell line. J Immunol. (1985) 134:971–6. doi: 10.4049/jimmunol.134.2.971
19. Lyerly HK, Reed DL, Matthews TJ, Langlois AJ, Ahearne PA, Petteway SR, et al. Anti-GP 120 antibodies from HIV seropositive individuals mediate broadly reactive anti-HIV ADCC. AIDS Res Hum Retroviruses. (1987) 3:409-22. doi: 10.1089/aid.1987.3.409
20. Trkola A, Matthews J, Gordon C, Ketas T, Moore JP. A cell line-based neutralization assay for primary human immunodeficiency virus type 1 isolates that use either the CCR5 or the CXCR4 coreceptor. J Virol. (1999) 73:8966–74. doi: 10.1128/JVI.73.11.8966-8974.1999
21. van Loggerenberg F, Mlisana K, Williamson C, Auld SC, Morris L, Gray CM, et al. Establishing a cohort at high risk of HIV infection in South Africa: challenges and experiences of the CAPRISA 002 acute infection study. PloS One. (2008) 3:e1954. doi: 10.1371/journal.pone.0001954
22. Matsuda Y, Kobayashi-Ishihara M, Fujikawa D, Ishida T, Watanabe T, Yamagishi M. Epigenetic heterogeneity in HIV-1 latency establishment. Sci Rep. (2015) 5:7701. doi: 10.1038/srep07701
23. Mbonye U, Karn J. The molecular basis for human immunodeficiency virus latency. Annu Rev Virol. (2017) 4:261–85. doi: 10.1146/annurev-virology-101416-041646
24. Chavez L, Calvanese V, Verdin E, Latency Is Established Directly HIV. and early in both resting and activated primary CD4 T cells. PloS Pathog. (2015) 11:e1004955. doi: 10.1371/journal.ppat.1004955
25. Kim EH, Manganaro L, Schotsaert M, Brown BD, Mulder LCF, Simon V. Development of an HIV reporter virus that identifies latently infected CD4+ T cells. Cell Rep Methods. (2022) 2(6):100238. doi: 10.1101/2022.01.17.476679
26. Dahabieh MS, Ooms M, Brumme C, Taylor J, Harrigan PR, Simon V, et al. Direct non-productive HIV-1 infection in a T-cell line is driven by cellular activation state and NFκB. Retrovirology. (2014) 11:17. doi: 10.1186/1742-4690-11-17
27. Meichle A, Schütze S, Hensel G, Brunsing D, Krönke M. Protein kinase C-independent activation of nuclear factor κB by tumor necrosis factor. J Biol Chem. (1990) 265:8339–43. doi: 10.1016/S0021-9258(19)39077-5
28. Coudronniere N, Villalba M, Englund N, Altman A. NF-κB activation induced by T cell receptor/CD28 costimulation is mediated by protein kinase C-θ. Proc Natl Acad Sci. (2000) 97:3394–9. doi: 10.1073/pnas.97.7.3394
29. Wills MR, Poole E, Lau B, Krishna B, Sinclair JH. The immunology of human cytomegalovirus latency: Could latent infection be cleared by novel immunotherapeutic strategies? Cell Mol Immunol. (2015) 12:128–38. doi: 10.1038/cmi.2014.75
30. Sinclair J. Human cytomegalovirus: Latency and reactivation in the myeloid lineage. J Clin Virol. (2008) 41:180–5. doi: 10.1016/j.jcv.2007.11.014
31. van Opijnen T, Jeeninga RE, Boerlijst MC, Pollakis GP, Zetterberg V, Salminen M, et al. Human immunodeficiency virus type 1 subtypes have a distinct long terminal repeat that determines the replication rate in a host-cell-specific manner. J Virol. (2004) 78:3675–83. doi: 10.1128/JVI.78.7.3675-3683.2004
Keywords: HIV, latency, LTR, promoter, genotype, subtype C, transcription
Citation: Doolabh DS, Selhorst P, Williamson C, Chopera D and Abrahams M-R (2024) HIV latency potential may be influenced by intra-subtype genetic differences in the viral long-terminal repeat. Front. Virol. 4:1393475. doi: 10.3389/fviro.2024.1393475
Received: 29 February 2024; Accepted: 21 May 2024;
Published: 24 June 2024.
Edited by:
Jaclyn Mann, University of KwaZulu-Natal, South AfricaReviewed by:
Guinevere Q. Lee, Cornell University, United StatesParadise Madlala, University of KwaZulu-Natal, South Africa
Zeger Debyser, KU Leuven Kulak, Belgium
Copyright © 2024 Doolabh, Selhorst, Williamson, Chopera and Abrahams. This is an open-access article distributed under the terms of the Creative Commons Attribution License (CC BY). The use, distribution or reproduction in other forums is permitted, provided the original author(s) and the copyright owner(s) are credited and that the original publication in this journal is cited, in accordance with accepted academic practice. No use, distribution or reproduction is permitted which does not comply with these terms.
*Correspondence: Melissa-Rose Abrahams, bWVsaXNzYS1yb3NlLmFicmFoYW1zQHVjdC5hYy56YQ==