
94% of researchers rate our articles as excellent or good
Learn more about the work of our research integrity team to safeguard the quality of each article we publish.
Find out more
ORIGINAL RESEARCH article
Front. Virol., 21 March 2022
Sec. Virus and Host Immunity
Volume 2 - 2022 | https://doi.org/10.3389/fviro.2022.836291
This article is part of the Research TopicHost Immune Responses to Retroviral InfectionsView all 5 articles
 Paul David1,2
 Jaana Westmeier1Malgorzata Drabczyk-Pluta1
 Tanja Werner1Julia Ickler1Sandra Francois1
 Wibke Bayer1
 Kathrin Sutter1
 Maria Luisa Del Rio3
 Jose-Ignacio Rodriguez-Barbosa3
 Ulf Dittmer1
 Gennadiy Zelinskyy1*
Specific CD8+ T cells are crucial for the control of viruses. However, during many chronic viral infections these cells become dysfunctional. Immune checkpoint receptors, like PD-1 expressed on CD8+ T cells, contribute to this functional suppression during chronic infection. However, during the acute phase of infection virus-specific CD8+ T cells express high levels of PD-1 but are fully competent in killing virus-infected cells and there is increasing evidence that the biological activity of inhibitory receptors is strongly influenced by the availability of their respective ligands. We determined the expression of ligands for inhibitory receptors on infected myeloid cells during the acute phase of Friend retroviral (FV) infection. FV infection of granulocytes, monocytes, and macrophages strongly increased the cell surface expression of PD-L1 and the recently described ligand HVEM for inhibitory receptors BTLA and CD160. In addition, the infection of human myeloid cells in vitro with HIV also enhanced the expression of PD-L1 and HVEM. In infected mice, the upregulation of inhibitory ligands on infected cells was accompanied by enhanced frequencies of FV-specific CD8+ T cells that express PD-1, and the inhibitory receptors CD160 and BTLA. To define the functional effects of HVEM on activated CD8+ T cells, FV-infected mice were treated with blocking antibodies that prevented the interaction of HVEM with its two receptors, CD160 or BTLA, alone or in combination with anti-PD-L1 antibodies. Blocking the interaction of HVEM with CD160 and BTLA improved the production of cytotoxic molecules and the elimination of FV-infected cells. This effect was augmented when the therapy was combined with anti-PD-L1 antibodies, resulting in an additional expansion of cytotoxic CD8+ T cells. Thus, the ligand HVEM for the inhibitory receptors CD160 and BTLA downregulates the functionality of CD8+ T cells during retroviral infection and are potential targets for the immunomodulatory therapy of chronic viral infections.
Cytotoxic CD8+ T lymphocytes (CTL) are crucial for controlling viruses and tumors. However, in several chronic viral infections, such as the human immunodeficiency virus (HIV) and hepatitis C virus (HCV) infection of humans or lymphocytic choriomeningitis virus (LCMV) and Friend virus (FV) infection of mice, virus-specific CD8+ T cells become functionally impaired or “exhausted.” There is compelling evidence that this T cell exhaustion contributes significantly to the reduced control of viruses between the acute and chronic phase and the establishment of viral chronicity. The functional impairment of CTLs is associated with the expression of inhibitory checkpoint receptors and is a result of signaling from these receptors after binding to their ligands (1).
Expanded virus-specific cytotoxic T cells express a high level of programmed death-1 (PD-1) (2) and other inhibitory receptors during acute FV infection but maintain their cytotoxicity and reduce the level of virus infection (3). The expansion of PD-1 expressing CD8+ T cells with full effector functions has also been reported during acute infections of humans with Epstein Barr virus (EBV) (4), hepatitis C virus (HCV) (5), or hepatitis B virus (HBV) (6) as well as in monkeys infected with simian immunodeficiency virus (SIV) (7), or SIV-HIV hybrid virus (SHIV) (8). In previous studies, we started analyzing how effector cells expressing PD-1 convert to the exhausted condition (9, 10). Erythroblast precursor cells (Ter119+), B cells, and myeloid cells are the main targets for FV during acute infection (2). Infected B cells and myeloid cells upregulated PD-L1 expression on the cell surface upon infection whereas infected Ter119+ did not change the expression levels of inhibitory ligands. The PD-1 expressing FV-specific cytotoxic CD8+ T cells preferentially eliminate cells with a low expression of PD-L1 whereas B cells, and myeloid cells with a high expression of PD-L1 become a reservoir of the virus during chronic infection. Upon repeated contacts of PD-1+ CD8+ T cells with PD-L1high virus-infected cells, T cells progressively lose their functional properties. Also during chronic HIV-1 and HTLV-1 infections, myeloid cells become a reservoir for human retroviruses (11, 12) and participation of PD-L1 in immune escape has been described for different viruses and tumors (13, 14). We hypothesize that the direct contact of infected myeloid cells with effector T cells strongly modulates effector cell responses.
In the current study, we focused on characterizing subpopulations of myeloid cells and defined their susceptibility to infection with FV in vivo or with HIV-1 in vitro. The infected cells were analyzed for the expression of the regulatory ligands PD-L1 and HVEM (Herpes Virus Entry Mediator, CD270, TNFRSF14), a member of the tumor necrosis factor receptor superfamily. The engagement of B and T lymphocyte attenuator (BTLA, CD272) or CD160 by HVEM initiates an inhibitory signal whereas the binding of HVEM to LIGHT induces the activation of T cells (15). Despite the co-stimulatory function of HVEM upon interaction with LIGHT on T cells, the predominant function of HVEM appears to be co-inhibitory after the engagement of BTLA or CD160 on T cells (16). Thus, HVEM deficient mice are susceptible to autoimmune disorders and T cells from these animals show an increased response to stimulation (16). An increased expression of HVEM has been detected on melanoma, hepatocellular carcinoma and some other tumors and this has been associated with poor disease prognosis (17, 18). The co-expression of PD-1 and CD160 inhibitory receptors on HIV-specific CD8+ T cells was associated with an advanced dysfunction of these cells (19). The in vitro stimulation of HIV-specific CD8+ T cells with anti-PD-1 antibodies combined with anti-BTLA was more efficient than the stimulation with anti-PD-1 alone (20). Thus, both receptors for HVEM are involved in the regulation of virus-specific CD8+ T cells during HIV infection. In the present study, we performed a detailed characterization of myeloid subpopulations and analyzed HVEM expression prior and post FV infection. An enhanced expression of HVEM on infected granulocytes, monocytes, macrophages and mDCs was observed. Antibody therapy preventing the interaction of HVEM with BTLA and CD160 enhanced the production of cytotoxic molecules in effector CD8+ T cells. Thus, a treatment directed to HVEM and their inhibitory receptors may be a possible therapeutic target for immunoregulation in chronic infection.
Animal experiments were performed in strict accordance with the German Regulations of the Society for Laboratory Animal Science (GV-SOLAS) and of the Federation of European Laboratory Animal Science Associations (FELASA). The protocol was approved by the North Rhine-Westphalia State Agency for Nature, Environment and Consumer Protection (LANUV). All efforts were made to minimize suffering.
Inbred C57BL/6 (B6) mice were maintained under pathogen-free conditions. Experiments were performed using female 6-10 week old C57BL/6 (B6) mice. The relevant FV resistance genotype of B6 mice is H-2b/b, Fv1b/b, Fv2r/r, Rfv3r/r. The B6 mice were obtained from Envigo.
For the generation of CD160 deficient mice, the CRISPR/Cas9 strategy was used to target exon 2 (encodes for the signal peptide) of the CD160 gene, resulting in a deletion of 47 bp (46 bp at the end of exon 2 plus the deletion of the first base pair of exon 3). The consequence of this mutation was the introduction of several premature stop codons within exon 3 and the subsequent inactivation of all possible isoforms of the CD160 gene (21).
C57BL/6 CD160 deficient mice were immunized at day 0 and day 45 with 100 micrograms of mouse CD160 extracellular region bound to mouse IgG2a Ig (Fc fragment) fusion protein emulsified in incomplete Freund Adjuvant. One month after the second immunization, the mice received a final intravenous booster injection of 100 micrograms of soluble antigen with 20 μg of poly I:C and 3 days later, B cells were immortalized by fusing them with X63 Ag8.653 myeloma cells in the presence of PEG 1500, following a procedure previously described (22). Hybridoma cell lines secreting anti-CD160 antibodies were screened by flow cytometry against mouse CD160 transfected HEK293T cell line and mock-transduced control cells.
The set of anti-CD160 antibodies obtained was further characterized to identify antibodies with blocking functions by screening for their ability to prevent the binding of mouse HVEM.Ig (a gift from Genentech) to mouse CD160 transfected HEK293 cells. A hybridoma cell line secreting a partially blocking anti-CD160 mAb designated as a clone 6E7a (mouse IgG1, kappa light chain) was selected and cloned by limiting dilution twice. Then, the hybridoma cell line clone 6E7a was adapted to grow in serum-free medium (SFM) (Thermo Fisher Scientific) supplemented with IgG-depleted fetal calf serum (FCS, Hyclone) (<0.25%) in spinner flasks. Cell culture supernatants were pre-filtered and purified by protein G-sepharose affinity chromatography. The eluted fraction of purified antibody was dialyzed against phosphate-buffered saline (PBS) and finally the purified antibody was passed through a 0.45 μm filter. Purified antibodies for in vivo use were stored frozen at −80°C in endotoxin-free Dulbecco's PBS at a concentration of 1–5 mg/ml containing <2 EU/ml of endotoxin (Pierce™ LAL Chromogenic Endotoxin Quantitation Kit, ThermoFisher).
The FV stock used in these experiments was an uncloned FV complex containing B-tropic Friend murine leukemia helper virus (F-MuLV) and polycythemia-inducing spleen focus-forming virus free of lactate dehydrogenase-elevating virus (23, 24). The FV stocks were prepared as a 10% spleen cell homogenate from BALB/c mice infected 14 days previously with 3 000 spleen focus-forming units of non-cloned virus stock. FV-mWasabi is a recombinant FV complex based on F-MuLV clone FB29 encoding the fluorescent protein mWasabi fused to the Env open reading frame of F-MuLV via a self-cleaving peptide (25). The FV-mWasabi stocks were prepared as a 15% spleen cell homogenate from BALB/c mice infected 15 days previously with 3,000 spleen focus-forming units of stock. Experimental mice were injected intravenously with 0.2 ml of PBS containing 20 000 spleen focus-forming units of FV or FV-mWasabi stocks.
PBMC collection was approved by the Ethics Committee (No.:15-6310) of the medical faculty at the University of Duisburg-Essen. Blood was collected from healthy male and female donors between the ages of 26 and 53 under an approved Institutional Review Board protocol. For this, peripheral blood mononuclear cells (PBMC) were purified by Ficoll-Hypaque density gradient separation as previously described (26). 1 × 10⁷ PBMCs were cultured in RPMI 1640 (Invitrogen, Gaithersburg, MD) containing 10% fetal bovine serum (Hyclone, Logan, UT) and 1% Pen-Strep-Glut (Invitrogen) in a 6-well plate. Cells were resuspended in a complete medium in the presence of 2 μg/ml PHA (Sigma) and IL-2. After 2 days, cells were infected with cell-free HIV-1 NL4.3 (MOI 0.1) via spinoculation at 1,000 g. Viral input was removed following spinoculation and cells were cultivated in fresh media with 1 ×10⁶ cells/ml. Cells were collected at days 3, 5, and 7 and were stained with fluorescent antibodies against CD3 (SK7, BD Bioscience), CD11b (M1/70 BioLegend), CD14 (BV510, BioLegend), CD19 (H1B19, BD Biosciences), CD56 (NCAM16.2, BD Biosciences) CD270 (122, BioLegend) and PD-L1 (29E.2A3, BioLegend) before fixation. Dead cells were detected by staining with Fixable Viability Dyes (FVD) (ThermoFisher). Cells were then permeabilized (BD Cytoperm) and stained for intracellular p24 antigen (KC57-RD1, Beckman Coulter). The cells were analyzed by flow cytometry. Live CD3– CD19– CD56– CD14+ cells (monocytes) and CD3– CD19– CD56– CD11b+ cells (macrophages) were gated to identify p24 positive and negative populations and the expression levels of PD-L1 and CD270 were measured on myeloid populations.
C57BL/6 mice were infected with FV, and 250 μg of anti-PD-L1 antibody (10F.9G2; BioXCell) was administered i.p. at days 6, 8, and 10 after infection. 500 μg anti-HVEM antibody preventing interaction with BTLA (clone 6C9/2E10/2B8) (27, 28) and/or anti-CD160 (clone 6E7a) and isotype control rat IgG (IgG2a and IgG2b 500 μg, BioXCell) were administered i.p. at day 6 and day 9 after infection. Mice were sacrificed at day 12 after infection.
Cell surface staining was performed using Becton Dickinson or eBioscience reagents. The following antibodies were used: anti-CD3 (17A2), anti-CD4 (RM4-5), anti-CD11b (M1/70), anti-CD8 (53-6.7), anti-CD19 (6D5), anti-CD43 (1B11), anti-CD160 (7H1), anti-CD270 (HVEM) (LH1), anti-F4/80 (BM8), anti-Ly6G (1A8), anti-NK1.1 (PK136), anti-PD-1(J43), anti-PD-L1 (10F.9G2) anti-Ter-119 (TER-119), and IgG fluorochrome-conjugates as isotype controls. Dead cells were detected by staining with Fixable Viability Dyes (FVD) (ThermoFisher).
Intracellular granzyme B (GB11, Invitrogen, Darmstadt, Germany) staining was performed as described (29). Data were acquired on a LSR II flow cytometer (Becton Dickinson) from 200,000–300,000 lymphocyte-gated events per sample. FVD positive cells were excluded from the analyses. Analyses were conducted using FlowJo (Treestar) and FACSDiva software (Becton Dickinson).
For the detection of Db-GagL-specific CD8+ T cells, spleen cells were stained with PE-labeled MHC class I H2-Db (Beckman Coulter, Marseille, France) tetramers specific for FV GagL peptide (30, 31) as described previously (29).
Statistics comparing the two groups were done using the unpaired non-parametric t-test or Mann-Whitney t-test. When more than two groups were compared, a one-way ANOVA was used with a Tukey post-test (GraphPad Prism software; GraphPad Software Inc., San Diego, USA).
Myeloid cells originate from hematopoietic stem cells in the bone marrow and are comprised of functionally and morphologically different cell populations. A kinetic analysis of myeloid cells during FV infection was performed by multicolor flow cytometry according to previous studies (32, 33). Alive and lineage negative (CD3−CD19−NK1.1−Ter119−) myeloid CD11b+ cells (Supplementary Figure 1) were further divided into granulocytes (CD11b+ Ly6Clow Ly6Ghigh) and monocytes (CD11b+ Ly6Chigh Ly6Glow). CD11b+ cells, which were double negative for Ly6G and Ly6C but expressed CD11c, were defined as myeloid dendritic cells (mDCs) (CD11b+ Ly6C− Ly6G− CD11c+) or as macrophages (CD11b+ Ly6C− Ly6G− F4/80+ CD11c−). Granulocytes and monocytes were the most abundant myeloid cell populations in the spleens of naïve (day 0) mice (Figures 1A,B, Supplementary Figures 2A,B). FV infection led to a reduction in the frequency of all myeloid cell subpopulations in the spleen. A decline in the number of granulocytes was seen 10 and 12 days after infection, but this did not reach statistical significance in comparison to the naïve mice (day 0) (Figure 1A). Monocyte counts were significantly reduced on day 8 (Figure 1B) and later. A significant drop in the frequencies of macrophages was also seen on days 10 and 12 after infection in comparison to the naïve mice (Figure 1C, Supplementary Figure 2C). Frequencies of mDCs showed a statistically significant decline on days 6, 8, 10, and 12 after FV infection in comparison to the naïve animals (Figure 1D, Supplementary Figure 2D). The data suggests that FV infection resulted in a reduction of all subpopulations of myeloid cells in the spleen especially at days 10 and 12 after infection. The reduction of myeloid cells during FV infection suggest that these cells might be possible targets for the virus. In order to define the frequencies of infected subpopulations of myeloid cells, we used FV expressing the green fluorescent dye mWasabi (25). Cells which expressed mWasabi were defined as FV infected and the remaining cells as non-infected. High numbers of infected cells were observed for granulocytes (Figure 2A, Supplementary Figure 3A) and monocytes (Figure 2B, Supplementary Figure 3B) on day 6 post infection (3,000 and 1,900 infected cells per million nucleated cells in the spleen, respectively), whereas a strong reduction in infected granulocytes and monocytes number was observed on days 10 and 12 post infection. The kinetics of infected macrophages and mDCs were similar. However, the numbers (Figures 2C,D) of infected macrophages and mDCs on day 6 after infection were much lower (197 and 27 mWasabi+ cells per million, respectively) than the numbers of infected granulocytes or monocytes. Thus, in the spleen, granulocytes and monocytes were the main target of FV in the myeloid compartment during the acute phase of infection. Later at day 12 after infection, granulocytes and macrophages became the reservoir for the virus (17 and 25 mWasabi+ cells per million, respectively) (Figures 2A,C).
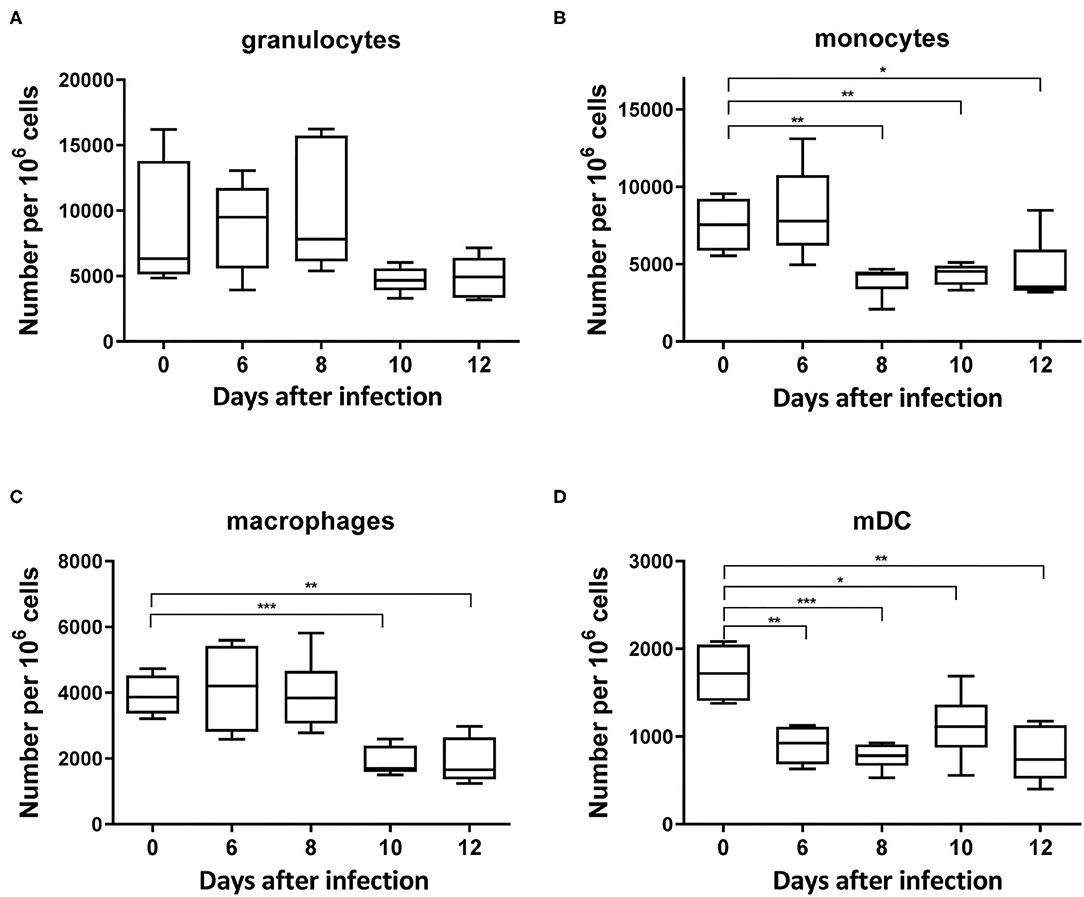
Figure 1. Frequencies of myeloid subpopulations during acute FV infection in the spleen. C57BL/6 mice were infected with FV and splenocytes were isolated at different time points after infection. Multi-parameter flow cytometry analysis was used to determine the numbers of granulocytes (CD11b+ Ly6Clow Ly6Ghigh) (A), monocytes (CD11b+ Ly6Chigh Ly6Glow) (B), macrophages (CD11b+ Ly6G− Ly6C− F4/80+ CD11clow) (C), and mDC (CD11b+ Ly6C− Ly6G− CD11c+) (D) per one million of nucleated cells in the spleen at different time points after infection. Each bar represents the mean number plus SEM per one million nucleated cells for a group of 5–9 mice. Data were pooled from three independent experiments with similar results. Differences between naïve (day 0) and 6, 8, 10, and 12 days infected mice were analyzed using one-way ANOVA with a Tukey post-test (*p < 0.05, **p < 0.005, ***p < 0.0005).
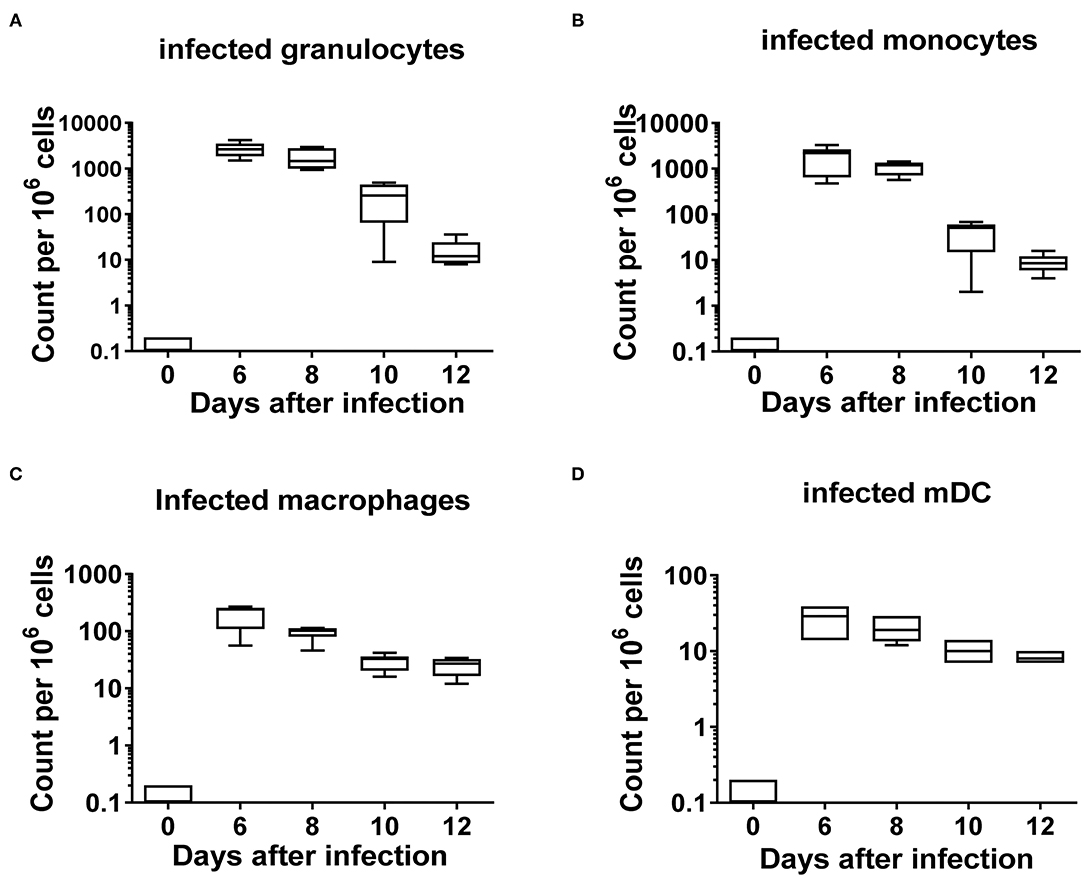
Figure 2. Frequencies of FV infected subpopulations of myeloid cells. C57BL/6 mice were infected with FV encoding m-Wasabi and splenocytes were isolated at different time points after infection. Multi-parameter flow cytometry analysis was used to analyze the kinetics of different infected (mWasabi+) myeloid subpopulations. A box plot showing the frequencies per one million cells of infected granulocytes (CD11b+ Ly6Clow Ly6Ghigh mWasabi+) (A), monocytes (CD11b+ Ly6Chigh Ly6Glow m-Wasabi+) (B), macrophages (CD11b+ Ly6G− Ly6C− F4/80+ CD11clow mWasabi+) (C), and mDC (CD11b+ Ly6C− Ly6G− CD11c+ mWasabi+) (D). Each bar represents the mean number plus SEM per one million nucleated cells for a group of 5–9 mice. Data were pooled from three independent experiments with similar results.
In the next experiment, a kinetic analysis of the mean fluorescence intensity (MFI) of the inhibitory ligands PD-L1 and HVEM was performed. We determined their surface expression on infected myeloid cells (mWasabi+), on non-infected myeloid cells (mWasabi-), and on myeloid cells from naïve mice (day 0) and from FV-mWasabi infected mice. The expression of PD-L1 on infected granulocytes was significantly increased on days 10 (MFI 4150) and 12 (MFI 3299) after infection, whereas no such differences were observed on days 6 and 8 after infection in comparison to the expression of PD-L1 on granulocytes from naïve mice (MFI 1718) (Figure 3A, Supplementary Figure 4A). The expression of PD-L1 on infected granulocytes was also significantly enhanced compared to non-infected granulocytes from the same infected mice on days 10 (MFI 1495) and 12 (MFI 1030) post infection. No differences were observed between the granulocytes from naïve mice and non-infected granulocytes from infected mice.
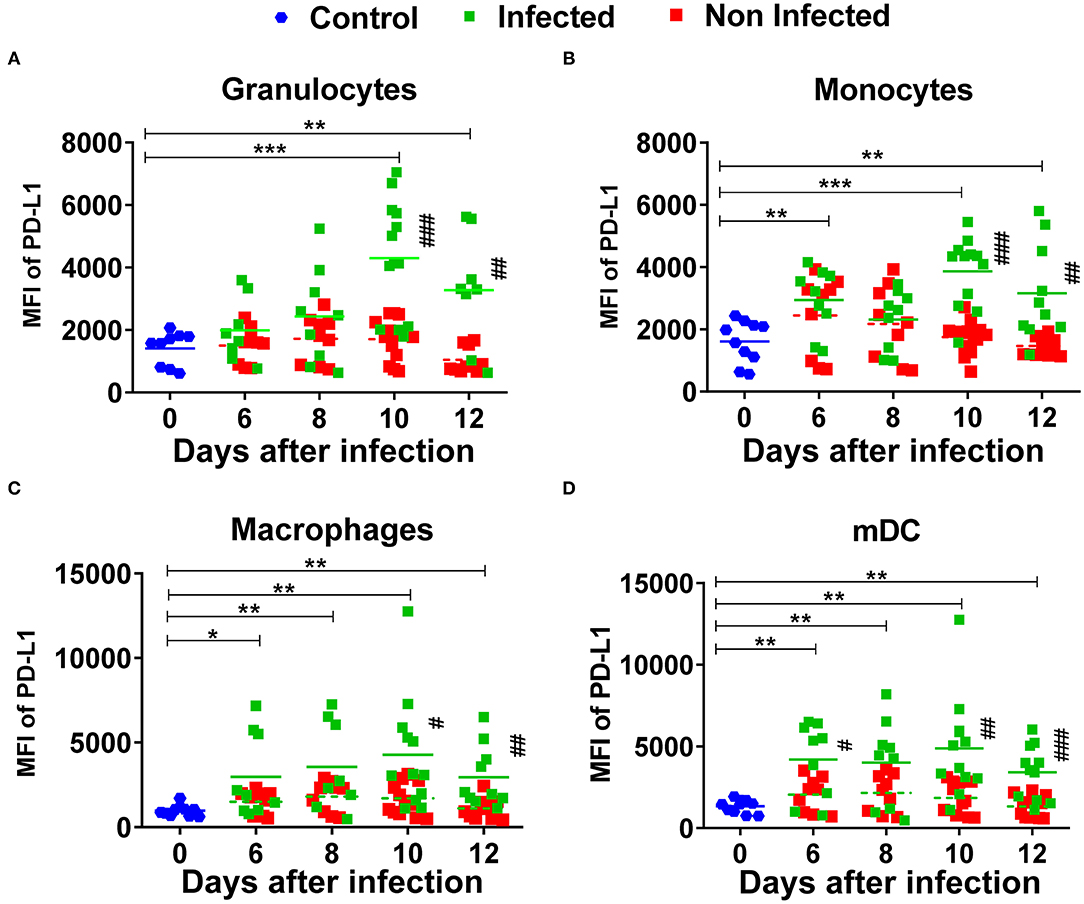
Figure 3. Expression of PD-L1 on myeloid subpopulations after FV infection. C57BL/6 mice were infected with FV-mWasabi and splenocytes were isolated at different time points after infection. Multi-parameter flow cytometry analysis was used to compare the mean fluorescence intensity (MFI) of PD-L1 on the surface of infected (mWasabi+; green), non-infected (mWasabi−; red) and naive (day 0; blue) granulocytes (CD11b+ Ly6Clow Ly6Ghigh) (A), monocytes (CD11b+ Ly6Chigh Ly6Glow) (B), macrophages (CD11b+ Ly6G− Ly6C− F4/80+ CD11clow) (C), and mDC (CD11b+ Ly6C− Ly6G− CD11c+) (D). Each dot represents an individual mouse, the mean MFI of PD-L1 are indicated. Data were pooled from three independent experiments with similar results. Differences between 0 and 6, 8, 10, and 12 days were analyzed using one-way ANOVA with a Tukey post-test (*p < 0.05, **p < 0.005, ***p < 0.0005). Differences between infected and non-infected cells were analyzed using unpaired t-test and are indicated in the figure (#p < 0.05, ##p < 0.005, ###p < 0.0005).
PD-L1 expression on infected monocytes was significantly increased on days 6 (MFI 3226), 10 (MFI 4099) and 12 (MFI 3234) after infection in comparison to the monocytes from naïve mice (MFI 1573) and when compared to the non-infected monocytes from infected mice on days 10 (MFI 1822) and 12 (MFI 1434) (Figure 3B, Supplementary Figure 4A). No differences were observed between the non-infected monocytes from infected mice and monocytes from naïve mice. The expression of PD-L1 on infected macrophages and mDCs was significantly increased at all analyzed time points after infection in comparison to the macrophages and mDCs from naïve mice. The expression of PD-L1 was significantly increased on infected macrophages on days 10 and 12 post infection and on infected mDCs on days 6, 10, and 12 post infection in comparison to the non-infected cells with the same phenotype from infected mice. No significant differences were observed between the non-infected macrophages and mDCs from infected mice and macrophages and mDCs from naive mice (Figures 3C,D, Supplementary Figure 4A). Thus, all analyzed subpopulations of infected myeloid cells strongly enhanced the expression of PD-L1 on their cell surface upon FV infection. The highest values of PD-L1 MFI for infected myeloid cells were seen on day 10 and day 12 after FV infection. The expression levels of PD-L1 on different subpopulations of non-infected myeloid cells from infected mice showed only a slight enhancement. Thus, mainly virus infection drives the upregulation of PD-L1 on myeloid cells.
HVEM is a ligand expressed on both hematopoietic and non-hematopoietic cells that interacts with two inhibitory receptors, BTLA and CD160, which are both expressed on T cells, but B cells only express BTLA since CD160 expression is restricted to a subpopulation of NKT cells and to a less extent NK cells and memory T cells (34). The expression of HVEM on infected granulocytes (Figure 4A, Supplementary Figure 4B) and monocytes (Figure 4B) was significantly increased on days 10 (MFI 2,837 and 2,755, respectively) and 12 (MFI 3,619 and 2,911, respectively) after infection, whereas no differences were observed on days 6 and 8 after infection between the infected granulocytes and granulocytes from naïve mice (MFI 1,211). The expression of HVEM on infected granulocytes and monocytes was significantly increased in comparison to the non-infected cells from infected mice on days 10 (MFI 1,392) and 12 (MFI 1,159) post-infection. No differences were observed between the non-infected granulocytes and monocytes from infected mice and naïve mice. On macrophages and mDCs, the expression of HVEM on infected cells was significantly increased at every analyzed time point in comparison to cells from naive mice. The expression of HVEM on infected macrophages and mDCs was significantly increased in comparison to the non-infected macrophages and mDCs on days 10 and 12 after infection. No changes were observed between the macrophages and mDCs from naïve mice and non-infected macrophages and mDCs from infected mice (Figures 4C,D). Thus, virus infection enhanced to a similar extent the expression of both inhibitory ligands PD-L1 and HVEM on the cell surface of myeloid cells.
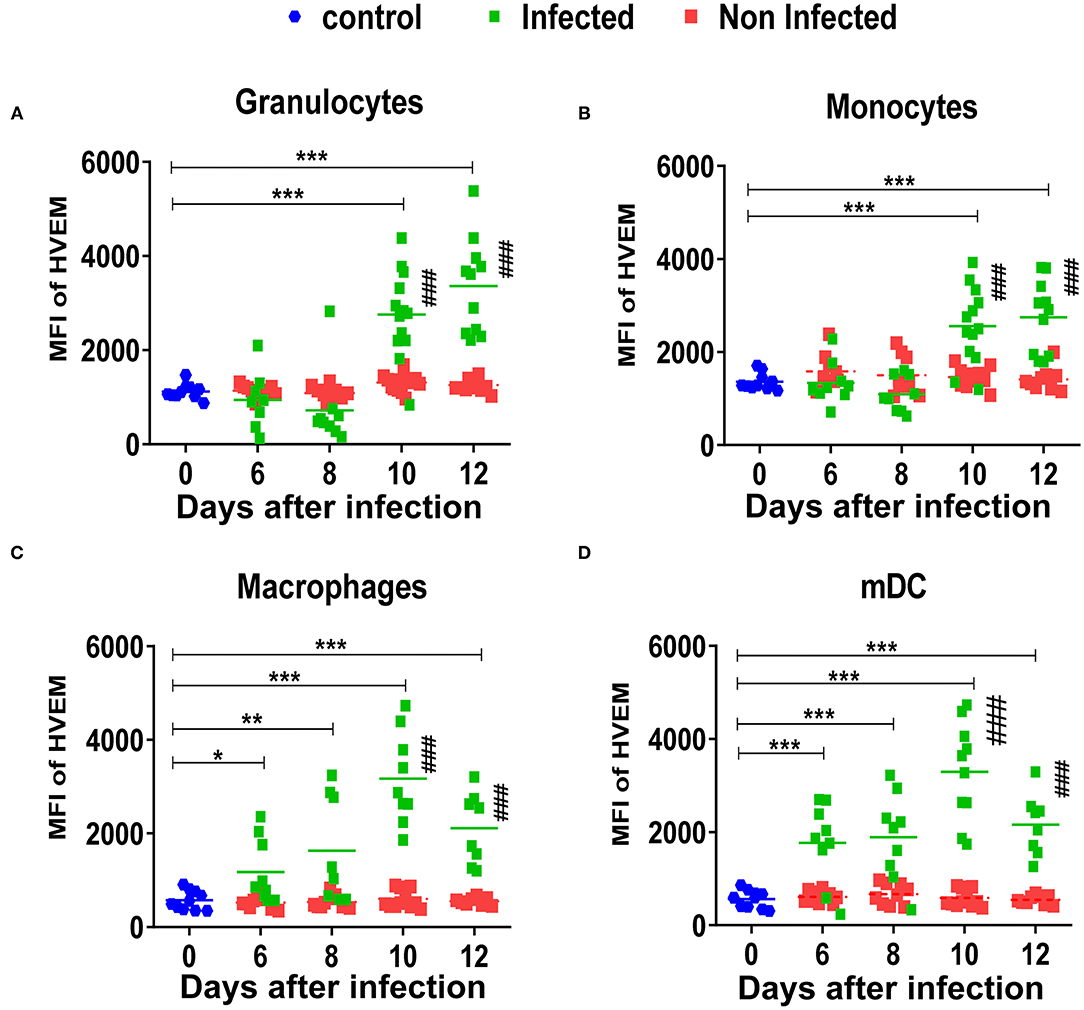
Figure 4. Expression of HVEM on myeloid subpopulations after FV infection. C57BL/6 mice were infected with FV-mWasabi and splenocytes were isolated at different time points after infection. Multi-parameter flow cytometry analysis was used to compare the mean fluorescence intensity (MFI) of HVEM on the surface of infected (mWasabi+; green), non-infected (mWasabi−; red) and naive (day 0; blue) granulocytes (CD11b+ Ly6Clow Ly6Ghigh) (A), monocytes (CD11b+ Ly6Chigh Ly6Glow) (B), macrophages (CD11b+ Ly6G− Ly6C− F4/80+ CD11clow) (C), and mDC (CD11b+ Ly6C− Ly6G− CD11c+) (D). Each dot represents an individual mouse, the mean MFI of HVEM are indicated. Data were pooled from three independent experiments with similar results. Differences between 0 and 6, 8, 10, and 12 days were analyzed using one-way ANOVA with a Tukey post-test (*p < 0.05, **p < 0.005, ***p < 0.0005,). Differences between infected and non-infected cells were analyzed using unpaired t-test and are indicated in the figure (#p < 0.05, ##p < 0.005, ###p < 0.0005).
In the experiments described above, an enhanced expression of immunoregulatory ligands on different populations of infected myeloid cells was observed during FV infection. The objective of the following experiments was to analyze FV-specific effector CD8+ T cells for the expression of the corresponding inhibitory receptors.
Kinetic analysis of the inhibitory receptors PD-1, CD272 (BTLA), and CD160 on CD8+ T cells specific for the immundominant H-2Db-restricted Friend murine leukemia virus glyco-gag derived epitope GagL85−93 (tetramer+) (30) was performed. CD8+ T cells from naïve mice (day 0) were used as the reference cell population. Nearly all FV-specific CD8+ T cells express PD-1 at every analyzed time point post infection (Figure 5A, Supplementary Figure 5). In contrast, only 21% of the expanded FV-specific CD8+ T cells expressed BTLA (Figure 5B) on day 8 after FV infection. The frequency of virus-specific CD8+ T cells expressing CD272 reached 41% on day 10 and 35% on day 12 after infection. CD160 (Figure 5C) was expressed on 24% of the virus-specific CD8+ T cells on day 8 and increased to 31% on day 10. Thereafter, it decreased to 20% on day 12 after infection. Thus, we found a simultaneous increase in the frequency of virus-specific CD8+ T cells expressing the inhibitory receptors BTLA and CD160 with an enhanced expression of CD270 (HVEM) on infected myeloid cells during acute FV infection.
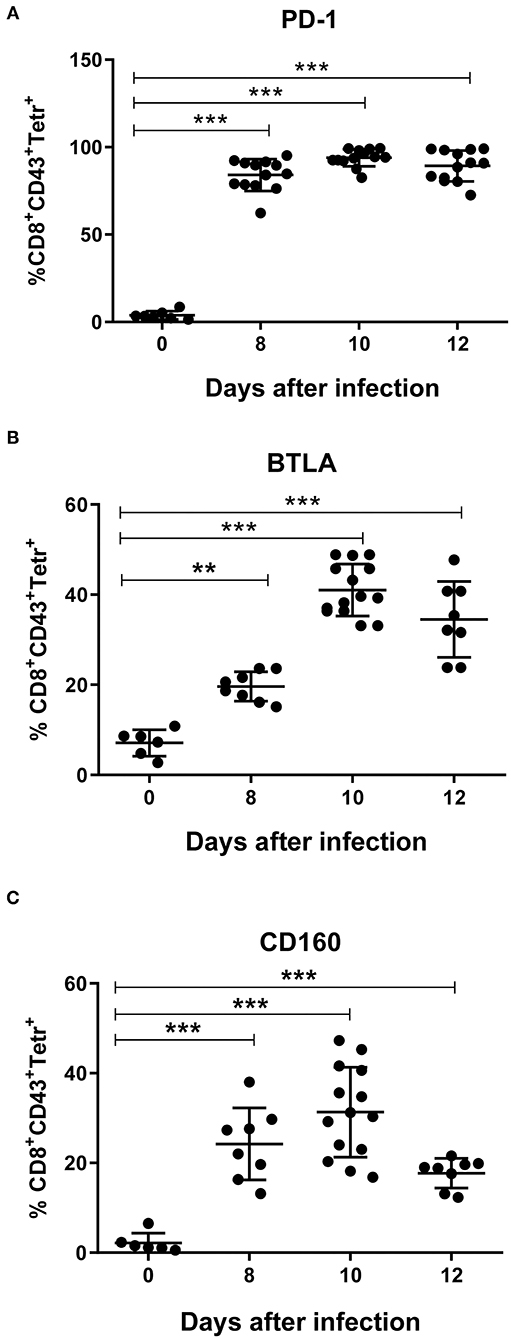
Figure 5. Expression of inhibitory receptors on virus-specific CD8+ T cells. C57BL/6 mice were infected with FV complex and splenocytes were isolated at different time points after infection. Multi-parameter flow cytometry analysis was used to compare the percentage of cells positive for the inhibitory receptors PD-1 (A), BTLA (B), and CD160 (C) on CD8+ T cells specific for the H-2Db–restricted Friend murine leukemia virus glyco-gag derived epitope GagL85−93 (tetramer+) with the percentage of CD8+ T cells in naïve mice (day 0). Data were pooled from three independent experiments with similar results. Each dot represents an individual mouse and the mean for percentage of PD-1+, BTLA+, and CD160+ Tetramer+ CD8+ T cells with SD is indicated. Differences between 0 and 8, 10, and 12 days were analyzed using one-way ANOVA with a Tukey post-test (*p < 0.05, **p < 0.005, ***p < 0.0005).
In previous experiments, we demonstrated that the murine FV enhanced the expression of the inhibitory ligands PD-L1 and HVEM on infected myeloid cells. In the next step, we decided to investigate whether HIV-1 infection also enhances the expression of inhibitory ligands on target cells. Human PBMCs were stimulated in vitro with PHA and IL-2 and infected with HIV-1. The percentage of infected (p24+) monocytes (CD14+) (Figure 6A) and macrophages (CD11b+) (Figure 6B) was analyzed on days 3 (1 and 0.8%, respectively), 5 (1.4 and 0.82%, respectively) and 7 (7.45 and 4.5%, respectively) after infection. The expression of the inhibitory ligands PD-L1 and HVEM on the surface of infected (p24+) cells was compared with the expression on the non-infected myeloid subpopulation (p24-) from the same cell culture, and both infected and non-infected cells were compared with the corresponding subpopulation of cells from stimulated but mock-infected cells (control). The expression of PD-L1 was significantly higher on infected p24+ monocytes (Figure 6C, Supplementary Figure 6) and macrophages (Figure 6D, Supplementary Figure 6) in comparison to non-infected p24-cells from the same myeloid compartment and mock-infected control cells on days 3, 5, and 7 after infection (Figures 6C,D). Non-infected cells from HIV-1-infected cell culture were always indistinguishable in their expression levels of both inhibitory ligands from control cultures without HIV-1 (Figures 6C–F).
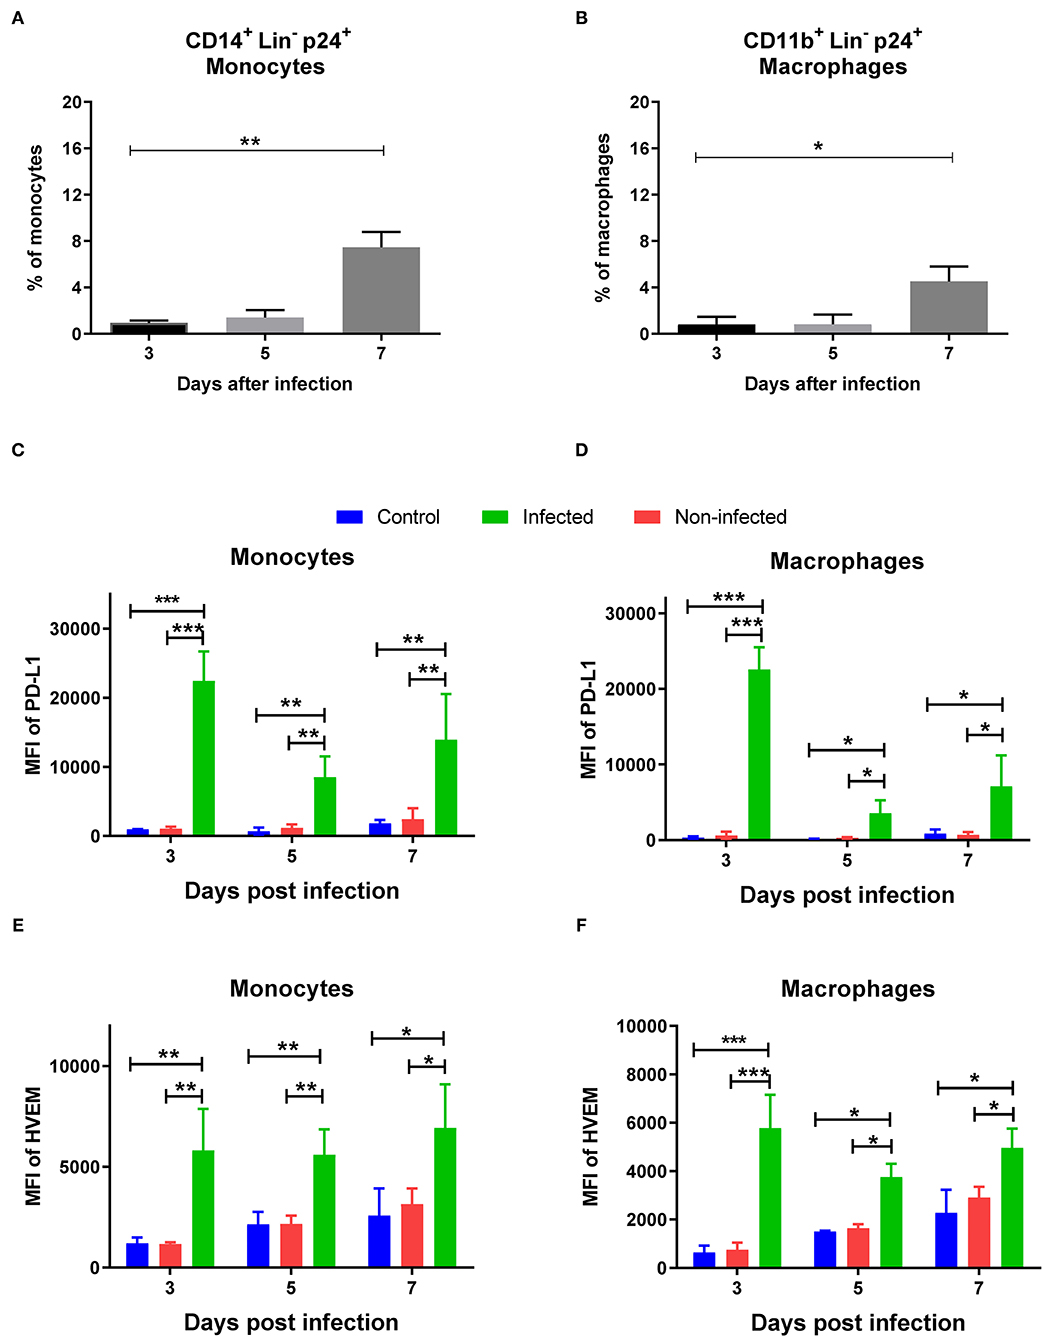
Figure 6. Expression of PD-L1 and HVEM on HIV-1 infected human myeloid cells. Human PBMCs were stimulated with PHA and IL-2 prior to infection with HIV-1 and were analyzed on day 3, 5, 7 after infection. Multi-parameter flow cytometry analysis was used to compare the percentage of p24 on different subpopulations of infected cells. Percentages of infected CD14+ p24+ monocytes (A) and infected CD11b+ p24+ macrophages (B) are shown. Expression levels of PD-L1 on monocytes (C), macrophages (D) and the expression levels of HVEM on monocytes (E), macrophages (F) are shown as mean fluorescence intensity (MFI). Data were pooled from two independent experiments. Differences between day 3, 5, and 7 were analyzed using one-way ANOVA with a Tukey post-test and are indicated in the figure (*p < 0.05, **p < 0.005, ***p < 0.005).
The expression of HVEM was significantly higher on the surface of infected monocytes (p24+) in comparison to non-infected (p24–) and mock-infected monocytes (Figure 6E, Supplementary Figure 6). On macrophages, the expression of HVEM was also significantly higher in infected cells (p24+) in comparison to the non-infected (p24–) and mock-infected monocytes (Figure 6F, Supplementary Figure 6). Taken together, HIV-1 infection of human myeloid cells enhanced the expression of PD-L1 and HVEM on their cell surface in vitro.
The interaction of inhibitory receptors expressed on effector T cells with their ligands on target cells can lead to a reduction of their functionality and subsequent exhaustion. In order to determine whether blocking the interactions between PD-1, CD160, and BTLA and their ligands PD-L1 and HVEM influences the functionality of cytotoxic CD8+ T cells, a treatment with blocking antibodies was performed. A well-known anti-PD-L1 antibody and an anti-HVEM antibody that both prevent the interaction of HVEM with its inhibitory receptor BTLA (27, 35), and the newly developed anti-CD160 antibody described above (Material and methods, Supplementary Figure 7) were used for these treatments. Treatments with single antibodies or a combination of anti-HVEM/CD160 or anti-PD-L1/HVEM/CD160 were performed and CD8+ T cell responses and viral loads were characterized. Thus, two independent checkpoint pathways of CD8+ T cell regulation were blocked in this experiment individually or in combination. As a control group, infected mice treated with isotype IgG were used.
All treatments except that with anti-CD160 slightly enhanced the frequency of CD8+ T cells with effector phenotype (CD43+) (Figure 7A). However, the differences to the control group were not significant. In contrast, all treatments except the single CD160 blocking treatment showed significantly increased frequencies of FV-specific Tetramer+ CD8+ T cells (Figure 7B) in comparison to the control animals. To study the functionality of these cells, we stained them for the cytotoxic effector molecule Granzyme B (GzmB). For effector CD8+ T cells, the frequency of GzmB positive cells was only significantly increased after the two combination therapies with anti-HVEM/CD160 or anti-PD-L1/HVEM/CD160. The frequencies of GzmB+ virus-specific cells and MFI of GzmB in these cells were significantly enhanced after treatments with single anti-PD-L1 and anti-HVEM antibodies and after both combination treatments (Figures 7D,E). One additional important question was necessary to answer—does the blocking of inhibitory signals mediated by HVEM contribute to an additional effect to the extensively used anti-PD-L1 treatment? Combining the anti-PD-L1 therapy with an additional blockade of HVEM and CD160 further enhanced T cell functions significantly (Figures 7C–E). The expansion of cytotoxic T cells was associated with an improved elimination of FV in the spleens of mice receiving combination therapy in comparison to control mice (Figure 7F). The viral loads in mice that received anti-HVEM/CD160 or anti-PD-L1/HVEM/CD160 combination therapy were significantly reduced in comparison to non-treated mice, but no significant effect was seen in any single treatment. The control of FV was improved after combination therapy directed on PD-L1 and HVEM/CD160 in comparison to treatment with anti-PD-L1 alone. Thus, an enhanced number of GzmB producing CD8+ T cells was associated with a reduced number of FV-infected cells after combination treatment, and the blocking of PD-L1/PD-1/CD80 and HVEM/BTLA interaction was found to be a promising therapy approach in viral infection.
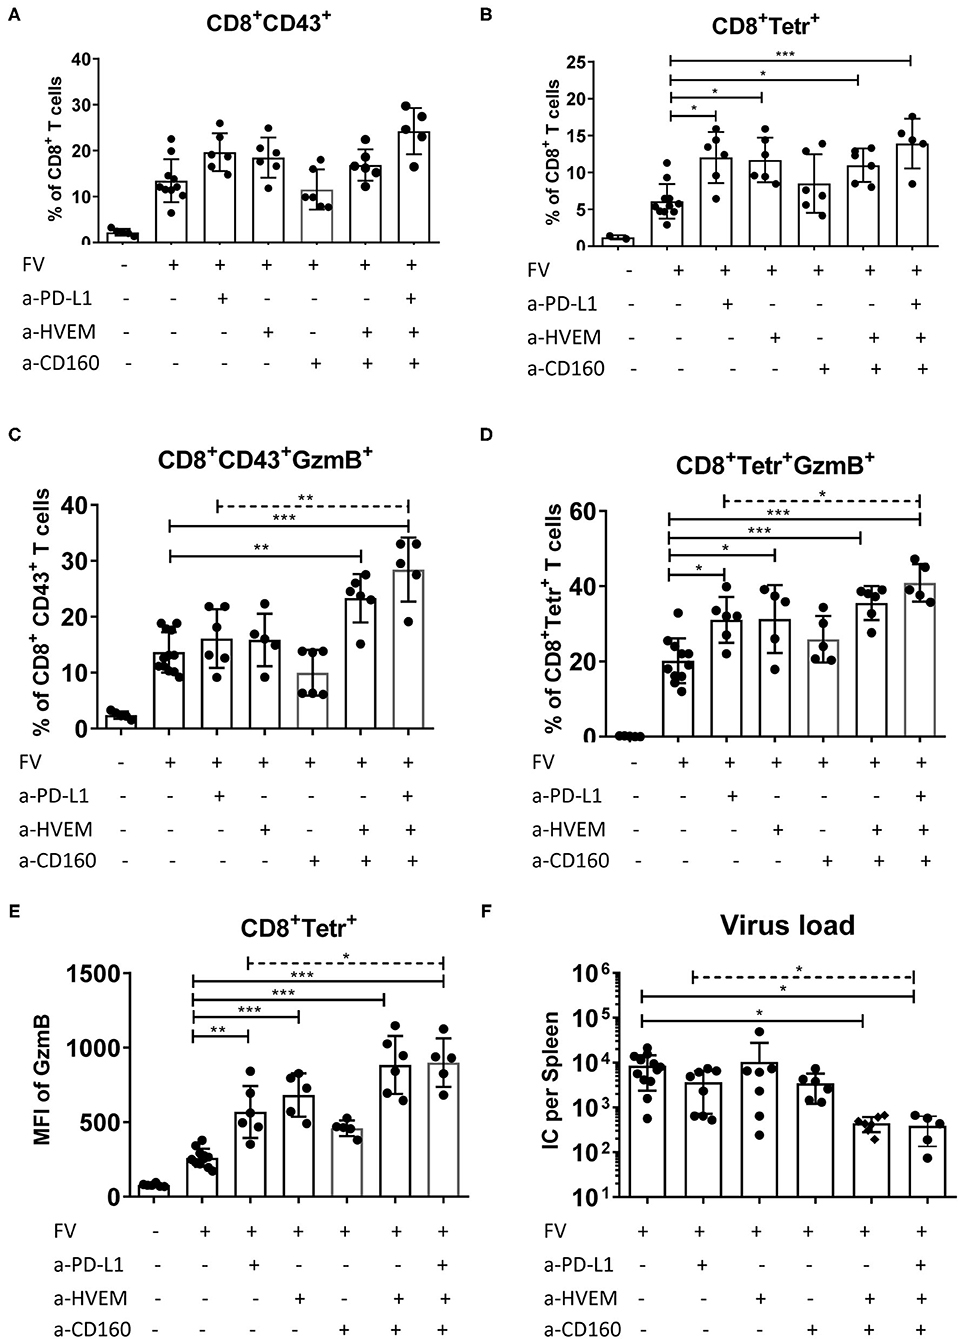
Figure 7. Influence of blocking PD-L1 interaction with PD-1 and HVEM interaction with CD160 and BTLA on effector CD8+ T cells. C57BL/6 mice were infected with FV and treated with anti-PD-L1 antibody blocking the interaction with PD-1 on day 6, 8 and 10 after infection, and/or with anti-HVEM antibody blocking the interaction with BTLA, and/or with anti-CD160 antibody blocking the interaction with HVEM at day 6 and day 9 after infection. Splenocytes were isolated 12 days after infection and used for multi-parameter flow cytometry and analysis of viral loads. The percentages of effector CD43+ CD8+ T cells (A), and virus-specific tetramer+ CD8+ T cells (B), the percentage of effector CD43+ CD8+ T cells producing GzmB (C), and virus-specific tetramer+ CD8+ T cells producing GzmB (D), GzmB MFI of tetramer+ CD8+ T cells (all CD8+ T cells were used from naïve mice) (E), and frequencies of FV infected centers (IC) per one million cells in the spleen (F) are shown. Each dot represents an individual mouse, the mean and SD are indicated. Data were pooled from two independent experiments with similar results. Differences between control (isotype IgG treatment) and all treated groups were analyzed using one-way ANOVA (solid line) with a Tukey post-test. Differences between anti-PD-L1 treated group and group of mice treated with all three antibodies (dashed line) were analyzed using unpaired t-test and are indicated in the figure (*p < 0.05, **p < 0.005, ***p < 0.0005).
The direct interaction of ligands expressed on infected cells or on tumor cells with receptors expressed on antigen specific T lymphocytes is the key checkpoint mechanism for the regulation of the adaptive immunity. The chronic inhibition of CTLs leads to the development of T cell dysfunction and enables the escape of infected or malignant cells from elimination. The accumulation of FV-infected B cells and infected myeloid cells expressing high levels of PD-L1 was associated with the development of dysfunctional CD8+ effector T cells bearing multiple inhibitory receptors (2, 9). The combination treatment of FV-infected mice with blocking anti-PD-1 and anti-Tim-3 (T cell Ig domain and mucin domain 3) antibodies during the acute phase rescued FV-specific CD8+ T cells from dysfunction (2). In the absence of an anti-viral response able to clear the infection, myeloid cells became the reservoir for persistent viral replication. Growing evidence highlights that upregulation of PD-L1 expression is a common feature of viral infected cells in response to the cytolytic activity of CD8+ effector T cells. Thus, the enhanced expression of PD-L1 was previously observed in in vitro HIV-1 infected human macrophages (36). This induction of PD-L1 expression on HIV-1 infected cells has been attributed to the HIV-1 Tat protein (37). An enhanced expression of PD-L1 on the surface of infected cells was also observed after infection with mouse cytomegalovirus (MCMV) (38), influenza virus (39), Theiler's murine encephalomyelitis virus (40), and human rhinovirus (41).
HVEM, member 14 of the TNF receptor superfamily interacts with two co-inhibitory receptors on T cells, BTLA and CD160 (34, 42). To gain insight into the role of the HVEM/BTLA/CD160 pathway in anti-viral responses, we characterized the expression of HVEM on subpopulations of infected and non-infected myeloid cells during acute FV infection in vivo (Figure 4) and HIV infection in vitro (Figure 6). Besides, the expression levels of the inhibitory receptors BTLA and CD160 were also monitored on virus-specific CD8 T cells to address the implication of this pathway in T cell anti-viral responses. Most of the data currently available about the functional effect of HVEM and its receptors have been gathered from different tumor models. Thus, enhanced expression of HVEM was observed on colorectal cancer (CRC) cells and inversely correlated with numbers of tumor infiltrating T cells (43). The increase of the HVEM expression has been reported in melanoma and correlated with poor overall survival (44). It was reported that the engagement of BTLA by HVEM led to a reduction of T cell activation and proliferation (45). HVEM expressed on tumor cells during chronic lymphocytic leukemia (CLL) in cooperation with other inhibitory ligands dysregulated the polarization of effector T cells (46). The expression of inhibitory ligands impairs the formation of cytotoxic synapses between CTLs and tumor and, as a consequence, malignant cells escaped elimination by the anti-tumor response. Despite the compelling evidence gained in tumor models, the role of HVEM during viral infections is not completely understood, although some evidence suggests that HVEM is involved in the regulation of virus-specific CD8+ T cells. The expression of CD160 was previously observed on FV-specific cytotoxic CD8+ PD-1+ T cells (3). CD8+ T cells specific for influenza virus, Epstein–Barr virus (EBV), and cytomegalovirus increase the expression of CD160 (47). Moreover, the co-expression of PD-1 and CD160 on populations of HIV-specific CD8+ T cells has been associated with advanced T cell dysfunction (19). However, this finding is debatable because elite controllers have significantly higher frequencies of virus-specific CD8+ CD160+ T cells in comparison to HAART-treated HIV-1 patients (48). In line with this controversy, using the mouse lymphocytic choriomeningitis virus (LCMV) infection, exhausted LCMV-specific CD8+ T cells upregulate CD160 (49), whereas CD160 deficiency was associated with a reduced functionality of CD8+ T cells and with impaired virus control (50). Overall, these observations claimed that the expression of CD160 on antigen-specific CD8+ T cells may be associated with both dysfunction or enhanced responses in patients suffering from malignancies or chronic viral infections.
The second inhibitory receptor of HVEM, BTLA, has been shown to be upregulated on CD8+ T cells during malignancy and viral infections. Tumor antigen specific CD8+ T cells from melanoma patients with spontaneous anti-tumor immune responses upregulate the expression of BTLA (44) and this expression was associated with a reduced functionality of these CD8+ T cells. The increased BTLA and HVEM expression levels in gastric cancer correlate with the tumor progression and poor prognosis (51). Similarly, BTLA expression was also observed upregulated on CMV-specific CD8+ T cells that induced a suppressive effect, inhibiting their function (52). Liver CD8+ T cells from HBV-infected patients express high levels of BTLA and have an impaired response to antigen-stimulation (53). All this evidence suggests that BTLA expressed on CD8+ T cells exhibits an inhibitory role modulating CTL responses.
The detailed analysis of HVEM expression on different myeloid subpopulations of FV infected cells and the parallel follow up of co-inhibitory receptors BTLA and CD160 on the part of the effector CD8+ T cells described in this work contribute to a better understanding of these regulatory mechanisms occurring during the course of an adaptive immune response against retroviral pathogens. FV infected granulocytes and monocytes enhanced the expression of HVEM at days 10 and 12 after infection (Figures 4A,B). This enhanced expression of HVEM on infected macrophages and myeloid DCs was also observed at every time point during the course of infection (Figures 4C,D). Similar upregulation of HVEM was observed in in vitro HIV infected myeloid cells (Figures 6E,F). Friend virus-specific CD8+ T cells expanding in response to retroviral infection expressed inhibitory receptors BTLA (Figure 5B) and CD160 (Figure 5C). The kinetic expression pattern of the inhibitory ligand HVEM on infected myeloid subpopulation was very similar to that of PD-L1 expression. Moreover, the expression of inhibitory receptors on virus-specific CD8+ T cells strongly suggests that HVEM has similar effects on the elimination of infected cells and on the development of T cell dysfunction like PD-L1 (Figures 5A–C). Interestingly, CMV produces the protein UL144 which expresses a BTLA binding region homolog to HVEM (54). The interaction of UL144 with BTLA mimics the inhibitory effect of HVEM and reduces T cell proliferation. Our experiments with blocking antibodies provide further relevant information on the in vivo role of HVEM and its receptors for the control of a retroviral infection. Combination treatment with antagonist antibodies that prevented the interaction of HVEM/BTLA (27, 35) and the interaction of HVEM/CD160 enhanced production of GzmB in virus-specific effector CD8+ T cells (Figures 7D,E) and reduced the viral loads in treated mice (Figure 7F). This effect was potentiated by dual blockade of HVEM and PD-L1. Globally, our in vivo FV infection data confirm in vitro results obtained with human HIV-specific T cells: the production of IFN-γ after peptide stimulation was enhanced in the presence of a cocktail of blocking antibodies directed against both HVEM receptors (CD160 and BTLA) and blockade of PD-L1/PD-1 interaction in comparison to control samples treated with each individual antibody (19). A similar outcome was observed for CD8+ T cells specific to CMV and EBV upon in vitro treatment with anti-CD160 antibodies (47).
Our study provides new insights on the regulatory role of the HVEM/BTLA/CD160 pathway during the acute phase of the immune response against retroviruses. Moreover, our results show that blocking the interactions between the ligand HVEM and its inhibitory receptors BTLA and CD160 represent an innovative immunotherapeutic strategy to reinvigorate the branch of the host adaptive immune response against viral infections and cancers. The blockade of HVEM/BTLA/CD160 alone or in combination with currently approved treatments directed on PD-L1/PD-1 is a promising therapy worth testing in clinical settings of chronic infections.
The raw data supporting the conclusions of this article will be made available by the authors, without undue reservation.
The studies involving human participants were reviewed and approved by Ethics Committee of the medical faculty at the University of Duisburg-Essen. The patients/participants provided their written informed consent to participate in this study. The animal study was reviewed and approved by Landesamt für Natur, Umwelt und Verbraucherschutz Nordrhein-Westfalen, Leibnizstr. 10, 45659 Recklinghausen, Germany.
PD, JW, and MD-P: data collection, data analysis and interpretation, and drafting the article. TW, SF, and JI: data collection and data analysis and interpretation. WB and KS: design of the work and revision of the article. MLD and J-IR-B: supplied blocking antibody and drafting and revision of the article. UD: conception or design of the work and critical revision of the article. GZ: conception or design of the work, data analysis and interpretation, and drafting the article. All authors contributed to the article and approved the submitted version.
This work was supported by the Deutsche Forschungsgemeinschaft with grant (DFG Di 714/20-1) to UD, Spanish Ministry of Science and Universities (Grant # PID2019-103984RB-I00), Department of Education of Castilla and Leon Regional Government (Grant # LE-006P20), and Spanish Network of Cancer Research, Ciberonc (Grant # CB16/12/00480) to J-IR-B.
The authors declare that the research was conducted in the absence of any commercial or financial relationships that could be construed as a potential conflict of interest.
All claims expressed in this article are solely those of the authors and do not necessarily represent those of their affiliated organizations, or those of the publisher, the editors and the reviewers. Any product that may be evaluated in this article, or claim that may be made by its manufacturer, is not guaranteed or endorsed by the publisher.
The Supplementary Material for this article can be found online at: https://www.frontiersin.org/articles/10.3389/fviro.2022.836291/full#supplementary-material
Supplementary Figure 1. Gating strategy for the definition of myeloid subpopulations. Multi-parameter flow cytometry analysis was used to determine the myeloid subpopulations in a mouse spleen. Dot plots of a representative mouse are shown for the gating strategy to define the main myeloid subpopulations. The gating of whole leucocytes (FSC/SSC) (A), singlets (FSC-H/FSC-A) (B), and CD11b-positive/lineage negative cells (CD3, CD19, NK1.1, and Ter119) was performed for the detection of live myeloid cells (C). Myeloid CD11b-positive cells were divided into granulocytes (Ly6ClowLy6Ghigh) and monocytes (Ly6ChighLy6Glow) (D). The population of Ly6C-negative Ly6G-negative cells was defined as mDC (CD11chigh) or macrophages (F4/80high CD11clow) (E).
Supplementary Figure 2. Numbers of myeloid subpopulations per spleen during acute FV infection. C57BL/6 mice were infected with FV and splenocytes were isolated at different time points after infection. Multi-parameter flow cytometry analysis was used to determine the numbers of granulocytes (CD11b+ Ly6Clow Ly6Ghigh) (A), monocytes (CD11b+ Ly6Chigh Ly6Glow) (B), macrophages (CD11b+ Ly6G− Ly6C− F4/80+ CD11clow) (C), and mDC (CD11b+ Ly6C− Ly6G− CD11c+) (D) per spleen at different time points after infection were calculated. Each box represents the mean number plus SEM for a group of 5–9 mice. Data were pooled from three independent experiments with similar results. Differences between naïve (day 0) and 6, 8, 10, and 12 days infected mice were analyzed using one-way ANOVA with a Tukey post-test (*p < 0.05, **p < 0.005, ***p < 0.0005).
Supplementary Figure 3. Numbers of FV infected subpopulations of myeloid cells per spleen. C57BL/6 mice were infected with FV encoding mWasabi and splenocytes were isolated at different time points after infection. Multi-parameter flow cytometry analysis was used to analyze the kinetics of different infected (mWasabi+) myeloid subpopulations. Each box represents absolute numbers plus SEM of infected granulocytes (CD11b+ Ly6Clow Ly6Ghigh mWasabi+) (A), monocytes (CD11b+ Ly6Chigh Ly6Glow mWasabi+) (B), macrophages (CD11b+ Ly6G− Ly6C− F4/80+ CD11clow mWasabi+) (C), and mDC (CD11b+ Ly6C− Ly6G− CD11c+ mWasabi+) (D) per spleen. Data were pooled from three independent experiments with similar results.
Supplementary Figure 4. Expression of PD-L1 and HVEM on myeloid subpopulations after FV infection. C57BL/6 mice were infected with FV-mWasabi and splenocytes were isolated at day 10 after infection. Multi-parameter flow cytometry analysis was used to compare representative histograms for the MFI of PD-L1 (A) and HVEM (B) expression on the surface of infected (mWasabi+; green), non-infected (mWasabi−; red) and naive (day 0; blue) granulocytes (CD11b+ Ly6Clow Ly6Ghigh) monocytes (CD11b+ Ly6Chigh Ly6Glow), macrophages (CD11b+ Ly6G− Ly6C− F4/80+ CD11clow), and mDC (CD11b+ Ly6C− Ly6G− CD11c+).
Supplementary Figure 5. Expression of inhibitory receptors on virus-specific CD8+ T cells. C57BL/6 mice were infected with FV complex and splenocytes were isolated at different time points after infection. Representative contour plots show CD8+ T cells specific for the H-2Db–restricted Friend murine leukemia virus glyco-gag derived epitope GagL85−93 (tetramer+). Gated cells show the expression of the inhibitory receptors PD-1, BTLA, and CD160.
Supplementary Figure 6. Expression of PD-L1 and HVEM on HIV-1 infected human myeloid cells. Human PBMCs were stimulated with PHA and IL-2 prior to infection with HIV-1 and were analyzed on day 3, 5, and 7 after infection. Representative histograms show the expression of PD-L1 and HVEM on monocytes (A) and macrophages (B).
Supplementary Figure 7. Mouse to mouse CD160 antibody (clone 6E7a) exhibits partial blocking activity of the HVEM/CD160 interaction. (A) Mouse CD160 transfected HEK293T cells were first incubated with anti-mouse CD160 mAbs, then unbound antibody was washed out and an optimal concentration of either mouse HVEM.Ig (1 mg/ml) or isotype-matched control (mouse IgG2a) was added to the reaction and incubated for 1 h at room temperature. The reaction was developed using a biotinylated rat anti-mouse IgG2a monoclonal antibody for 1 h at room temperature and streptavidin-PE. (B) The fluorescence histograms and MFI values show the partial inhibition of HVEM.Ig binding to CD160 transfected HEK293T cells in the presence of anti-mouse CD160 mAbs.
1. Sharpe AH, Wherry EJ, Ahmed R, Freeman GJ. The function of programmed cell death 1 and its ligands in regulating autoimmunity and infection. Nat Immunol. (2007) 8:239–45. doi: 10.1038/ni1443
2. Takamura S, Tsuji-Kawahara S, Yagita H, Akiba H, Sakamoto M, Chikaishi T, et al. Premature terminal exhaustion of Friend virus-specific effector CD8+ T cells by rapid induction of multiple inhibitory receptors. J Immunol. (2010) 184:4696–707. doi: 10.4049/jimmunol.0903478
3. Zelinskyy G, Myers L, Dietze KK, Gibbert K, Roggendorf M, Liu J, et al. Virus-specific CD8+ T cells upregulate programmed death-1 expression during acute friend retrovirus infection but are highly cytotoxic and control virus replication. J Immunol. (2011) 187:3730–7. doi: 10.4049/jimmunol.1101612
4. Greenough A, Shaheen SO, Shennan A, Seed PT, Poston L. Respiratory outcomes in early childhood following antenatal vitamin C and E supplementation. Thorax. (2010) 65:998–1003. doi: 10.1136/thx.2010.139915
5. Kasprowicz V, Schulze Zur Wiesch J, Kuntzen T, Nolan BE, Longworth S, Berical A, et al. High level of PD-1 expression on hepatitis C virus (HCV)-specific CD8+ and CD4+ T cells during acute HCV infection, irrespective of clinical outcome. J Virol. (2008) 82:3154–60. doi: 10.1128/JVI.02474-07
6. Zhang Z, Zhang JY, Wherry EJ, Jin B, Xu B, Zou ZS, et al. Dynamic programmed death 1 expression by virus-specific CD8 T cells correlates with the outcome of acute hepatitis B. Gastroenterology. (2008) 134:1938–49. doi: 10.1053/j.gastro.2008.03.037
7. Petrovas C, Price DA, Mattapallil J, Ambrozak DR, Geldmacher C, Cecchinato V, et al. SIV-specific CD8+ T cells express high levels of PD1 and cytokines but have impaired proliferative capacity in acute and chronic SIVmac251 infection. Blood. (2007) 110:928–36. doi: 10.1182/blood-2007-01-069112
8. Santosuosso M, Righi E, Hill ED, Leblanc PR, Kodish B, Mylvaganam HN, et al. R5-SHIV induces multiple defects in T cell function during early infection of rhesus macaques including accumulation of T reg cells in lymph nodes. PLoS One. (2011) 6:e18465. doi: 10.1371/journal.pone.0018465
9. Akhmetzyanova I, Drabczyk M, Neff CP, Gibbert K, Dietze KK, Werner T, et al. PD-L1 expression on retrovirus-infected cells mediates immune escape from CD8+ T cell killing. PLoS Pathog. (2015) 11:e1005224. doi: 10.1371/journal.ppat.1005224
10. David P, Megger DA, Kaiser T, Werner T, Liu J, Chen L, et al. The PD-1/PD-L1 pathway affects the expansion and function of cytotoxic CD8(+) T cells during an acute retroviral infection. Front Immunol. (2019) 10:54. doi: 10.3389/fimmu.2019.00054
11. Rocamonde B, Carcone A, Mahieux R, Dutartre H. HTLV-1 infection of myeloid cells: from transmission to immune alterations. Retrovirology. (2019) 16:45. doi: 10.1186/s12977-019-0506-x
12. Wong ME, Jaworowski A, Hearps AC. The HIV reservoir in monocytes and macrophages. Front Immunol. (2019) 10:1435. doi: 10.3389/fimmu.2019.02517
13. Patel SP, Kurzrock R. PD-L1 expression as a predictive biomarker in cancer immunotherapy. Mol Cancer Ther. (2015) 14:847–56. doi: 10.1158/1535-7163.MCT-14-0983
14. Schonrich G, Raftery MJ. The PD-1/PD-L1 axis and virus infections: a delicate balance. Front Cell Infect Microbiol. (2019) 9:207. doi: 10.3389/fcimb.2019.00207
15. Rodriguez-Barbosa JI, Schneider P, Weigert A, Lee KM, Kim TJ, Perez-Simon JA, et al. HVEM, a cosignaling molecular switch, and its interactions with BTLA, CD160 and LIGHT. Cell Mol Immunol. (2019) 16:679–82. doi: 10.1038/s41423-019-0241-1
16. Wang Y, Subudhi SK, Anders RA, Lo J, Sun Y, Blink S, et al. The role of herpesvirus entry mediator as a negative regulator of T cell-mediated responses. J Clin Invest. (2005) 115:711–17. doi: 10.1172/JCI200522982
17. Sedy JR, Ramezani-Rad P. HVEM network signaling in cancer. Adv Cancer Res. (2019) 142:145–86. doi: 10.1016/bs.acr.2019.01.004
18. Demerle C, Gorvel L, Olive D. BTLA-HVEM couple in health and diseases: insights for immunotherapy in lung cancer. Front Oncol. (2021) 11:682007. doi: 10.3389/fonc.2021.682007
19. Peretz Y, He Z, Shi Y, Yassine-Diab B, Goulet JP, Bordi R, et al. CD160 and PD-1 co-expression on HIV-specific CD8 T cells defines a subset with advanced dysfunction. PLoS Pathog. (2012) 8:e1002840. doi: 10.1371/journal.ppat.1002840
20. Grabmeier-Pfistershammer K, Stecher C, Zettl M, Rosskopf S, Rieger A, Zlabinger GJ, et al. Antibodies targeting BTLA or TIM-3 enhance HIV-1 specific T cell responses in combination with PD-1 blockade. Clin Immunol. (2017) 183:167–73. doi: 10.1016/j.clim.2017.09.002
21. Del Rio ML, Nguyen TH, Tesson L, Heslan JM, Gutierrez-Adan A, Fernandez-Gonzalez R, et al. The impact of CD160 deficiency on alloreactive CD8 T cell responses and allograft rejection. Transl Res. (2021) 239:103–23. doi: 10.1016/j.trsl.2021.08.006
22. del Rio ML, Fernandez-Renedo C, Chaloin O, Scheu S, Pfeffer K, Shintani Y, et al. Immunotherapeutic targeting of LIGHT/LTbetaR/HVEM pathway fully recapitulates the reduced cytotoxic phenotype of LIGHT-deficient T cells. MAbs. (2016) 8:478–90. doi: 10.1080/19420862.2015.1132130
23. Lilly F, Steeves RA. B-tropic Friend virus: a host-range pseudotype of spleen focus-forming virus (SFFV). Virology. (1973) 55:363–70. doi: 10.1016/0042-6822(73)90176-1
24. Robertson SJ, Ammann CG, Messer RJ, Carmody AB, Myers L, Dittmer U, et al. Suppression of acute anti-friend virus CD8+ T-cell responses by coinfection with lactate dehydrogenase-elevating virus. J Virol. (2008) 82:408–18. doi: 10.1128/JVI.01413-07
25. Windmann S, Otto L, Hrycak CP, Malyshkina A, Bongard N, David P, et al. Infection of B cell follicle-resident cells by friend retrovirus occurs during acute infection and is maintained during viral persistence. mBio. (2019) 10:e00004–19. doi: 10.1128/mBio.00004-19
26. D'Souza M, Fontenot AP, Mack DG, Lozupone C, Dillon S, Meditz A, et al. Programmed death 1 expression on HIV-specific CD4+ T cells is driven by viral replication and associated with T cell dysfunction. J Immunol. (2007) 179:1979–87. doi: 10.4049/jimmunol.179.3.1979
27. del Rio ML, Jones ND, Buhler L, Norris P, Shintani Y, Ware CF, et al. Selective blockade of herpesvirus entry mediator-B and T lymphocyte attenuator pathway ameliorates acute graft-versus-host reaction. J Immunol. (2012) 188:4885–96. doi: 10.4049/jimmunol.1103698
28. Del Rio ML, Bravo Moral AM, Fernandez-Renedo C, Buhler L, Perez-Simon JA, Chaloin O, et al. Modulation of cytotoxic responses by targeting CD160 prolongs skin graft survival across major histocompatibility class I barrier. Transl Res. (2017) 181:83–95 e83. doi: 10.1016/j.trsl.2016.09.004
29. Zelinskyy G, Dietze KK, Husecken YP, Schimmer S, Nair S, Werner T, et al. The regulatory T-cell response during acute retroviral infection is locally defined and controls the magnitude and duration of the virus-specific cytotoxic T-cell response. Blood. (2009) 114:3199–207. doi: 10.1182/blood-2009-03-208736
30. Chen W, Qin H, Chesebro B, Cheever MA. Identification of a gag-encoded cytotoxic T-lymphocyte epitope from FBL-3 leukemia shared by Friend, Moloney, and Rauscher murine leukemia virus-induced tumors. J Virol. (1996) 70:7773–82. doi: 10.1128/jvi.70.11.7773-7782.1996
31. Schepers K, Toebes M, Sotthewes G, Vyth-Dreese FA, Dellemijn TA, Melief CJ, et al. Differential kinetics of antigen-specific CD4+ and CD8+ T cell responses in the regression of retrovirus-induced sarcomas. J Immunol. (2002) 169:3191–9. doi: 10.4049/jimmunol.169.6.3191
32. Rose S, Misharin A, Perlman H. A novel Ly6C/Ly6G-based strategy to analyze the mouse splenic myeloid compartment. Cytometry A. (2012) 81:343–50. doi: 10.1002/cyto.a.22012
33. Zaynagetdinov R, Sherrill TP, Kendall PL, Segal BH, Weller KP, Tighe RM, et al. Identification of myeloid cell subsets in murine lungs using flow cytometry. Am J Respir Cell Mol Biol. (2013) 49:180–9. doi: 10.1165/rcmb.2012-0366MA
34. del Rio ML, Lucas CL, Buhler L, Rayat G, Rodriguez-Barbosa JI. HVEM/LIGHT/BTLA/CD160 cosignaling pathways as targets for immune regulation. J Leukoc Biol. (2010) 87:223–35. doi: 10.1189/jlb.0809590
35. Rodriguez-Barbosa JI, Fernandez-Renedo C, Moral AMB, Buhler L, Del Rio M. L. T follicular helper expansion and humoral-mediated rejection are independent of the HVEM/BTLA pathway. Cell Mol Immunol. (2017) 14:497–510. doi: 10.1038/cmi.2015.101
36. Rodriguez-Garcia M, Porichis F, de Jong OG, Levi K, Diefenbach TJ, Lifson JD, et al. Expression of PD-L1 and PD-L2 on human macrophages is up-regulated by HIV-1 and differentially modulated by IL-10. J Leukoc Biol. (2011) 89:507–15. doi: 10.1189/jlb.0610327
37. Planes R, BenMohamed L, Leghmari K, Delobel P, Izopet J, Bahraoui E. HIV-1 tat protein induces PD-L1 (B7-H1) expression on dendritic cells through tumor necrosis factor alpha- and toll-like receptor 4-mediated mechanisms. J Virol. (2014) 88:6672–89. doi: 10.1128/JVI.00825-14
38. Benedict CA, Loewendorf A, Garcia Z, Blazar BR, Janssen EM. Dendritic cell programming by cytomegalovirus stunts naive T cell responses via the PD-L1/PD-1 pathway. J Immunol. (2008) 180:4836–47. doi: 10.4049/jimmunol.180.7.4836
39. McNally B, Ye F, Willette M, Flano E. Local blockade of epithelial PDL-1 in the airways enhances T cell function and viral clearance during influenza virus infection. J Virol. (2013) 87:12916–24. doi: 10.1128/JVI.02423-13
40. Jin YH, Hou W, Kang HS, Koh CS, Kim BS. The role of interleukin-6 in the expression of PD-1 and PDL-1 on central nervous system cells following infection with Theiler's murine encephalomyelitis virus. J Virol. (2013) 87:11538–51. doi: 10.1128/JVI.01967-13
41. Heinecke L, Proud D, Sanders S, Schleimer RP, Kim J. Induction of B7-H1 and B7-DC expression on airway epithelial cells by the Toll-like receptor 3 agonist double-stranded RNA and human rhinovirus infection: in vivo and in vitro studies. J Allergy Clin Immunol. (2008) 121:1155–60. doi: 10.1016/j.jaci.2008.02.009
42. Watanabe N, Gavrieli M, Sedy JR, Yang J, Fallarino F, Loftin SK, et al. BTLA is a lymphocyte inhibitory receptor with similarities to CTLA-4 and PD-1. Nat Immunol. (2003) 4:670–9. doi: 10.1038/ni944
43. Inoue T, Sho M, Yasuda S, Nishiwada S, Nakamura S, Ueda T, et al. HVEM expression contributes to tumor progression and prognosis in human colorectal cancer. Anticancer Res. (2015) 35:1361–7.
44. Derre L, Rivals JP, Jandus C, Pastor S, Rimoldi D, Romero P, et al. BTLA mediates inhibition of human tumor-specific CD8+ T cells that can be partially reversed by vaccination. J Clin Invest. (2010) 120:157–67. doi: 10.1172/JCI40070
45. Murphy KM, Nelson CA, Sedy JR. Balancing co-stimulation and inhibition with BTLA and HVEM. Nat Rev Immunol. (2006) 6:671–81. doi: 10.1038/nri1917
46. Ramsay AG, Clear AJ, Fatah R, Gribben JG. Multiple inhibitory ligands induce impaired T-cell immunologic synapse function in chronic lymphocytic leukemia that can be blocked with lenalidomide: establishing a reversible immune evasion mechanism in human cancer. Blood. (2012) 120:1412–21. doi: 10.1182/blood-2012-02-411678
47. Vigano S, Banga R, Bellanger F, Pellaton C, Farina A, Comte D, et al. CD160-associated CD8 T-cell functional impairment is independent of PD-1 expression. PLoS Pathog. (2014) 10:e1004380. doi: 10.1371/journal.ppat.1004380
48. Pombo C, Wherry EJ, Gostick E, Price DA, Betts MR. Elevated expression of CD160 and 2B4 defines a cytolytic HIV-specific CD8+ T-cell population in elite controllers. J Infect Dis. (2015) 212:1376–86. doi: 10.1093/infdis/jiv226
49. Blackburn SD, Crawford A, Shin H, Polley A, Freeman GJ, Wherry EJ. Tissue-specific differences in PD-1 and PD-L1 expression during chronic viral infection: implications for CD8 T-cell exhaustion. J Virol. (2010) 84:2078–89. doi: 10.1128/JVI.01579-09
50. Zhang L, Zhang A, Xu J, Qiu C, Zhu L, Qiu C, et al. CD160 plays a protective role during chronic infection by enhancing both functionalities and proliferative capacity of CD8+ T cells. Front Immunol. (2020) 11:2188. doi: 10.3389/fimmu.2020.02188
51. Lan X, Li S, Gao H, Nanding A, Quan L, Yang C, et al. Increased BTLA and HVEM in gastric cancer are associated with progression and poor prognosis. Onco Targets Ther. (2017) 10:919–26. doi: 10.2147/OTT.S128825
52. Serriari NE, Gondois-Rey F, Guillaume Y, Remmerswaal EB, Pastor S, Messal N, et al. B and T lymphocyte attenuator is highly expressed on CMV-specific T cells during infection and regulates their function. J Immunol. (2010) 185:3140–8. doi: 10.4049/jimmunol.0902487
53. Wang H, Wu B, Li L, Hu L, Lin J, Jiang C, et al. Hepatic expansion of virus-specific CD8(+)BTLA(+) T cells with regulatory properties in chronic hepatitis B virus infection. Cell Immunol. (2017) 311:36–45. doi: 10.1016/j.cellimm.2016.10.002
Keywords: immunoregulation, retrovirus, CD160, BTLA, HVEM, PD-L1, PD-1, CD8
Citation: David P, Westmeier J, Drabczyk-Pluta M, Werner T, Ickler J, Francois S, Bayer W, Sutter K, Del Rio ML, Rodriguez-Barbosa J-I, Dittmer U and Zelinskyy G (2022) The Role of the Inhibitory Ligand HVEM and Its Receptors CD160 and BTLA in the Regulation of Anti-retroviral T Cell Responses. Front. Virol. 2:836291. doi: 10.3389/fviro.2022.836291
Received: 15 December 2021; Accepted: 17 February 2022;
Published: 21 March 2022.
Edited by:
Masaaki Miyazawa, Kindai University, JapanReviewed by:
Ceri Alan Fielding, Cardiff University, United KingdomCopyright © 2022 David, Westmeier, Drabczyk-Pluta, Werner, Ickler, Francois, Bayer, Sutter, Del Rio, Rodriguez-Barbosa, Dittmer and Zelinskyy. This is an open-access article distributed under the terms of the Creative Commons Attribution License (CC BY). The use, distribution or reproduction in other forums is permitted, provided the original author(s) and the copyright owner(s) are credited and that the original publication in this journal is cited, in accordance with accepted academic practice. No use, distribution or reproduction is permitted which does not comply with these terms.
*Correspondence: Gennadiy Zelinskyy, Z2VubmFkaXkuemVsaW5za3l5QHVuaS1kdWUuZGU=
Disclaimer: All claims expressed in this article are solely those of the authors and do not necessarily represent those of their affiliated organizations, or those of the publisher, the editors and the reviewers. Any product that may be evaluated in this article or claim that may be made by its manufacturer is not guaranteed or endorsed by the publisher.
Research integrity at Frontiers
Learn more about the work of our research integrity team to safeguard the quality of each article we publish.