
95% of researchers rate our articles as excellent or good
Learn more about the work of our research integrity team to safeguard the quality of each article we publish.
Find out more
METHODS article
Front. Virol. , 07 December 2021
Sec. Bioinformatic and Predictive Virology
Volume 1 - 2021 | https://doi.org/10.3389/fviro.2021.751196
 Xingfei Gong1,2†
 Mingda Hu1†
 Boqian Wang1
 Haoyi Yang1,2
 Yuan Jin1
 Long Liang1
 Junjie Yue1*Wei Chen2*
 Hongguang Ren1*
Influenza A virus is a segmented RNA virus whose genome consists of 8 single-stranded negative-sense RNA segments. This unique genetic structure allows viruses to exchange their segments through reassortment when they infect the same host cell. Studying the determination and nature of influenza A virus reassortment is critical to understanding the generation of pandemic strains and the spread of viruses across species. Reassortment detection is the first step in influenza A virus reassortment research. Several methods for automatic detection of reassortment have been proposed, which can be roughly divided into two categories: phylogenetic methods and distance methods. In this article, we proposed a reassortment detection method that does not require multiple sequence alignment and phylogenetic analysis. We extracted the codon features from the segment sequence and expressed the sequence as a feature vector, and then used the clustering method of self-organizing map to cluster the sequence for each segment. Based on the clustering results and the epidemiological information of the virus, the reassortment detection was implemented. We used this method to perform reassortment detection on the collected 7,075 strains from Asia and identified 516 reassortment events. We also conducted a statistical analysis of the identified reassortment events and found conclusions consistent with previous studies. Our method will provide new insights for automating reassortment detection tasks and understanding the reassortment patterns of influenza A viruses.
Annual epidemics and occasional pandemics caused by the influenza A virus (IAV) are important threats to human health. IAV can cause acute respiratory infections and cause high morbidity and mortality (1). Influenza A virus is a segmented RNA virus whose genome consists of 8 single-stranded, negative-sense RNA segments. When multiple influenza A viruses infect the same host cell, due to the genome characteristics of segmented viruses, the genomes of multiple viruses may exchange their segments, resulting in progeny viruses with new genome combinations (2). This process is called reassortment. Reassortment plays an important but undefined role in the cross-species transmission of influenza A virus (3). Many influenza pandemics in history were related to reassortment, including the Asian H2N2 influenza in 1957, the Hong Kong H3N2 influenza in 1968, and the 2009 H1N1 global influenza pandemic. The H7N9 avian influenza virus that broke out in 2013 was also reassorted from different viruses according to the study (4–6). Therefore, studying the determination and nature of influenza A virus reassortment is essential for understanding the generation of pandemic strains and the spread of viruses across species.
Reassortment detection is the first step in the study of influenza A virus reassortment. Due to the different evolutionary histories from different viral gene segments, reassortment can be detected by comparing the inconsistencies in the phylogenetic relationship between different segments of the reassortant virus genome (7–10). However, this method is impractical for studying large-scale influenza A virus data sets. On the one hand, the cost of building a phylogenetic tree will increase exponentially with the growth of data. On the other hand, for viruses with complex reassortment history, this method is also difficult to infer the actual situation. Therefore, several methods for automatic detection of reassortment have been proposed. These methods can be roughly divided into two categories: phylogenetic methods and distance methods. In the phylogenetic method (11), proposed FluReF, which searched the full phylogenetic tree from bottom to top to select candidate reassortment groups and determined candidates that satisfied the preset threshold and resulted in inconsistencies between the segment trees. Nagarajan and Kingsford (12) proposed a reassortment finder GiRaF based on graph incompatibility. This algorithm was based on an earlier method (13), which used a fast search algorithm to mine phylogenetic inconsistencies by constructing an incompatibility graph. GiRaF then used the phylogenetic distance test to increase the false positive rate and combined the results of all fragments of the genome to generate a comprehensive reassortment catalog. In the distance method (14), estimated that the two strains did not have the possibility of reassortment based on the Hamming distance between different segments. De Silva et al. (15) reported an algorithm based on strain neighborhood. They found the closest set of strains from the reference set for each segment and compared the results between different segments to identify reassortment. In general, the phylogenetic method is more reliable than the distance method, but its cost is higher and depends on the accuracy of the constructed phylogenetic tree, which is not suitable for large-scale data sets.
In this article, we proposed a phylogeny-independent reassortment detection method. It does not need to perform multiple sequence alignment or construct a phylogenetic tree. We expressed the sequence as a feature vector and used the clustering method of self-organizing map to cluster the sequence of each segment. After uniformly naming the type of each segment of the virus, it becomes very simple to identify the reassortment. We used this method to detect the overall reassortment for viruses in Asia, and performed a statistical analysis of the identified reassortment events to dig out the reassortment determinations and patterns. Our results showed that the algorithm can identify reassortment events reported in previous studies and reveal the complex reassortment history in Asia. Therefore, our method can effectively perform reassortment analysis on large-scale data sets.
To study the reassortment pattern in Asia as comprehensively as possible, we assembled all the sequences from the Influenza Virus Resources at the National Centre for Biotechnology Information (NCBI) (https://ftp.ncbi.nih.gov/genomes/INFLUENZA/). The sequences sampled in Asia were then extracted. The sequences we downloaded are coding sequences. For each segment, we only consider the longest coding sequence. We deleted sequences with illegal characters in the codon region or incomplete length. Sequences without clear epidemiological information were also deleted. We did not consider the laboratory sequences. The genome of a virus would be preserved only when eight segment sequences met the above standards. After that, we obtained 7,075 genomes of IAVs. The distribution of the number of viruses in each subtype was shown in Figure 1A. There are a large number of IAVs with H1N1 and H3N2 subtypes, both exceeding 1,000 strains. In the distribution of the host (Figure 1B), viruses that infected humans, waterfowl, domestic birds, and swine account for the vast majority.
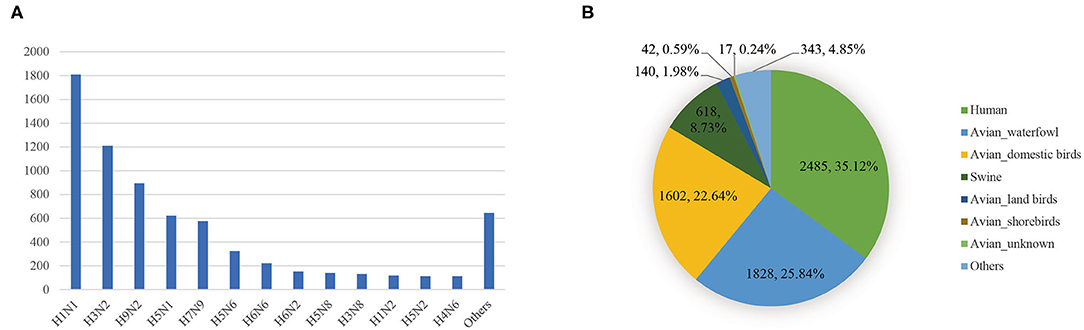
Figure 1. (A) The distribution of the number of viruses in each subtype. (B) The distribution of the number of viruses in each host.
Based on the distance measure DMk proposed by Wei et al. (16), we introduced our feature extraction method for each segment sequence. A segment sequence is composed of 64 kinds of codons arranged in order. Since a codon may appear multiple times in the sequence, we can record the position of each occurrence. All the occurrence positions can form an array, recorded as {p0, p1, p2, ⋯ , pn}. In order to facilitate the calculation of the interval, the position at the 0th occurrence p0 = 0 is added to the position sequence. Then we used the reciprocal of the interval between each occurrence and the previous occurrence as its occurrence density, calculated as
Where pi represents the position of the i th occurrence of the codon, and pi−1 represents the position of the i-1 th occurrence of the codon. di reflects the interval, or density, between the i th occurrence and the i-1 th occurrence of the codon. In order to describe the order of the density array, we accumulated the density array to obtain the partial sum array, calculated as:
The partial sum array is calculated directly based on the density array, for example, s1 = d1, s2 = d1+d2, and so on. This array is only determined by the occurrence position of the codon, and the position of the codon can be reversed based on the array. Shannon entropy reflects the order relationship of the elements in the sequence. In order to calculate Shannon entropy, we constructed a discrete probability distribution Q = {q1, q2, ⋯ , qn}, where each probability is calculated as . Then the Shannon entropy can be calculated as:
For each codon, we can calculate a Shannon entropy, and the Shannon entropy of all codons finally constitutes a feature vector. In the actual process, we removed the feature of 3 stop codons, and finally got a 61-dimensional vector for each segment sequence.
In this section, we proposed a sequence clustering method based on the self-organizing map (SOM). SOM is an unsupervised artificial neural network. Different from the general neural network training based on the reverse transfer of the loss function, it uses a competitive learning strategy and relies on the competition between neurons to gradually optimize the network. The neighbor relationship function is used to maintain the topological structure of the input space. In our clustering method, the algorithm takes the 61-dimensional vectors extracted from the segment sequences as input and maps them to the nodes of the two-dimensional grid. Segment sequences with high similarity in the input space will be mapped to the same node. We used the minisom library to implement our algorithm. First, we calculated the number of nodes in the output layer according to the empirical formula of clustering , where N is the number of genomes. The size of the output layer is . The calculations above were rounded up. Then we initialize the SOM algorithm according to the following parameters: the output layer size was set to 61; the sigma parameter was set to 2; the learning rate was set to 1, and the neighborhood function was set to triangle; weight initialization method was set to PCA. The feature vector of each sequence was trained iteratively. After training, each vector was input to the SOM network and the winning node was the clustering type of the virus segment. Then we calculated the contour coefficient of the clustering result and recorded the corresponding parameters. Finally, we changed the parameters and repeated clustering. The clustering result with the highest contour coefficient was regarded as our final result for the segment clustering.
Based on our clustering for each segment, we assigned a number x to each type and recorded it as segment_x. The virus sequences contained in each type were considered to have the same segmental ancestors. Therefore, if the eight segment types of a virus can be combined from segment types of other viruses, this virus may be produced by the reassortment of these viruses. There may be a situation where different combinations of multiple viruses can produce the eight segment types of the virus. For example, the eight segment types of virus A may be combined from segment types of virus B and virus C, or combined from segment types of virus D and virus E. Then we need to consider which combination is more likely to produce A by reassortment. To this end, we considered epidemiological information of the viruses such as host, location, and time. For viruses with multiple reassortment possibilities, we thought viruses with the similar host, location, and time are more likely to reassort. Our non-phylogeny-dependent reassortment detection method was shown in Figure 2.
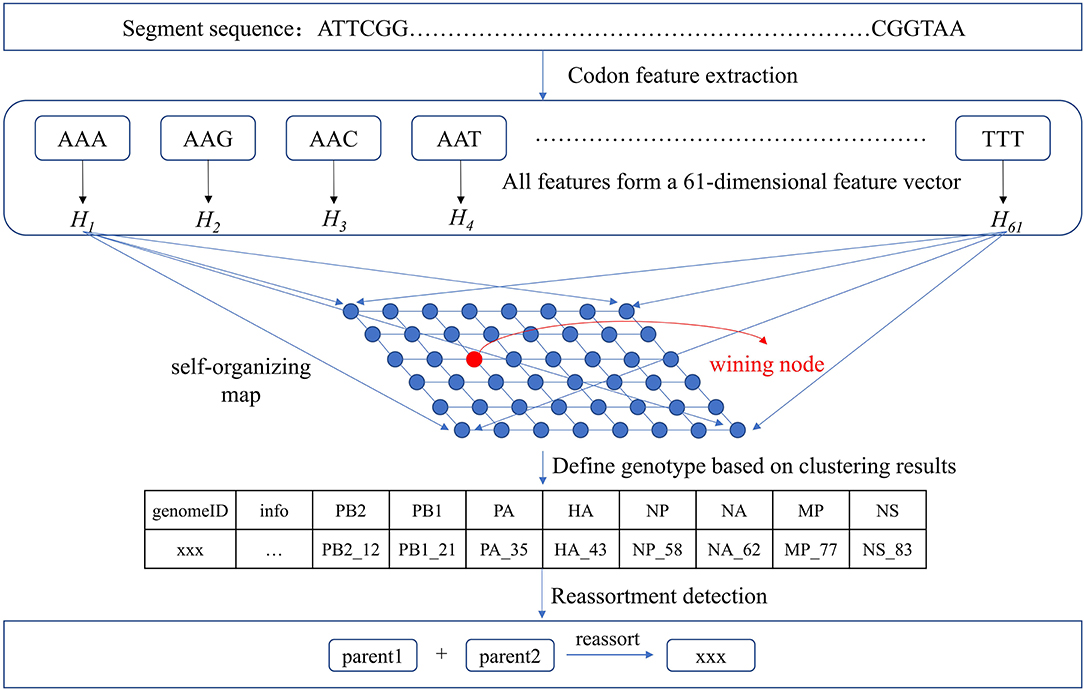
Figure 2. Reassortment detection framework. Each segment sequence was represented as a 61-dimensional feature vector and was input to SOM for clustering. The genotype was defined and reassortment detection was performed combined with the epidemiological information.
Based on the feature vectors extracted from each sequence, we represented the IAV genome as a 488-dimensional feature vector composed of eight segment feature vectors. In this way, the similarity of the IAV genome can be characterized by the similarity of feature vectors. We then constructed a similarity matrix of all IAVs and used it to construct a similarity network. The minimum spanning tree algorithm was used to simplify our network, and the cys layout in cystoscope was used for display, which was shown in Figure 2. In the virus similarity network, the subtypes of different virus genomes have been clearly distinguished (Figure 3A), which proves that the feature vector we extracted is reasonable. It should be noted that swine is a mixed vessel, which connected the genome of the avian influenza virus and the genome of the human infected influenza virus (Figure 3B). We also found that some human infected virus at the top of the figure. The genomes of these viruses were similar to those of domestic birds. Therefore, domestic birds also play an important role in the process of the avian influenza virus infecting humans.
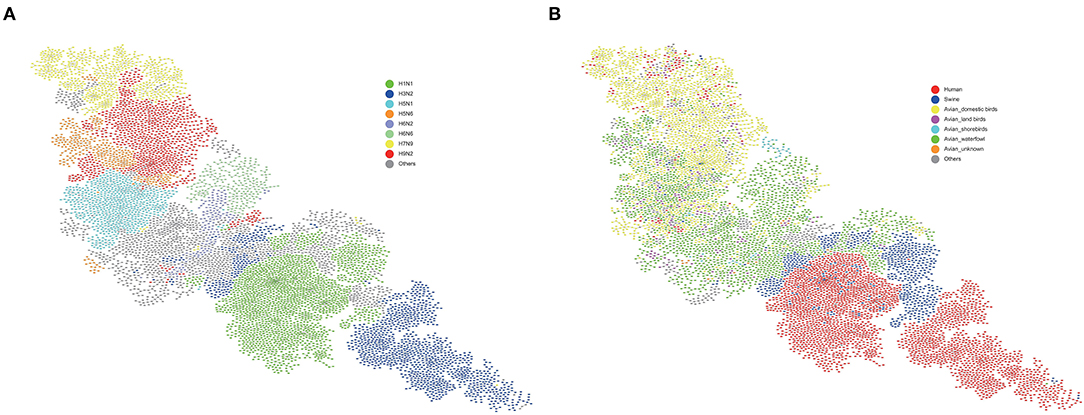
Figure 3. Virus similarity network. (A) Different subtypes are represented by different colors. Viruses with the same subtype are clustered. (B) Different hosts are represented by different colors. Swine and domestic birds play an important role in human infection with avian influenza virus. The blue nodes in the middle represent swine hosts. Above these swine nodes are almost all avian host nodes (yellow-domesitic birds, purple-land birds, light blue-shorebirds, green-waterfowl), and below these swine hosts are almost all human host nodes (red). This implied that swine plays the role of an intermediate host between these avian host and human host. At the top of (B), a small number of human host nodes can be found clustered. These nodes are close to the domestic birds node (yellow). Therefore, domestic birds also play an important role in the avian influenza viruses' cross-species and infecting humans. Avian waterfowls were considered as the natural hosts of IAVs, domestic birds and swine may have played an important role as incubation for the IAVs' transmission to humans.
Using our feature extraction and SOM-based clustering method, we divided eight segments of influenza A virus into different types, respectively, which was shown in Table 1. According to the combination of hemagglutinin (HA) and neuraminidase (NA) proteins on the surface, the influenza A virus can be divided into different subtypes. At present, HA can be divided into 18 subtypes (H1-H18), NA can be divided into 11 subtypes (N1-N11). Therefore, segments with the same subtype should be grouped when we cluster HA and NA segments. Based on this, we checked the clustering results of HA and NA segments, which were shown in Figure 4A. Each type contained only one subtype and the same subtypes were clustered together, indicating that our clustering method has no problem in distinguishing between subtypes. We also analyzed the number of types corresponding to different HA and NA subtypes, which was shown in Figure 4B. For HA subtypes, the number of types in H1, H3, H5, and H9 is relatively large, indicating that the lineages of these subtypes are complex. For NA subtypes, there are relatively more types in N1 and N2. The clustering results for all segments can be found in Supplementary Tables 1–8.

Table 1. The number of types for each segment.
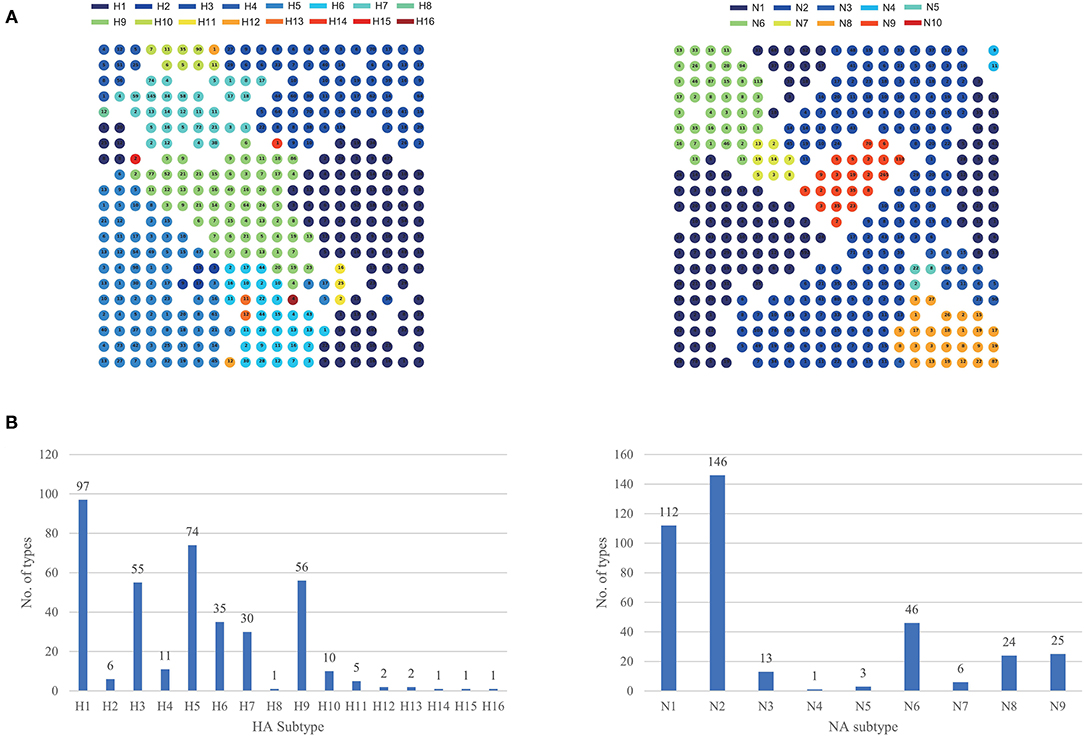
Figure 4. The clustering result for HA and NA segments. (A) The circles represent the clustering types. The number in the circle represents the number of segments contained in the type. Different subtypes are represented by different colors. If a type contains multiple subtypes, the circle will be divided into different parts with different colors. (B) The number of types corresponding to different HA and NA subtypes.
We performed reassortment detection on all the viruses in the dataset one by one in the order of their sampling time and identified 516 reassortment events. The details of each reassortment event can be found in Supplementary Table 9. According to the virus subtypes involved in reassortment, we divided reassortment events into intra-subtype reassortment and inter-subtype reassortment. Intra-subtype reassortment means that the subtype involved in reassortment is single, while inter-subtype reassortment means that the subtypes involved in reassortment are diverse. We analyzed the number of two reassortment patterns and found that the intra-subtype reassortment pattern was more common, which was shown in Figure 5A. In particular, we analyzed the situation of two reassortment patterns of eight common subtypes including H1N1, H3N2, H5N1, H5N6, H6N2, H6N6, H7N9, and H9N2, which was shown in Figure 5B. Viruses with H1N1, H3N2, H9N2 subtypes had a higher proportion of intra-subtype reassortment, while viruses with H5N1, H5N6, H6N2, H6N6, and H7N9 subtypes were more likely to be produced by reassortment of viruses with different subtypes.
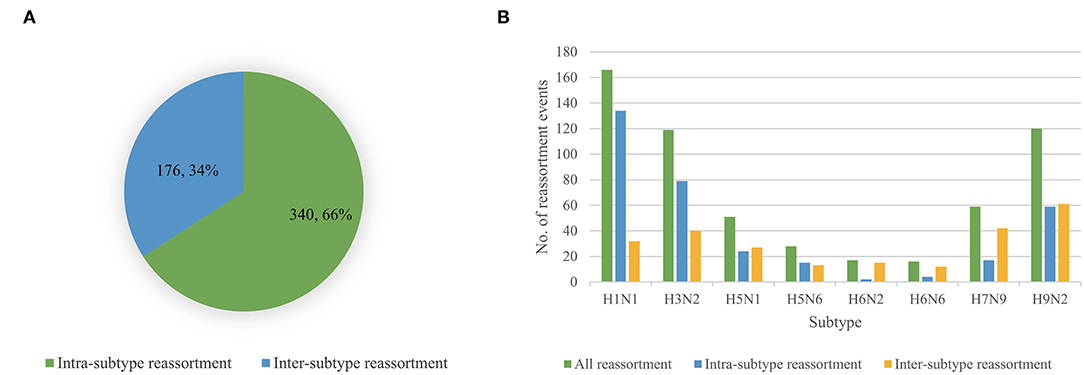
Figure 5. (A) The number of intra-subtype reassortment and inter-subtype reassortment. (B) Statistic of all reassortment events, intra-reassortment events and inter-subtype reassortment events for H1N1, H3N2, H5N1, H5N6, H6N2, H6N6, H7N9, and H9N2.
Although the intra-subtype reassortment pattern was frequent, we were more concerned about inter-subtype reassortment, since such reassortment pattern is more likely to produce pandemic strains. To this end, we made statistics on the frequency of other subtypes in the inter-subtype reassortment events of each subtype. We found that there were strong reassortment signals between H1N1 and H3N2, H6N2 and H6N6, H9N2, and other subtypes, which was shown in Figure 6. H1N1 and H3N2 are common subtypes of human influenza viruses. The viruses with these two subtypes circulate seasonally every year, leading to frequent reassortment. The 2009 H1N1 pandemic is a typical example. The virus that caused this pandemic was a triple-reassorted strain whose genome is derived from H1N1 avian virus, H1N1 classical swine virus, and H3N2 human seasonal virus. We also noticed the reassortment relationship between H6N2 and H6N6. There were few subtypes related to H6N6 reassortment and more subtypes related to H6N2 reassortment. However, the reassortment association between the two subtypes was still much more than other subtypes. In 2011, the H6N6 avian influenza virus was isolated from swine in Guangdong Province, China (17), suggesting that the H6 subtype avian influenza virus has the potential to infect mammals and even humans. Therefore, the reassortment between H6N2 and H6N6 needs to be further monitored. It should be noted that we found H9N2 played an important role in the reassortment of other subtypes since its proportion was the first or second. Based on this, we analyzed the specific reassortment relationship between H9N2 and other subtypes.
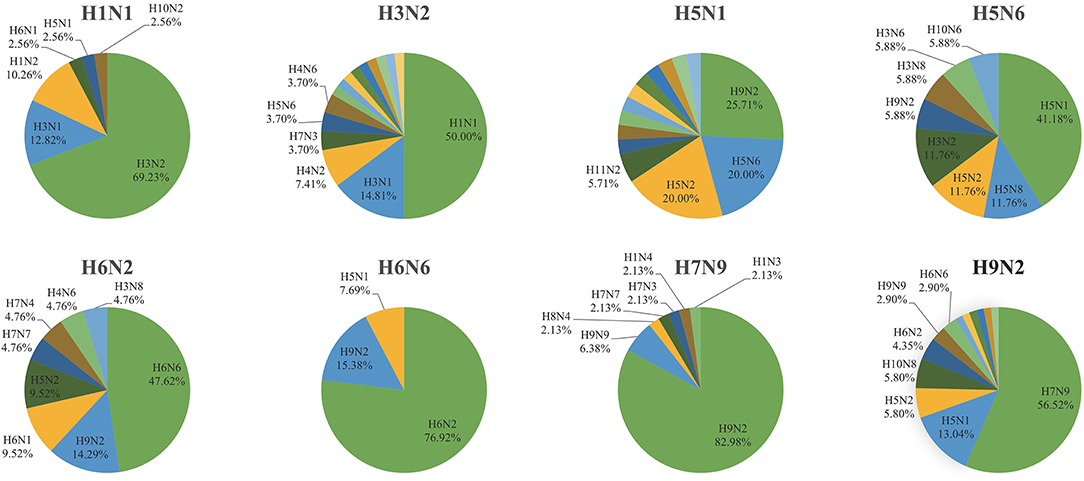
Figure 6. The occurrence frequency of other subtypes in the inter-subtype reassortment event of a specific subtype (H1N1, H3N2, H5N1, H5N6, H6N2, H6N6, H7N9, and H9N2).
H9N2 avian influenza virus spreads worldwide and is widespread in poultry in Asia (18–20). A recent study has shown that H9N2 had replaced H5N6 and H7N9 as the dominant avian influenza virus subtype in chickens and ducks in China (21). At the same time, there is also evidence that H9N2 contributed to the emergence and evolution of human infection with avian influenza viruses such as H7N9, H10N8, and H5N6 (22–24). In our study, we found that H9N2 provided internal segments for viruses with other subtypes. Among 61 inter-subtype reassortments related to H9N2, 27 events were H9N2 providing internal segments for H7N9. We also found four cases of H9N2 providing internal segments for H10N8 and four cases of H9N2 providing internal segments for H5N1. H9N2 occasionally provided internal segments for H5N2, H6N2, H6N6, H3N8, and H1N2. In addition, we found that these subtypes also provided internal segments for H9N2. These H9N2 viruses that obtained internal segments from other subtypes returned to the H9N2 gene pool and provided segments for subsequent reassortment. In general, the reassortment pattern related to H9N2 is complicated. It can provide internal segments for other subtypes, and can also obtain internal segments from other subtypes.
With the continuous improvement of sequencing technology and reduction of sequencing costs, the number of sequences in the influenza virus database is rapidly increasing. The rapid growth of data drives the continuous advancement of analytical techniques. Although manual and semi-automatic methods are generally considered to produce standard results, they also have scalability and repeatability issues (12), and cannot cope with the challenges brought by data growth. In the automated method of reassortment detection, the phylogenetic method requires multiple sequence alignment and reconstruction of the phylogenetic tree to perform subsequent reassortment detection tasks. De Silva et al. (15) tried to use GiRaF (12) to reconstruct the phylogenetic map, they found that the calculation time was at least several months per segment. Therefore, we inevitably need to adopt methods that have nothing to do with phylogeny. The method proposed by Rabadan et al. (14) seemed to perform well in detecting reassortants within the pedigree, but cannot point out the specific source of reassortment. The method of de Silva et al. (15) found some well-supported candidate reassortants, but it depends on the size of its neighborhood, and different neighborhood sizes may lead to different results. In our work, we proposed a new phylogeny-independent method for automatic detection of reassortment. It can efficiently process large-scale data sets while studying the source of all segments of the influenza A virus genome to identify reassortment.
In our reassortment detection results, although there is no evidence that every reassortment event we detected exists, as a whole, the reassortment history and patterns reflected in our results can be supported by the relevant literature. According to reports, the reassortment between strains belonging to a single subtype may occur more frequently than inter-subtype reassortment (25), which can be found in our results (Figure 5). In our analysis of the reassortment related to the H9N2 subtype, we found a reassortment pattern that H9N2 provided internal segments for other subtypes. This reassortment pattern has been confirmed by many researches (22–24). In particular, in the avian influenza H7N9 virus that broke out in 2013, all internal gene segments were closely related to the gene segments of the avian influenza H9N2 virus (26). Related research has proposed a dynamic reassortment model of H7N9 virus evolution: H7N9 virus reassorted in the H9N2 gene pool, and was classified into different H9N2 gene pools under the promotion of poultry transportation, and undergoes further reassortment (27). In our early results (Figure 3B), we also found that domestic birds played an important role in the H7N9 virus infecting humans. Subsequent analysis results also showed that H9N2 was the subtype most associated with H7N9, and it frequently provided internal segments for H7N9 by reassortment. At the same time, we found cases where H9N2 provided internal segments for H10N8. Almost all of these H10N8 viruses originated in Jiangxi, China, which coincides with the study by Wang et al. (28). The reassortment pattern that H9N2 provided internal segments for H5N1 can also be supported in the report (29). All in all, our reassortment detection method can perform reassortment detection on large-scale data sets and obtain effective conclusions.
Based on our method, researchers can study the reassortment pattern by detecting the reassortment of the viruses in the data set one by one. Researchers can also explore the source of each segment of the new virus without phylogenetic analysis. This can be achieved by comparing the feature vector of the new virus with the feature vector of the virus in the database. Although our reassortment detection method is applied to the influenza virus data set, this method also has a reference value for the reassortment of other segmented viruses. Our method will help automate the task of detecting influenza virus reassortment.
The original contributions presented in the study are included in the article/Supplementary Material, further inquiries can be directed to the corresponding author/s.
HR, WC, and JY: formulated the study. XG and MH: performed the research and analyzed the data. BW, YJ, HY, and LL: participated in analysis and discussion. XG and HR: drafted the manuscript. All authors contributed to the article and approved the submitted version.
This work was supported by the National Natural Science Foundation of China (grant numbers 32070025, 31800136, and 82041019) and the Research Project from State Key Laboratory of Pathogen and Biosecurity (grant number SKLPBS1807).
The authors declare that the research was conducted in the absence of any commercial or financial relationships that could be construed as a potential conflict of interest.
All claims expressed in this article are solely those of the authors and do not necessarily represent those of their affiliated organizations, or those of the publisher, the editors and the reviewers. Any product that may be evaluated in this article, or claim that may be made by its manufacturer, is not guaranteed or endorsed by the publisher.
The Supplementary Material for this article can be found online at: https://www.frontiersin.org/articles/10.3389/fviro.2021.751196/full#supplementary-material
Supplementary Table 1. The clustering results for PB2 segments.
Supplementary Table 2. The clustering results for PB1 segments.
Supplementary Table 3. The clustering results for PA segments.
Supplementary Table 4. The clustering results for HA segments.
Supplementary Table 5. The clustering results for NP segments.
Supplementary Table 6. The clustering results for NA segments.
Supplementary Table 7. The clustering results for MP segments.
Supplementary Table 8. The clustering results for NS segments.
Supplementary Table 9. The details of each reassortment event.
Supplementary File. AsiaGenome.zip (Genome data used in this paper).
1. Taubenberger JK, Kash JC. Influenza virus evolution, host adaptation, pandemic formation. Cell Host Microbe. (2010) 7:440–51. doi: 10.1016/j.chom.2010.05.009
2. Marshall N, Priyamvada L, Ende Z, Steel J, Lowen AC. Influenza virus reassortment occurs with high frequency in the absence of segment mismatch. PLoS Pathog. (2013) 9:e1003421. doi: 10.1371/journal.ppat.1003421
3. Vijaykrishna D, Mukerji R, Smith GJ. RNA virus reassortment: an evolutionary mechanism for host jumps and immune evasion. PLoS Pathog. (2015) 11:e1004902. doi: 10.1371/journal.ppat.1004902
4. Gao R, Cao B, Hu Y, Feng Z, Wang D, Hu W, et al. Human infection with a novel avian-origin influenza A (H7N9) virus. N Engl J Med. (2013) 368:1888–97. doi: 10.1056/NEJMoa1304459
5. Kageyama T, Fujisaki S, Takashita E, Xu H, Yamada S, Uchida Y, et al. Genetic analysis of novel avian A(H7N9) influenza viruses isolated from patients in China, February to April 2013. Euro Surveill. (2013) 18:20453. doi: 10.2807/ese.18.15.20453-en
6. Lam TT, Wang J, Shen Y, Zhou B, Duan L, Cheung CL, et al. The genesis and source of the H7N9 influenza viruses causing human infections in China. Nature. (2013) 502:241–4. doi: 10.1038/nature12515
7. Lindstrom SE, Hiromoto Y, Nerome R, Omoe K, Sugita S, Yamazaki Y, et al. Phylogenetic analysis of the entire genome of influenza A (H3N2) viruses from Japan: evidence for genetic reassortment of the six internal genes. J Virol. (1998) 72:8021–31. doi: 10.1128/JVI.72.10.8021-8031.1998
8. Nelson MI, Viboud C, Simonsen L, Bennett RT, Griesemer SB, St George K, et al. Multiple reassortment events in the evolutionary history of H1N1 influenza A virus since 1918. PLoS Pathog. (2008) 4:e1000012. doi: 10.1371/journal.ppat.1000012
9. Holmes EC, Ghedin E, Miller N, Taylor J, Bao Y, St George K, et al. Whole-genome analysis of human influenza A virus reveals multiple persistent lineages and reassortment among recent H3N2 viruses. PLoS Biol. (2005) 3:e300. doi: 10.1371/journal.pbio.0030300
10. Westgeest KB, Russell CA, Lin X, Spronken MI, Bestebroer TM, Bahl J, et al. Genomewide analysis of reassortment and evolution of human influenza A(H3N2) viruses circulating between 1968 and 2011. J Virol. (2014) 88:2844–57. doi: 10.1128/JVI.02163-13
11. Yurovsky Moret ABM. FluReF, an automated flu virus reassortment finder based on phylogenetic trees. BMC Genomics. (2011) 12(Suppl. 2):S3. doi: 10.1186/1471-2164-12-S2-S3
12. Nagarajan N, Kingsford C. GiRaF: robust, computational identification of influenza reassortments via graph mining. Nucleic Acids Res. (2011) 39:e34. doi: 10.1093/nar/gkq1232
13. Nagarajan N, Kingsford C. Uncovering genomic reassortments among influenza strains by enumerating maximal bicliques. In: 2008 IEEE International Conference on Bioinformatics and Biomedicine. Los Alamitos, CA (2008). p. 223–30.
14. Rabadan R, Levine AJ, Krasnitz. Non-random reassortment in human influenza A viruses. Influenza Other Respir Viruses. (2008) 2:9–22. doi: 10.1111/j.1750-2659.2007.00030.x
15. de Silva UC, Tanaka H, Nakamura S, Goto N, Yasunaga T. A comprehensive analysis of reassortment in influenza A virus. Biol Open. (2012) 1:385–90. doi: 10.1242/bio.2012281
16. Wei D, Jiang Q, Wei Y, Wang S. A novel hierarchical clustering algorithm for gene sequences. BMC Bioinformatics. (2012) 13:174. doi: 10.1186/1471-2105-13-174
17. Zhang G, Kong W, Qi W, Long LP, Cao Z, Huang L, et al. Identification of an H6N6 swine influenza virus in southern China. Infect Genet Evol. (2011) 11:1174–7. doi: 10.1016/j.meegid.2011.02.023
18. Panshin A, Golender N, Davidson I, Nagar S, Garsia M, Jackwood MW, et al. Variability of NS1 proteins among H9N2 avian influenza viruses isolated in Israel during 2000-2009. Virus Genes. (2010) 41:396–405. doi: 10.1007/s11262-010-0522-3
19. Sun Y, Pu J, Jiang Z, Guan T, Xia Y, Xu Q, et al. Genotypic evolution and antigenic drift of H9N2 influenza viruses in China from 1994 to 2008. Vet Microbiol. (2010) 146:215–25. doi: 10.1016/j.vetmic.2010.05.010
20. Xu KM, Smith GJ, Bahl J, Duan L, Tai H, Vijaykrishna D, et al. The genesis and evolution of H9N2 influenza viruses in poultry from southern China, 2000 to 2005. J Virol. (2007) 81:10389–401. doi: 10.1128/JVI.00979-07
21. Bi Y, Li J, Li S, Fu G, Jin T, Zhang C, et al. Dominant subtype switch in avian influenza viruses during 2016-2019 in China. Nat Commun. (2020) 11:5909. doi: 10.1038/s41467-020-19671-3
22. Liu D, Shi W, Gao GF. Poultry carrying H9N2 act as incubators for novel human avian influenza viruses. Lancet. (2014) 383:869. doi: 10.1016/S0140-6736(14)60386-X
23. Pu J, Wang S, Yin Y, Zhang G, Carter RA, Wang J, et al. Evolution of the H9N2 influenza genotype that facilitated the genesis of the novel H7N9 virus. Proc Natl Acad Sci USA. (2015) 112:548–53. doi: 10.1073/pnas.1422456112
24. Su S, Bi Y, Wong G, Gray GC, Gao GF, Li S. Epidemiology, evolution, and recent outbreaks of avian influenza virus in China. J Virol. (2015) 89:8671–6. doi: 10.1128/JVI.01034-15
25. Nelson MI, Holmes EC. The evolution of epidemic influenza. Nat Rev Genet. (2007) 8:196–205. doi: 10.1038/nrg2053
26. Liu D, Shi W, Shi Y, Wang D, Xiao H, Li W, et al. Origin and diversity of novel avian influenza A H7N9 viruses causing human infection: phylogenetic, structural, coalescent analyses. Lancet. (2013) 381:1926–32. doi: 10.1016/S0140-6736(13)60938-1
27. Cui L, Liu D, Shi W, Pan J, Qi X, Li X, et al. Dynamic reassortments and genetic heterogeneity of the human-infecting influenza A (H7N9) virus. Nat Commun. (2014) 5:3142. doi: 10.1038/ncomms4142
28. Liu M, Li X, Yuan H, Zhou J, Wu J, Bo H, et al. Genetic diversity of avian influenza A (H10N8) virus in live poultry markets and its association with human infections in China. Sci Rep. (2015) 5:7632. doi: 10.1038/srep07632
Keywords: influenza A virus, reassortment, detection, method, evolution
Citation: Gong X, Hu M, Wang B, Yang H, Jin Y, Liang L, Yue J, Chen W and Ren H (2021) A Non-phylogeny-dependent Reassortment Detection Method for Influenza A Viruses. Front. Virol. 1:751196. doi: 10.3389/fviro.2021.751196
Received: 09 October 2021; Accepted: 09 November 2021;
Published: 07 December 2021.
Edited by:
Diego Forni, Eugenio Medea (IRCCS), ItalyReviewed by:
Irina V. Kiseleva, Institute of Experimental Medicine (RAS), RussiaCopyright © 2021 Gong, Hu, Wang, Yang, Jin, Liang, Yue, Chen and Ren. This is an open-access article distributed under the terms of the Creative Commons Attribution License (CC BY). The use, distribution or reproduction in other forums is permitted, provided the original author(s) and the copyright owner(s) are credited and that the original publication in this journal is cited, in accordance with accepted academic practice. No use, distribution or reproduction is permitted which does not comply with these terms.
*Correspondence: Hongguang Ren, YmlvcmVuQDE2My5jb20=; Wei Chen, Y2hlbndlaUBudWR0LmVkdS5jbg==; Junjie Yue, eXVlX2p1bmppZUAxMjYuY29t
†These authors have contributed equally to this work
Disclaimer: All claims expressed in this article are solely those of the authors and do not necessarily represent those of their affiliated organizations, or those of the publisher, the editors and the reviewers. Any product that may be evaluated in this article or claim that may be made by its manufacturer is not guaranteed or endorsed by the publisher.
Research integrity at Frontiers
Learn more about the work of our research integrity team to safeguard the quality of each article we publish.