 Sara Cristinelli
 Paolo Angelino
 Andrew Janowczyk2
 Mauro Delorenzi
 Angela Ciuffi
- 1Institute of Microbiology, Lausanne University Hospital and University of Lausanne, Lausanne, Switzerland
- 2Bioinformatics Core Facility, SIB Swiss Institute of Bioinformatics, Lausanne, Switzerland
- 3Translational Bioinformatics and Statistics, Department of Oncology, University of Lausanne, Lausanne, Switzerland
The study of RNA modifications, today known as epitranscriptomics, is of growing interest. The N6-methyladenosine (m6A) and 5-methylcytosine (m5C) RNA modifications are abundantly present on mRNA molecules, and impact RNA interactions with other proteins or molecules, thereby affecting cellular processes, such as RNA splicing, export, stability, and translation. Recently m6A and m5C marks were found to be present on human immunodeficiency (HIV) transcripts as well and affect viral replication. Therefore, the discovery of RNA methylation provides a new layer of regulation of HIV expression and replication, and thus offers novel array of opportunities to inhibit replication. However, no study has been performed to date to investigate the impact of HIV replication on the transcript methylation level in the infected cell. We used a productive HIV infection model, consisting of the CD4+ SupT1 T cell line infected with a VSV-G pseudotyped HIVeGFP-based vector, to explore the temporal landscape of m6A and m5C epitranscriptomic marks upon HIV infection, and to compare it to mock-treated cells. Cells were collected at 12, 24, and 36 h post-infection for mRNA extraction and FACS analysis. M6A RNA modifications were investigated by methylated RNA immunoprecipitation followed by high-throughput sequencing (MeRIP-Seq). M5C RNA modifications were investigated using a bisulfite conversion approach followed by high-throughput sequencing (BS-Seq). Our data suggest that HIV infection impacted the methylation landscape of HIV-infected cells, inducing mostly increased methylation of cellular transcripts upon infection. Indeed, differential methylation (DM) analysis identified 59 m6A hypermethylated and only 2 hypomethylated transcripts and 14 m5C hypermethylated transcripts and 7 hypomethylated ones. All data and analyses are also freely accessible on an interactive web resource (http://sib-pc17.unil.ch/HIVmain.html). Furthermore, both m6A and m5C methylations were detected on viral transcripts and viral particle RNA genomes, as previously described, but additional patterns were identified. This work used differential epitranscriptomic analysis to identify novel players involved in HIV life cycle, thereby providing innovative opportunities for HIV regulation.
Introduction
The presence of chemical modifications along RNA molecules has been known since the 1970s (1). Only recently, however, have new technologies allowed the identification and investigation of chemical modifications at the transcriptome-wide level, allowing mapping of some modifications in mRNA (2, 3). Similar to epigenetics that focuses on the understanding of DNA and histone modifications in the regulation of transcription, epitranscriptomics investigates RNA modifications and offers a new layer of regulation, impacting, and tuning cellular processes, including RNA splicing, export, stability, and translation (4). Among these modifications N6-methyladenosine (m6A) and 5-methylcytosine (m5C) are found to be particularly abundant along mRNA molecules (5).
Regulation of RNA modifications is under the control of specific cellular proteins (6, 7). The methylases METTL3-14 together with adaptors proteins act as m6A writer complexes of mRNA and catalyze the methylation of adenosine residues within the consensus motif DRA*CH (D = G/A/U, R = G/A, H = U/A/C, and A*= modified A). RNA binding proteins act as m6A readers; they bind methylated residues, thereby modulating the fate and metabolism of marked mRNA, i.e., secondary structure, nuclear export, stability, splicing, and degradation. Demethylases such as ALKBH5 act as erasers of m6A, removing the chemical modification from transcripts.
The role and identity of proteins involved in m5C turnover is less clear. The addition of m5C residues on mRNA molecules is carried out by the methylase NSUN2. M5C binding proteins seem to play a role in export and degradation, while to date no m5C-specific demethylase has been described yet.
The role of RNA modifications is not limited to cellular RNA molecules. Indeed, recent studies highlighted the importance of RNA methylation on viral transcripts as well, including human immunodeficiency virus type 1 (HIV-1, hereafter abbreviated HIV) RNA, and its impact in regulating viral replication and gene expression.
Lichinchi et al. reported 14 peaks of m6A modification in HIV RNA, including a m6A peak in the Rev response-element (RRE) region (8). They showed that RRE methylation increased Rev binding and facilitated nuclear export of viral RNA, thereby enhancing HIV replication. Kennedy et al. found four clusters of m6A modifications in the 3' Untranslated region (UTR) of HIV RNA and suggested that the overexpression of the m6A readers YTDHF1-3 likely stabilize viral mRNAs, thereby increasing viral replication (9). In contrast, Tirumuru et al. and Lu et al. showed that HIV RNA has m6A modifications in both 5′ and 3′ UTRs, as well as in gag and rev genes, and that overexpression of YTDHF1-3 proteins in cells inhibits HIV infection by decreasing viral genomic RNA (gRNA) and early reverse transcription products (10, 11).
A recent study from Courtney et al. investigated the role of m5C in HIV replication (12). Using an antibody-based capture approach, they identified m5C-methylated residues in HIV gRNA from CEM T cell-derived virions and on cellular HIV transcripts. They identified the m5C mRNA writer NSUN2 as the writer responsible for HIV RNA m5C methylation and demonstrated a role of m5C in favoring alternative splicing and increasing HIV mRNA translation.
Furthermore, it has been reported that upon HIV infection, the global cellular rate of m6A and m5C methylation increased (12, 13). However, an in-depth exploration of the differentially methylated genes upon HIV infection is missing.
The discovery of HIV RNA methylation provides a new layer of regulation of HIV expression and replication, and thus a novel array of opportunities to inhibit replication. Investigating the epitranscriptomic landscape of HIV-infected cells will lead to a deeper understanding of HIV-induced RNA modifications and may help to identify novel host cells factors, HIV dependency factors (HDF), or restriction factors (HRF) involved in HIV replication. Indeed, HIV may modulate HDF and HRF to impact viral replication efficiency not only at the level of transcription but also at the level of methylation.
Here we used the SupT1 CD4+ T cellular model infected with a VSV.G pseudotyped HIV-based vector encoding a GFP reporter (HIVeGFP) to explore the m6A and m5C modification pattern of cellular and viral transcripts in HIV-infected cells, as well as the virion genomic RNA, over time. We found that HIV infection impacted the methylation landscape of HIV-infected cells by inducing an increased proportion of methylated cellular transcripts. Differential methylation (DM) analysis allowed identifying a few genes that may act as HDF or HRF and thus impact viral replication success. Furthermore, both m6A and m5C methylation was detected on viral transcripts and on viral particle packaged RNA genome, as previously described, but additional patterns were also detected. All data, at transcriptome, m6A, and m5C epitranscriptome levels, are freely accessible in an interactive mode through HI-TEAM (HIV-Infected cell Transcriptome and EpitrAnscriptoMe), a user-friendly querying platform using an iSee-derived interface (14) available at http://sib-pc17.unil.ch/HIVmain.html.
Results
Dynamic Analysis of HIV-Infected Cells
To explore the transcriptomic and epitranscriptomic landscape of HIV-infected cells, we infected SupT1 cells (a CD4+ T-cell-line) with an HIV_GFP-based vector. At 12, 24, and 36 h post-infection, we (i) assessed the percentage of infected cells, monitoring GFP expression by FACS analysis; (ii) measured the amount of viral particles released in the supernatant; and (iii) extracted the total RNA, purified polyA RNA and explored the m6A and m5C landscapes, by either methylated RNA immunoprecipitation sequencing (MeRIP-Seq) or Bisulfite sequencing (BS-Seq), respectively (Figures 1A,B).
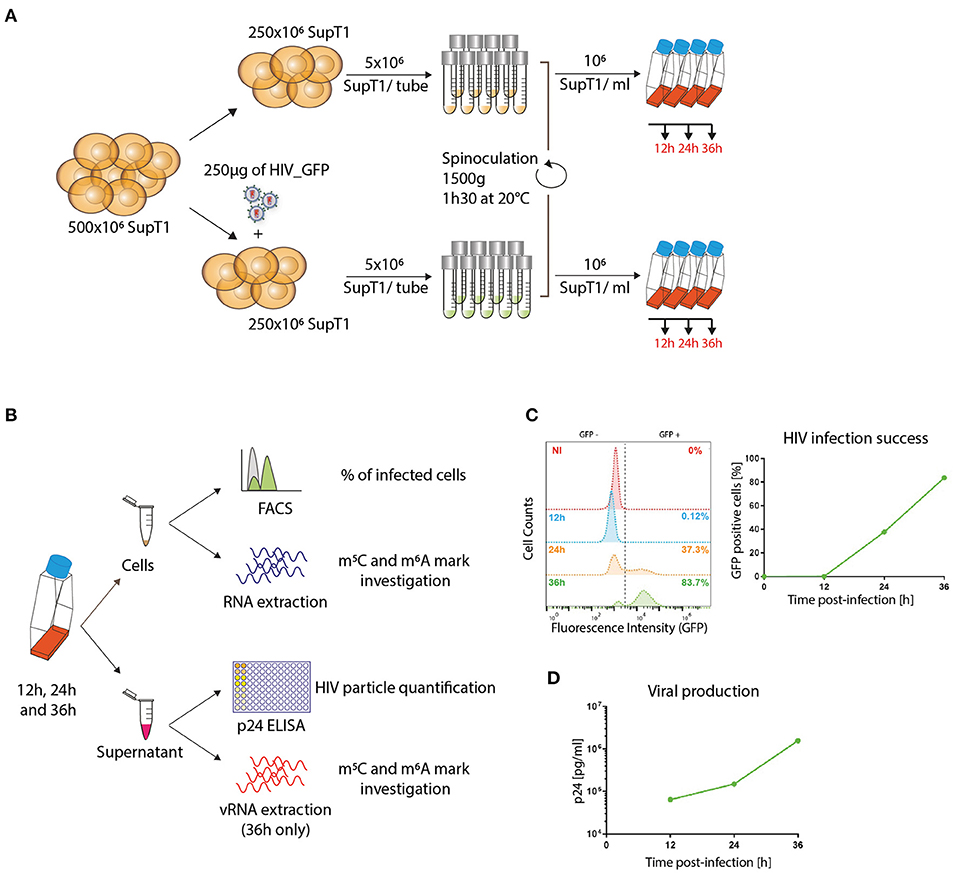
Figure 1. Dynamic analysis of HIV-infected cells. (A) Infection setting overview. SupT1 cells were either infected with 1 μg/106 cells p24 equivalent of HIV_GFP virus or left uninfected, divided into aliquots of 5*106 cells/ tube and spinoculated for 90 min at 1,500 g and 20°C to allow nearly universal infection. Cells were then resuspended at a concentration of 106 cells/ml and further incubated. (B) Experimental design overview. At 12, 24, and 36 h post–infection, viral supernatant was collected to assess viral production by p24 ELISA; 300,000 cells were fixed and HIV infection success was assessed by evaluating HIV-encoded GFP expression by FACS analysis; the rest of the cells were used for RNA extraction and further analyses on m6A and m5C epitranscriptomic marks. (C) Example of FACS analysis at 12, 24, and 36 h post-infection to evaluate HIV infection success. Left: Histogram plots of FACS analyses showing the GFP intensity (x-axis) on the different samples, non-infected (NI) and infected (12 h, 24 h, 36 h) samples. Right: Graphical representation of the proportion of infected cells (%GFP-positive cells). (D) Example of p24 ELISA to monitor viral particle production. Results are expressed as pg of p24 per ml of supernatant over time.
Infection success was monitored over time, following the accumulation of the virally encoded GFP protein. At 12 h post-infection (p.i.), as expected, the GFP expression was not yet detectable, while at 24 h p.i. 37.3% of the cells were expressing detectable levels of GFP and 83.7% of the cells were GFP+ at 36h p.i., close to universal infection (Figure 1C). These results were consistent with viral particle production assessed by p24 measurement, which showed increasing viral production over time, with 0.064 × 10⁶ pg/ml at 12 h p.i., 0.150 × 10⁶ pg/ml at 24 h p.i. and 1.572 × 10⁶ pg/ml at 36 h p.i. (Figure 1D).
HIV Infection Induced Changes at Gene Expression Level
Transcriptome analysis was performed by RNA-Seq on polyA-selected RNAs over time on infected (HIV) and non-infected mock (NI) SupT1 cells. A total of 17,676 genes out of 58,136 were detected across all time points (12 h NI: 11,908; 12 h HIV: 10,980; 24 h NI: 13,516; 24 h HIV: 12,327; 36 h NI: 15,004; 36 h HIV: 11,827). In order to increase the specificity of our study, we applied a supplemental filter to retain genes above 3 counts per million (CPM). This filter was applied to each condition (infected or non-infected) individually in order to avoid the introduction of bias upon differential gene expression analyses. Upon quality control and filtering, a total of 13,103 genes was retained for further analysis (Supplementary Table 1).
Principal component (PC) analyses separated samples in 2 distinct clusters according to infection condition and time progression, with the PC1 and PC2 representing respectively 67 and 21% of the variance (Supplementary Figure 1A). Such clustering was not due to the presence of HIV transcripts, as upon their removal, sample distribution was maintained (Supplementary Figure 1B). Among the 13,103 detected genes, 1,654 (13%) were overexpressed over time while 2,142 (16%) were downregulated. Analysis over time of NI samples only revealed that some genes were differentially expressed, likely due to cell culture conditions and cell growth, but independently from HIV infection (Supplementary Table 1). In order to refine the analysis and to observe the bona fide impact of HIV infection, the time effect was modeled in a linear model and subtracted to the HIV effect, resulting in improved defined variance (Supplementary Figure 1C). Thus, upon removal of the time effect, HIV infection alone modulated a total of 1,971 genes, upregulating 813 genes (6.2%) and downregulating 1,158 genes (8.8%) (Supplementary Table 1 and Figure 2). Gene ontology analysis shows that the 1,971 differentially expressed genes were enriched in the negative regulation of biological and cellular pathways (data not shown). These data are consistent with our previous study, performed using similar experimental conditions, revealing >75% concordance, and arguing for some degree of reproducibility and confidence (data not shown) (15).
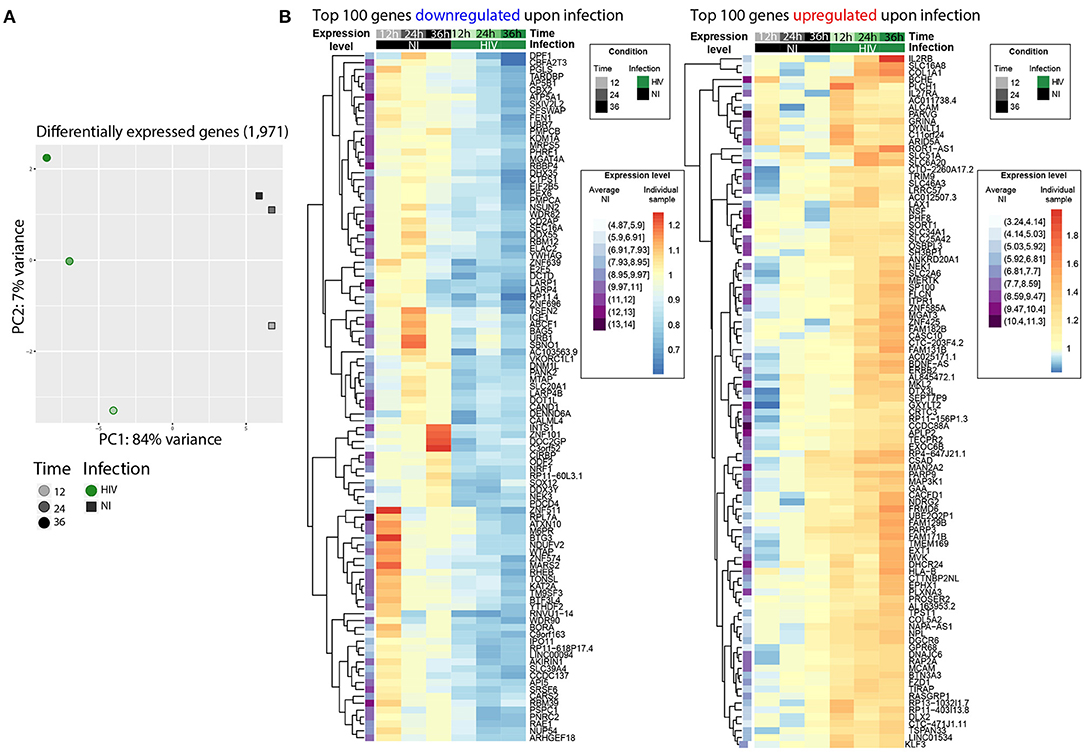
Figure 2. HIV infection induced changes at gene expression level. (A) PCA representing 1,971 differentially expressed genes upon HIV infection only. HIV-infected samples (HIV) are represented as green filled circles, non-infected samples (NI) as gray filled squares. Timepoints are depicted by the shade of the color. Time effect has been removed, HIV transcripts are not included. (B) Heatmaps of the top 100 (out of 813) downregulated (left) or top 100 (out of 1,158) upregulated (right) genes upon HIV infection. The first column (purple) represents the average gene expression of each gene in the 3 normalized NI samples together, i.e., the darker the color, the higher the expression in the time-averaged NI samples. The log fold change of each gene compared to the average NI gene expression is depicted in shades of blue to red.
Overall, these data confirmed that HIV induced numerous changes at transcriptome level upon infection that need to be taken into account for an accurate exploration of the epitranscriptomic landscape. Indeed, methylated genes that are strongly impacted by HIV in term of gene expression may introduce a bias to the analysis, i.e., methylated genes overexpressed upon infection may be considered also as differentially methylated if no correction is applied.
Hence, in order to explore the m6A and m5C epitranscriptomic landscape of HIV-infected cells independently from their expression level upon infection, all data were normalized to the corresponding gene expression.
HIV Infection Induced Changes in Cellular m6A Profile
We examined the landscape of the m6A RNA methylome during HIV infection at 12, 24, and 36 h post-infection by MeRIP-Seq using either an m6A specific antibody or a non-specific IgG antibody as control (16). After pull down and elution, quality and quantity of samples were verified on a fragment analyzer (Supplementary Figure 2A). The immunoprecipitated RNA was used for library preparation and sequencing; of note, the amount of RNA retrieved from the control condition was too low to perform library preparation and sequencing, as expected, suggesting that antibody-mediated capture and enrichment is highly specific.
We obtained a range of 26–72 million reads per condition (Supplementary Figure 2). After quality control and filtering, 8 to 46 million clean reads were kept and further mapped to the HIV and hg38 human genomes, with alignment success typically exceeding 99%.
M6A modified regions were identified using the peak calling package MACS2. A total of 17,657 peaks mapping on 7,724 genes across all samples were retrieved representing 59% of the overall detected genes (13,101) (Figure 3A and Supplementary Table 2). We looked for the presence of the m6A consensus motif DRACH previously identified and detected it in 17,527 peaks out of 17,657 (99.3% of the peaks) (Figure 3B) (5). We further analyzed the 17,527 m6A peaks to identify, independently, additional consensus sequences for m6A methylation. For this, 20 nucleotides surrounding the center of each m6A peak were examined for motif retrieval, and revealed 2 additional highly enriched motifs, WGGAM and GSAGGAGG (Supplementary Figure 3A); these motifs have been previously described as m6A binding motif from Zhang et al. (17). As described previously, m6A peaks were globally enriched toward the 3' end of transcripts, and this distribution is not altered upon HIV infection (Figure 3C and Supplementary Figure 3B) (6). M6A modifications were reported to be enriched in long exons (>140 nt); however, upon normalization for exon width, we could not observe significant changes in m6A distribution with only a slight enrichment in m6A peak frequency in exons >500 nt (Supplementary Figure 3C) (6). Upon PC analysis of the m6A peaks retrieved in all samples, we could observe a separation according to time and infection condition, suggesting an impact of HIV infection on the m6A methylation profile (Figure 3C).
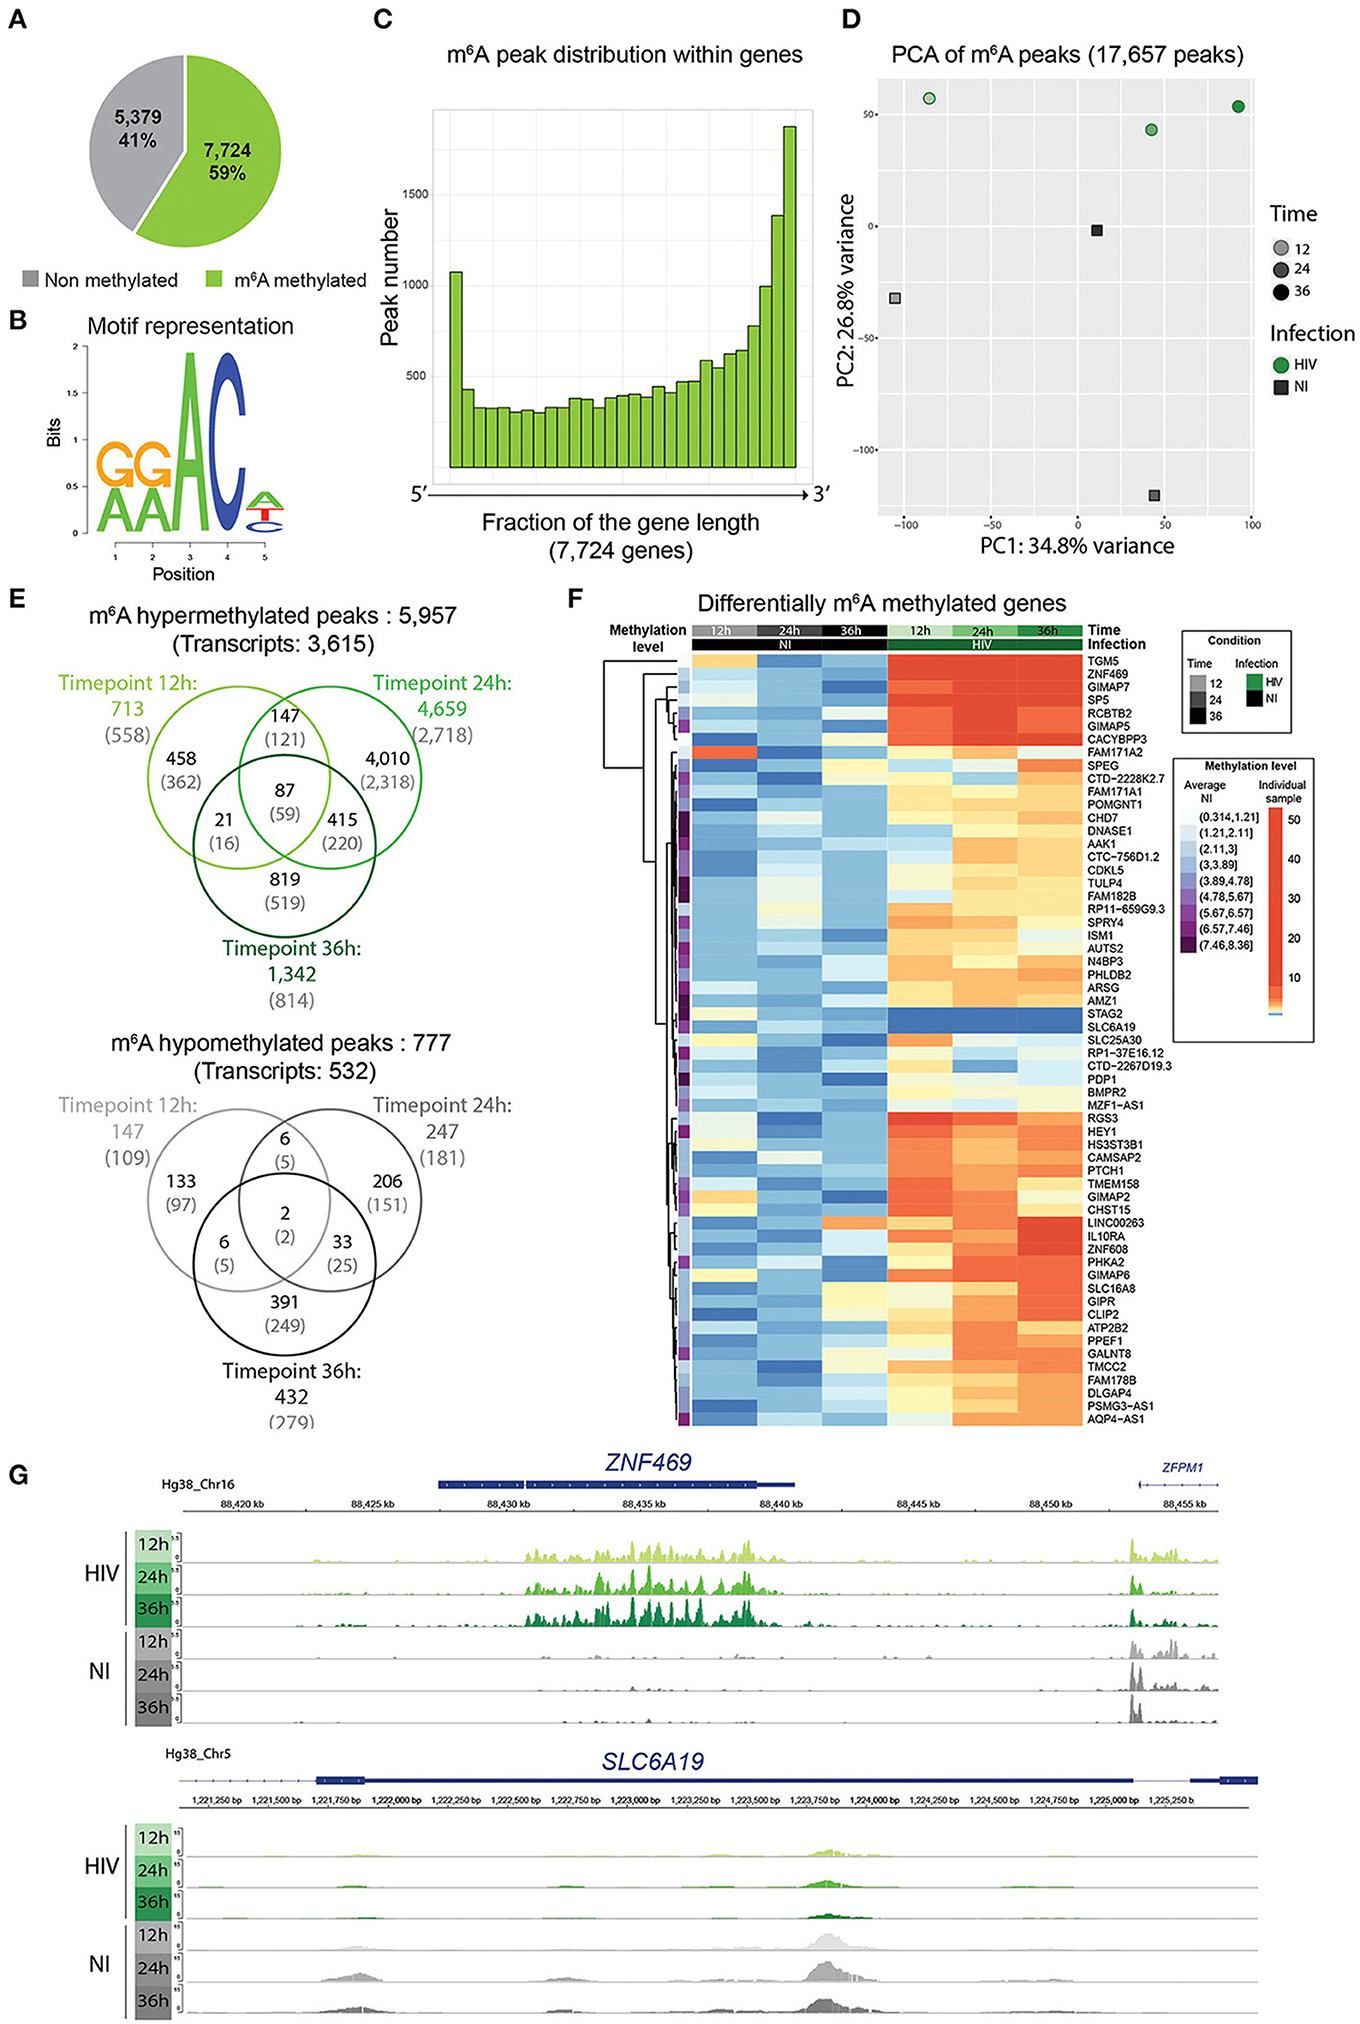
Figure 3. HIV infection induced changes in cellular m6A profile. (A) Pie chart representing the proportion of m6A methylated transcripts among the totality of detected transcripts (13,103). (B) Representation of the enriched m6A DRACH motif among the samples. (C) Histogram plots showing on the x-axis genes normalized for their length and divided into 30 bins, and for each bin fraction of the gene, the number of m6A residues. (D) PCA of the variance of m6A peaks among all samples. HIV-infected samples are represented as green filled circles, non-infected samples as gray filled squares. Timepoints are depicted by the shade of the color. HIV transcripts are not included. (E) Venn diagrams showing hypermethylated (upper panel) or hypomethylated (lower panel) m6A peaks upon infection. Values in black represent the number of m6A methylated peaks, values in gray into brackets represent the number of corresponding transcripts. (F) Heatmap of the commonly hyper/hypo methylated transcripts upon infection at the three timepoints. The 61 differentially methylated genes are shown. The average methylation level of the non-infected cells is represented in violet in the first column and was used for normalization. Differential methylation was then normalized to the average methylation intensity of each transcript. (G) Examples of an hypermethylated (upper panel) and an hypomethylated (lower panel) transcript showing m6A peak intensity and distribution across samples using IGV viewer.
As m6A methylation can occur at different sites along the mRNA molecule, analysis was performed on differentially methylated peaks. A total of 5,957 peaks corresponding to 3,615 transcripts were found as being hypermethylated upon HIV infection, with 713 peaks at 12 h, 4,696 at 24 h, and 1,342 at 36 h post infection (corresponding to 558, 2,718, and 814 transcripts at 12, 24, and 36 h, respectively). Only 777 hypomethylated peaks (532 transcripts) were identified, with 147, 247, and 432 peaks at 12, 24, 36 h post infection, corresponding respectively to 109 transcripts at 12 h, 181 at 24 h, and 279 at 36 h post infection (Supplementary Table 3 and Figures 3D,G).
We identified 87 m6A peaks, representing 59 different transcripts that were commonly hypermethylated in infected cells at 12, 24, and 36 h post-infection. However, only 2 peaks, identified as the stromal antigen 1 (STAG1) and the solute carrier family 6 member 19 (SLC6A19) respectively, were found to be commonly hypomethylated upon infection at the 3 timepoints (Supplementary Table 2 and Figures 3E,F). Gene ontology analysis of the 61 commonly differentially methylated mRNAs did not reveal any statistically significant enrichment in biological process (data not shown). However, we noticed the presence of 4 out of the 7 GTPase Immuno-Associated Proteins (GIMAP) within the commonly differentially methylated transcripts and overall 6 GIMAPs among the totality of the differentially methylated transcripts (GIMAP1, GIMAP2, GIMAP4, GIMAP5, GIMAP6, GIMAP7). GIMAPs are involved in response to pathogens and have a prominent role in T cell survival and differentiation, consistent with a putative role of these genes on HIV replication (18).
HIV Infection Induced Changes in Cellular m5C Profile
To obtain a transcriptome-wide landscape of m5C profiles, we performed BS-Seq on RNA samples purified from HIV-GFP infected and non-infected SupT1 cells (19). Compared to antibody-based techniques, bisulfite conversion allows higher resolution and higher sensitivity, identifying converted and non-converted cytosines at single nucleotide resolution, and providing estimations of the methylation rate of each C residue. However, bisulfite conversion does not allow further discriminating between methylcytosine (m5C) and hydroxymethylcytosine (hm5C), therefore note that in this manuscript m5C refers to both modifications. To assess efficiency of bisulfite conversion treatment, we used the human 28S rRNA as positive control. Indeed, the C4447 residue of this rRNA is known to be methylated with a frequency of 100%.
Therefore, we spiked-in polyA-depleted RNA in each sample to ensure rRNA representation and presence of 28S rRNA in particular. After bisulfite conversion, a sample aliquot was used for RT-PCR and Sanger sequencing of the C4447 encompassing region of the 28S rRNA (Supplementary Figure 4A). For all samples we observed a complete C-T conversion along the fragment suggesting the absence of methylation on these C residues, except for the C4447 residue that remains unchanged, confirming the methylation status of this specific C residue (Supplementary Figure 4B).
After library preparation and high-throughput sequencing we obtained a range of 23–43 million reads/sample (Supplementary Figure 4C) with a low representation of C and an over-representation of T, consistent with successful unmethylated C-to-T bisulfite conversion (Supplementary Figure 4D). Reads were processed with the meRan-TK package, specific for RNA bisulfite conversion, taking into account the converted reads to allow genome alignment and mapping (20).
To further assess the conversion rate in each sample, we also included a commercially available pool of non-methylated RNA sequences (ERCC spike-in control) in each sample. ERCC sequence analysis showed an average conversion rate of 99.47%, suggesting that bisulfite treatment was efficient (Supplementary Figure 4E). Due to the lower quality of bisulfite converted reads with respect to non-converted ones, only transcripts covered with more than 30 reads were retained for further analysis. We could observe different methylation rates among transcripts; hence, to improve the quality of the differential methylation analysis, only cytosines displaying a methylation rate > 20% were used (Supplementary Table 4). Overall, we identified 2,267 C residues, corresponding to 947 transcripts, present across all the non-infected timepoints with a methylation rate higher than 20% (7% of overall detected transcripts), 567 m5C with a methylation rate higher than 50% and 79 with methylation rate >80% (Figure 4A). To date, no consensus was described for m5C methylation. We thus analyzed 10 nucleotides surrounding m5C residues displaying a methylation rate greater than 80% and we identified a putative consensus sequence in 500 out of 788 highly methylated m5C, representing 63.4% of total hits (Figure 4B).
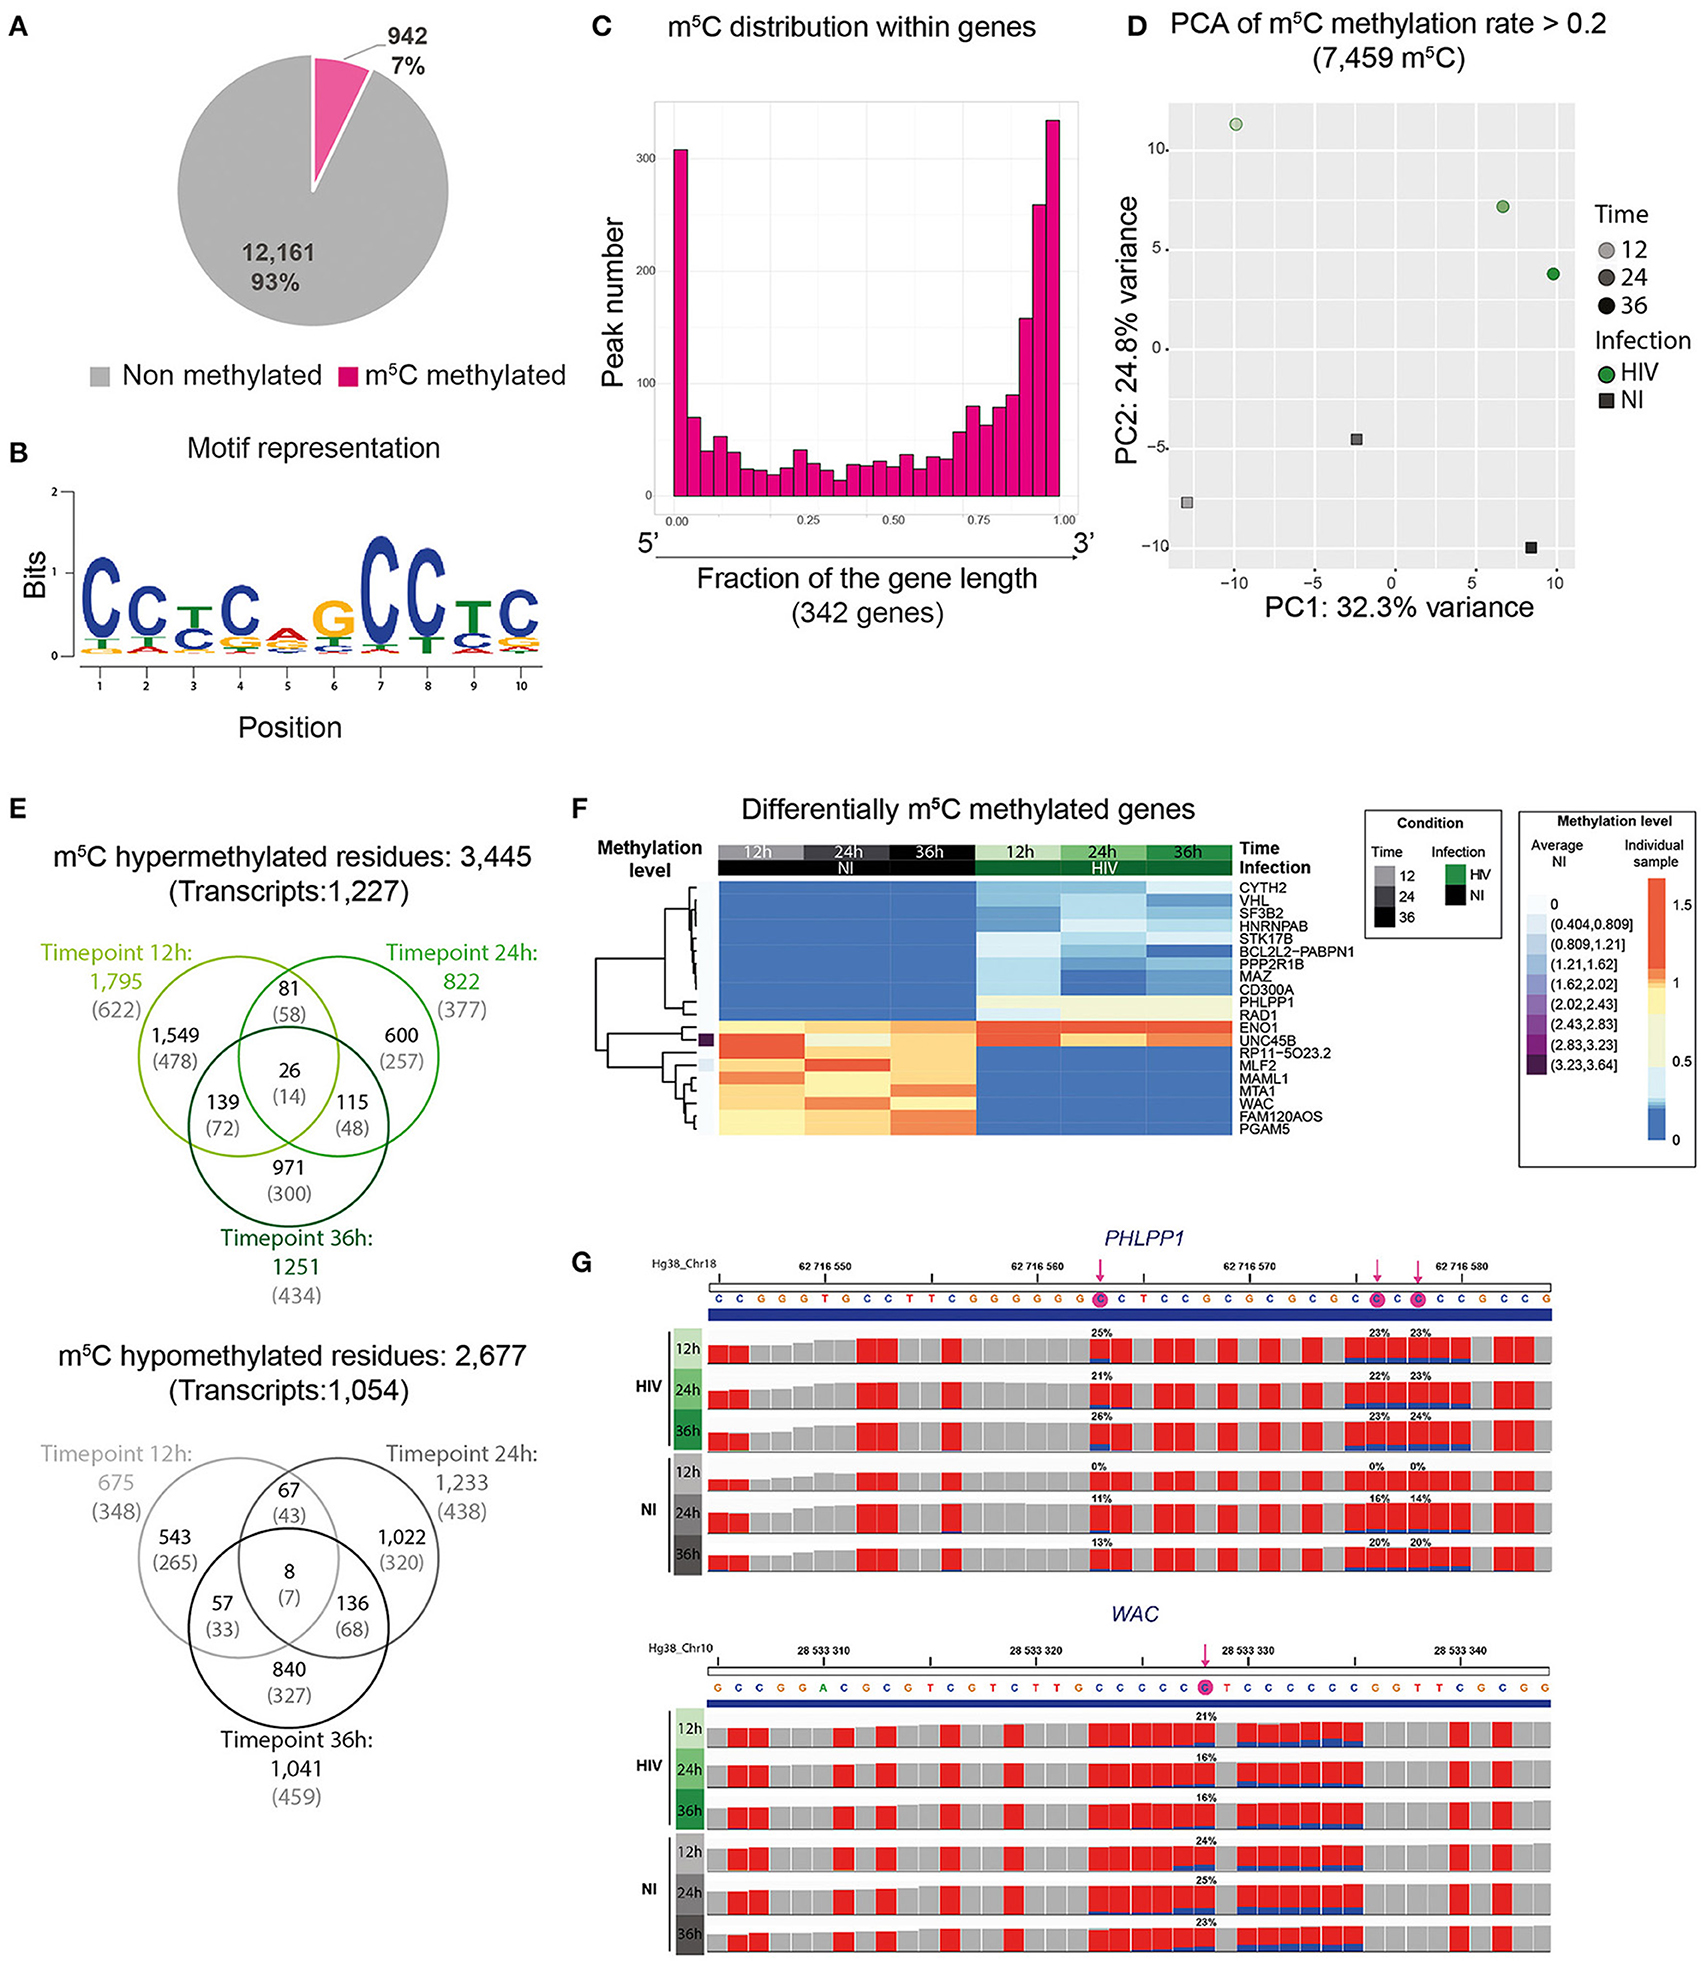
Figure 4. HIV infection induces changes in cellular m5C profile. (A) Pie chart representing the proportion of m5C methylated transcripts among the totality of detected transcripts (13,103). (B) Identification of a putative consensus motif for C methylation. Logo representation of the predicted m5C motif surrounding C residues displaying a methylation rate >80%. (C) Histogram plots showing on the x-axis genes normalized for their length and divided into 30 bins, and for each bin fraction of the gene, the number of m5C residues. Only genes containing a C-T conversion rate >50% were used. (D) PCA of the variance of m5C peaks among all samples. HIV-infected samples (HIV) are shown as green filled circles, non-infected samples (NI) as gray filled squares. Timepoint progression is depicted by the shade of the color. HIV transcripts are not included. (E) Venn diagrams showing hypermethylated (upper panel) or hypomethylated (lower panel) m5C residues upon infection. Values in black represent the number of m5C residues, values in gray into brackets represent the number of corresponding transcripts. (F) Heatmap of the commonly hyper/hypo methylated transcripts upon infection at the three timepoints. The 21 differentially methylated genes are shown. The average methylation level of the non-infected cells is represented in violet on the left, and was used for normalization. Differential methylation was then normalized to the average methylation intensity of each transcript. (G) Examples of a m5C hypermethylated (upper panel) and a m5C hypomethylated (lower panel) transcript upon infection using IGV viewer. Each C residue in the sequence is indicated as a red bar and the proportion of methylated C is shown in blue (exact proportion values are indicated for the statistically significant residues). The significant methylated C residues are highlighted by a pink arrow in the sequence displayed above the tracks.
Consistent with previous studies, m5C residues were enriched toward transcript ends and this distribution was not globally affected by HIV infection (Figure 4C and Supplementary Figure 6) (21).
Principal component analysis performed on the totality of m5C shows a separation according to time and infection with 32.3% and 24.8% of the variance explained by PC1 and PC2 respectively (Figure 4D). This data remained unchanged upon analysis with a more stringent filter for methylated cytosine proportion (conversion rate >50% and conversion rate >80%) (Supplementary Figure 7). Altogether, our data suggest that HIV affected the m5C profile of cellular transcripts. Upon analysis of differentially methylated m5C between infected and non-infected cells, we could identify 1,759 hypermethylated m5C in infected cells at 12 h, 822 at 24 h, and 1,251 at 36 h post infection (corresponding to 622, 377, and 434 hypermethylated transcripts, respectively) (Supplementary Table 4). Among them 26 m5C mapping on 13 different transcripts (and one unidentified transcript) were commonly hypermethylated in infected cells (Figure 4E). We could also identify 675 m5C positions hypomethylated in infected cells at 12 h, 1,233 at 24 h, and 1,041 at 36 h post infection (corresponding to 348, 438, and 459 hypomethylated transcripts, respectively) with 8 m5C mapping on 7 transcripts commonly hypomethylated upon infection (Figure 4E). The hypermethylated and hypomethylated genes common at the three timepoints are displayed in the heatmap (Supplementary Table 5 and Figure 4F) and one representative m5C hypermethylated and hypomethylated transcript is shown as IGV track (Figure 4G).
Although no statistically significant enrichment was identified by gene ontology analysis, 23.8%, i.e., 5 out of the 21 genes (ENO1, SF3B2, PPP2R1B, CD300A, and VHL) identified as differentially methylated were already described as interacting with HIV or contributing to its replication (Supplementary Table 5).
HIV RNA Is Both m6A and m5C Methylated
Although m6A and m5C methylation marks were previously reported along the HIV RNA molecule, these analyses were performed at a unique time point post-infection and did not consider the putative dynamics of methylation throughout HIV life cycle progression (8–12). We thus took advantage of our temporal design to assess the dynamics of m6A and m5C epitranscriptomic marks in HIV-infected cells. Furthermore, we compared the methylation profile between intracellular HIV transcripts and vRNA isolated from viral particles.
Upon m6A analysis of intracellular HIV RNA molecules, we identified 7 peaks that were conserved at all timepoints, with enrichment of m6A peaks toward the 3' end of the viral sequence (Supplementary Table 6 and Figure 5A). Increased methylation at the 3' region was consistent with previous studies identifying the 3' end as a methylation hotspot and as a binding site for cellular m6A readers (9). We also confirmed the presence of two previously reported m6A regions in Pol (8). However, we identified 2 additional methylated regions, respectively located between Pol and Vif on one hand, and in Vpu on the other hand. Finally, we detected at 36 h post-infection a unique peak at the 5′ end of the HIV genome, on the packaging signal sequence psi (ψ), that is also present in the viral particles (Supplementary Table 7 and Supplementary Figure 8A).
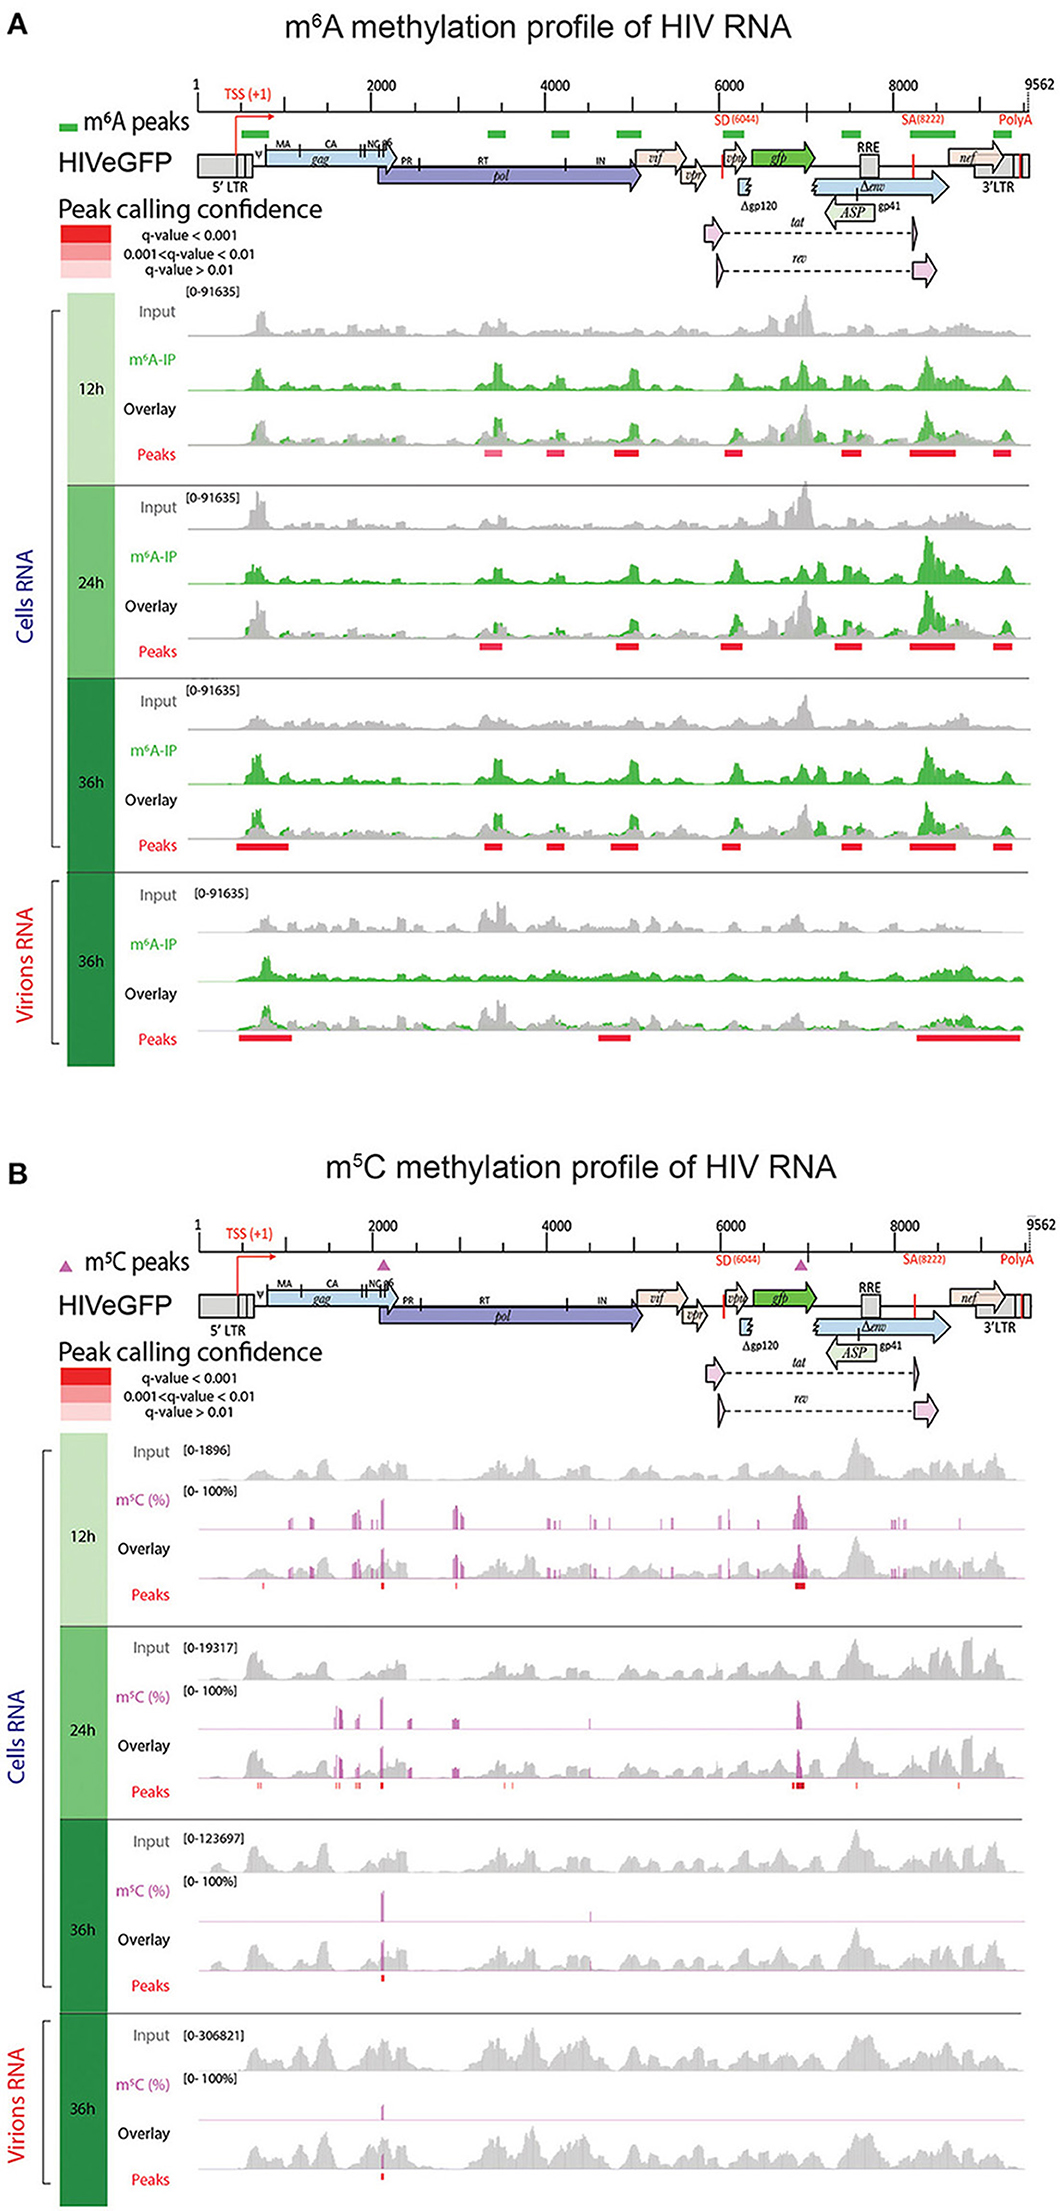
Figure 5. HIV RNA is both m6A and m5C methylated. Methylation pattern of HIV RNA molecules, isolated from infected cells over time (Cells RNA) or from viral particles (Virions RNA) at 36 h post-infection. HIV genome organization is depicted on top of the panels and methylation marks are indicated as green color rectangles (A) or pink triangles (B) above the genome, respectively. Detailed read coverage is displayed for each individual sample as tracks below the genome. (A) Identification of m6A peaks on HIV RNA. Input (gray) and m6A immunoprecipitated samples (green) are shown. Putative m6A peak calling was performed with MACS2 package after subtraction of the input background (overlay). Statistically significant peaks are highlighted by a red box, with color shading proportional to the q value (m6A peak track). (B) Identification of m5C on HIV RNA. Coverage of HIV genome upon conversion (gray) and detection of m5C (pink) are shown. M5C are presented as proportion of converted C. Bar height is proportional to the percentage of methylated C in the reads covering the position. The track height is set to 100%. M5C calling was performed with MACS2 package. Statistically significant residues are highlighted by a red box, with color shading proportional to the q value.
The methylation pattern identified on HIV RNA extracted from viral particles revealed the presence of a reduced number of total m6A peaks compared to intracellular HIV transcripts, with only three m6A-enriched regions (Figure 5A, lower panel, and Supplementary Table 7), suggesting that a putative selective packaging of viral RNA in the viral particle might take place.
Using a bisulfite conversion approach, we confirmed that cellular HIV RNAs were indeed methylated, however with minimal overlap with methylation hotspots described by Courtney et al. (Supplementary Table 6 and Figure 5B) (12). Upon filtering of low coverage regions and statistical analysis we identified 26 m5C at 12 h post-infection, 30 m5C at 24 h post-infection, and 7 highly methylated m5C residues at 36 h post-infection covered by at least 100 reads.
Overall, we identified 7 m5C residues, common to the 3 timepoints, and clustering all in the vicinity of the HIV gag-pol ribosomal frameshift signal with a methylation rate >50%. These highly methylated cytosine are present in viral particles as well as at all timepoints (Supplementary Figure 8B and Supplementary Table 7). The mechanism and the role of this time-dependent effect of m5C methylation on the HIV RNA sequence needs further investigation.
Discussion
Epitranscriptomics is a fast growing field of biology which highlighted the role of m6A and m5C modifications as specific mRNA marks mostly involved in RNA structural changes and gene expression regulation. In the present study, we explored (i) the cellular m6A- and m5C-marked transcriptome landscape, (ii) the HIV-induced modifications of the cellular epitranscriptome, and (iii) the position of these specific epitranscriptomic marks on HIV RNA molecule.
Using a SupT1 T cell line infected with a VSV-G pseudotyped HIV-based virus, we detected globally 22.5% transcripts with high confidence (13,103/58,136 genes), among which 15% (1,971/13,103) were differentially expressed, with 813 genes being upregulated and 1,158 downregulated genes in HIV-infected cells compared to mock-treated cells. The analysis of the epitranscriptome, with the tools available today, revealed that 58.9% of genes carried m6A methylation (7,724/13,103) (Figure 3B), while m5C marks were present on 7% (942/13,103) of transcripts (Figure 4B). These epitranscriptomic marks were mostly enriched toward 3′ ends of transcripts, as shown previously, and this distribution was not affected by HIV infection. Furthermore, our data recapitulated the lower abundance of m5C methylation compared to m6A modification on mRNA molecules (4). In contrast, when we focused on methylated transcripts and compared non-infected cells and HIV-infected cells, we observed that in the presence of HIV, methylation level globally increased, and we identified 62 differentially m6A-methylated transcripts (59 hypermethylated and 2 hypomethylated) as well as 21 differentially m5C-methylated transcripts (14 hypermethylated and 7 hypomethylated), common at the three analyzed timepoints. Our data are partially consistent with Tirumuru et al., who observed a 4–7 fold-increase of m6A methylation in cells infected with a WT virus, but not upon VSV-G-pseudotyped virus infection, suggesting an Env-mediated signaling increase in methylation (13). The basis of this discrepancy is likely due to differences in the experimental design as Tirumuru et al. used a global approach, assessing the level of methylation by m6A dot-plot on Jurkat T-cell line, while we used the MeRIP-Seq antibody-based technique on SupT1 cells.
Further analysis of the 64 m6A-DM transcripts did not reveal any particular enrichment upon gene ontology analysis. Nevertheless, we detected 4 out of 7 GIMAPs in the common list of DM transcripts, and two additional hypermethylated GIMAP members in individual timpoints. GIMAPs are immune-associated proteins displaying a GTPase activity. They have been involved in response to pathogens and have a prominent role in T cell survival and differentiation. The role of GIMAPs in HIV life cycle has never been reported so far and remains to be further characterized.
The analysis of the 21 m5C-DM transcripts identified a few genes whose products were previously described as interacting with HIV proteins and affecting the viral life cycle. These include Enolase 1 (ENO1), previously described as hampering HIV reverse transcription (22); the splicing factor 3b subunit 2 (SF3B2), shown to interact with Vpr, thereby impairing splicing of some cellular pre-mRNA and impacting Vpr-mediated G2 cell cycle arrest (23–25); the protein phosphatase 2 scaffold subunit A beta (PPP2R1B), associating with Tat and involved in Tat-mediated apoptosis (26); CD300A, a surface glycoprotein involved in immune response signaling shown to be associated with HIV disease progression markers (27, 28), and shown to be downregulated by Vif (29); and von Hippel Lindau tumor suppressor (VHL), a protein involved in the degradation of hypoxia-inducible-factor and predisposing to cancer when impaired, also known to mediate HIV integrase degradation, thereby affecting HIV expression at post-integration steps (30). The role of these methylations on protein expression remains to be investigated, as well as the impact on HIV replication. Nevertheless, these data provide a first roadmap of the impact of HIV on cellular m5C-transcriptome.
These findings suggest that HIV modulates the host methylation profile of the transcriptome, and we can thus hypothesize that the modified transcripts are likely to affect the viral life cycle, either promoting it or inhibiting it. Differentially methylated transcripts may thus represent novel HIV-interacting candidate proteins that should be further investigated and characterized.
Of note, although epitransriptomic metabolism was not significantly enriched in gene ontology analysis, we noticed that some transcripts involved in methylation turnover were themselves methylated and differentially methylated for some of them (such as the YTHDF1 and YTHDF3 at 12 h post-infection).
Similar to cellular transcripts, the HIV virion RNA molecule is methylated. We identified 7 m6A peaks that were conserved over time, suggesting a rather stable methylation profile. We observed an enrichment of m6A at the 3′ of the HIV genome, confirming data from previous studies (8, 9, 11). Our data did not retrieve the two m6A peaks previously described to be located in the RRE region, and implicated in enhanced Rev-RRE binding and nuclear export (8). Overall, the studies aiming at investigating m6A modifications display minimal overlaps, likely due to protocol differences as mentioned above, and poor resolution of the m6A identification approach. Upon comparison between intracellular HIV transcripts and virion RNA we could observe that the m6A peak present on Vpu and in close proximity of the HIV major 5′ splicing donor (SD) was found only in viral transcripts. Maintenance of the SD hairpin secondary structure is essential to ensure correct splicing of viral transcripts by controlling accessibility of the 5′ splicing site for the splicing machinery (31). Destabilization of the hairpin loop results in an increase of splicing while its stabilization has the opposite effect. We could speculate that the presence of m6A in proximity of the site may induce a change in secondary structure allowing easier access to the splicing machinery, while absence of methylation favors the unspliced HIV RNA form. Moreover, the m6A peak present in the 3′UTR region in all intracellular viral transcripts is weak or absent in the viral particle genomic RNA, and could suggest a signal contributing to selective packaging of unmethylated HIV RNA genome (Supplementary Figure 8).
Furthermore, we identified 2 m6A peaks, present both on intracellular HIV transcripts and on packaged HIV RNA genome, encompassing the 2 major polypurine tracts (PPT). Although PPT are known for being more resistant to RNAseH-mediated degradation during reverse transcription, the identification of PPT methylation may suggest an additional mechanism providing the observed increased resistance (32).
No data were available on m5C methylation of HIV transcripts until very recently. Using an immunoprecipitation-based approach to investigate the m5C epitranscriptomic mark, Courtney et al. identified 18 m5C peaks along HIV RNA with an enrichment toward the 3′ end of the genome (12). Using a bisulfite conversion (BS-Seq) approach, we confirmed the presence of this modification on intracellular and packaged genomic viral RNAs and identified 7 conserved, highly methylated m5C residues, but with only minimal overlap regarding the exact positions of the epitranscriptomic marks. Using a temporal design, we could describe a C cluster at the beginning of gag and surrounding the HIV ribosomal frameshift signal that regulates Gag and Gag-Pol precursor protein synthesis. This signal is indeed essential to maintain a tight regulation of the 20:1 Gag/Gag-Pol translation ratio and ensure successful HIV replication (33). The identification of an m5C hotspot close to the frameshift signal may thus point to an additional mechanism involved in the post-transcriptional regulation of Gag and Gag-Pol production.
Although m6A and m5C methylations are considered as the most abundant modifications on mRNA molecules, additional epitransciptomic marks may be present and impact HIV-host interactions, such as 2′-O-methylations (12, 34). Indeed, Ringeard et al. recently showed that HIV transcripts can be methylated at the 2′ hydroxyl of ribose, hence 2′-O-methylation, via a specific methyltransferase, FTSJ3, specifically recruited by TAR-RNA binding protein (TRBP) (34). They identified 17 A or U residues containing this specific methylation on the viral RNAs. They demonstrated that 2′-O-methylations were important for viral transcripts to be recognized as endogenous RNA mimics and thus escape innate immune sensing and degradation. Differential analysis of 2′-O-methylation marks upon HIV infection may provide additional insights in HIV life cycle (12, 34).
Overall, this study provided an overview of m6A and m5C modifications on both viral and cellular transcriptomes over time, identifying the dynamic impact of HIV infection on cellular RNA modifications, and identifying novel candidates as putative factors involved in HIV replication. Further investigation of these candidates, using overexpression or knock-out assays, may reveal a role as HIV dependency factor or inhibitory factor.
To ensure bona fide HIV-induced m6A and m5C epitranscriptomic modifications, similar analyses may be repeated using (i) fully replication-competent HIV virus to discard any bias induced by the HIV_eGFP/VSV-G pseudotyped vector and (ii) other cell lines or primary CD4+T cells to identify conserved or cell-specific epitranscriptomic patterns.
The existence of RNA modifications and their potential modulation by HIV proteins offer a new layer of opportunities to hijack the host cellular machinery to promote viral replication and evade the innate immune response. Therefore, identifying all types of differentially methylated or modified transcripts upon HIV infection may lead to the uncovering of novel host factors involved in the HIV-host interplay. Finally, it is likely that differential methylation induced upon HIV infection may be shared with other viruses. Modifications of the epitranscriptomic landscape upon pathogen invasion certainly deserves further investigation and will likely become a new state-of-the-art tool in exploring host-pathogen interactions.
Methods
Cells and Plasmids
Human Embryonic Kidney 293T (HEK293T) cells were cultured in D10 (Dulbecco's modified Eagle medium (DMEM) containing 1x glutamax (#61965-026, Invitrogen), supplemented with 10% heat-inactivated Fetal Bovine Serum (FBS) and 50 μg/ml Gentamicin and maintained at a maximal confluence of 80%.
SupT1 cells are human T cell lymphoblasts. They were cultured in R10 (RPMI 1640 with 1x glutamax (#61870-010, Invitrogen) containing 10% heat-inactivated FBS and 25 μg/ml Gentamicin and split twice a week at 0.5x10⁶ cells/ml to maintain a maximal concentration of 1 × 10⁶ cells/ml.
The following DNA constructs were used in this study: For viral infection, we used pNL4-3ΔEnv-GFP (NIH AIDS Research and Reference Reagent program, Cat. #11100) that encodes the HIV vector segment with a 903 bp deletion in the env ORF in which the gfp ORF was introduced. For pseudotyping, the plasmid pMD.G coding for the vesicular stomatitis virus G envelope (VSV-G) was used (35).
HIV Production and Infection
For production of HIV-based vector NL4-3-ΔEnv-GFP/VSV-G (named hereafter HIV-eGFP), 2.5 million of HEK293T cells were seeded in 10 cm dishes and incubated overnight at 37°C/5% CO2. The next day, cells reached about 60% confluence and were transfected with a total of 10 μg of DNA, i.e., 7.5 μg of pNL4-3-ΔEnv-GFP and 2.5 μg pMD2.G coding for the VSV-G envelope, using the jetPRIME kit (Polyplus transfection) and according to manufacturer's instructions. Briefly, DNA was diluted into 500 μl of supplied buffer, mixed with 30 μl of jetPRIME reagent and incubated 10 min at room temperature. Transfection mixture was then added to the cell dropwise. Fifteen hours after transfection, cells were washed once with D10 and incubated for 33 h in 293SFM medium (#11686029, Thermo Fisher Scientific). HIV-GFP particles were harvested 48 h after transfection, filtered through 0.45 μm, and concentrated on Centricon units (Centricon Plus-70/100K, Millipore). Viral titers were measured by HIV p24 Enzyme-linked immunosorbent assay (ELISA) kit (Innogenetics).
SupT1 cells (5 × 10⁶ cells) were either mock-treated or infected with 5 μg p24 equivalent of HIV-GFP by spinoculation at 1,500 g for 30 min at 20°C, in presence of 4 μg/ml polybrene (Sigma), in 400 μl final volume in 14 ml round bottom polypropylene tubes—a total of 50 tubes were used for mock condition and 50 tubes for infected condition to obtain a total of 250 million cells for each condition. Cells were then pooled, washed three times with culture medium, resuspended at 106 cells/ml in R-10, and further incubated in T75 flasks (8 × 31 ml).
At 12, 24, and 36 h post-infection, cellular SupT1 samples (~50 × 106 cells in 50 ml) were collected for viral and cellular measurements. Briefly, 0.5 ml of the cell cultures were used for cell counting and viability assessment by trypan blue exclusion, using a ViCell Coulter Counter (Beckman Coulter). Remaining cells were centrifuged at 300 g for 10 min. Viral supernatant produced from infected SupT1 cells was collected at 36 h post-infection: 950 μl were mixed with 50 μl NP-40 (0.5%) and stored at −80°C until particle concentration assessment by p24 ELISA (Innogenetics) while the rest of the supernatant was concentrated by filtration on Centricon units (Centricon Plus-70/100K, Millipore) and frozen at −80°C for RNA extraction. Cells were washed with R10 once, centrifuged again, resuspended in 5 ml R10 (~107 cells/ml), and separated as follows: (i) 50 μl of cell suspension were resuspended in Cell Fix 1× (Becton Dickinson) for assessment of GFP expression and infection success by FACS analysis (Accuri C6 FACS, Becton Dickinson), (ii) aliquots of 1 ml of cell suspension (~107 cells) were centrifuged, resuspended in 1 ml of Trizol reagent (#15596026, Invitrogen), and stored at −80°C for further RNA extraction and transcriptome analyses.
RNA Extraction
Total RNA was extracted from both concentrated viral particles and cells using Trizol Reagent (#15596026 Invitrogen) according to suppliers' instructions. Briefly, samples were thawed at room temperature and 200 μl chloroform were added to the mixture. Samples were centrifuged for 30 min at 10.000 g, at 4°C, and the RNA–containing, aqueous (upper) phase was transferred to a fresh tube and subjected to precipitation with 0.5 ml of isopropanol for 1 h at −80°C. Samples where then centrifuged for 10 min at 12,000 g, washed once in 1 ml of 75% ethanol, and resuspended in 50 μl H2O.
For poly(A) RNA purification, 200 μl Dynabeads Oligo(dT)25 (#61005, Life Technologies) were washed twice with 1 ml of binding buffer (20 mM Tris-HCl, pH 7.5, 1.0 M LiCl, 2 mM EDTA) and incubated with aliquots of 75 μg RNA in 100 μl final volume for 15 min at room temperature on a wheel. Samples were then washed twice with 500 μl washing buffer (10 mM Tris-HCl, pH 7.5, 0.15 M LiCl, 1 mM EDTA 10 mM Tris-HCl, pH 7.5) and subjected to a second incubation with the same RNA sample. Poly(A) selected mRNA was recovered through elution by a 2 min incubation with 20 μl Tris-HCl (10 mM) at 80°C. PolyA depleted RNA from the 36 h NI samples was purified and kept as a spike-in control for bisulfite conversion experiments. RNA was purified and concentrated using a column-based kit (#RNA1013, Zymo Research), fragmented during 15 min at 70°C using Ambion RNA Fragmentation Reagents (#AM8740, Life Technologies), in order to obtain fragment of 100–200 nt and purified again as above. An aliquot of fragmented RNA (100 ng) was retained as a control for RNA sequencing (input) while the rest was used for MeRIP-Seq and bisulfite conversion allowing m6A and m5C analysis, respectively. At every step, integrity and peak size of the RNA was assessed on a Fragment Analyser (AATI #DNF-472).
m6A-Modified RNA Immunoprecipitation Sequencing (MeRIP-Seq)
For MeRIP (#17-10499, Millipore), 5 μg of fragmented mRNA was incubated with 5 μg of anti-m6A antibody or anti-IgG antibody (negative control) previously coupled with 25 μl of A/G-coated magnetic beads in 500 μl IP Buffer for 2 h at 4°C following manufacturer's recommendations. Samples were placed on a magnetic stand for 5 min and the unbound RNA was discarded. The beads were then washed three times with 500 μl IP buffer and bound RNA was released by two rounds of elution of 1 hour each with 20 mM of free m6A peptides (7 mM N6-Methyladenosine. 5′-monophosphate sodium salt). RNA was purified and concentrated in 20 μl of water, using a column-based kit (# RNA 1013, Zymo Research). We recovered normally between 15 and 25 ng of associated RNA from samples immunoprecipitated with a specific anti-m6A antibody. Libraries for sequencing (input RNA-Seq and MeRIP-Seq) were prepared using Illumina TruSeq Stranded mRNA kits (#20020594, Illumina), starting the protocol at the Elute-Prime-Fragment step, and with a protocol modification consisting in incubating the samples at 80°C for 2 min to only prime but not further fragment the samples. Samples were sequenced on a HiSeq 2500 Illumina on 4 lanes, using single end reads of 125 nt (Genomic Technology Facility [GTF], University of Lausanne).
RNA-Seq data were aligned to a combined hg38 (chr 1-22, X, Y) and HIV genome FASTA using the STAR aligner, and keeping only uniquely mapping reads. Data were analyzed in collaboration with the Swiss Institute of Bioinformatics (SIB) and the Genomic Technology Facility (GTF), University of Lausanne.
RNA Bisulfite Conversion Sequencing (BS-Seq)
Bisulfite treatment was performed using the EZ RNA methylation Kit (#R5001, Zymo Research). Briefly, 500 ng of poly(A)-selected RNA were spiked-in with 500 pg of polyA-depleted RNA (to ensure rRNA representation) as a control for bisulfite conversion. mRNA was mixed with 130 μl of RNA conversion solution and converted using three cycles of 10 min denaturation at 70°C followed by 45 min at 64°C in a final volume of 200 μl. After conversion, mRNA was bound to a RNA purification column and desulfonated by addition of 200 μl RNA Desulfonation Buffer during 30 min at room temperature. Purification was performed using the kit according to the manufacturer's recommendations. RNA quantity and quality was determined by analysis on a Fragment analyser (AATI) using the High sensitivity RNA kit (#DNF-472, AATI).
The efficiency of bisulfite treatment was tested by RT-PCR-mediated bisulfite analysis of spiked-in rRNA (C4447 in 28S rRNA is 100% methylated). Briefly, 4 μl of bisulfite converted RNA were subjected to RT with High Capacity cDNA reverse transcription kit (Applied Biosystems #4368814) according to manufacturer procedure and incubated with the following program: 25°C – 10 min; 37°C – 120 min; 85°C 5 min. PCR was performed on 6 μl of cDNA using the AccuPrime™ Pfx SuperMix (Thermo Fisher Scientific # 12344-040) with primers annealing on the 28S ribosomal RNA (primerH28SF, H28SR table 1). PCR products were sequenced by Next Generation Sequencing, and resulting sequences aligned to the Human 28S. Cytosine in position 4447 was used as control of non-converted cytosine, while surrounding cytosines were used as a control of C-T conversion.
Libraries for sequencing were prepared using the Illumina TruSeq Stranded mRNA kit as described above (i.e., entering the protocol at the Elute-Prime-Fragment step and with the modification) and sequenced on two lanes of Illumina HiSeq 2500 as described above.
FACS Analysis
FACS analysis of infected cells was performed on a BD Accuri C6 machine. About 2x10⁵ cells were washed twice in Robosep buffer (#20104, Stemcell Technologies) and fixed in 300 μl CellFix buffer 1X (#340181, BD) for at least 3 h at 4°C. The GFP was then monitored by FACS in the FL-1 channel to monitor infection success. Analysis was carried out using FlowJo software.
Bioinformatic Analyses
The analyses described in this section apply to both intracellular transcripts (host mRNAs and vRNAs) and virion-incorporated RNA data.
m6A and Gene Expression Quantification
The m6A modification and input libraries underwent a first quality check with FASTQC [http://www.bioinformatics.babraham.ac.uk/projects/fastqc/]. FASTQ files were trimmed with Atropos (36). The adapter sequences AGATCGGAAGAG, CTCTTCCGATCT, AACACTCTTTCCCT, AGATCGGAAGAGCG, AGGGAAAGAGTGTT, CGCTCTTCCGATCT were removed after trimming of low-quality ends (a Phred quality cutoff of 5 has been applied) as specified by the manufacturer (https://support.illumina.com/downloads/illumina-adapter-sequences-document-1000000002694.html). Only reads with a minimum length of 25 base pairs after trimming were retained.
Trimmed reads were aligned to an assembly of the Hg38 human genome and HIV [Integrated linear pNL4-3ΔEnv-GFP] genome. The software used for the alignment was HISAT2 (37). Aligned reads were indexed and sorted with SAMtools (38).
Post-alignment quality of the reads was performed with SAMtools stat and Qualimap 2 (39). Quality measures have been collected and summarized with multiQC (40).
HIV genome has homologous 634 bp sequences in the 5′ LTR and 3′ LTR. Multimapping reads from 5′ LTR have been realigned to the corresponding 3′ LTR region with SAMtools.
Abundance quantification of transcripts on input libraries has been performed with Salmon (41). HIV expression level has been quantified by directly counting reads mapping to the viral genome.
m6A peaks were identified with the peak calling software MACS2 (v 2.1.2) (42). Caution was applied in the choice of MACS2 running parameters, to allow the toll to correctly work on RNAseq data. In RNA-Seq data the peak calling can be affected by the gene expression level, and short exons may potentially be miscalled as peaks. Hence, signal from input must be subtracted from m6A signal, without the smoothing routinely applied by MACS2 to DNA based data.
The “callpeak” sub-command from MACS2 was run with the following parameters: –keep-dup auto (controls the MACS2 behavior toward duplicate reads, ‘auto’ allows MACS to calculate the maximum number of reads at the exact same location based on binomial distribution using 1e-5 as p-value cutoff), -g 2.7e9 (size of human genome in bp), -q 0.01 (minimum FDR cutoff to call significant peaks), –nomodel (to bypass building the shifting model, which is tailored for ChIP-Seq experiments), –slocal 0 –llocal 0 (setting these 2 parameters to 0 allows MACS2 to directly subtract, without smoothing, the input reads from the m6A reads), –extsize 100 (average length of fragments in bp), -B -SPMR (to generate library size normalized bedGraph track for visualization).
In order to compare infected vs. non-infected samples, the differential peak calling sub-command of MACS2, “bdgdiff,” was used, and “bdgdiff” takes as inputs the bedGraph files generated by “callpeak.” First, we run “callpeak” with the same parameters as above, but without the -SPMR option (output unnormalized tracks), which is not compatible with “bdgdiff.” Then, for each time point we run the comparison of infected vs. non-infected samples with “bdgdiff,” subtracting the respective input signal from the m6A signal and providing the additional parameters -g 60 -l 120.
Bisulfite Conversion Analyses
Cutadapt (43) was applied for read trimming, using parameters of –minimum-length=25 and the adapter “AGATCGGAAGAGCACACGTCTGAAC.” Trimmed reads were subsequently reverse complemented using seqkit (44).
Quality control was performed by employing FastQC to examine samples for (a) poor read quality and (b) contamination of which there was no supporting evidence.
The application meRanGh from the meRanTK package (20) was leveraged to make an index file for alignment consisting of the hg38 reference genome supplemented with the HIV genome. Aligning again employed meRanGh with parameters enabling unmapped reads (-UN), multi-mapped reads (-MM) to be written to output files. Additionally, the output bedGraph (-bg) was produced.
Reported Regions were filtered by those with at least a 10 read coverage (-mbgc 10). To account for HIV LTR regions being multi-mapped, and not thus not being present in the alignment output file, Sambamba (45) merge was employed to filter reads in the HIV genome upstream of the 8,500 bp locus and append them to the final alignment.
FeatureCounts (46) was employed at the exon and CDS level for the hg38 and HIV genomes, respectively.
Methylation calling was completed via the meRanCall tool, provided by meRanTK, with a read length (-rl) parameter of 126, an error interval of 0.1 used for the methylation rate p-value calculation (-ei), an expected conversion rate of 0.99 (-cr). MeRanCompare was employed with a significance value of 0.01 as the minimal threshold for reporting. For its size factors parameter, MeRanTK's included utility estimateSizeFactors.pl was employed on each of the time points and produced values of (0.8102, 1.2342), (1.1894, 0.8408), (0.6562, 1.5240) for (not infected, infected) across time points 12, 24, and 36 h respectively.
Differential Gene Expression (DGE) Analysis
Transcript abundance and counts estimated by Salmon for the input samples were imported into an R session (version 3.5.1) using the package tximport (47). The same package was used to summarize transcript level expression at the gene level.
Low count genes have been removed with the method “filtered.data” from the package NOISeq (48); “filtered.data” method 1 removes those genes that have an average expression per condition <3 CPM (Counts Per Millions) and a coefficient of variation per condition higher than cv.cutoff = 100 (in percentage) in all the conditions.
The filtered gene table was the processed with the package for differential gene expression analysis (49). First, exploratory PCA plots were generated with the PCA plot function on counts transformed with the rlog method in DESeq2. Then, differential expressed genes were called with an adjusted (Benjamini-Hochberg method) p-value threshold of 0.01. To take into account the effect of cell culture time together with that of HIV infection, we asked DESeq2 to fit a Generalize Linear Model (GLM) which included both effects: design = ~ infection + time. Two lists of differentially expressed (DE) genes according to infection and time were thus obtained. To further separate the effect of the HIV infection from the time one, we produced a list of “HIV only” DE genes, by removing from the list of infection related DE genes those in common with the list of time-related DE genes.
A PCA plot with this “HIV only” DE gene list was produced in order to highlight the effect of HIV infection, and heatmaps with the gene expression level of these genes were also drawn.
m6A Differential Peak Calling Analysis
MACS2 “callpeak” generated a list of peaks for each time point and each infection status (infected and non-infected). MACS2 “bdgdiff” generated 3 lists (common peaks, up and down regulated upon HIV infection) for each time point comparison. These lists of peaks were further processed and analyzed with the R package diffbind (50), and annotation with overlapping genes was provided by the package ChIPpeakAnno (51).
To reduce the number of false positives, only the peaks called by both MACS2 methods (“callpeak” and “bdgdiff”) were retained in the following analyses. For purpose, for each time point and infection status, we intersected the list produced by “callpeak” with the corresponding lists produced by “bdgdiff” (the common peaks and condition specific peaks). We thus obtained a high confidence peak list for each time point and condition.
We defined a measure for peak intensity based on the number of reads overlapping with each peak. For counting the overlapping reads, the function dba.count from DiffBind was used. First, we created a consensus peak set with the union of the high confidence peak lists. Reads overlapping with a span of 100 bp around the summit of the peaks in the consensus were counted, normalization factors were computed using edgeR TMM method (52), and the reads in the m6a input were subtracted to separate methylation from expression level effects. The normalized counts at each peak, which we will call peak scores, were used to generate the PCA plot, the peak distribution along gene length, and heatmaps.
The presence of the m6A binding motif (“DRACH”) was assessed using the function scan_sequences from the package “universalmotif” (53) over the consensus list of peaks.
An unsupervised motif search was also performed. From the consensus peak set, we extracted the nucleotide sequence (from the reference genome Hg38) of an interval of 10 bp upstream and 10 bp downstream from the center of each peak. The list of 17,657 sequences was used as input for the tool DREME (54), from MEME suite (5.1.0) (55), which performed the motif discovery.
Peak distributions along genes were computed by dividing each gene in 30 intervals and adding up the scores of peaks belonging to each interval for all genes (in other words, computing the sum of the peaks in each interval weighed by the scores). The distributions were plotted at each time point and condition.
In order to compare the modification of m6A RNA methylation specific to HIV infection, we intersected the up (down) regulated peak lists of all 3 time points, and, for late infection response, at 24 and 36 h time point only. We summarized these results at the gene level (obtaining a “gene methylation score”) by adding up the scores of the peaks in each gene. The methylation score of up and down methylated genes upon HIV infection were plotted as heatmaps.
m5C Differential Methylation Calling Analysis
The m5C data analysis follows the line of the m6A one described above. The lists of methylated C generated by meRanCall tool were further processed and analyzed with the R package DiffBind and annotation for overlapping genes was provided by the package ChIPpeakAnno.
In order to reduce the number of false positives in m5C called bases, beside the adjusted p-value threshold of 0.01 applied by meRanCall, we introduced an extra threshold on coverage, asking that the retained m5C bases having at least 30 read coverage. This number was adjusted by the total number of reads in each library to have an even filter across samples.
Furthermore, a consensus set of m5C sites was created by the union of the m5C called bases from all samples, asking that a methylated site appears in at least 2 samples. The methylation rate (number of methylated C over total number of C) at each base was used as methylation intensity score to generate the PCA plot, the m5C distribution along gene length, and heatmaps.
A motif discovery was performed with MEME (5.1.0) (55). A list of 788 sequences of 10 bp surrounding both sides of methylated bases was input to MEME. This list is a high confidence list of methylated sites made by joining (union) the bases with a methylation rate >0.8 from all samples.
m5C distributions along genes were computed by dividing each gene in 30 intervals and adding up the methylation rate of m5C belonging to each interval for all genes (in other words, computing the sum of the m5C sites in each interval weighed by the methylation rate). The distributions were plotted at each time point and condition.
In order to compare the modification of m5C RNA methylation specific to HIV infection, we intersected the up (down) regulated peak lists of all 3 time points, and, for late infection response, at 24 and 36 h time point only. We summarized these results at the gene level (obtaining a “gene methylation score”), by adding up the methylation rates of the bases in each gene. The methylation scores of up and down methylated genes upon HIV infection were plotted as heatmaps.
Data Availability Statement
All raw RNA-Seq data will be deposited in NCBI's Gene Expression Omnibus and are accessible through GEO series accession number GSE157193. All data are freely accessible on the iSEE-Hi-TEAM web resource at http://sib-pc17.unil.ch/HIVmain.html.
Author Contributions
Conceptualization ideas and writing: AC, SC, and PA. Methodology, data curation, and visualization: SC and PA. Formal analysis: SC, PA, AJ, and AC. Investigation: SC, PA, and AJ. Resources and supervision: AC and MD. Funding acquisition: AC. All authors contributed to the article and approved the submitted version.
Funding
This work was supported by the Swiss National Science Foundation (Grants 31003A_166412 and 314730_188877).
Conflict of Interest
The authors declare that the research was conducted in the absence of any commercial or financial relationships that could be construed as a potential conflict of interest.
Acknowledgments
We thank the Lausanne Genomic Technology Facility of the University of Lausanne. We thank Raquel Martinez for technical assistance and valuable help.
Supplementary Material
The Supplementary Material for this article can be found online at: https://www.frontiersin.org/articles/10.3389/fviro.2021.714475/full#supplementary-material
References
1. Boccaletto P, Machnicka MA, Purta E, Piatkowski P, Baginski B, Wirecki TK, et al. MODOMICS: a database of RNA modification pathways. 2017 update. Nucleic Acids Res. (2018). 46:D303–7. doi: 10.1093/nar/gkx1030
2. Davalos V, Blanco S, Esteller M. SnapShot: messenger RNA modifications. Cell. (2018) 174:498–501. doi: 10.1016/j.cell.2018.06.046
3. Saletore Y, Meyer K, Korlach J, Vilfan ID, Jaffrey S, Mason CE. The birth of the Epitranscriptome: deciphering the function of RNA modifications. Genome Biol. (2012) 13:175. doi: 10.1186/gb-2012-13-10-175
4. Zhao BS, Roundtree IA, He C. Post-transcriptional gene regulation by mRNA modifications. Nat Rev Mol Cell Biol. (2017) 18:31–42. doi: 10.1038/nrm.2016.132
5. Meyer KD, Jaffrey SR. The dynamic epitranscriptome: N6-methyladenosine and gene expression control. Nat Rev Mol Cell Biol. (2014) 15:313–26. doi: 10.1038/nrm3785
6. Zaccara S, Ries RJ, Jaffrey SR. Reading, writing and erasing mRNA methylation. Nat Rev Mol Cell Biol. (2019) 20:608–24. doi: 10.1038/s41580-019-0168-5
7. Shi H, Wei J, He C. Where, when, and how: context-dependent functions of RNA methylation writers, readers, and erasers. Mol Cell. (2019) 74:640–50. doi: 10.1016/j.molcel.2019.04.025
8. Lichinchi G, Gao S, Saletore Y, Gonzalez GM, Bansal V, Wang Y, et al. Dynamics of the human and viral m(6)A RNA methylomes during HIV-1 infection of T cells. Nat Microbiol. (2016) 1:16011. doi: 10.1038/nmicrobiol.2016.11
9. Kennedy EM, Bogerd HP, Kornepati AV, Kang D, Ghoshal D, Marshall JB, et al. Posttranscriptional m(6)A Editing of HIV-1 mRNAs enhances viral gene expression. Cell Host Microbe. (2016) 19:675–85. doi: 10.1016/j.chom.2016.04.002
10. Lu W, Tirumuru N, St Gelais C, Koneru PC, Liu C, Kvaratskhelia M, et al. N(6)-Methyladenosine-binding proteins suppress HIV-1 infectivity and viral production. J Biol Chem. (2018) 293:12992–3005. doi: 10.1074/jbc.RA118.004215
11. Tirumuru N, Zhao BS, Lu W, Lu Z, He C, Wu L. N(6)-methyladenosine of HIV-1 RNA regulates viral infection and HIV-1 Gag protein expression. Elife. (2016) 5:e15528. doi: 10.7554/eLife.15528
12. Courtney DG, Tsai K, Bogerd HP, Kennedy EM, Law BA, Emery A, et al. Epitranscriptomic addition of m(5)C to HIV-1 transcripts regulates viral gene expression. Cell Host Microbe. (2019) 26:217–27. doi: 10.1016/j.chom.2019.07.005
13. Tirumuru N, Wu L. HIV-1 envelope proteins up-regulate N (6)-methyladenosine levels of cellular RNA independently of viral replication. J Biol Chem. (2019) 294:3249–60. doi: 10.1074/jbc.RA118.005608
14. Rue-Albrecht K, Marini F, Soneson C, Lun A. iSEE: interactive summarized experiment explorer [version 1; peer review: 3 approved]. F1000Res. (2018) 7:741. doi: 10.12688/f1000research.14966.1
15. Mohammadi P, Desfarges S, Bartha I, Joos B, Zangger N, Muñoz M, et al. 24 hours in the life of HIV-1 in a T cell line. PLoS Pathog. (2013) 9:e1003161. doi: 10.1371/journal.ppat.1003161
16. Dominissini D, Moshitch-Moshkovitz S, Schwartz S, Salmon-Divon M, Ungar L, Osenberg S, et al. Topology of the human and mouse m6A RNA methylomes revealed by m6A-seq. Nature. (2012) 485:201–6. doi: 10.1038/nature11112
17. Zhang S-Y, Zhang S-W, Liu L, Meng J, Huang Y. m6A-driver: identifying context-specific mRNA m6A Methylation-Driven Gene Interaction Networks. PLOS Computat Biol. (2016) 12:e1005287. doi: 10.1371/journal.pcbi.1005287
18. Ciucci T, Bosselut R. Gimap and T cells: a matter of life or death. Eur J Immunol. (2014) 44:348–51. doi: 10.1002/eji.201344375
19. Amort T, Rieder D, Wille A, Khokhlova-Cubberley D, Riml C, Trixl L, et al. Distinct 5-methylcytosine profiles in poly(A) RNA from mouse embryonic stem cells and brain. Genome Biol. (2017) 18:1. doi: 10.1186/s13059-016-1139-1
20. Rieder D, Amort T, Kugler E, Lusser A, Trajanoski Z. meRanTK: methylated RNA analysis tool kit. Bioinformatics. (2015) 32:782–5. doi: 10.1093/bioinformatics/btv647
21. Squires JE, Patel HR, Nousch M, Sibbritt T, Humphreys DT, Parker BJ, et al. Widespread occurrence of 5-methylcytosine in human coding and non-coding RNA. Nucleic Acids Res. (2012) 40:5023–33. doi: 10.1093/nar/gks144
22. Kishimoto N, Iga N, Yamamoto K, Takamune N, Misumi S. Virion-incorporated alpha-enolase suppresses the early stage of HIV-1 reverse transcription. Biochem Biophys Res Commun. (2017) 484:278–84. doi: 10.1016/j.bbrc.2017.01.096
23. Terada Y, Yasuda Y. Human immunodeficiency virus type 1 Vpr induces G2 checkpoint activation by interacting with the splicing factor SAP145. Mol Cell Biol. (2006) 26:8149–58. doi: 10.1128/MCB.01170-06
24. Zhang X, Aida Y. HIV-1 Vpr: a novel role in regulating RNA splicing. Curr HIV Res. (2009) 7:163–8. doi: 10.2174/157016209787581517
25. Hashizume C, Kuramitsu M, Zhang X, Kurosawa T, Kamata M, Aida Y. Human immunodeficiency virus type 1 Vpr interacts with spliceosomal protein SAP145 to mediate cellular pre-mRNA splicing inhibition. Microbes Infect. (2007) 9:490–7. doi: 10.1016/j.micinf.2007.01.013
26. Kim N, Kukkonen S, Gupta S, Aldovini A. Association of Tat with promoters of PTEN and PP2A subunits is key to transcriptional activation of apoptotic pathways in HIV-infected CD4+ T cells. PLoS Pathog. (2010) 6:e1001103. doi: 10.1371/journal.ppat.1001103
27. Vitallé J, Terrén I, Orrantia A, Pérez-Garay R, Vidal F, Iribarren JA, et al. CD300a inhibits CD16-mediated NK cell effector functions in HIV-1-infected patients. Cell Mol Immunol. (2019) 16:940–2. doi: 10.1038/s41423-019-0275-4
28. Vitallé J, Terrén I, Gamboa-Urquijo L, Orrantia A, Tarancón-Díez L, Genebat M, et al. Altered expression of CD300a inhibitory receptor on CD4+ T cells from human immunodeficiency virus-1-infected patients: association with disease progression markers. Front Immunol. (2018) 9:1709. doi: 10.3389/fimmu.2018.01709
29. Kim DY, Kwon E, Hartley PD, Crosby DC, Mann S, Krogan NJ, et al. CBF beta stabilizes HIV Vif to counteract APOBEC3 at the expense of RUNX1 target gene expression. Mol Cell. (2013) 49:632–44. doi: 10.1016/j.molcel.2012.12.012
30. Mousnier A, Kubat N, Massias-Simon A, Ségéral E, Rain J-C, Benarous R, et al. von Hippel Lindau binding protein 1-mediated degradation of integrase affects HIV-1 gene expression at a postintegration step. Proc Natl Acad Sci USA. (2007) 104:13615–20. doi: 10.1073/pnas.0705162104
31. Mueller N, van Bel N, Berkhout B, Das AT. HIV-1 splicing at the major splice donor site is restricted by RNA structure. Virology. (2014) 468–470:609–20. doi: 10.1016/j.virol.2014.09.018
32. Figiel M, Krepl M, Park S, Poznański J, Skowronek K, Gołab A, et al. Mechanism of polypurine tract primer generation by HIV-1 reverse transcriptase. J Biol Chem. (2018) 293:191–202. doi: 10.1074/jbc.M117.798256
33. Kobayashi Y, Zhuang J, Peltz S, Dougherty J. Identification of a cellular factor that modulates HIV-1 programmed ribosomal frameshifting. J Biol Chem. (2010) 285:19776–84. doi: 10.1074/jbc.M109.085621
34. Ringeard M, Marchand V, Decroly E, Motorin Y, Bennasser Y. FTSJ3 is an RNA 2′-O-methyltransferase recruited by HIV to avoid innate immune sensing. Nature. (2019) 565:500–4. doi: 10.1038/s41586-018-0841-4
35. Naldini L, Blomer U, Gallay P, Ory D, Mulligan R, Gage FH, et al. In vivo gene delivery and stable transduction of nondividing cells by a lentiviral vector. Science. (1996) 272:263–7. doi: 10.1126/science.272.5259.263
36. Didion JP, Martin M, Collins FS. Atropos: specific, sensitive, and speedy trimming of sequencing reads. PeerJ. (2017) 5:e3720. doi: 10.7717/peerj.3720
37. Kim D, Langmead B, Salzberg SL. HISAT: a fast spliced aligner with low memory requirements. Nat Methods. (2015) 12:357–60. doi: 10.1038/nmeth.3317
38. Li H, Handsaker B, Wysoker A, Fennell T, Ruan J, Homer N, et al. The sequence alignment/map format and SAM tools. Bioinformatics. (2009) 25:2078–9. doi: 10.1093/bioinformatics/btp352
39. Okonechnikov K, Conesa A, García-Alcalde F. Qualimap 2: advanced multi-sample quality control for high-throughput sequencing data. Bioinformatics. (2016) 32:292–4. doi: 10.1093/bioinformatics/btv566
40. Ewels P, Magnusson M, Lundin S, Käller M. MultiQC: summarize analysis results for multiple tools and samples in a single report. Bioinformatics. (2016) 32:3047–8. doi: 10.1093/bioinformatics/btw354
41. Patro R, Duggal G, Love MI, Irizarry RA, Kingsford C. Salmon provides fast and bias-aware quantification of transcript expression. Nat Methods. (2017) 14:417–9. doi: 10.1038/nmeth.4197
42. Zhang Y, Liu T, Meyer CA, Eeckhoute J, Johnson DS, Bernstein BE, et al. Model-based Analysis of ChIP-Seq (MACS). Genome Biol. (2008) 9:R137. doi: 10.1186/gb-2008-9-9-r137
43. Martin M. Cutadapt removes adapter sequences from high-throughput sequencing reads. EMBnet J. (2011) 17:10–12. doi: 10.14806/ej.17.1.200
44. Shen W, Le S, Li Y, Hu F. SeqKit: a cross-platform and ultrafast toolkit for FASTA/Q file manipulation. PLoS ONE. (2016) 11:e0163962. doi: 10.1371/journal.pone.0163962
45. Tarasov A, Vilella AJ, Cuppen E, Nijman IJ, Prins P. Sambamba: fast processing of NGS alignment formats. Bioinformatics. (2015) 31:2032–4. doi: 10.1093/bioinformatics/btv098
46. Liao Y, Smyth GK, Shi W. Feature counts: an efficient general purpose program for assigning sequence reads to genomic features. Bioinformatics. (2013) 30:923–30. doi: 10.1093/bioinformatics/btt656
47. Soneson C, Love MI, Robinson MD. Differential analyses for RNA-seq: transcript-level estimates improve gene-level inferences. F1000Res. (2015) 4:1521. doi: 10.12688/f1000research.7563.2
48. Tarazona S, Furió-Tarí P, Turrà D, Pietro AD, Nueda MJ, Ferrer A, et al. Data quality aware analysis of differential expression in RNA-seq with NOISeq R/Bioc package. Nucleic Acids Res. (2015) 43:e140. doi: 10.1093/nar/gkv711
49. Love MI, Huber W, Anders S. Moderated estimation of fold change and dispersion for RNA-seq data with DESeq2. Genome Biol. (2014) 15:550. doi: 10.1186/s13059-014-0550-8
50. Ross-Innes CS, Stark R, Teschendorff AE, Holmes KA, Ali HR, Dunning MJ, et al. Differential oestrogen receptor binding is associated with clinical outcome in breast cancer. Nature. (2012) 481:389–93. doi: 10.1038/nature10730
51. Zhu LJ, Gazin C, Lawson ND, Pagès H, Lin SM, Lapointe DS, et al. ChIPpeakAnno: a Bioconductor package to annotate ChIP-seq and ChIP-chip data. BMC Bioinformatics. (2010) 11:237. doi: 10.1186/1471-2105-11-237
52. Robinson MD, McCarthy DJ, Smyth GK. edgeR: a Bioconductor package for differential expression analysis of digital gene expression data. Bioinformatics. (2010) 26:139–40. doi: 10.1093/bioinformatics/btp616
53. BJMT. Universalmotif: Import, Modify, Export Motifs with R. R Package Version 1.0.22. (2019). Available online at: https://github.com/bjmt/universalmotif
54. Bailey TL. DREME: motif discovery in transcription factor ChIP-seq data. Bioinformatics. (2011) 27:1653–9. doi: 10.1093/bioinformatics/btr261
Keywords: human immunodeficiency virus, epitranscriptome, m6A, m5C, virus-host interaction, differential methylation
Citation: Cristinelli S, Angelino P, Janowczyk A, Delorenzi M and Ciuffi A (2021) HIV Modifies the m6A and m5C Epitranscriptomic Landscape of the Host Cell. Front. Virol. 1:714475. doi: 10.3389/fviro.2021.714475
Received: 25 May 2021; Accepted: 18 June 2021;
Published: 21 July 2021.
Edited by:
Alessandro Marcello, International Centre for Genetic Engineering and Biotechnology, ItalyReviewed by:
Anna Kula, Jagiellonian University, PolandOlivier Rohr, Université de Strasbourg, France
Copyright © 2021 Cristinelli, Angelino, Janowczyk, Delorenzi and Ciuffi. This is an open-access article distributed under the terms of the Creative Commons Attribution License (CC BY). The use, distribution or reproduction in other forums is permitted, provided the original author(s) and the copyright owner(s) are credited and that the original publication in this journal is cited, in accordance with accepted academic practice. No use, distribution or reproduction is permitted which does not comply with these terms.
*Correspondence: Angela Ciuffi, YW5nZWxhLmNpdWZmaUBjaHV2LmNo
†These authors have contributed equally to this work