 M. I. Petersen
 G. Suarez Archilla
 M. M. Miretti
 K. G. Trono
 H. A. Carignano
94% of researchers rate our articles as excellent or good
Learn more about the work of our research integrity team to safeguard the quality of each article we publish.
Find out more
ORIGINAL RESEARCH article
Front. Vet. Sci., 02 April 2025
Sec. Veterinary Infectious Diseases
Volume 12 - 2025 | https://doi.org/10.3389/fvets.2025.1550646
Bovine leukemia virus (BLV) is a retrovirus that infects cattle, causing bovine enzootic leukosis, a chronic disease characterized by the proliferation of infected B cells. BLV proviral load (PVL) is a key determinant of disease progression and transmission risk. Cattle can exhibit distinct phenotypes of low PVL (LPVL) or high PVL (HPVL), which remain stable throughout their lifetime. Differential expression analysis revealed 1,908 differentially expressed genes (DEGs) between HPVL and LPVL animals, including 774 downregulated (DReg) and 1,134 upregulated (UReg) genes. Functional enrichment analysis revealed that DReg genes were associated primarily with immune response pathways. Conversely, the UReg genes were enriched in processes related to cell cycle regulation, mitotic division, and DNA biosynthesis. Protein–protein interaction analysis revealed six highly interconnected clusters. Interestingly, a cluster was enriched for sphingolipid metabolism, a process critical to enveloped virus infection and immune receptor signaling. These findings provide valuable insights into the molecular mechanisms of BLV infection, suggesting potential markers for disease monitoring and targets for therapeutic intervention.
Bovine leukemia virus (BLV) is a retrovirus that naturally infects cattle, causing a chronic disease known as bovine enzootic leukosis (1). BLV primarily infects mature B cells (2), although other blood cells can also be affected (3, 4).
After infection, the viral RNA is retrotranscribed and integrated randomly into the host cell genome as a provirus. An increase in the blood proviral load (PVL) is correlated with disease progression (3, 5–7) and the risk of BLV transmission to a healthy herd mate (8, 9).
In dairy cattle populations, two distinct groups of animals can be distinguished: low PVL (LPVL) and high PVL (HPVL) and, generally, the PVL level remains stable throughout an individual cow’s lifetime (8, 10, 11).
Several strategies have been proposed for controlling BLV dissemination, including the use of BLV attenuated vaccines (12) and culling HPVL cows from herds (13). Alternatively, genetic polymorphisms in the major histocompatibility complex class II BoLA-DRB3 gene have been suggested as markers for selecting and breeding LPVL cows (14–19). However, the genetic basis of disease resistance/susceptibility is complex and polygenic, influenced by multiple loci with small effects on the phenotype (20–24).
Genomic association studies have revealed that single-nucleotide polymorphisms (SNPs) linked to BLV PVL variation in infected cattle are distributed across the entire bovine genome (21, 25). In a previous work, we evaluated the expression of candidate genes located within regions harboring associated SNPs in HPVL and LPVL cows. Our results revealed differential expression of the ABT1 transcription factor and a significant correlation between lymphocyte count and PRRC2A and IER3 gene expression. These genes had not previously been associated with BLV infection phenotypes (26).
Few investigations assessed the global gene expression response to BLV (27), and compared naturally BLV-infected vs. non-infected animals (20, 28, 29). Depending on the BLV phenotype evaluated and/or the route of infection considered, differentially expressed genes have been found to be related to DNA mismatch repair, cell cycle and growth factors (27–29), as well as innate and adaptive immunity, including complement system activation (20). Nishimori et al. (29) compared healthy animals, BLV-infected animals, and BLV-infected animals with lymphoma and identified host gene expression correlated with the BLV proviral load, potential markers for monitoring disease progression.
However, the mechanisms underlying BLV PVL development and progression in cattle remain poorly understood. In the present study, we assessed the whole-transcriptome response of BLV-infected cows exhibiting contrasting PVL levels to identify the host genes and metabolic pathways involved. Differential expression analysis allowed us to identify a group of significantly differentially expressed genes (DEGs) when comparing HPVL and LPVL cows. These DEGs were functionally annotated into biological categories, providing insight into the underlying mechanisms of BLV infection.
BLV-infected cows were selected from previously phenotyped animals (26). Briefly, 129 adult Holstein cows from the Argentinian main dairy farm region (31°16′S, 61°29′W) were sampled. Animals, which shared the same lactation period were screened via anti-BLV ELISA (see below) twice, at −10 mo (T1) and − 5 mo (T2) from the final sampling time; the mean percentage of reactivity (PR) was 122.7 ± 34.8 and 146.3 ± 55.6, respectively. Since antibody levels have been reported to reflect proviral load (PVL) in vivo (30, 31), individuals from the lowest (Q1) and highest (Q4) PR quartiles at both time points were selected (n = 15) (Q1: T1 = 25.0–102.8%, T2 = 25.0–118.2%; Q4: T1 = 148.6–178.6%, T2 = 194.4–239.6%). These animals underwent PVL quantification via qPCR (see below) at −3 mo (T3) and 0 mo (T4). Finally, 6 cows with consistent (T3 and T4) high-PVL (HPVL) and 6 with low-PVL (LPVL) were selected.
Cow fresh blood samples (45 mL) were obtained via jugular venipuncture and supplemented with EDTA (225 μM). Peripheral blood mononuclear cells (PBMCs) were isolated via Ficoll–Paque Plus (GE Healthcare, Uppsala, Sweden) density gradient centrifugation (following the manufacturer’s protocol) and resuspended in RNAlater® (Ambion, Austin, TX, United States). Sample collection and PBMC isolation were performed on the same working day to prevent any RNA degradation. The samples were stored at −80°C until use.
The animal handling and sampling procedures followed the manual’s recommendations of the Animal Care and Use Committee of the National Institute of Agricultural Technology (INTA, Buenos Aires, Argentina).
An indirect ELISA against the whole BLV viral particle-lysed antigen was used following a previously described protocol (32). A weak positive international control standard serum was utilized as a reference to calculate a normalized sample-to-positive ratio. The difference between the optical density values obtained for the weak positive control and negative BLV control samples was set as 100% reactivity. All the tested samples were referred to it. Samples with PRs above the cutoff level (>25%) were considered positive. A hematologic analyzer (Sysmex XN-1000, Sysmex Co., Kobe, Japan) was used for absolute leukocyte count.
Genomic DNA (gDNA) was isolated from PBMCs via a High Pure PCR Template Preparation Kit (Roche, Penzberg, Germany). The concentration (ng/μL) and quality (A260/280 and A260/230) of the gDNA were measured via a spectrophotometer (Nanodrop, Thermo Fisher Scientific, Waltham, MA).
To quantify the BLV PVL, validated SYBR Green dye-based qPCR targeting the BLV Pol gene was used (33). Briefly, each qPCR mixture (final volume = 25 μL) contained Fast Start Universal SYBR Green Master Mix (Roche), forward and reverse primers (800 nM; BLVpol_5f: 5′-CCTCAATTCCCTTTAAACTA-3′; BLVpol_3r: 5′-GTACCGGGAAGACTGGATTA-3′; Thermo Fisher Scientific), and 200 ng of gDNA template. The amplification and detection reactions were performed via a Step One Plus device (Applied Biosystems, Foster City, CA). The thermocycler profile included predenaturation for 2 min at 50°C, then denaturation for 10 min at 95°C, followed by 40 cycles of 15 s at 95°C, 15 s at 55°C, and a final extension of 60 s at 60°C. The specificity of each BLV-positive reaction was confirmed through melting temperature dissociation curve (Tm) analysis. Samples with PVL values <1,500 copies/μg of total DNA were considered LPVL; otherwise, they were considered HPVL (26).
Total RNA was extracted from PBMCs stored in RNAlater® with a High Pure RNA Isolation Kit (Roche) via a modified protocol. The DNase treatment step was set to 20 min at 37°C. The RNA concentration and integrity were evaluated using a 2,100 Bioanalyzer chip (Agilent Technologies, Santa Clara, CA, United States) (Supplementary Figure S1). RNA samples with a RIN value ≥8 were used to prepare sequencing libraries with the TruSeq Stranded mRNA Kit (Illumina, San Diego, CA, United States) following the manufacturer’s protocol.
Samples from four animals per phenotypic group were sequenced (HPVL: A1, A2, A6 and A7; LPVL: B2, B5, B6, and B7). Equal molar concentration sequencing libraries were pooled and set in 4 sequencing lanes of a NextSeq500 equipment (Illumina) run to avoid possible batch effects (34). A total of 354.4 M reads (1 × 75 bp) were obtained.
Demultiplexed Fastq files for each sample were visually inspected with FastQC (35). Quality control (QC) and adapter trimming were performed with TrimGalore v0.6.4 (36) using a q score > 20. Reads with lengths <20 bp were discarded. QC-passed reads were mapped to the bovine reference genome ARS-UCD1.2 v100 (37) using HISAT2 v2.2.0 (38). The mapped read statistics were evaluated with RSeQC v4.0.0 (39) (Supplementary Table S1).
Genomic features (genes) were quantified via HTSeq-count v0.12.4 (40) in the “union” mode, which counts only uniquely mapped reads and discards those overlapping with two or more genes. This process yielded a raw count expression matrix for each sample and annotated gene (8 × 27,607). The expression matrix was subsequently analyzed using the edgeR package (41, 42) within the Bioconductor project v3.13 (43). All the analyses were conducted in the R environment.
The relationships between the gene expression profiles of the HPLV and LPVL samples were visualized using a multi-dimensional scaling plot. The leading 500 gene log2-fold changes (root-mean-square average) between each pair of samples were used as distances.
Differentially expressed genes (DEGs) between the HPVL and LPVL groups were tested via an exact test based on the quantile-adjusted conditional maximum likelihood (qCML) implemented in edgeR (44). Multiple comparisons correction of the p values was performed by the Benjamini-Hochberg false discovery rate (BH-FDR) method (45). BH-FDR adjusted p values (q-value) < 0.05 were considered statistically significant.
Functional inference of each expressed gene were made using PANTHER database (db) v17.01 (46, 47) and STRING db2 (48, 49). The PANTHER ontological classification system provides functional categories integrating experimental evidence, functional and evolutionary information on protein family phylogenetic trees (47, 50), and the Protein Class (PC) and abbreviated Gene Ontology (GO-Slim) terms were used. In addition, the Kyoto Encyclopedia of Genes and Genomes (KEGG) metabolic pathways3 (51) were retrieved using STRING db.
Enrichment analysis of GO/PC PANTHER/KEGG metabolic pathway terms was performed on the list of 13,382 expressed genes (EGs) obtained after filtering out genes whose expression was low. These genes were ranked by their logFC values between the HPVL and LPVL groups. The Mann–Whitney rank-sum test (U test) was used to indicate functional categories that are more overrepresented at the top or bottom (up- or down-regulated genes) of the ranked list than expected by chance. Enrichment test p-values were adjusted for multiple testing with the BH-FDR method, and q-values <0.05 were considered statistically significant.
A protein–protein interaction (PPI) network of DEGs was constructed via STRING db, which compiles curated known and predicted protein–protein interactions from several sources, i.e., experimental evidence, computational prediction, scientific literature, coexpression, other (primary) databases, etc. The resulting network was visualized in Cytoscape v3.9.0 (52). Clusters of highly interconnected proteins were identified using the molecular complex detection algorithm implemented in MCODE v2.0 with default parameters (53). An overrepresentation analysis of GO terms and KEGG metabolic pathways was applied to clusters via Fisher’s exact test on the basis of the hypergeometric distribution (54).
A total of 5 statistically significant (FC >1.5) DEGs (BLNK, PIK3CA, BoLA-DQB, CD8A and CD4) were selected for RT–qPCR validation. The assay was conducted following the recommendations proposed by the minimum information for publication of quantitative real-time PCR experiments following the minimum recommendations (MIQE) guidelines (55). The primers (Supplementary Table S2) were designed using the Primer-BLAST tool (56). Homo and heterodimers, GC content, Tm, and potential secondary structures for each primer pair were evaluated using OligoAnalyzer software v3.1 (57).
RNAs (300 ng) extracted from 5 HPVL and 5 LPVL [Supplementary Table S3, (26)] were treated with the DNase RQ1 (Promega, US). Then, the MultiScribe High-Capacity cDNA Reverse Transcription Kit (Applied Biosystems, US) was used for cDNA synthesis, according to the manufacturer’s instructions.
RT–qPCR was performed with a 1:10 dilution of cDNA using the SsoAdvanced Universal SYBR Green Supermix (Bio-Rad, US) in a final reaction volume of 10 μL, containing 300 nM of each specific primer (forward or reverse) and 3 μL of cDNA. Runs were performed with StepOne Plus equipment (Applied Biosystems, US) following standard cycling conditions: (1) 95°C for 30 s and (2) 40 cycles of 95°C for 15 s and 60°C for 1 min. Reaction specificities were confirmed by inspection of the Tm dissociation curve. Technical duplicates were assayed for all RT–qPCRs. For each gene, non-RT RNAs and no template controls were incorporated. The reaction efficiencies were calculated using the LinRegPCR software (58). Relative expression values were normalized against two bovine reference genes, RPLP0 and B2M (59). Differential expression analysis was performed via REST software (60). This returns a relative expression value (R): an R > 1 indicates higher gene expression in the HPVL phenotype than in the LPVL phenotype, whereas an R < 1 indicates lower expression.
An average mapping rate exceeding 97% was achieved, with more than 85% of the reads uniquely mapped to the bovine reference genome. Additionally, approximately 69% of the reads aligned to exonic regions.
Unsupervised clustering revealed that sample A2 had a distinct expression profile from that of the HPVL group (Supplementary Figure S2). Removing A2 improved the clustering of LPVL and HPVL samples, so we excluded it from downstream analysis.
The differential expression analysis between HPVL (n = 3) and LPVL (n = 4) was performed on expressed genes (EGs) identified 2,216 differentially expressed genes (DEGs) (q < 0.05) out of 13,382 genes evaluated. Among these, 86.1% (1,908) showed moderate changes (FC ≥ |1.5|), 37.4% (829) of DEGs exhibited high fold change values (FC ≥ |2|), and 0.85% (19) showed differences exceeding a FC >10 (Supplementary Table S4). From those 1,908 genes with fold changes (FCs) ≥ |1.5|, 774 were downregulated (DReg) and 1,134 upregulated (UReg) genes (Figure 1, Supplementary Table S4).
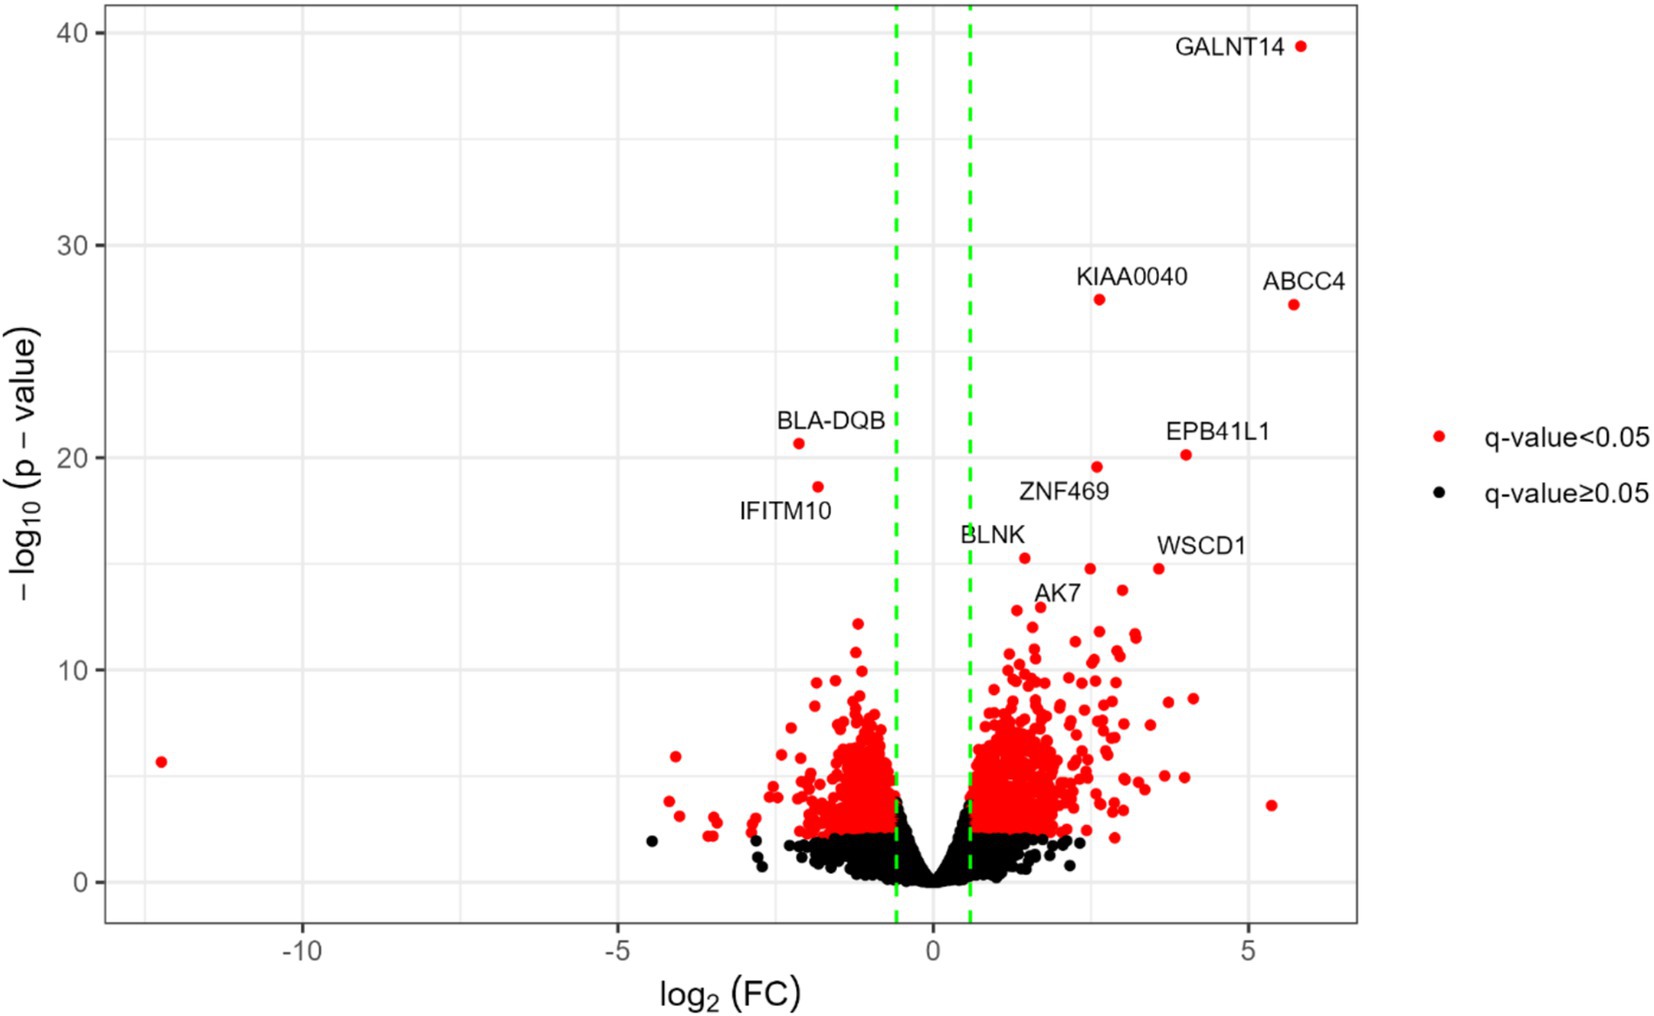
Figure 1. Main differentially expressed genes in HPVL vs. LPVL transcriptomes. The vertical dotted green lines correspond to the log2 (FC) values of −1.5 and 1.5. The red dots denote DEGs and the black dots those statistically non-significant and/or with FC lower than the absolute value of 1.5 (|1.5|). Gene symbols indicate the 10 genes with the lowest q-values.
We then selected five genes showing a FC >1,5 and experimentally validated the differential expression in LPVL and HPVL cows via RT–qPCR. Four of these genes presented significant expression differences consistent with RNA-seq results (Figure 2), whereas CD4 displayed a non-significant trend toward lower expression in HPVL animals.
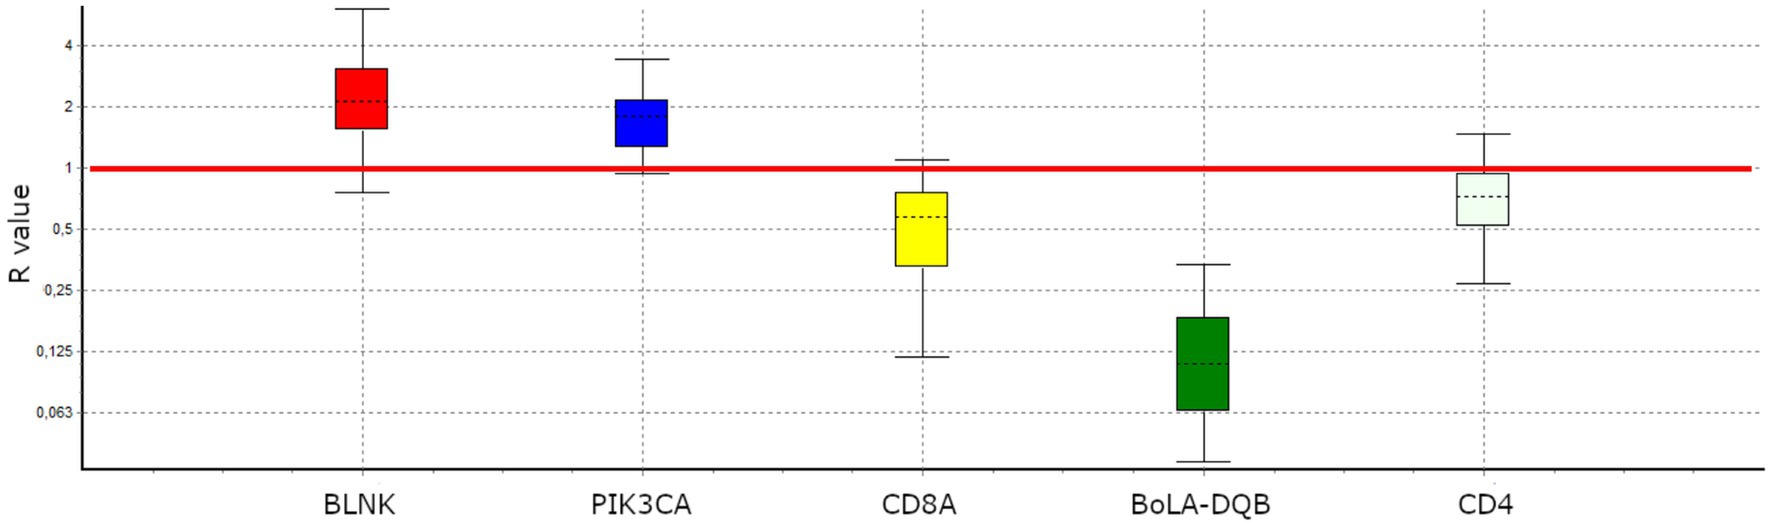
Figure 2. Experimental validation of differential gene expression by RT-qPCR expression ratio (R) for selected genes. The R were normalized against the geometric mean of the reference genes. BLNK (R = 2.192, p-value = 0.019) and PIK3CA (R = 1.728, p-value = 0.018) were UReg; conversely, BoLA-DQB (R = 0.492, p-value = 0.021) and CD8A (R = 0.108, p-value = 0.006) were DReg. CD4 (R = 0.7, p-value = 0.127) showed a tendency to DReg.
To gain functional insights into the phenotypes studied, we conducted gene enrichment analysis using the list of EGs ranked by logFC. The PANTHER and STRING databases were used to annotate Gene Ontology (GO) terms, Protein Class (PC) categories, and KEGG metabolic pathways, identifying enriched functional categories among upregulated (UReg) and downregulated (DReg) genes (Supplementary Table S5). Several functional terms enriched in UReg genes were associated with cell division processes. The Biological Process (BP) GO-slim categories included “Mitotic cell cycle phase transition” (GO:0044772), “Protein localization to kinetochore” (GO:0034501), “DNA biosynthetic process” (GO:0071897), “Mitotic spindle assembly” (GO:0090307), and others (Supplementary Table S5). Additionally, Protein Class (PC) terms enriched in UReg genes included “chromatin/chromatin-binding or -regulatory protein” (PC00077) and “Kinase activator” (PC00138), whereas KEGG pathway enrichment highlighted the “Cell cycle” (bta04110).
In contrast, most functional terms enriched in DReg genes were associated with immune responses, encompassing BP terms such as “Inflammatory response” (GO:0006954), “Response to interleukin-1” (GO:0070555), “Antigen processing and presentation” (GO:0019882), “T-cell-mediated immunity” (GO:0002456), and “Positive regulation of adaptive immune response” (GO:0002821). The significant KEGG pathways associated with the DReg genes included “Th1 and Th2 cell differentiation” (bta04658), “natural killer cell-mediated cytotoxicity” (bta04650), and “cytokine–cytokine receptor interaction” (bta04060). The enriched PC terms in the DReg genes were “Major histocompatibility complex proteins” (PC00149) and “Immunoglobulin receptor superfamily” (PC00124), both of which are key players in immune responses. Figures 3A,B show significant DEGs within the PC00149 and PC00124 terms, respectively.
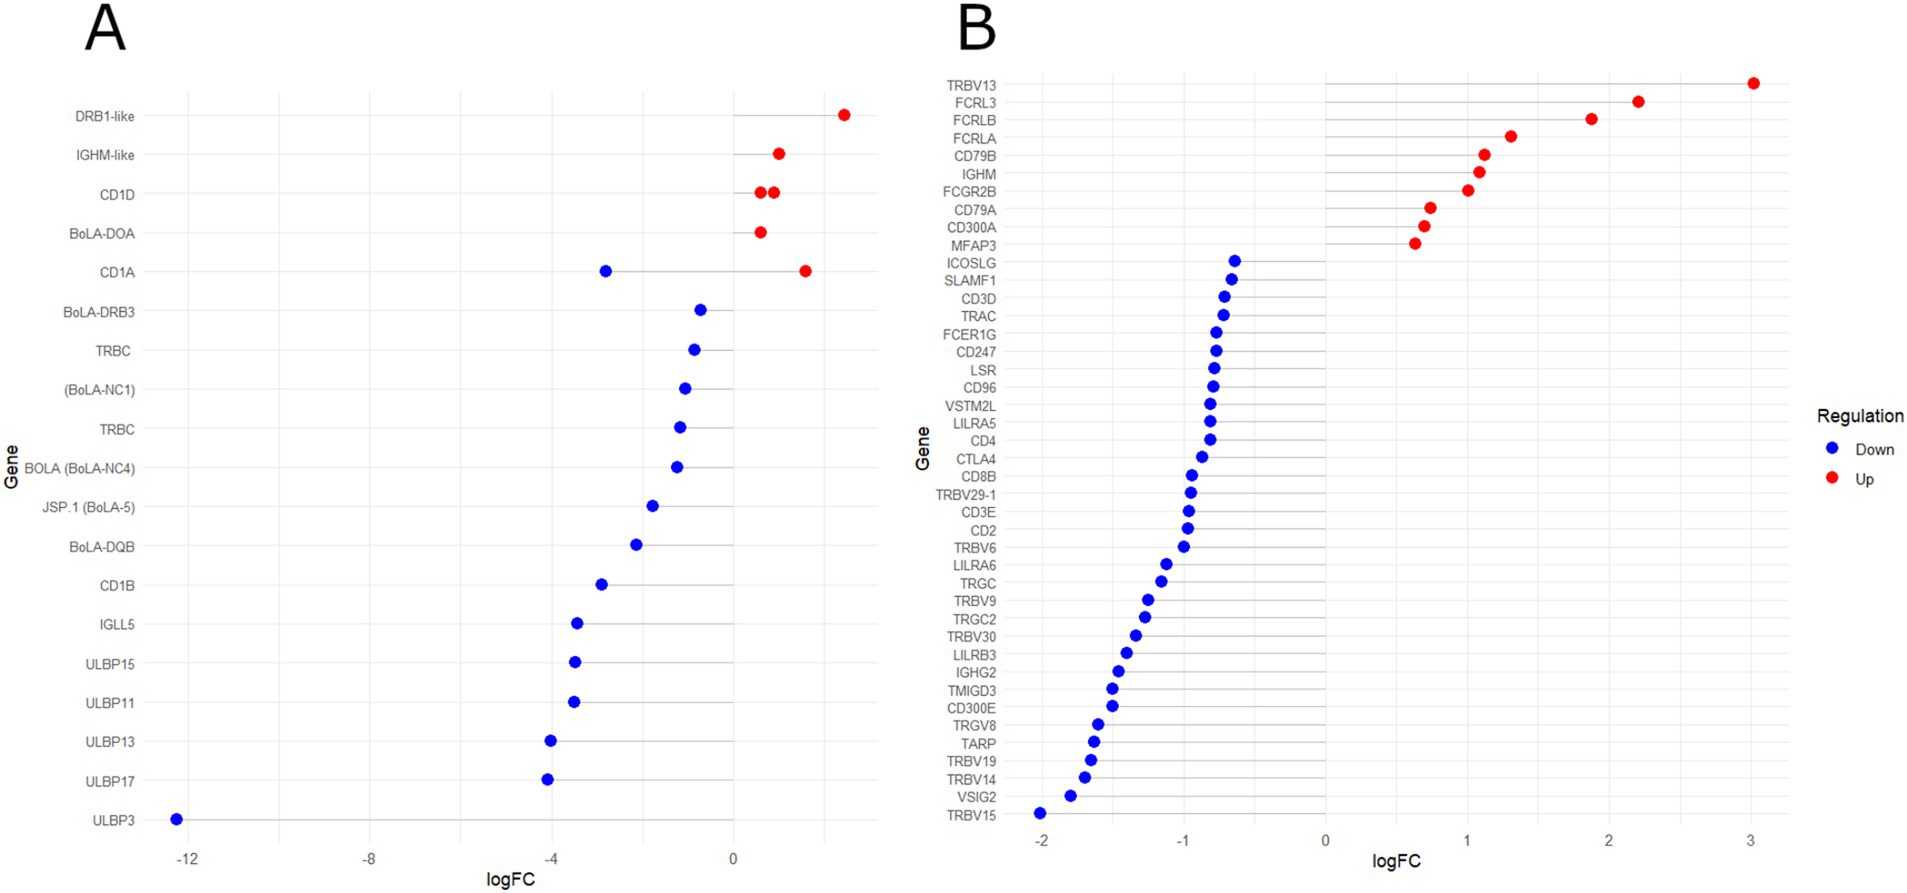
Figure 3. Lollipop chart of differentially expressed genes and their logFC values from two protein class (PC) PANTHER terms: (A) “Major histocompatibility complex (MHC) proteins” (PC00149) and (B) “Immunoglobulin (Ig) receptor superfamily” (PC00124). Red and blue dots indicate upregulated and downregulated genes, respectively, in HPVL animals.
A protein–protein interaction network based on the 1908 DEGs (FC ≥ |1.5|) consisted of 1732 nodes (proteins) and 10,621 edges (interactions), forming a primary network (interaction score ≥ 0.4) with additional smaller subnetworks and isolated nodes (Supplementary Figure S3). We selected the largest network to identify clusters of highly interconnected proteins, potentially representing protein complexes related to specific metabolic pathways. Six clusters were identified (Figure 4). Cluster A predominantly contained UReg genes, whereas clusters C, D, and E presented distinct subclusters of UReg (dotted circles) and DReg genes. Each cluster was analyzed for overrepresented GO, BP, and KEGG terms using the STRING database to interpret their biological functions (Supplementary Table S6). Clusters enriched with UReg genes were associated with cell cycle regulation, mitotic division, and DNA repair, whereas clusters enriched with DReg genes were enriched in immunological processes, specifically innate and adaptive immunity. The functional terms and pathways enriched in the UReg and DReg genes were consistent across the enrichment analysis and cluster-based tests, validating the results through different analytical approaches. Notably, Cluster B (Figure 4) was enriched in terms related to sphingolipid metabolism.

Figure 4. Clusters analysis of the protein–protein interaction (PPI) networks. The nodes represent proteins, and the edges (connecting lines) denote various types of interactions as suggested in the STRING db. Node colors are determined by the expression values (logFC); the blue scale represents DReg genes, while the red scale represents UReg genes. Clusters (C–E) consisted of two distinct sub-clusters, comprising UReg (dotted line circle) and DReg genes.
To identify bovine genes and biological pathways underlying contrasting levels of BLV infection, we conducted whole-transcriptome analyses on PBMCs (peripheral blood mononuclear cells) obtained from BLV-infected Argentinian Holstein cows showing low and high BLV proviral load (LPVL and HPVL, respectively).
Differential expression analysis (HPVL vs. LPVL) revealed 2,216 differentially expressed genes (DEGs) (q < 0.05) among the 13,382 genes evaluated. Among these DEGs, only 37.4% (829) presented high fold change values (FC ≥ |2|), whereas 86.1% (1,908) presented moderate changes (FC ≥ |1.5|). These findings agreed with previous reports of modest gene expression changes in blood cells in response to BLV infection (20).
Among the top 10 DEGs with the lowest q-values (Figure 1), eight were classified as UReg (upregulated), while two were categorized as DReg (downregulated). Notably, seven UReg genes (GALNT14, KIAA0040, EPB41L1, ZNF469, BLNK, AK7, and WSCD1) are associated with the progression of various cancers in humans (61–67). Conversely, two DReg genes, BoLA-DQB and IFITM10, are associated with immune processes. The BoLA-DQB gene encodes the β chain of the DQ molecule, which is essential for CD4+ T-cell activation and, hence, on the modulation of the adaptive cellular and humoral response (68). IFITM10, a member of the interferon-induced transmembrane protein family, has been implicated in the inhibition of viral infections in humans, including HIV-1, Influenza, and SARS-CoV-1 (69).
The functional annotation revealed that immune-related categories, such as “antigen processing and presentation,” “positive regulation of adaptive immune response,” and “T-cell-mediated immunity,” predominantly included DReg genes (Supplementary Table S5). A significant proportion of these immune-related genes were associated with the PANTHER term “Major histocompatibility complex (MHC) proteins” (PC00149). Figure 3A highlights the DEGs (q < 0.05, FC > |1.5|) within this category. Notably, BoLA-DRB3 polymorphisms have been extensively investigated for their association with BLV proviral load (PVL) levels (14–19). Additionally, other class II MHC genes (BoLA-DQB, BoLA-DOA, and DRB1-like pseudogene) were differentially expressed. These genes are expressed primarily in antigen-presenting cells (APCs), such as dendritic cells, mononuclear phagocytes, and B cells, where they play critical roles in regulating T-cell-mediated immune regulation. Variants in DRB3-DQB haplotypes have been associated with susceptibility or resistance to persistent lymphocytosis (PL) in BLV-infected cattle (70–72). Additionally, MHC class I (BoLA-5) and non-classical MHC genes (BoLA-NC1 and NC4) were downregulated in HPVL animals (Figure 3A). MHC class I molecules facilitate the presentation of intracellular viral peptides to CD8+ T cells (73), whereas non-classical MHC genes regulate T-cell responses (74). Dysregulation of CD1 class I-like genes, which present lipid antigens to T cells, was also observed. This finding is consistent with reports of altered CD1 expression in human viral infections (75–78). Moreover, five DEGs encoding UL16-binding proteins (ULBPs), stress-induced molecules critical for NK-cell cytotoxicity, were significantly downregulated (Figure 3A). Downregulation of ULBPs has been linked to viral immune evasion mechanisms (79–81).
Consistently, the PANTHER PC category “Immunoglobulin (Ig) receptor superfamily” (PC00124) was significantly enriched in DReg genes (Figure 3B). This category includes genes encoding T-cell receptors (TCRs) and components of the T-cell activation pathway. In contrast, the functional categories enriched in the UReg genes were predominantly related to the cell cycle, including “Mitotic cell cycle phase transition” (GO:0044772), “DNA biosynthetic process” (GO:0071897), and “assembly of the mitotic spindle” (GO:0090307). The KEGG pathway “Cell cycle” (bta04110) was also enriched in the UReg genes (Supplementary Table S5). Dysregulation of these processes has been linked to oncogenesis, which is consistent with the oncogenic nature of BLV. Furthermore, the BP terms “B-cell activation” and “B-cell receptor signaling pathway” were overrepresented in the UReg genes. Approximately 30% of BLV-infected cows exhibit increased B-cell proliferation (82–85), which has been associated with disrupted cell proliferation and apoptosis (86, 87).
The enrichment of terms such as “zinc-finger transcription factors (C2H2) (PC00248),” “acetyltransferases” (PC00042) and “histone acetylation” (GO:0016573) in UReg genes suggests potential epigenetic regulation. Notably, C2H2 zinc-finger proteins are involved in chromatin remodeling, a mechanism exploited by retroviruses to establish latency (88). This may facilitate BLV immune evasion, promoting the expansion of infected B-cell clones.
Protein–protein interaction (PPI) network analysis (Supplementary Figure S3) revealed clusters of highly interconnected proteins (Figure 4). The functional enrichment of clusters primarily composed of UReg genes revealed associations with cell division, mitotic spindle formation, and DNA repair (Clusters A, C-E; Figure 4; Supplementary Table S6). In contrast, clusters predominantly composed of DReg genes were enriched for immune response pathways, including T-cell metabolism and immune signaling (Clusters C-E, Figure 4, Supplementary Table S6).
Cluster F, composed of both upregulated and downregulated genes in HPVL animals, was overrepresented in categories containing genes involved in cell cycle regulation and adaptive immune responses, respectively. In contrast, cluster B was enriched in terms related to sphingolipid metabolism. Cholesterol and sphingolipids form lipid rafts in the plasma membrane of B cells, which serve as platforms for increasing the concentration of B-cell receptors (BCRs) following antigen (Ag) stimulation (89, 90). Notably, in BLV-infected animals, resistance to BCR translocation to lipid rafts has been observed (91). Additionally, sphingolipid metabolism plays critical roles in lymphocyte circulation and viral processes such as entry, replication, assembly, budding, and release, particularly in enveloped viruses (92, 93).
Overall, our findings suggest two non-mutually exclusive mechanisms contributing to the HPVL phenotype: dysregulation of B-cell proliferation/apoptosis and modulation of T-cell and NK-cell responses. Additionally, the suppression of proviral transcription via inhibitory transcription factors, such as zinc-finger proteins, may facilitate BLV immune evasion. Together, these mechanisms promote the expansion of infected B-cell clones, driving the HPVL phenotype. Given the increased risk of BLV transmission in HPVL cows (9, 94, 95), the segregation or elimination of HPVL animals from farms remains a viable control strategy (13). However, middle/low-PVL animals in transition to an HPVL phenotype are present. In this study, we identified a reduced number of DEGs participating in protein–protein interaction clusters that could be further investigated as early biomarkers of an HPVL phenotype. Our the results are in line with findings previously reported by Nishimori et al. (29) providing additional support. Indeed, five of the seven markers positively correlated with PVL (29) were found to be upregulated in HPVL animals in this work (Supplementary Table S4).
Future transcriptome studies could include BLV-uninfected cows to establish a baseline gene expression profile, enabling a more comprehensive understanding of the transcriptional changes induced by BLV infection. Additionally, single-cell RNA-seq studies could uncover immune cell heterogeneity in the peripheral blood of BLV-infected cattle, identifying specific subsets of B and/or T cells that may play a protective role against BLV proliferation in LPVL animals. This could offer valuable insights into the mechanisms underlying BLV disease progression and immune response regulation.
The differential expression analysis conducted in this study identified a group of significantly differentially expressed genes (DEGs) when comparing animals with the HPVL and LPVL phenotypes in naturally infected cattle under productive conditions. The downregulated (DReg) genes were associated primarily with functions related to the cellular immune response, whereas the upregulated (UReg) genes were linked predominantly to the dysregulation of cell proliferation and the silencing of viral gene transcription. These mechanisms may enable the BLV to increase provirus copy numbers and evade the host’s immune response. This study enhances our understanding of the pathways involved in BLV infection and provides valuable insights that could contribute to the identification of infection markers, therapeutic targets, and information useful for BLV dissemination control programs within herds.
The datasets presented in this study can be found in online repositories. The names of the repository/repositories and accession number(s) can be found below: https://www.ncbi.nlm.nih.gov/geo/, GSE282244.
Ethical approval was not required for the study involving animals in accordance with the local legislation and institutional requirements because the animal handling and sampling procedures followed the manual’s recommendations of the Animal Care and Use Committee of the National Institute of Agricultural Technology (INTA, Buenos Aires, Argentina).
MP: Conceptualization, Data curation, Formal analysis, Investigation, Methodology, Visualization, Writing – original draft, Writing – review & editing. GS: Investigation, Writing – review & editing. MM: Conceptualization, Funding acquisition, Supervision, Writing – review & editing. KT: Conceptualization, Funding acquisition, Supervision, Writing – review & editing. HC: Conceptualization, Formal analysis, Investigation, Methodology, Supervision, Writing – original draft, Writing – review & editing.
The author(s) declare that financial support was received for the research and/or publication of this article. The present study was partially supported by project Instituto Nacional de Tecnología Agropecuaria (INTA, Hurlingham, Argentina) 2023-PD-I113.
We would like to thank Dr. Andrea Puebla and Pablo Vera from the Genomic Unit (IABIMO INTA-CONICET) for their assistance with library construction and next-generation sequencing. We would also like to thank Dr. Irene Alvarez for allowing us to use laboratory resources for sample processing.
The authors declare that the research was conducted in the absence of any commercial or financial relationships that could be construed as a potential conflict of interest.
The author(s) declare that no Gen AI was used in the creation of this manuscript.
All claims expressed in this article are solely those of the authors and do not necessarily represent those of their affiliated organizations, or those of the publisher, the editors and the reviewers. Any product that may be evaluated in this article, or claim that may be made by its manufacturer, is not guaranteed or endorsed by the publisher.
The Supplementary material for this article can be found online at: https://www.frontiersin.org/articles/10.3389/fvets.2025.1550646/full#supplementary-material
1. Bendixen, HJ. Preventive measures in cattle leukemia: Leukosis Enzootica Bovis*. Ann N Y Acad Sci. (1963) 108:1241–67. doi: 10.1111/j.1749-6632.1963.tb13448.x
2. Meirom, R, Moss, S, and Brenner, J. Bovine leukemia virus-gp51 antigen expression is associated with CD5 and IgM markers on infected lymphocytes. Vet Immunol Immunopathol. (1997) 59:113–9. doi: 10.1016/S0165-2427(97)00056-1
3. Panei, CJ, Takeshima, S, Omori, T, Nunoya, T, Davis, WC, Ishizaki, H, et al. Estimation of bovine leukemia virus (BLV) proviral load harbored by lymphocyte subpopulations in BLV-infected cattle at the subclinical stage of enzootic bovine leucosis using BLV-CoCoMo-qPCR. BMC Vet Res. (2013) 9:95. doi: 10.1186/1746-6148-9-95
5. Jimba, M, Takeshima, S, Matoba, K, Endoh, D, and Aida, Y. BLV-CoCoMo-qPCR: quantitation of bovine leukemia virus proviral load using the CoCoMo algorithm. Retrovirology. (2010) 7:91. doi: 10.1186/1742-4690-7-91
6. Mirsky, ML, Olmstead, CA, Da, Y, and Lewin, HA. The prevalence of proviral bovine leukemia virus in peripheral blood mononuclear cells at two subclinical stages of infection. J Virol. (1996) 70:2178–83. doi: 10.1128/JVI.70.4.2178-2183.1996
7. Sato, H, Watanuki, S, Murakami, H, Sato, R, Ishizaki, H, and Aida, Y. Development of a luminescence syncytium induction assay (LuSIA) for easily detecting and quantitatively measuring bovine leukemia virus infection. Arch Virol. (2018) 163:1519–30. doi: 10.1007/s00705-018-3744-7
8. Gutiérrez, G, Rodríguez, SM, De Brogniez, A, Gillet, N, Golime, R, Burny, A, et al. Vaccination against δ-retroviruses: the bovine leukemia virus paradigm. Viruses. (2014) 6:2416–27. doi: 10.3390/v6062416
9. Juliarena, MA, Barrios, CN, Ceriani, MC, and Esteban, EN. Hot topic: bovine leukemia virus (BLV)-infected cows with low proviral load are not a source of infection for BLV-free cattle. J Dairy Sci. (2016) 99:4586–9. doi: 10.3168/jds.2015-10480
10. Hutchinson, HC, Ruggiero, VJ, Norby, B, Sporer, KRB, and Bartlett, PC. Diagnostic measures of disease progression in cattle following natural infection with bovine leukemia virus. Pathogens. (2021) 10:987. doi: 10.3390/pathogens10080987
11. Merlini, R, Gutiérrez, G, Alvarez, I, Jaworski, JP, Carignano, H, Poli, M, et al. Bovine leukemia virus becomes established in dairy herds before the first lactation. Arch Virol. (2016) 161:3215–7. doi: 10.1007/s00705-016-2973-x
12. Suárez Archilla, G, Gutiérrez, G, Camussone, C, Calvinho, L, Abdala, A, Alvarez, I, et al. A safe and effective vaccine against bovine leukemia virus. Front Immunol. (2022) 13:980514. doi: 10.3389/fimmu.2022.980514
13. Ruggiero, VJ, Norby, B, Benitez, OJ, Hutchinson, H, Sporer, KRB, Droscha, C, et al. Controlling bovine leukemia virus in dairy herds by identifying and removing cows with the highest proviral load and lymphocyte counts. J Dairy Sci. (2019) 102:9165–75. doi: 10.3168/jds.2018-16186
14. Carignano, HA, Beribe, MJ, Caffaro, ME, Amadio, A, Nani, JP, Gutierrez, G, et al. BOLA-DRB3 gene polymorphisms influence bovine leukaemia virus infection levels in Holstein and Holstein × Jersey crossbreed dairy cattle. Anim Genet. (2017) 48:420–30. doi: 10.1111/age.12566
15. Jimba, M, Takeshima, S, Murakami, H, Kohara, J, Kobayashi, N, Matsuhashi, T, et al. BLV-CoCoMo-qPCR: a useful tool for evaluating bovine leukemia virus infection status. BMC Vet Res. (2012) 8:167. doi: 10.1186/1746-6148-8-167
16. Juliarena, MA, Poli, M, Sala, L, Ceriani, C, Gutierrez, S, Dolcini, G, et al. Association of BLV infection profiles with alleles of the BoLA-DRB3.2 gene. Anim Genet. (2008) 39:432–8. doi: 10.1111/j.1365-2052.2008.01750.x
17. Mirsky, ML, Olmstead, C, Da, Y, and Lewin, HA. Reduced bovine leukaemia virus proviral load in genetically resistant cattle. Anim Genet. (1998) 29:245–52. doi: 10.1046/j.1365-2052.1998.00320.x
18. Miyasaka, T, Takeshima, S-N, Jimba, M, Matsumoto, Y, Kobayashi, N, Matsuhashi, T, et al. Identification of bovine leukocyte antigen class II haplotypes associated with variations in bovine leukemia virus proviral load in Japanese black cattle. Tissue Antigens. (2013) 81:72–82. doi: 10.1111/tan.12041
19. Takeshima, S, Ohno, A, and Aida, Y. Bovine leukemia virus proviral load is more strongly associated with bovine major histocompatibility complex class II DRB3 polymorphism than with DQA1 polymorphism in Holstein cow in Japan. Retrovirology. (2019) 16:14. doi: 10.1186/s12977-019-0476-z
20. Brym, P, and Kamiński, S. Microarray analysis of differential gene expression profiles in blood cells of naturally BLV-infected and uninfected Holstein-Friesian cows. Mol Biol Rep. (2017) 44:109–27. doi: 10.1007/s11033-016-4088-6
21. Carignano, HA, Roldan, DL, Beribe, MJ, Raschia, MA, Amadio, A, Nani, JP, et al. Genome-wide scan for commons SNPs affecting bovine leukemia virus infection level in dairy cattle. BMC Genomics. (2018) 19:142. doi: 10.1186/s12864-018-4523-2
22. Minozzi, G, Williams, JL, Stella, A, Strozzi, F, Luini, M, Settles, ML, et al. Meta-analysis of two genome-wide association studies of bovine Paratuberculosis. PLoS One. (2012) 7:e32578. doi: 10.1371/journal.pone.0032578
23. Neibergs, HL, Seabury, CM, Wojtowicz, AJ, Wang, Z, Scraggs, E, Kiser, JN, et al. Susceptibility loci revealed for bovine respiratory disease complex in pre-weaned Holstein calves. BMC Genomics. (2014) 15:1164. doi: 10.1186/1471-2164-15-1164
24. Sahana, G, Guldbrandtsen, B, Thomsen, B, and Lund, MS. Confirmation and fine-mapping of clinical mastitis and somatic cell score QTL in Nordic Holstein cattle. Anim Genet. (2013) 44:620–6. doi: 10.1111/age.12053
25. Takeshima, S, Sasaki, S, Meripet, P, Sugimoto, Y, and Aida, Y. Single nucleotide polymorphisms in the bovine MHC region of Japanese black cattle are associated with bovine leukemia virus proviral load. Retrovirology. (2017) 14:24. doi: 10.1186/s12977-017-0348-3
26. Petersen, MI, Carignano, HA, Suarez Archilla, G, Caffaro, ME, Alvarez, I, Miretti, MM, et al. Expression-based analysis of genes related to single nucleotide polymorphism hits associated with bovine leukemia virus proviral load in Argentinean dairy cattle. J Dairy Sci. (2021) 104:1993–2007. doi: 10.3168/jds.2020-18924
27. Bai, L, Hirose, T, Assi, W, Wada, S, Takeshima, S, and Aida, Y. Bovine leukemia virus infection affects host gene expression associated with DNA mismatch repair. Pathogens. (2020) 9:909. doi: 10.3390/pathogens9110909
28. Ashrafi, F, Nassiri, M, Javadmanesh, A, Rahimi, H, and Rezaee, SA. Epigenetics evaluation of the oncogenic mechanisms of two closely related bovine and human deltaretroviruses: a system biology study. Microb Pathog. (2020) 139:103845. doi: 10.1016/j.micpath.2019.103845
29. Nishimori, A, Andoh, K, Matsuura, Y, Kohara, J, and Hatama, S. Upregulation of host genes during disease progression in bovine leukemia virus infection is independent of overexpression of viral transcriptional regulators in vitro. Arch Virol. (2023) 168:98. doi: 10.1007/s00705-023-05713-w
30. Alvarez, I, Gutiérrez, G, Gammella, M, Martínez, C, Politzki, R, González, C, et al. Evaluation of total white blood cell count as a marker for proviral load of bovine leukemia virus in dairy cattle from herds with a high seroprevalence of antibodies against bovine leukemia virus. Am J Vet Res. (2013) 74:744–9. doi: 10.2460/ajvr.74.5.744
31. Gutierrez, G, Carignano, H, Alvarez, I, Martínez, C, Porta, N, Politzki, R, et al. Bovine leukemia virus p24 antibodies reflect blood proviral load. BMC Vet Res. (2012) 8:187. doi: 10.1186/1746-6148-8-187
32. Trono, KG, Pérez-Filgueira, DM, Duffy, S, Borca, MV, and Carrillo, C. Seroprevalence of bovine leukemia virus in dairy cattle in Argentina: comparison of sensitivity and specificity of different detection methods. Vet Microbiol. (2001) 83:235–48. doi: 10.1016/S0378-1135(01)00420-5
33. Petersen, MI, Alvarez, I, Trono, KG, and Jaworski, JP. Quantification of bovine leukemia virus proviral DNA using a low-cost real-time polymerase chain reaction. J Dairy Sci. (2018) 101:6366–74. doi: 10.3168/jds.2017-14253
34. Li, S, Tighe, SW, Nicolet, CM, Grove, D, Levy, S, Farmerie, W, et al. Multi-platform assessment of transcriptome profiling using RNA-seq in the ABRF next-generation sequencing study. Nat Biotechnol. (2014) 32:915–925. doi: 10.1038/nbt.2972
35. Andrews, S., (2010) FastQC a quality control tool for high throughput sequence data [WWW document]. Avaialable online at: https://www.bioinformatics.babraham.ac.uk/projects/fastqc/ (Accessed October 20, 2024).
36. Krueger, F, James, F, Ewels, P, Afyounian, E, and Schuster-Boeckler, B. FelixKrueger/TrimGalore: v0.6.7 - doi via Zenodo. Zenodo. (2021) 10:5281. doi: 10.5281/zenodo.5127899
37. Rosen, BD, Bickhart, DM, Schnabel, RD, Koren, S, Elsik, CG, Tseng, E, et al. De novo assembly of the cattle reference genome with single-molecule sequencing. GigaScience. (2020) 9:giaa021. doi: 10.1093/gigascience/giaa021
38. Kim, D, Paggi, JM, Park, C, Bennett, C, and Salzberg, SL. Graph-based genome alignment and genotyping with HISAT2 and HISAT-genotype. Nat Biotechnol. (2019) 37:907–15. doi: 10.1038/s41587-019-0201-4
39. Wang, L, Wang, S, and Li, W. RSeQC: quality control of RNA-seq experiments. Bioinformatics. (2012) 28:2184–5. doi: 10.1093/bioinformatics/bts356
40. Anders, S, Pyl, PT, and Huber, W. HTSeq—a Python framework to work with high-throughput sequencing data. Bioinformatics. (2015) 31:166–9. doi: 10.1093/bioinformatics/btu638
41. McCarthy, DJ, Chen, Y, and Smyth, GK. Differential expression analysis of multifactor RNA-Seq experiments with respect to biological variation. Nucleic Acids Res. (2012) 40:4288–97. doi: 10.1093/nar/gks042
42. Robinson, MD, McCarthy, DJ, and Smyth, GK. edgeR: a Bioconductor package for differential expression analysis of digital gene expression data. Bioinformatics. (2010) 26:139–40. doi: 10.1093/bioinformatics/btp616
43. Gentleman, RC, Carey, VJ, Bates, DM, Bolstad, B, Dettling, M, Dudoit, S, et al. Bioconductor: open software development for computational biology and bioinformatics. Genome Biol. (2004) 5:R80. doi: 10.1186/gb-2004-5-10-r80
44. Robinson, MD, and Smyth, GK. Small-sample estimation of negative binomial dispersion, with applications to SAGE data. Biostatistics. (2008) 9:321–32. doi: 10.1093/biostatistics/kxm030
45. Benjamini, Y, and Hochberg, Y. Controlling the false discovery rate: a practical and powerful approach to multiple testing. J R Stat Soc Ser B Methodol. (1995) 57:289–300. doi: 10.1111/j.2517-6161.1995.tb02031.x
46. Mi, H, Ebert, D, Muruganujan, A, Mills, C, Albou, L-P, Mushayamaha, T, et al. PANTHER version 16: a revised family classification, tree-based classification tool, enhancer regions and extensive API. Nucleic Acids Res. (2021) 49:D394–403. doi: 10.1093/nar/gkaa1106
47. Mi, H, Muruganujan, A, Ebert, D, Huang, X, and Thomas, PD. PANTHER version 14: more genomes, a new PANTHER GO-slim and improvements in enrichment analysis tools. Nucleic Acids Res. (2019) 47:D419–26. doi: 10.1093/nar/gky1038
48. Szklarczyk, D, Franceschini, A, Kuhn, M, Simonovic, M, Roth, A, Minguez, P, et al. The STRING database in 2011: functional interaction networks of proteins, globally integrated and scored. Nucleic Acids Res. (2011) 39:D561–8. doi: 10.1093/nar/gkq973
49. Szklarczyk, D, Gable, AL, Nastou, KC, Lyon, D, Kirsch, R, Pyysalo, S, et al. The STRING database in 2021: customizable protein–protein networks, and functional characterization of user-uploaded gene/measurement sets. Nucleic Acids Res. (2021) 49:D605–12. doi: 10.1093/nar/gkaa1074
50. Thomas, PD, Campbell, MJ, Kejariwal, A, Mi, H, Karlak, B, Daverman, R, et al. PANTHER: a library of protein families and subfamilies indexed by function. Genome Res. (2003) 13:2129–41. doi: 10.1101/gr.772403
51. Kanehisa, M, and Goto, S. KEGG: Kyoto encyclopedia of genes and genomes. Nucleic Acids Res. (2000) 28:27–30. doi: 10.1093/nar/28.1.27
52. Shannon, P, Markiel, A, Ozier, O, Baliga, NS, Wang, JT, Ramage, D, et al. Cytoscape: a software environment for integrated models of biomolecular interaction networks. Genome Res. (2003) 13:2498–504. doi: 10.1101/gr.1239303
53. Bader, GD, and Hogue, CW. An automated method for finding molecular complexes in large protein interaction networks. BMC Bioinformatics. (2003) 4:2. doi: 10.1186/1471-2105-4-2
54. Tavazoie, S, Hughes, JD, Campbell, MJ, Cho, RJ, and Church, GM. Systematic determination of genetic network architecture. Nat Genet. (1999) 22:281–5. doi: 10.1038/10343
55. Bustin, SA, Benes, V, Garson, JA, Hellemans, J, Huggett, J, Kubista, M, et al. The MIQE guidelines: minimum information for publication of quantitative real-time PCR experiments. Clin Chem. (2009) 55:611–22. doi: 10.1373/clinchem.2008.112797
56. Ye, J, Coulouris, G, Zaretskaya, I, Cutcutache, I, Rozen, S, and Madden, TL. Primer-BLAST: a tool to design target-specific primers for polymerase chain reaction. BMC Bioinformatics. (2012) 13:134. doi: 10.1186/1471-2105-13-134
57. Owczarzy, R, Tataurov, AV, Wu, Y, Manthey, JA, McQuisten, KA, Almabrazi, HG, et al. IDT SciTools: a suite for analysis and design of nucleic acid oligomers. Nucleic Acids Res. (2008) 36:W163–9. doi: 10.1093/nar/gkn198
58. Ramakers, C, Ruijter, JM, Deprez, RHL, and Moorman, AFM. Assumption-free analysis of quantitative real-time polymerase chain reaction (PCR) data. Neurosci Lett. (2003) 339:62–6. doi: 10.1016/S0304-3940(02)01423-4
59. Brym, P, Ruść, A, and Kamiński, S. Evaluation of reference genes for qRT-PCR gene expression studies in whole blood samples from healthy and leukemia-virus infected cattle. Vet Immunol Immunopathol. (2013) 153:302–7. doi: 10.1016/j.vetimm.2013.03.004
60. Pfaffl, MW, Horgan, GW, and Dempfle, L. Relative expression software tool (REST©) for group-wise comparison and statistical analysis of relative expression results in real-time PCR. Nucleic Acids Res. (2002) 30:e36:36e–336e. doi: 10.1093/nar/30.9.e36
61. Chacon-Barahona, JA, Salladay-Perez, IA, and Lanning, NJ. Lung adenocarcinoma transcriptomic analysis predicts adenylate kinase signatures contributing to tumor progression and negative patient prognosis. Meta. (2021) 11:859. doi: 10.3390/metabo11120859
62. Kurata, M, Onishi, I, Takahara, T, Yamazaki, Y, Ishibashi, S, Goitsuka, R, et al. C/EBPβ induces B-cell acute lymphoblastic leukemia and cooperates with BLNK mutations. Cancer Sci. (2021) 112:4920–30. doi: 10.1111/cas.15164
63. Lin, W-R, and Yeh, C-T. GALNT14: An emerging marker capable of predicting therapeutic outcomes in multiple cancers. Int J Mol Sci. (2020) 21:1491. doi: 10.3390/ijms21041491
64. Peng, W, Wang, HY, Miyahara, Y, Peng, G, and Wang, R-F. Tumor-associated Galectin-3 modulates the function of tumor-reactive T cells. Cancer Res. (2008) 68:7228–36. doi: 10.1158/0008-5472.CAN-08-1245
65. Tang, H, and Zhang, Y. Identification and bioinformatics analysis of overlapping differentially expressed genes in depression, papillary thyroid cancer and uterine fibroids. Exp Ther Med. (2018) 15:4810–6. doi: 10.3892/etm.2018.6023
66. Tuluhong, D, Dunzhu, W, Wang, J, Chen, T, Li, H, Li, Q, et al. Prognostic value of differentially expressed LncRNAs in triple-negative breast Cancer: a systematic review and Meta-analysis. Crit Rev Eukaryot Gene Expr. (2020) 30:447–56. doi: 10.1615/CritRevEukaryotGeneExpr.2020035836
67. Xi, C, Ren, C, Hu, A, Lin, J, Yao, Q, Wang, Y, et al. Defective expression of protein 4.1N is correlated to tumor progression, aggressive behaviors and chemotherapy resistance in epithelial ovarian cancer. Gynecol Oncol. (2013) 131:764–71. doi: 10.1016/j.ygyno.2013.08.015
68. Norimine, J, and Brown, WC. Intrahaplotype and interhaplotype pairing of bovine leukocyte antigen DQA and DQB molecules generate functional DQ molecules important for priming CD4+ T-lymphocyte responses. Immunogenetics. (2005) 57:750–62. doi: 10.1007/s00251-005-0045-6
69. Almén, MS, Bringeland, N, Fredriksson, R, and Schiöth, HB. The Dispanins: a novel gene family of ancient origin that contains 14 human members. PLoS One. (2012) 7:e31961. doi: 10.1371/journal.pone.0031961
70. Fukunaga, K, Yamashita, Y, and Yagisawa, T. Copy number variations in BOLA-DQA2, BOLA-DQB, and BOLA-DQA5 show the genomic architecture and haplotype frequency of major histocompatibility complex class II genes in Holstein cows. HLA. (2020) 96:601–9. doi: 10.1111/tan.14086
71. Miyasaka, T, Takeshima, S-N, Sentsui, H, and Aida, Y. Identification and diversity of bovine major histocompatibility complex class II haplotypes in Japanese black and Holstein cattle in Japan. J Dairy Sci. (2012) 95:420–31. doi: 10.3168/jds.2011-4621
72. Zanotti, M, Poli, G, Ponti, W, Polli, M, Rocchi, M, Bolzani, E, et al. Association of BoLA class II haplotypes with subclinical progression of bovine leukaemia virus infection in Holstein-Friesian cattle. Anim Genet. (1996) 27:337–41.
73. Hewitt, EW. The MHC class I antigen presentation pathway: strategies for viral immune evasion. Immunology. (2003) 110:163–9. doi: 10.1046/j.1365-2567.2003.01738.x
74. Hofstetter, AR, Sullivan, LC, Lukacher, AE, and Brooks, AG. Diverse roles of non-diverse molecules: MHC class Ib molecules in host defense and control of autoimmunity. Curr Opin Immunol. (2011) 23:104–10. doi: 10.1016/j.coi.2010.09.009
75. Chung, BK, Tsai, K, Allan, LL, Zheng, DJ, Nie, JC, Biggs, CM, et al. Innate immune control of EBV-infected B cells by invariant natural killer T cells. Blood. (2013) 122:2600–8. doi: 10.1182/blood-2013-01-480665
76. Riou, R, Bressollette-Bodin, C, Boutoille, D, Gagne, K, Rodallec, A, Lefebvre, M, et al. Severe symptomatic primary human cytomegalovirus infection despite effective innate and adaptive immune responses. J Virol. (2017) 91:245. doi: 10.1128/jvi.02245-16
77. Shinya, E, Shimizu, M, Owaki, A, Paoletti, S, Mori, L, De Libero, G, et al. Hemopoietic cell kinase (Hck) and p21-activated kinase 2 (PAK2) are involved in the down-regulation of CD1a lipid antigen presentation by HIV-1 Nef in dendritic cells. Virology. (2016) 487:285–95. doi: 10.1016/j.virol.2015.10.023
78. Tan, X, Ding, Y, Zhu, P, Dou, R, Liang, Z, Yang, D, et al. Elevated hepatic CD1d levels coincide with invariant NKT cell defects in chronic hepatitis B virus infection. J Immunol. (2018) 200:3530–8. doi: 10.4049/jimmunol.1701801
79. Bauman, Y, Drayman, N, Ben-Nun-Shaul, O, Vitenstein, A, Yamin, R, Ophir, Y, et al. Downregulation of the stress-induced ligand ULBP1 following SV40 infection confers viral evasion from NK cell cytotoxicity. Oncotarget. (2016) 7:15369–81. doi: 10.18632/oncotarget.8085
80. Dunn, C, Chalupny, NJ, Sutherland, CL, Dosch, S, Sivakumar, PV, Johnson, DC, et al. Human cytomegalovirus glycoprotein UL16 causes intracellular sequestration of NKG2D ligands, protecting against natural killer cell cytotoxicity. J Exp Med. (2003) 197:1427–39. doi: 10.1084/jem.20022059
81. Jensen, H, Andresen, L, Nielsen, J, Christensen, JP, and Skov, S. Vesicular stomatitis virus infection promotes immune evasion by preventing NKG2D-ligand surface expression. PLoS One. (2011) 6:e23023. doi: 10.1371/journal.pone.0023023
82. Erskine, RJ, Corl, CM, Gandy, JC, and Sordillo, LM. Effect of infection with bovine leukosis virus on lymphocyte proliferation and apoptosis in dairy cattle. Am J Vet Res. (2011) 72:1059–64. doi: 10.2460/ajvr.72.8.1059
83. Florins, A, Boxus, M, Vandermeers, F, Verlaeten, O, Bouzar, A-B, Defoiche, J, et al. Emphasis on cell turnover in two hosts infected by bovine leukemia virus: a rationale for host susceptibility to disease. Vet Immunol Immunopathol. (2008) 125:1–7. doi: 10.1016/j.vetimm.2008.04.007
84. Sordillo, LM, Hicks, CR, and Pighetti, GM. Altered Interleukin-2 production by lymphocyte populations from bovine leukemia virus-infected cattle. Proc Soc Exp Biol Med. (1994) 207:268–73. doi: 10.3181/00379727-207-43815
85. Van den Broeke, A, Oumouna, M, Beskorwayne, T, Szynal, M, Cleuter, Y, Babiuk, S, et al. Cytotoxic responses to BLV tax oncoprotein do not prevent leukemogenesis in sheep. Leuk Res. (2010) 34:1663–9. doi: 10.1016/j.leukres.2010.06.003
86. Aida, Y, Murakami, H, Takahashi, M, and Takeshima, S-N. Mechanisms of pathogenesis induced by bovine leukemia virus as a model for human T-cell leukemia virus. Front Microbiol. (2013) 4:328. doi: 10.3389/fmicb.2013.00328
87. Frie, MC, and Coussens, PM. Bovine leukemia virus: a major silent threat to proper immune responses in cattle. Vet Immunol Immunopathol. (2015) 163:103–14. doi: 10.1016/j.vetimm.2014.11.014
88. Pluta, A, Jaworski, JP, and Douville, RN. Regulation of expression and latency in BLV and HTLV. Viruses. (2020) 12:1079. doi: 10.3390/v12101079
89. Aman, MJ, and Ravichandran, KS. A requirement for lipid rafts in B cell receptor induced Ca2+ flux. Curr Biol. (2000) 10:393–6. doi: 10.1016/S0960-9822(00)00415-2
90. Petrie, RJ, Schnetkamp, PPM, Patel, KD, Awasthi-Kalia, M, and Deans, JP. Transient translocation of the B cell receptor and Src homology 2 domain-containing inositol phosphatase to lipid rafts: evidence toward a role in calcium Regulation1. J Immunol. (2000) 165:1220–7. doi: 10.4049/jimmunol.165.3.1220
91. Hamilton, VT, Stone, DM, and Cantor, GH. Translocation of the B cell receptor to lipid rafts is inhibited in B cells from BLV-infected, persistent lymphocytosis cattle. Virology. (2003) 315:135–47. doi: 10.1016/S0042-6822(03)00522-1
92. Schneider-Schaulies, S, Schumacher, F, Wigger, D, Schöl, M, Waghmare, T, Schlegel, J, et al. Sphingolipids: effectors and Achilles heals in viral infections? Cells. (2021) 10:2175. doi: 10.3390/cells10092175
93. Yager, EJ, and Konan, KV. Sphingolipids as potential therapeutic targets against enveloped human RNA viruses. Viruses. (2019) 11:912. doi: 10.3390/v11100912
94. Gutiérrez, G, Alvarez, I, Merlini, R, Rondelli, F, and Trono, K. Dynamics of perinatal bovine leukemia virus infection. BMC Vet Res. (2014) 10:82. doi: 10.1186/1746-6148-10-82
Keywords: BLV, proviral load, differential gene expression, RNA-seq, biological pathways analysis
Citation: Petersen MI, Suarez Archilla G, Miretti MM, Trono KG and Carignano HA (2025) Whole-transcriptome analysis of BLV-infected cows reveals downregulation of immune response genes in high proviral loads cows. Front. Vet. Sci. 12:1550646. doi: 10.3389/fvets.2025.1550646
Edited by:
Dirk Werling, Royal Veterinary College (RVC), United KingdomReviewed by:
Saurabh Gupta, GLA University, IndiaCopyright © 2025 Petersen, Suarez Archilla, Miretti, Trono and Carignano. This is an open-access article distributed under the terms of the Creative Commons Attribution License (CC BY). The use, distribution or reproduction in other forums is permitted, provided the original author(s) and the copyright owner(s) are credited and that the original publication in this journal is cited, in accordance with accepted academic practice. No use, distribution or reproduction is permitted which does not comply with these terms.
*Correspondence: H. A. Carignano, Y2FyaWduYW5vLmh1Z29AaW50YS5nb2IuYXI=
Disclaimer: All claims expressed in this article are solely those of the authors and do not necessarily represent those of their affiliated organizations, or those of the publisher, the editors and the reviewers. Any product that may be evaluated in this article or claim that may be made by its manufacturer is not guaranteed or endorsed by the publisher.
Research integrity at Frontiers
Learn more about the work of our research integrity team to safeguard the quality of each article we publish.