 Martina Mosing1,2
 Andreas D. Waldmann3
 Thom C. Gent2Giselle Hosgood4Nadja S. Sieber-Ruckstuhl5
 Matthias Dennler6
 Peter Herrmann7
 Karin Unger1*
- 1Clinical Department for Small Animals and Horses, Clinical Center for Small Animals, University of Veterinary Medicine, Vienna, Austria
- 2Section of Anaesthesiology, Vetsuisse Faculty, University of Zurich, Zurich, Switzerland
- 3Department of Anaesthesiology and Intensive Care Medicine, Rostock University Medical Centre, Rostock, Germany
- 4College of Veterinary Medicine, School of Veterinary and Life Sciences, Murdoch University, Perth, WA, Australia
- 5Clinic for Small Animal Internal Medicine, Vetsuisse Faculty, University of Zurich, Zurich, Switzerland
- 6Clinic for Diagnostic Imaging, Vetsuisse Faculty, University of Zurich, Zurich, Switzerland
- 7Department of Anaesthesiology, University Medical Center, Georg-August-University, Goettingen, Germany
Introduction: Atelectasis is a common occurrence during anesthesia, and positive end-expiratory pressure (PEEP) ventilation and recruitment maneuvers (RM) can be used to mitigate this. However, both techniques may be associated with side effects in healthy lungs, and close monitoring is indicated. This study aimed to evaluate the effects of PEEP and RM in healthy dogs and to compare functional lung monitoring methods by electrical impedance tomography (EIT), volumetric capnography (VCap), and blood gas analysis with the gold-standard anatomical monitoring provided by computed tomography (CT).
Methods and materials: Nine healthy Beagle dogs underwent anesthesia and mechanical ventilation three times. After 35 min using zero end-expiratory pressure (ZEEP), CT images, VCap, EIT measurements, and arterial blood gas samples were taken. Thereafter, either (1) ZEEP was continued, (2) PEEP initiated or (3) an RM was performed followed by PEEP. Ten minutes after changing the ventilation mode all measurements were repeated. Only one ventilation mode was employed during each anesthesia.
Results: During RM, we found a significant increase in the percentage of overaerated lung (Vhyper) (p < 0.001), while the amount of normally aerated lung (Vnormal), poorly aerated lung and non-aerated lung decreased (p ≤ 0.001). VCap showed an increase in airway dead space (VDaw/VT) (p = 0.002), and a decrease in alveolar dead space (VDalv/VTalv). For PEEP, an increase in airway dead space (p = 0.003) was found. For both groups, the amount of carbon dioxide exhaled per breath (VTCO2,br) decreased (p = 0.001), and EIT showed a shift of the center of ventilation to the dependent lung areas (p = 0.021 and p = 0.046, respectively). Oxygenation was superior in RM compared to ZEEP (p = 0.033). The arterial partial pressure of carbon dioxide decreased in RM (p = 0.012). Positive associations were found between Vhyper and VDaw/VT (p = 0.004), Vhyper and VDaw/VT (p = 0.004), Vhyper and Vnormal with VTCO2,br (p = 0.002 for both). Negative associations were found between Vhyper and VDalv/VTalv (p = 0.004) and non-dependent silent spaces (p = 0.050), and Vnormal with oxygenation (p = 0.030).
Conclusion: While RM may be effective in improving gas exchange, it appears to be not benign in healthy lungs, and PEEP might be the preferable strategy to avoid lung collapse during anesthesia. Functional monitoring – EIT, VCap, blood gas analysis – does not detect changes corresponding to anatomical findings on CT.
1 Introduction
Atelectasis is a common occurrence in anesthesia and has also been demonstrated in dogs with healthy lungs during mechanical ventilation (1). In humans, it is associated with increased post-operative morbidity (2). strategies may be employed to either correct or prevent atelectasis. Positive end expiratory pressure (PEEP) is intended to prevent the collapse of alveoli and therefore maintain gas exchange (3), while recruitment maneuvers aim to re-open collapsed alveoli (4). However, both techniques may be associated with overdistension of lung tissue resulting in inflammation in healthy lungs (5).
Computed tomography (CT) is the gold standard in anatomical monitoring of the lung status by assessing the amount of overinflated lung tissue and atelectasis (6) and is used to guide ventilation strategies in human medicine (7). However, CT does not allow breath-by-breath monitoring, is associated with radiation exposure and is not available at the bedside (6). Alternative monitoring methods are called for.
Volumetric capnography (VCap), during which the expiratory partial pressure of carbon dioxide (CO2) is plotted against the expired tidal volume, is a functional monitoring method to determine dead space on a breath-by-breath basis (8). It can be used to separate physiologic dead space into airway and alveolar dead space, the latter of which represents ventilated but non-perfused alveoli and can thus be considered a surrogate of functional overdistension of lung tissue (9).
Electrical impedance tomography (EIT) is a non-invasive technology for functional ventilation monitoring that uses electrical currents to create real-time images of tissues (10). Thoracic EIT has been used to investigate and monitor regional distribution of ventilation in conscious and anesthetized animals (11–18). Several parameters can be determined to describe ventilation distribution: the center of ventilation (CoV) is a representation of where in the thorax ventilation is focused. Silent spaces correspond to areas of poor ventilation and are considered to represent atelectasis if located in the dependent lung areas (dependent silent spaces, DSS), and hyperinflated lung tissue if located in the non-dependent areas (non-dependent silent spaces, NSS) (10).
Blood gas analysis is the gold standard to functionally assess global gas exchange in critically ill and anesthetized patients. Arterial partial pressure of oxygen (PaO2) and carbon dioxide (PaCO2) are used as the main outcome values to determine respiratory status or the efficiency of a specific ventilation mode (19).
To monitor for complications associated with PEEP and RM, both VCap and/or EIT have been used in humans and dogs (4, 12, 13, 20–22). However, the information obtained by these two functional monitoring methods has not been compared to the anatomical situation revealed by CT in healthy anesthetized subjects. This information is crucial to evaluate the interpretation of EIT and VCap variables as an alternative monitoring tool to CT during mechanical ventilation. This study had two aims: Firstly, to determine the effect of PEEP and RM on healthy lungs in dogs and secondly to compare the outcome of monitoring functional lung status by EIT, VCap and blood gas analysis with the anatomical status assessed by CT.
2 Materials and methods
2.1 Animals
Nine healthy sexually intact Beagle dogs weighing between 9.1 and 14.7 kg (mean 13 ± 1.78 kg) and aged between 28 and 33 months (median 33 months, interquartile range 32–33 months) were used in this study. All dogs were considered healthy based on physical examination, routine hematology and biochemistry, and urinalysis. The dogs were housed at a university facility in standard kennels in groups of 2 to 4, fed dry adult maintenance dog food, and had free access to water. Animals were fasted overnight, and water was withheld 2 h before anesthesia induction. The study was approved by the Swiss Federal Ethics Committee for animal research of the Canton of Zurich (Nr. 185/2012). Each dog was anesthetized three times and only one ventilation strategy was used during each anesthesia event.
2.2 Anesthesia
Animals were premedicated with acepromazine (0.03 mg kg−1 IM, Prequillan, Fatro) and methadone (0.2 mg kg−1 IM, Methadon, Streuli Pharma). After placement of an indwelling intravenous catheter, carprofen was administered (4 mg kg−1 IV, Norocarp, Norbrook) and anesthesia was induced with propofol (Propofol 1% MCT, Fresenius Kabi). The trachea was intubated with a cuffed endotracheal tube (Surgivet, Smiths Medical, United States), which was then connected to a rebreathing circuit. Animals were placed in dorsal recumbency, and anesthesia was maintained with sevoflurane (ET 2.0%, Sevorane, Abbott) and rocuronium was administered (0.3 mg kg−1) IV after induction and immediately before initiation of the study intervention [T0] (Esmeron, MSD AG). Lungs were ventilated (Datex S/5 Avance) using a volume-controlled mode with a tidal volume (VT) of 10 mL kg−1, respiratory rate of 25 bpm and an inspiratory-to-expiratory (I:E) ratio of 1:2, and initially ZEEP in all groups. Fraction of inspired oxygen (FiO2) was set at 0.21 for the first 5 min as part of a parallel study (23) and changed to 1.0 thereafter. Respiratory rate was adjusted to maintain end-tidal CO2 between 4.7 and 5.3 kPa (35–40 mmHg). An arterial catheter was placed in the dorsal metatarsal artery for blood pressure monitoring and blood sampling. Lactated Ringer’s solution was administered intravenously at a rate of 10 mL kg−1 h−1 throughout anesthesia. After each anesthesia event and data collection related to the study presented herein, anesthesia was continued for a subsequent imaging study (23). Thereafter, the dogs were allowed to recover.
2.3 Ventilation strategies and experimental design
The experiment was designed as a randomized cross-over study. Each dog was anesthetized three times with at least one-week washout period between each event. Only one ventilation technique was used during each anesthesia event in a randomized order. After 5 min of ventilation at an FiO2 of 0.21, FiO2 was increased to 1.0 and dogs were ventilated with ZEEP for 32 min (total time of ZEEP ventilation for all groups: 37 min, see Figure 1). Thereafter, ventilatory setting were as follows:
1. ZEEP: Volume-controlled ventilation with ZEEP for 12 min (control group).
2. PEEP: Volume-controlled ventilation with a PEEP of 5 cmH2O for 12 min (PEEP group).
3. RM: Recruitment maneuver followed by volume-controlled ventilation with a PEEP of 5 cmH2O for 12 min (RM group). The recruitment maneuver was performed in a manner similar to what has previously been described (24). Briefly, dogs were switched to pressure-controlled ventilation with a fixed respiratory rate of 25 breaths per minute. Peak inspiratory pressure and PEEP were increased and then decreased in a step-wise approach after the following schematic: 5 breaths at 10/0; 5 breaths at 15/5; 5 breaths at 20/10; 1 breath at 25/15; 1 breath at 30/15; 10 breaths at 40/15; 1 breath at 30/15, 1 breath at 25/15, 5 breaths at 20/10, and 5 breaths at 15/5. Thereafter, ventilation was switched back to volume-controlled and a PEEP of 5 cmH2O maintained until the end of the study period.
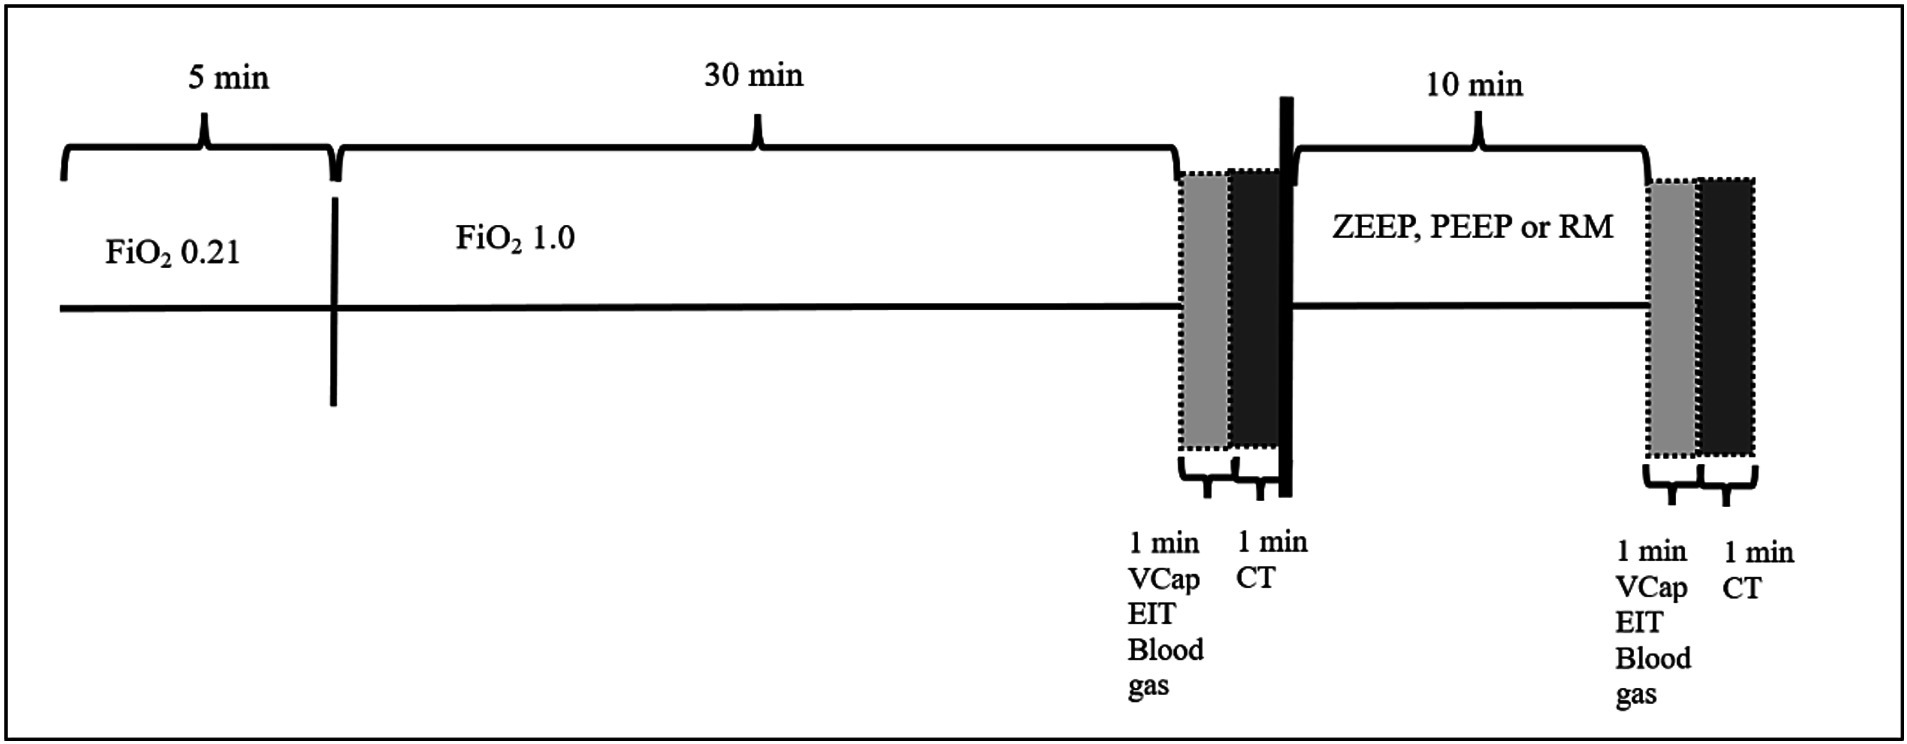
Figure 1. Experimental timeline.
2.4 Measurements
After 35 of the 37 min of ZEEP ventilation had elapsed, VCap and EIT data were collected over 1 min, blood gas samples were taken, and a CT was performed over another minute (total duration of ZEEP ventilation: 37 min), before one of the three ventilation modes (ZEEP, PEP, RM) was initiated as described above. After 47 min of anesthesia (10 min after T0 measurements were completed) all measurements were repeated (Figure 1) (T1).
The following measurements were taken at T0 and T1:
A. Inspiratory apnea CT images (Brilliance CXT 16, Philips, Zurich, Switzerland) of the whole thorax with a slice thickness of 1 mm were acquired. The inspiratory hold pressure was 5 cmH2O. Scan parameters were 120 kVp, 240 mA/Rotation, tube rotation 0.75 s, field of view adjusted to chest dimensions, collimator pitch 0.688 and matrix 768×768 (Figure 2).
B. Volumetric capnography was recorded using the NICO2® capnograph (Respironics, Wallingford, CT). This combined airway flow and CO2 mainstream sensor was placed between the Y-piece of the breathing circuit and the endotracheal tube. Data were recorded for 1 min using the dedicated software Datacoll (Respironics, Wallingford, United States). The NICO2® was calibrated following manufacturers guidelines at the beginning of each anesthesia event.
C. Single-plane EIT measurements were performed with a modified EIT Pioneer-Set (Sentec, formerly Swisstom, Landquart, Switzerland), using a skip-4 driving pattern. A custom-made 32-electrode EIT belt was placed around the thorax over a clipped transversal area; the anatomical position was identified as follows: the length of the sternum was measured and multiplied by 0.17. The resulting distance was measured from the caudal aspect of the xyphoid cranially and the belt positioned at this location (25). Electrically low-conductive ultrasound gel was poured between skin and belt to improve skin-electrode contact. EIT data were acquired at a rate of 46 scans per second. To superimpose contourless EIT images on anatomical landmarks, finite element models (FEM) that had been built for each individual dog in a separate research study were used. Briefly, for the construction of the FEM, CT slices within the EIT electrode plane of each dog were isolated and heart, lung and thorax contours delineated using an open-source software (ITK-SNAP) (26). An algorithm [Graz consensus reconstruction algorithm for EIT (GREIT)] was used to reconstruct EIT images. Further details on EIT technology and image reconstruction can be found elsewhere (10). A representative image of CoV, DSS and NSS output by the software is given in Figure 3.
D. Additionally, a blood sample was drawn anaerobically from the arterial catheter into a pre-heparinized syringe and analyzed immediately (Rapidpoint, Siemens, Zurich) for evaluation of PaO2 and PaCO2.

Figure 2. Graphical illustration of the analysis of chest computed tomography (CT). After CT images were obtained, the regions of interest (lung parenchyma and airways) were manually delineated using a software (Maluna version 3.14, University of Göttingen), and analyzed and color coded for degree of aeration. Left panel: Original CT image. Right panel; CT image after editing by software. Hyper- (Vhyper), normally- (Vnormal), poorly- (Vpoor) and non-(Vnon) aerated lung volume. HU: Hounsfield Units.
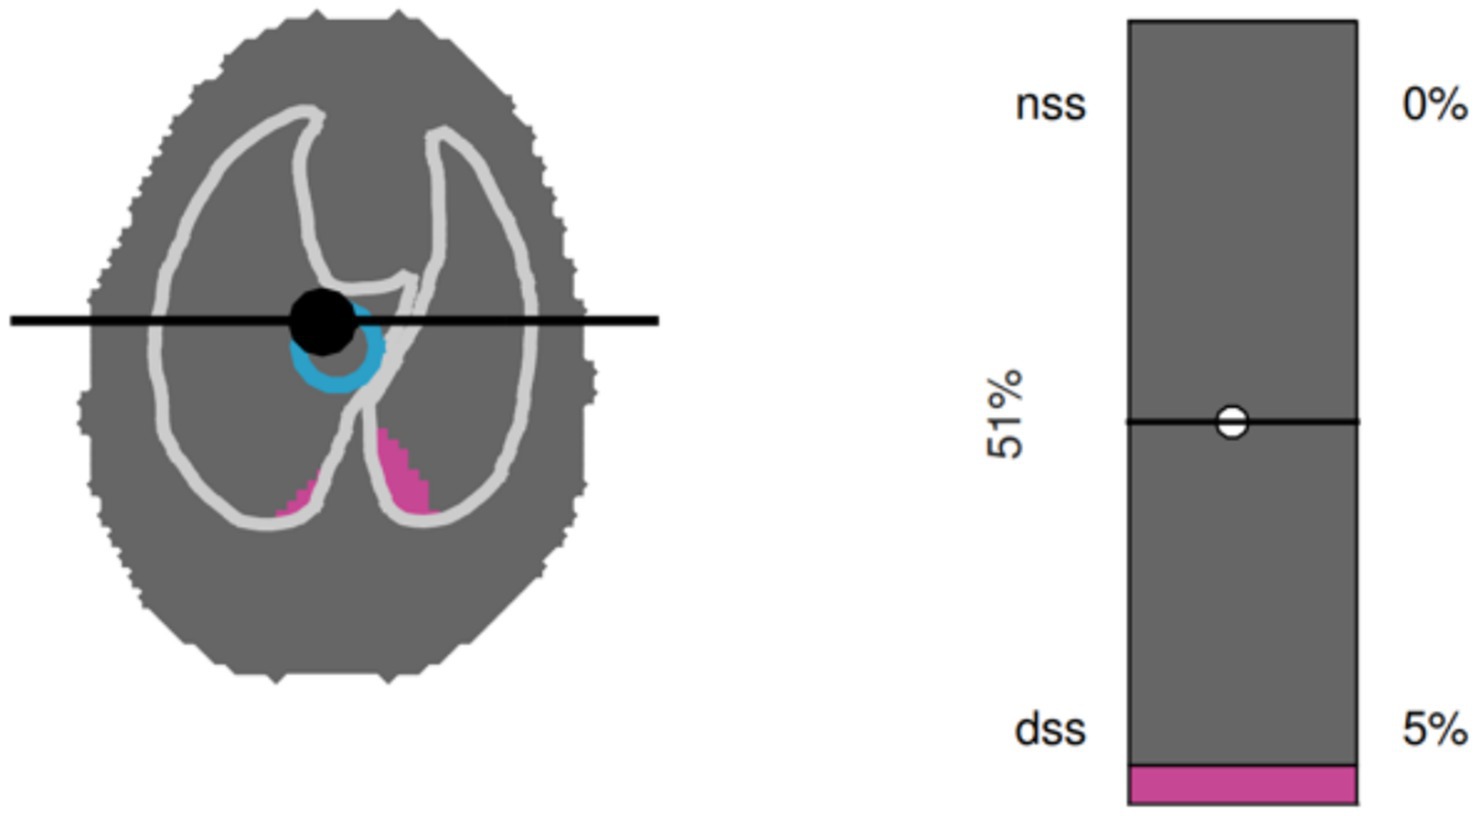
Figure 3. Graphical output from the software used to analyze electrical impedance tomography data in a dorsally recumbent dog. A single breath is shown. Left panel: Silent spaces are shown in purple. In the example shown, only dependent silent spaces (DSS), but not non-dependent silent spaces (NSS) are present. The blue circle represents the center of ventilation (CoV). Right panel: Numerical representation of NSS, DSS and CoV.
2.5 Data analysis
CT images were reconstructed in a lung window algorithm. The DICOM files were then exported to a CT analysis software (Maluna version 3.14, University of Göttingen) on a separate workstation and reviewed (window width: 1600 Hounsfield Units [HU], window level: - 600 HU). Lung fields and airways from the most cranial to the most caudal extents of the lung parenchyma were included in the analysis. First, the regions of interest (i.e., the lung parenchyma and airways) at each CT slice were manually delineated and then analyzed for percentages of lung volume of voxels that were hyper- normally, poorly or not aerated. We arbitrarily defined hyper-aerated (Vhyper,) as −1,000 to −901 HU, normally aerated (Vnormal) as −900 to −501 HU, poorly aerated (Vpoor) as −500 to −1 HU and non-aerated (Vnon) as 0 to 200 HU. The degree of aeration was color-coded (Figure 3).
Raw CO2 and flow data recorded with the NICO2® were used to construct VCap as previously described using a custom-built software based on a functional approximation by a Levenberg–Marquardt algorithm (41). Bohr’s dead space as a ratio to tidal volume (VDBohr/VT), airway dead space as a ratio to tidal volume (VDaw/VT), alveolar tidal volume (VTalv), alveolar dead space (VDalv), the ratio of alveolar dead space over alveolar tidal volume (VDalv/VTalv) and the elimination of CO2 per breath (VTCO2,br) were calculated from breaths taken over 1 min.
For calculation of EIT variables, 10 consecutive breaths were analyzed, from which CoV, DSS and NSS were calculated. The CoV was determined as a percentage of ventro-dorsal extension of the lung region (10). Percentages of DSS and NSS were calculated based on pixels with ventilation-induced impedance changes below 10% of the maximum pixel value found (10).
2.6 Statistics
The number of enrolled animals was based on a power analysis performed after a convenience sample of 6 dogs based on the parallel study in which the dogs were enrolled (23). When Vhyper and Vnormal were considered the variable of interest, a number of 6 animals per group was required. We chose to enroll 9 dogs in order to compensate for potential missing data. Demographic data, the distribution of ventilation on CT, and data gathered from VCap, EIT, and blood gas analysis were tested for normality using the Shapiro–Wilk statistic and transformation was performed when required and mean ± standard deviation or median were calculated.
The first aim was to evaluate the effect of PEEP and RM on healthy lungs as demonstrated by anatomical and functional monitoring. The second aim was to determine whether a relationship existed between the CT measurements and the functional monitoring parameters, accounting for any modulation of that relationship by the ventilation method or measurement time, using ANCOVA linear regression. A mixed effect model was used, which first explored the categorical covariates of method and measurement and their interaction with CT to determine the equality of the slopes of the covariates. If the slopes were the same (no significant interaction), the interaction term for the covariates was excluded from the model; if the slopes were unequal it was included. Re-parameterization of the model to obtain the estimates of the slopes for the covariates directly was performed. Significance of estimates and models was considered at p < 0.05. PROC UNIVARIATE and PROC MIXED (SAS 9.4, SAS Institute, Cary, NC) were used.
3 Results
All dogs finished all three study periods. Technical malfunctions required the exclusion of CT data of two dogs from group PEEP and one dog from group ZEEP at both time points, and the exclusion of EIT data from 1 dog in group PEEP at T0. Descriptive statistics for CT, EIT, and VCap data as well as results of arterial blood gas analysis for all 3 groups (ZEEP, PEEP, RM) at both time points (T0, T1) are given in Table 1.
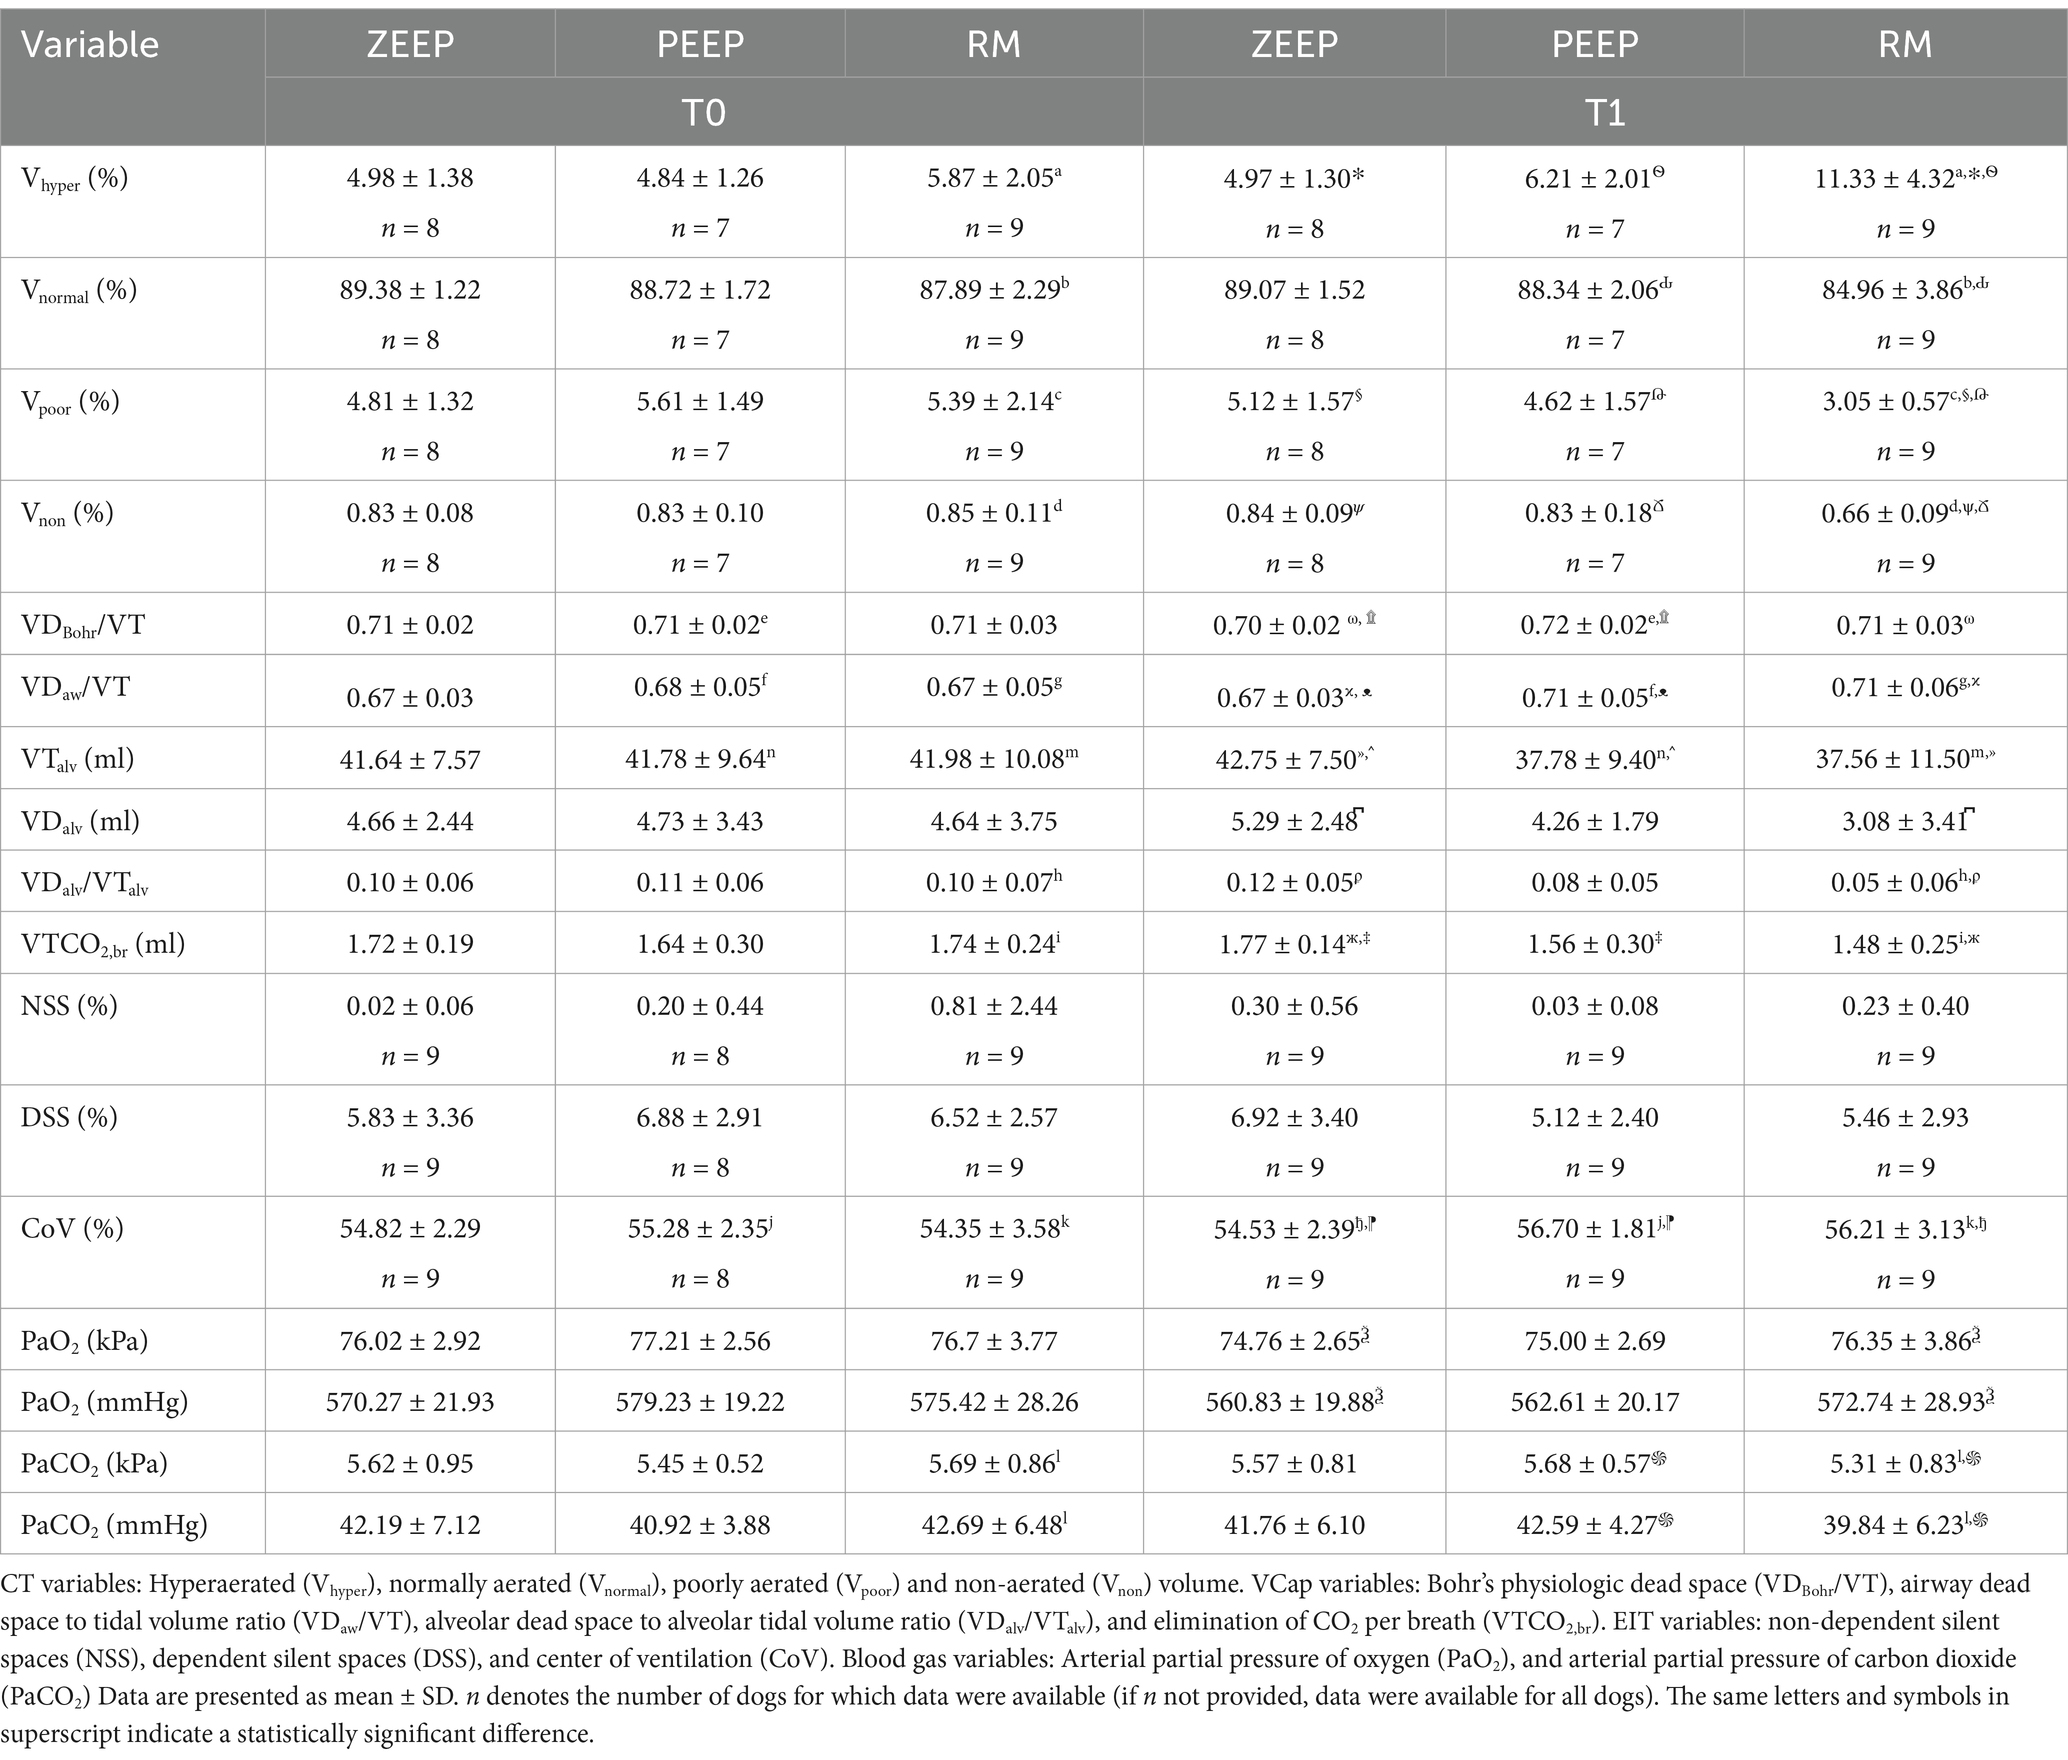
Table 1. Results of computed tomography (CT), electrical impedance tomography (EIT) and volumetric capnography (VCap) data, and blood gas analysis in nine Beagle dogs before (T0) and after (T1) either continued ventilation with zero end-expiratory pressure (ZEEP), switching to 5 cmH2O of positive end-expiratory pressure (PEEP) or performing a recruitment maneuver, followed by PEEP (RM).
3.1 Comparing ventilation modes
When evaluating the different ventilation modes between time points and between each other, the following results were obtained:
A. Computed tomography revealed an increase in the percentage of Vhyper in the RM group at T1 compared to T0 (p < 0.001). Vhyper was also higher in the RM group at T1 compared to ZEEP (p < 0.001) and PEEP at the same time point (p < 0.001) (Figure 4). The percentage of Vnormal was lower in RM at T1 compared to T0 (p = 0.001), and lower in the RM group compared to the PEEP group at T1 (p < 0.001). The percentage of Vpoor was lower in RM at T1 compared to T0 (p < 0.001). The percentage of Vpoor was also lower in the RM group than in the ZEEP and PEEP groups at T1 (p < 0.001 and p = 0.002, respectively). The percentage of Vnon was lower in RM at T1 compared to RM at T0 (p < 0.001), and it was also lower in the RM group than in the ZEEP and PEEP groups at T1 (p < 0.001 and p = 0.001, respectively).
B. Volumetric capnography showed that VDBohr/VT was higher in PEEP at T1 compared to PEEP at T0 (p = 0.029), which was not the case for the RM group (p = 0.289). However, VDBohr/VT was higher in the RM and PEEP groups compared to the ZEEP group at T1 (p = 0.039 and p < 0.001, respectively). VDaw/VT was higher in in the RM group at T1 compared to T0 (p = 0.005), and in the PEEP group at T1 compared to T0 (p = 0.003). Furthermore, it was higher in RM and PEEP compared to ZEEP at T1 (p = 0.002 and p = 0.002, respectively), but there was no difference between PEEP and RM at T1. VTalv was significantly lower in RM compared to ZEEP at T1 (p = 0.006), and in PEEP compared to ZEEP at T1 (p = 0.008). It was also significantly lower in RM at T1 compared to T0 (p = 0.019) and in PEEP at T1 compared to T0 (p = 0.034). VDalv was significantly smaller in RM compared to ZEEP at T1 (p = 0.041). VDalv/VTalv decreased in the RM group at T1 compared to T0 (p = 0.018), and it was lower in RM compared to ZEEP at T1 (p = 0.001). VTCO2,br was lower in the RM group at T1 compared to T0 (p < 0.001), and it was also lower in the RM group and PEEP groups compared to the ZEEP group at T1 (p < 0.001 and p < 0.001).
C. EIT values for NSS or DSS did not change significantly over time or with ventilation mode. CoV increased in the RM group at T1 compared to T0 (p = 0.021) and in the PEEP group at T1 compared to T0 (p = 0.046). It was also higher in the RM group and the PEEP group compared to the ZEEP group at T1 (p = 0.038 and p = 0.007, respectively), indicating a shift of ventilation towards the dorsal (dependent) parts of the lungs in these two groups, while no change was observed in the control group (Figure 5).
D. PaO2 did not change between T1 and T0 in any group. Compared to the control group however, PaO2 was higher in the RM group at T1 (p = 0.033). PaCO2 decreased at T1 compared to T0 in the RM group (p = 0.012) and was also lower in the RM group compared to the PEEP group at T1 (p = 0.016).
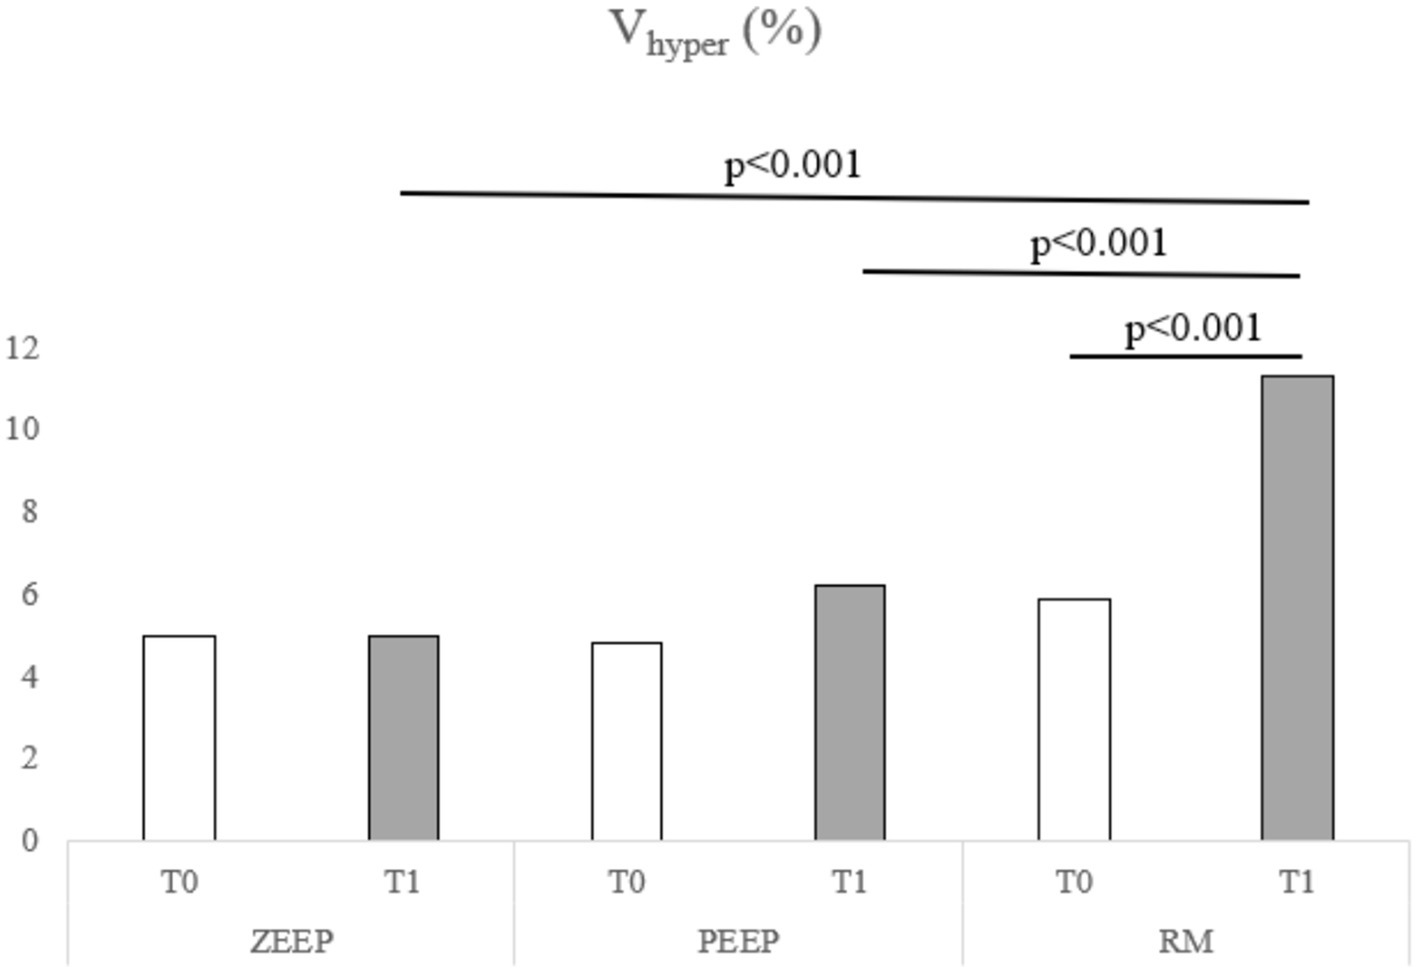
Figure 4. Distribution of Vhyper over time in all groups (ZEEP, zero-end-expiratory pressure; PEEP, positive end-expiratory pressure; RM, recruitment maneuver).
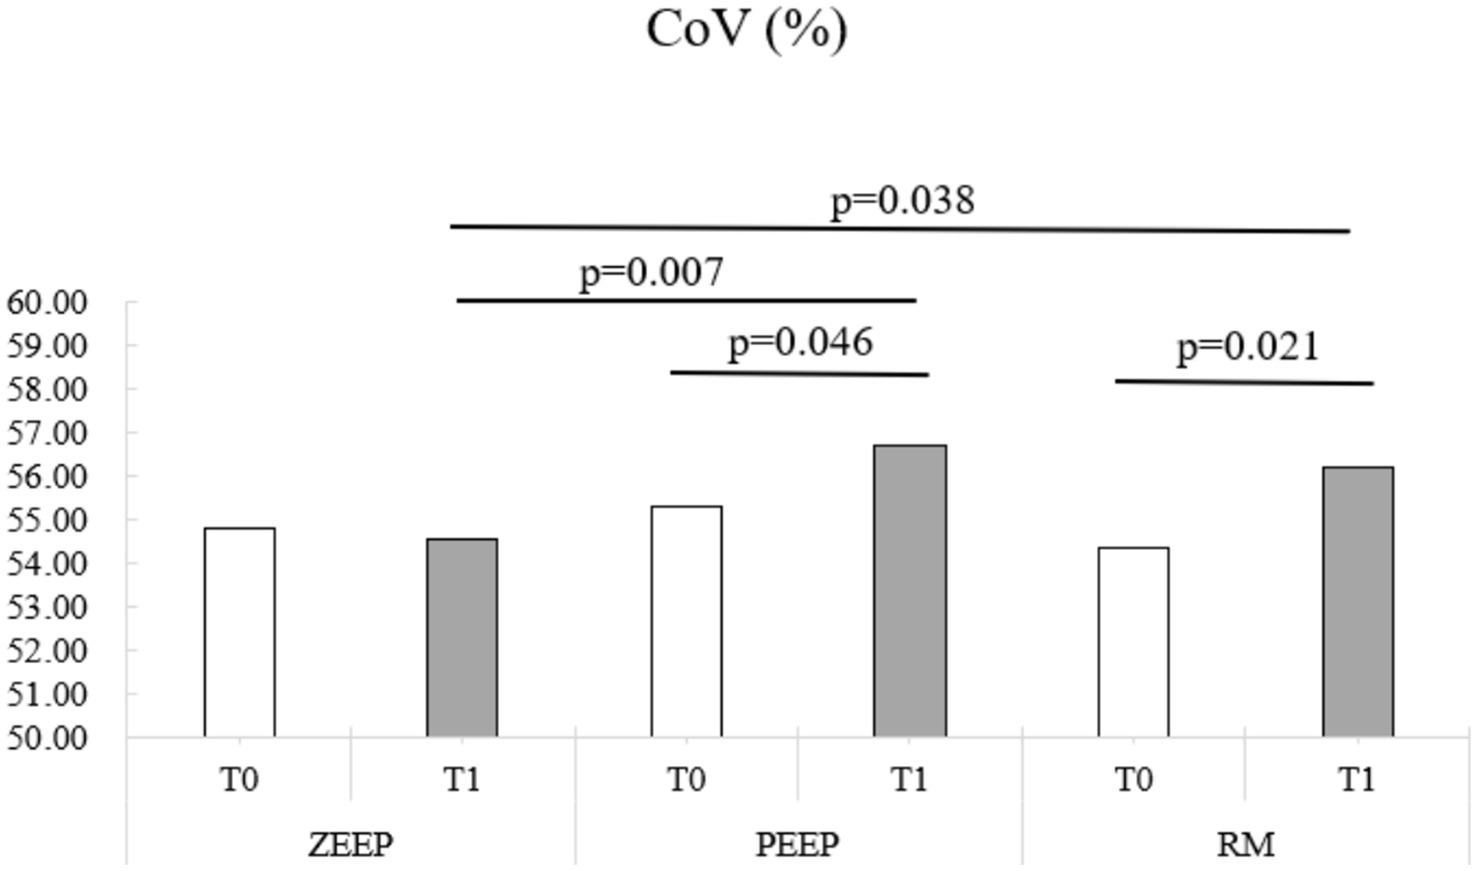
Figure 5. Distribution of the center of ventilation (CoV) over time in all groups (ZEEP, zero-end-expiratory pressure; PEEP, positive end-expiratory pressure; RM, recruitment maneuver).
3.2 Comparing monitoring systems
Comparing the various monitoring tools with each other, a positive interaction was found for Vhyper with VDaw/VT (p = 0.004) and VTCO2,br (p = 0.002), while VDalv/VTalv (p = 0.004) and NSS (p = 0.050) decreased when Vhyper increased. Vnormal had a positive association with VTCO2,br (p = 0.002) and a negative association with PaO2 (p = 0.030). No other significant interaction was found between the anatomical CT values and the functional VCap, EIT and blood gas results.
4 Discussion
This study provides valuable insights into the effects of different ventilation modes - ZEEP, PEEP, and RM - on lung function in healthy dogs, using a range of monitoring tools to compare functional and anatomical assessments. The findings underscore the differential impact of recruitment maneuvers (RM) and positive end-expiratory pressure (PEEP) on lung ventilation patterns, highlighting specific shifts in ventilation distribution, dead space, and gas exchange.
4.1 Effects of ventilation modes on lung function
Overall, the pre-intervention lung status was better than anticipated, with less than 1% of non-aerated lung tissue and approximately 5% of poorly aerated lung regions, which is comparable to what has been demonstrated in healthy, spontaneously breathing humans (27) and distinctly less than what has been reported in dogs during mechanical ventilation (28). This suggests that a recruitment maneuver (RM) might not have been clinically necessary. However, the aim of the study was to investigate the physiological effects of RM on the lungs, even though it was not clinically indicated, as this approach allowed us to better understand its impact under controlled conditions in healthy lungs.
The recruitment maneuver nearly doubled the hyperventilated lung volume to over 10% at T1, compared to baseline (T0). Concurrently, RM decreased the volumes of poorly ventilated and non-ventilated lung regions, as visualized on CT. Although the extent of recruitment was lower than the increase in Vhyper this indicates that RM can reduce absorption atelectasis or under-ventilation in healthy lung tissue during anesthesia. Notably, the primary finding was a significant reduction in normally aerated lung volume after RM, suggesting that hyperinflation surpassed recruitment, thus cautioning against the use of RM in healthy canine lungs. This finding is particularly relevant when considering the potential for an inflammatory response associated with lung tissue overstretch, as observed in studies with horses (5). In contrast, another study in healthy dogs also found a decrease in non-aerated areas with RM (performed as sustained inflation), but observed an increase in Vnormal rather than a decrease, with no changes in Vhyper (29) which indicates that also the protocol for conducting a recruitment maneuver has an influence on the outcome. Several methods of performing recruitment maneuvers in people and animals are described in the medical literature (13, 29–34). We chose a stepwise recruitment technique used in humans (24), as in people it is no longer recommended to perform sustained inflation maneuvers (30), and the described technique is customary at one of the authors’ institutions. There is currently no consensus on which stepwise recruitment approach is superior to another (30).While PEEP also reduced Vpoor over time, this reduction did not achieve statistical significance. The increase in Vhyper during PEEP was also more modest, remaining below 2%. PEEP therefore might be the safer strategy to counteract atelectasis in healthy dogs during anesthesia.
Volumetric capnography showed that the increase in Vhyper was largely attributable to elevated airway dead space ventilation in both the RM and PEEP groups at T1 compared to T0, without significant differences between these groups. Although both RM and PEEP increased dead space, RM may facilitate more effective alveolar ventilation, as shown by a 5% reduction in alveolar dead space fraction in the RM group at T1, especially when compared to ZEEP, which showed an increase in this fraction over the same interval. However, VTCO2,br was significantly lower in both RM and PEEP at T1. Given that VCO2,br can serve as an indirect measure of cardiac output in healthy lungs (9), this decrease suggests an expected adverse effect of high mean airway pressure on cardiovascular function.
In comparing our data to other veterinary studies, overall, our VCap parameters were considerably different from what is reported in other studies on healthy dogs, with dead space being higher and VTCO2,br being lower (35–38). The reason for this is unclear.
4.2 EIT and regional ventilation distribution
Electrical impedance tomography showed increased ventilation towards the dorsal, dependent regions (CoV) in both RM and PEEP groups at T1. This suggests that both RM and PEEP promoted a more favorable distribution of ventilation, potentially counteracting gravitational effects on lung perfusion and improving gas exchange. The lack of significant changes in NSS and DSS across time points and ventilation modes, however, is due to the high standard deviation seen in our dogs and indicates that EIT’s capacity to detect regional shifts may be more pronounced in specific parameters like CoV. This shift in CoV is in contrasts with other studies where RM of 20 cmH2O did not cause significant changes in CoV in dogs (12, 13).
4.3 Arterial blood gas analysis and gas exchange
Interestingly, PaO2 levels were generally higher in the RM group compared to the control group at T1. Notably, when comparing PaO2 at T1 to baseline across the groups, PaO2 showed a decrease in all groups without reaching statistical significance, with the smallest decrease observed in the RM group. This decrease in PaO2 likely reflects the effects of anesthesia over time, which seem to be blunted with RM. However, with PaO2 levels remaining above 73 kPa (550 mmHg), a 1.33 kPa (10 mmHg) drop is clinically negligible and possibly within measurement error. It would have been valuable to assess the impact of PEEP and RM on oxygenation at an FiO2 of 0.21, but FiO2 was set at 1.0 intentionally to induce absorption atelectasis.
A similar observation was made for PaCO2, which showed a statistically significant but clinically minor reduction following RM, likely due to increased minute ventilation during the maneuver that still persisted 10 min post-RM.
4.4 Comparative efficacy of monitoring techniques
When comparing the different monitoring modalities, we observed specific correlations between CT, VCap, and blood gas analysis, but few interactions were found with EIT values.
The increase in Vhyper observed on CT correlated positively with the VDaw/VT ratio, suggesting that the overdistension effects of PEEP and RM influenced airway geometry and gas flow. This likely resulted from a distal shift of the interface between airway dead space and alveolar ventilation, with smaller airway diameters increasing rather than alveolar distension. This interpretation aligns with Fletcher’s findings, which described how airway adjustments in response to pressure can alter ventilation distribution without necessarily expanding alveolar spaces (39).
While the center of ventilation was a valuable EIT variable for evaluating a change in dorso-ventral ventilation distribution, other EIT variables showed limited correlation with CT and VCap data, likely due to EIT’s lower spatial resolution in detecting the small non- and poorly ventilated lung areas in our healthy dogs after a relatively short period of anesthesia. Although an increase in Vhyper to over 10% was expected to be detected by the NSS metric, especially as we used individualized finite element models for EIT analysis, this was not observed. Notably, comparing EIT and VCap as functional monitoring tools shows NSS and VDalv/VTalv align directionally after RM, whereas the anatomical CT measure Vhyper contrasts with this. This underscores the need for caution when comparing anatomical imaging modalities with functional lung monitoring techniques.
While the positive correlation between normally aerated lung tissue and VTCO2,br makes sense as it shows that the lungs become more efficient in eliminating CO2 (9), the positive correlation of Vhyper and VTCO2,br is unexplained. Additionally, the inverse correlation between Vnormal and PaO2, which is contradictory, indicates that blood gasses assess gas exchange dynamics beyond anatomical status alone, again underscoring the need for caution when comparing anatomical imaging like CT with functional measures of lung performance.
4.5 Limitations
This study faced several key limitations that may have impacted our findings. First, we were able to induce only minimal atelectasis and areas of poor aeration prior to initiating the ventilation strategies. As such, there was limited potential for improvement, which may have minimized observable effects. To induce atelectasis, an FiO2 of 1.0 was used to promote absorption atelectasis, as this has been shown to occur in other studies within a few minutes (40). However, this high FiO2 resulted in less than 1% non-aerated and around 5% poorly aerated lung areas, potentially insufficient to reveal notable changes in the functional monitoring modalities with the ventilation strategies applied. If a lower FiO2 had been chosen, it is possible that more significant shifts in PaO2 and greater efficacy of the ventilation strategies might have been detectable.
Additionally, the duration of each ventilation intervention was brief, limiting our ability to observe potential longer-term effects on lung aeration and function. These factors underscore the challenges in detecting subtle physiological responses in healthy lung models and suggest that future studies with prolonged ventilation times and alternative FiO2 levels might yield further insights into the effects of ventilation strategies on lung function in minimally compromised lungs.
5 Conclusion
Based on our data, applying a recruitment maneuver in healthy lungs during short time mechanical ventilation seems to carry more risks (reduction of normally aerated lungs, increase in hyperaerated lungs, reduction in VTCO2,br), than benefits (reduction of poorly or non-ventilated areas, shifting of the focus of ventilation towards dependent lung areas), even though it might be more effective than PEEP alone in blunting decrease in PaO2 over time, at least when 100% oxygen is applied. PEEP may be gentler on healthy lungs, as hyperaerated lung areas do not increase, but also less effective, as it only shifts CoV dorsally without reducing poorly or non-aerated lung areas. Although the decrease for VTCO2,br is concerning for either a decrease in healthy lung tissue or pulmonary perfusion also during PEEP, we conclude that PEEP is likely the preferable ventilation technique over RM in healthy lungs mechanically ventilated at an FiO2 of 1.0.
Based on our data, functional lung monitoring should be cautiously used to directly compared to anatomical monitoring by CT for the interpretation of changes after ventilation maneuvers in healthy lungs.
Data availability statement
The raw data supporting the conclusions of this article will be made available by the authors, without undue reservation.
Ethics statement
The animal study was approved by Swiss Federal Ethics Committee for animal research of the Canton of Zurich. The study was conducted in accordance with the local legislation and institutional requirements.
Author contributions
MM: Conceptualization, Data curation, Investigation, Methodology, Project administration, Resources, Writing – original draft, Writing – review & editing. ADW: Formal analysis, Writing – review & editing. TG: Methodology, Writing – original draft. GH: Formal analysis, Writing – review & editing. NSS-R: Conceptualization, Data curation, Investigation, Project administration, Resources, Writing – review & editing. MD: Formal analysis, Writing – original draft. PH: Software, Writing – review & editing. KU: Writing – original draft, Writing – review & editing.
Funding
The author(s) declare that financial support was received for the research, authorship, and/or publication of this article. This research was supported by institutional funding. The funding institution was the Vetsuisse Faculty, University of Zurich, Zurich, Switzerland.
Conflict of interest
The authors declare that the research was conducted in the absence of any commercial or financial relationships that could be construed as a potential conflict of interest.
The author(s) declared that they were an editorial board member of Frontiers, at the time of submission. This had no impact on the peer review process and the final decision.
Generative AI statement
The author(s) declare that no Gen AI was used in the creation of this manuscript.
Publisher’s note
All claims expressed in this article are solely those of the authors and do not necessarily represent those of their affiliated organizations, or those of the publisher, the editors and the reviewers. Any product that may be evaluated in this article, or claim that may be made by its manufacturer, is not guaranteed or endorsed by the publisher.
References
1. Staffieri, F, Franchini, D, Carella, GL, Montanaro, MG, Valentini, V, Driessen, B, et al. Computed tomographic analysis of the effects of two inspired oxygen concentrations on pulmonary aeration in anesthetized and mechanically ventilated dogs. Am J Vet Res. (2007) 68:925–31. doi: 10.2460/ajvr.68.9.925
2. Ireland, CJ, Chapman, TM, Mathew, SF, Herbison, GP, and Zacharias, M. Continuous positive airway pressure (CPAP) during the postoperative period for prevention of postoperative morbidity and mortality following major abdominal surgery. Cochrane Database Syst Rev. (2014) 2014:CD008930. doi: 10.1002/14651858.CD008930.pub2
3. Rusca, M, Proietti, S, Schnyder, P, Frascarolo, P, Hedenstierna, G, Spahn, DR, et al. Prevention of atelectasis formation during induction of general anesthesia. Anesth Analg. (2003) 97:1835–9. doi: 10.1213/01.ANE.0000087042.02266.F6
4. Tusman, G, and Bohm, SH. Prevention and reversal of lung collapse during the intra-operative period. Best Pract Res Clin Anaesthesiol. (2010) 24:183–97. doi: 10.1016/j.bpa.2010.02.006
5. Hopster, K, Jacobson, B, Hopster-Iversen, C, Rohn, K, and Kästner, SBR. Histopathological changes and mRNA expression in lungs of horses after inhalation anaesthesia with different ventilation strategies. Res Vet Sci. (2016) 107:8–15. doi: 10.1016/j.rvsc.2016.04.008
6. Ball, L, Vercesi, V, Costantino, F, Chandrapatham, K, and Pelosi, P. Lung imaging: how to get better look inside the lung. Ann Transl Med. (2017) 5:294. doi: 10.21037/atm.2017.07.20
7. Constantin, JM, Jabaudon, M, Lefrant, JY, Jaber, S, Quenot, JP, Langeron, O, et al. Personalised mechanical ventilation tailored to lung morphology versus low positive end-expiratory pressure for patients with acute respiratory distress syndrome in France (the LIVE study): a multicentre, single-blind, randomized controlled trial. Lancet Respir Med. (2019) 7:870–80. doi: 10.1016/S2213-2600(19)30138-9
8. Tusman, G, Gogniat, E, Bohm, SH, Scandurra, A, Suarez-Sipmann, F, Torroba, A, et al. Reference values for volumetric capnography-derived non-invasive parameters in healthy individuals. J Clin Monit Comput. (2013) 27:281–8. doi: 10.1007/s10877-013-9433-x
9. Suarez-Sipmann, F, Bohm, SH, and Tusman, G. Volumetric capnography: the time has come. Curr Opin Crit Care. (2014) 20:333–9. doi: 10.1097/MCC.0000000000000095
10. Brabant, OA, Byrne, DP, Sacks, M, Moreno Martinez, F, Raisis, AL, Araos, JB, et al. Thoracic electrical impedance tomography - the 2022 veterinary consensus statement. Front Vet Sci. (2022) 9:946911. doi: 10.3389/fvets.2022.946911
11. Ambrisko, T, Schramel, J, Auer, U, and Moens, Y. Impact of four different Recumbencies on the distribution of ventilation in conscious or anaesthetized spontaneously breathing beagle dogs: an electrical impedance tomography study. PLoS One. (2017) 12:e0183340. doi: 10.1371/journal.pone.0183340
12. Ambrosio, AM, Carvalho-Kamakura, TPA, Ida, KK, Varela, B, Andrade, FSRM, Facó, LL, et al. Ventilation distribution assessed with electrical impedance tomography and the influence of tidal volume, recruitment and positive end-expiratory pressure in isoflurane-anesthetized dogs. Vet Anaesth Analg. (2017) 44:254–63. doi: 10.1016/j.vaa.2016.06.003
13. Ambrosio, AM, Sanchez, AF, Pereira, MAA, De Andrade, FSRM, Rodrigues, RR, Vitorasso, RL, et al. Assessment of regional ventilation during recruitment maneuver by electrical impedance tomography in dogs. Front Vet Sci. (2022) 8:815048. doi: 10.3389/fvets.2021.815048
14. Mosing, M, Waldmann, AD, Raisis, A, Bohm, SH, Drynan, E, and Wilson, K. Monitoring of tidal ventilation by electrical impedance tomography in anaesthetised horses. Equine Vet J. (2019) 51:222–6. doi: 10.1111/evj.12998
15. Sacks, M, Byrne, DP, Herteman, N, Secombe, C, Adler, A, Hosgood, G, et al. Electrical impedance tomography to measure lung ventilation distribution in healthy horses and horses with left-sided cardiac volume overload. J Vet Intern Med. (2021) 35:2511–23. doi: 10.1111/jvim.16227
16. Secombe, C, Adler, A, Hosgood, G, Raisis, A, and Mosing, M. Can bronchoconstriction and bronchodilatation in horses be detected using electrical impedance tomography? J Vet Intern Med. (2021) 35:2035–44. doi: 10.1111/jvim.16152
17. Pleyers, T, Levionnois, O, Siegenthaler, J, Spadavecchia, C, and Raillard, M. Investigation of selected respiratory effects of (dex)medetomidine in healthy beagle dogs. Vet Anaes Analg. (2020) 47:667–71. doi: 10.1016/j.vaa.2020.05.001
18. Andrade, FSRM, Ambrósio, AM, Rodrigues, RR, Faccó, LL, Gonçalves, LA, Garcia Filho, SG, et al. The optimal PEEP after alveolar recruitment maneuver assessed by electrical impedance tomography in healthy horses. Front Vet Sci. (2022) 9:1024088. doi: 10.3389/fvets.2022.1024088
19. Gray, S. Blood gas analysis In: JM Burkitt Creedon and H Davis, editors. Advanced monitoring and procedures for small animal emergency and critical care. 2nd ed. Hoboken, NJ: Wiley Blackwell (2023). 339–46.
20. Blankman, P, Shono, A, Hermans, BJ, Wesselius, T, Hasan, D, and Gommers, D. Detection of optimal PEEP for equal distribution of tidal volume by volumetric capnography and electrical impedance tomography during decreasing levels of PEEP in post cardiac-surgery patients. Br J Anaesth. (2016) 116:862–9. doi: 10.1093/bja/aew116
21. Karsten, J, Grusnick, C, Paarmann, H, Heringlake, M, and Heinze, H. Positive end-expiratory pressure titration at bedside using electrical impedance tomography in post-operative cardiac surgery patients. Acta Anaesthesiol Scand. (2015) 59:723–32. doi: 10.1111/aas.12518
22. Gomez-Laberge, C, Rettig, JS, Smallwood, CD, Boyd, TK, Arnold, JH, and Wolf, GK. Interaction of dependent and non-dependent regions of the acutely injured lung during a stepwise recruitment manoeuvre. Physiol Meas. (2013) 34:163–77. doi: 10.1088/0967-3334/34/2/163
23. Blaser, A, Dennler, M, Mosing, M, Gent, TC, Santner, G, Imhasly, S, et al. Effects of contrast medium injection technique on attenuation values of adrenal glands in healthy dogs during constrast-enhanced computed tomography. J Vet Res. (2016) 77:144–50. doi: 10.2460/ajvr.77.2.144
24. Tusman, G, Böhm, SH, Vazquez de Anda, GF, do Campo, JL, and Lachmann, B. ‘Alveolar recruitment strategy’ improves arterial oxygenation during general anaesthesia. Br J Anaesth. (1999) 82:8–13. doi: 10.1093/bja/82.1.8
25. Rocchi, A, Hagen, R, Rohrer Bley, C, Auer, U, and Mosing, M. Comparison of three positions for the thoracic electric impedance tomography (EIT) belt in dogs. Vet Anaesth Analg. (2014) 41:A47. doi: 10.1111/vaa.12214
26. Waldmann, A, Meira, C, Böhm, S, Dennler, M, and Mosing, M. Construction of a robust beagle model for EIT application. 17th International Conference on Electrical Impedance Tomography. Stockholm, Sweden, June 19–23. (2016).
27. Reske, AW, Busse, H, Amato, MBP, Jaekel, M, Kahn, T, Schwarzkopf, P, et al. Image reconstruction affects computer tomographic assessment of lung hyperinflation. Intensive Care Med. (2008) 34:2044–53. doi: 10.1007/s00134-008-1175-8
28. De Monte, V, Bufalari, A, Grasso, S, Ferrulli, F, Crovace, AM, Lacitignola, L, et al. Respiratory effects of low versus high tidal volume with or without positive end-expiratory pressure in anesthetized dogs with healthy lungs. Am J Vet Res. (2018) 79:496–504. doi: 10.2460/ajvr.79.5.496
29. Staffieri, F, De Monte, V, De Marzo, C, Scrascia, F, and Crovace, A. Alveolar recruiting maneuver in dogs under general anesthesia: effects on alveolar ventilation, gas exchange, and respiratory mechanics. Vet Res Commun. (2010) 34:131–S134. doi: 10.1007/s11259-010-9405-2
30. Bajon, F, and Gauthier, V. Management of refractory hypoxemia using recruitment maneuvers and rescue therapies: a comprehensive review. Front Vet Sci. (2023) 10:1157026. doi: 10.3389/fvets.2023.1157026
31. Di Bella, C, Vicenti, C, Araos, J, Lacitignola, L, Fracassi, L, Stabile, M, et al. Effects of two alveolar recruitment maneuvers in an “open-lung” approach during laparoscopy in dogs. Front Vet Sci. (2022) 9:904673. doi: 10.3389/fvets.2022.904673
32. Sanchez, AF, Ambrósio, AM, Fonseca Pinto, ACBC, Pereira, MAA, Andrade, FSRM, Rodrigues, RR, et al. Effects of a stepwise alveolar recruitment maneuver on lung volume distribution in dogs assessed by computed tomography. Front Vet Sci. (2024) 10:1232635. doi: 10.3389/fvets.2023.1232635
33. Rodrigues, RR, Ambrósio, AM, Engbruch, AM, Gonçalves, LA, Villela, PA, Sanchez, AF, et al. Intraoperative protective mechanical ventilation in dogs: a randomized clinical trial. Front Vet Sci. (2022) 9:842613. doi: 10.3389/fvets.2022.842613
34. Donati, PA, Tarragona, L, Araos, J, Zaccagnini, AC, Diaz, A, Nigro, N, et al. Tidal volume selection in volume-controlled ventilation guided by driving pressure versus actual body weight in healthy anesthetized and mechanically ventilated dogs: a randomized crossover trial. Vet Anaesth Analg. (2024) 51:408–16. doi: 10.1016/j.vaa.2024.05.006
35. Bumbacher, S, Schramel, JP, and Mosing, M. Evaluation of three tidal volumes (10, 12 and 15 mL kg−1) in dogs for controlled mechanical ventilation assessed by volumetric capnography: a randomized clinical trial. Vet Anaesth Analg. (2017) 44:775–84. doi: 10.1016/j.vaa.2016.10.007
36. Scheffzek, S, Mosing, M, Hirt, R, Iff, I, and Moens, Y. Volumetric capnography curves as lung function test to confirm bronchoconstriction after carbachol challenge in sedated dogs. Res Vet Sci. (2012) 93:1418–25. doi: 10.1016/j.rvsc.2012.04.010
37. Mosing, M, Iff, I, Hirt, R, Moens, Y, and Tusman, G. Evaluation of variables to describe the shape of volumetric capnography curves during bronchoconstriction in dogs. Res Vet Sci. (2012) 93:386–92. doi: 10.1016/j.rvsc.2011.05.014
38. Mosing, M, Staub, L, and Moens, Y. Comparison of two different methods for physiologic dead space measurements in ventilated dogs in a clinical setting. Vet Anaesth Analg. (2010) 37:393–400. doi: 10.1111/j.1467-2995.2010.00548.x
39. Fletcher, R, Jonson, B, Cumming, G, and Brew, J. The concept of deadspace with special reference to the single breath test for carbon dioxide. Br J Anaesth. (1981) 53:77–88. doi: 10.1093/bja/53.1.77
40. Rothen, HU, Sporre, B, Engberg, G, Wegenius, G, Högmann, M, and Hedenstierna, G. Influence of gas composition on recurrence of atelectasis after a reexpansion maneuver during general anesthesia. Anesthesiology. (1995) 82:832–42. doi: 10.1097/00000542-199504000-00004
Keywords: anesthesia, center of ventilation, dogs, short-term mechanical ventilation, overdistension
Citation: Mosing M, Waldmann AD, Gent TC, Hosgood G, Sieber-Ruckstuhl NS, Dennler M, Herrmann P and Unger K (2025) Impact of positive end-expiratory pressure and recruitment maneuver on healthy lungs in dogs assessed by functional and anatomical monitoring methods. Front. Vet. Sci. 12:1545683. doi: 10.3389/fvets.2025.1545683
Edited by:
Natalia Henao-Guerrero, Virginia Tech, United StatesReviewed by:
Rene Doerfelt, Ludwig-Maximilians-University Munich, GermanyDario Floriano, University of Pennsylvania, United States
Copyright © 2025 Mosing, Waldmann, Gent, Hosgood, Sieber-Ruckstuhl, Dennler, Herrmann and Unger. This is an open-access article distributed under the terms of the Creative Commons Attribution License (CC BY). The use, distribution or reproduction in other forums is permitted, provided the original author(s) and the copyright owner(s) are credited and that the original publication in this journal is cited, in accordance with accepted academic practice. No use, distribution or reproduction is permitted which does not comply with these terms.
*Correspondence: Karin Unger, a2FyaW4udW5nZXJAdmV0bWVkdW5pLmFjLmF0