 Maureen W. Kamau1,2,3*
 Carmel Witte2,4
 Wynand Goosen2Mathew Mutinda5
 Jandouwe Villinger6Dennis Getange6Rua Khogali6
 Michael E. von Fricken7Eric Maurice Fèvre8,9Dawn Zimmerman10
 Yvonne-Marie Linton11,12,13
 Michele Miller2
- 1Mpala Research Centre, Nanyuki, Kenya
- 2Division of Molecular Biology and Human Genetics, Department of Science, and Innovation – National Research Foundation Centre of Excellence for Biomedical Tuberculosis Research, Faculty of Medicine and Health Sciences, South African Medical Research Council Centre for Tuberculosis Research, Stellenbosch University, Stellenbosch, South Africa
- 3Global Health Program, Smithsonian National Zoo Conservation Biology Institute, Washington, DC, United States
- 4The Center for Wildlife Studies, South Freeport, ME, United States
- 5Kenya Wildlife Service, Nairobi, Kenya
- 6International Centre of Insect Physiology and Ecology (ICIPE), Nairobi, Kenya
- 7College of Public Health and Health Professionals, Department of Environmental and Global Health University of Florida, Gainesville, FL, United States
- 8International Livestock Research Institute, Nairobi, Kenya
- 9Institute of Infection, Veterinary and Ecological Sciences, University of Liverpool, Liverpool, United Kingdom
- 10Veterinary Initiative for Endangered Wildlife, Bozeman, MT, United States
- 11Walter Reed Biosystematics Unit (WRBU) Smithsonian Institution Museum Support Center, Suitland, MD, United States
- 12One Health Branch, Walter Reed Army Institute of Research (WRAIR), Silver Spring, MD, United States
- 13Department of Entomology, Smithsonian Institution, National Museum of Natural History (NMNH), Washington, DC, United States
Introduction: Coxiella burnetii (C. burnetii)-infected livestock and wildlife have been epidemiologically linked to human Q fever outbreaks. Despite this growing zoonotic threat, knowledge of coxiellosis in wild animals remains limited, and studies to understand their epidemiologic role are needed. In C. burnetii-endemic areas, ticks have been reported to harbor and spread C. burnetii and may serve as indicators of risk of infection in wild animal habitats. Therefore, the aim of this study was to compare molecular techniques for detecting C. burnetii DNA in ticks.
Methods: In total, 169 ticks from wild animals and cattle in wildlife conservancies in northern Kenya were screened for C. burnetii DNA using a conventional PCR (cPCR) and two field-friendly techniques: Biomeme’s C. burnetii qPCR Go-strips (Biomeme) and a new C. burnetii PCR high-resolution melt (PCR-HRM) analysis assay. Results were evaluated, in the absence of a gold standard test, using Bayesian latent class analysis (BLCA) to characterize the proportion of C. burnetii positive ticks and estimate sensitivity (Se) and specificity (Sp) of the three tests.
Results: The final BLCA model included main effects and estimated that PCR-HRM had the highest Se (86%; 95% credible interval: 56–99%), followed by the Biomeme (Se = 57%; 95% credible interval: 34–90%), with the estimated Se of the cPCR being the lowest (24%, 95% credible interval: 10–47%). Specificity estimates for all three assays ranged from 94 to 98%. Based on the model, an estimated 16% of ticks had C. burnetii DNA present.
Discussion: These results reflect the endemicity of C. burnetii in northern Kenya and show the promise of the PCR-HRM assay for C. burnetii surveillance in ticks. Further studies using ticks and wild animal samples will enhance understanding of the epidemiological role of ticks in Q fever.
1 Introduction
Coxiella burnetii (C. burnetii) is a small gram-negative bacterium and the etiological agent of Q fever, a zoonotic infection with distribution throughout most of the world (1). Although rarely fatal in humans, the disease may lead to substantial morbidity and can be highly debilitating, even with treatment (2). Infections also result in significant economic losses associated with control and treatment of the disease in domestic animals as well as production losses resulting from poor reproductive performance (3). Human Q fever cases are commonly associated with livestock contact, such as the notable Q fever epidemic of more than 4,000 cases in The Netherlands during 2007–2010 (1) that originated from a C. burnetii strain in goats (4, 5). However, an increasing number of global reports link human Q fever cases to contact with wild animals (6). For instance, a capybara (7), and three-toed sloth (Bradypus tridactylus) (8) were epidemiologically linked to community-acquired pneumonia caused by C. burnetii infection in French Guiana (7–10). In another study, two cases of Q fever in South Wales, Australia, were linked to handling kangaroo joeys, and mowing lawns contaminated with kangaroo feces (11). Clinical disease associated with C. burnetii infection has also been reported in wild animals, including critically endangered species such as the dama gazelle (Nanger dama mhorr) and saiga antelope (Saiga tatarica tatarica) (12, 13). Knowledge of the clinical outcome of coxiellosis in wildlife is still limited, however placentitis and reproductive failure have been reported, raising concerns regarding the impact of C. burnetii on conservation breeding programs (14). Despite the increasing importance of coxiellosis in wild animals and the recognized risk to human health, study of the disease in wild animals and their environment has been largely neglected (6).
In Kenya, Q fever is ranked among the top 10 priority zoonotic diseases (15). A recent systematic review suggested that both human and animal C. burnetii infections are largely unrecognized and therefore underestimated due to limited diagnostic capacity at remote satellite laboratories (16). The review also highlighted that epidemiologic studies in high-risk regions, where there is increased livestock-wildlife interactions, are required to improve our understanding of the role that wild animals play in Q fever outbreaks (16). Previously, studies on Q fever in Kenya have focused on livestock (17–22), humans (23–25), or both (26–28), while only a few studies addressed C. burnetii infections in wild animals and their environment (29, 30). Active surveillance programs for wild animal diseases are expensive, logistically difficult, and may result in limited sample sizes, which could underestimate the abundance of C. burnetii (14, 31).
An alternative approach to surveillance is to screen disease vectors, such as ticks, to estimate C. burnetii abundance in an ecosystem (32). Ticks are ecological bridges for C. burnetii spread between wild animals and domestic animals (2). Ticks can get infected with C. burnetii when feeding on a bacteremic host and transmit the bacterium to a different host during subsequent feeding (33). Even if the ticks only acquire the bacterium without transmitting it, pathogen surveillance using ticks could provide insights into the presence and abundance of C. burnetii in wild animal ecosystems (34). Ticks are easy to collect and can be sampled to represent widespread geographical coverage. In known C. burnetii endemic areas, such as northern Kenya (35), tick species collected from wild animals and their environments have been found to harbor C. burnetii (20, 29, 36, 37). Furthermore, in these same regions, there was a strong correlation between C. burnetii seropositivity in livestock and their infestation with C. burnetii infected ticks (20, 21, 26). Therefore, detection of C. burnetii in ticks offers a promising approach to further Coxiella surveillance in wild animals and their ecosystems.
Therefore, the aim of this study was to compare the performance of three tests for screening tick vectors for C. burnetii. We compared (1) conventional PCR assay (cPCR), against two field-friendly techniques: (2) the C. burnetii qPCR Go-strips test (Biomeme, Philadelphia, Pennsylvania, United States) on the Biomeme Franklin™ three 9 platform (referred to here as “the Biomeme”) and (3) a C. burnetii PCR high-resolution melt (PCR-HRM) assay. Additionally, the proportion of ticks with C. burnetii DNA was used as an indicator of pathogen abundance in the ecosystem. Because a gold standard test is not available, the performance of the three assays were compared using a Bayesian latent class analysis (BLCA) to assess the feasibility of using ticks for surveillance of C. burnetii in an ecosystem.
2 Materials and methods
2.1 Tick collection, identification, and DNA extraction
This study utilized DNA from ticks whose collection and processing has been previously described (38); our study design was retrospective and data collection was opportunistic and occurred before C. burnetti DNA testing was performed. Ticks were opportunistically collected (convenience sampling) from 179 wild animals and cattle during routine veterinary interventions in wildlife conservancies within Nyeri, Meru, Laikipia, Isiolo, and Marsabit counties (northern Kenya), between May 2011 and April 2019. The ticks were collected from 13 different wild animal species, as well as cattle present in the conservancies. Wildlife species included: black rhinoceros (Diceros bicornis), African buffalo (Syncerus caffer), African elephant (Loxodonta africana), giraffe (Giraffa camelopardalis), Grévy’s zebra (Equus grevyi), hartebeest (Alcelaphus buselaphus), impala (Aepyceros melampus), leopard (Panthera pardus), lion (Panthera leo), plains zebra (Equus quagga), spotted hyena (Crocuta crocuta), white rhinoceros (Ceratotherium simum), and African wild dog (Lycaon pictus), as well as farmed Boran and zebu cattle (Bos indicus). Cattle and wild animals were visually examined for ticks during clinical interventions and, if detected, several ticks were collected from each animal and placed in a tube containing 70% ethanol for preservation of the tick DNA. Collection location, date, and host species were recorded on each tube. Tick samples were stored in a −80°C freezer until analyzed.
Field immobilizations and wild animal sample collections were conducted according to Kenya Wildlife Service standard operating procedures. No animals were specifically immobilized or handled for this study. This study was approved by the Stellenbosch University Animal Use and Care (ACU-2023-27912) and Kenya’s National Commission for Science, Technology, and Innovation (NACOSTI/P/21/8054).
For C. burnetii testing, one tick per host animal (i.e., 179 ticks total, representing 179 different individual animals) was selected. A subset of these were identified to the genus level based on metagenomics, as previously described (38). Each tick (n = 179) was placed into liquid nitrogen then homogenized in 1.5 mL microfuge tubes, containing 200 μL of 1x phosphate-buffered saline (PBS), and 150 mg of 0.1 mm and 750 mg of 2.0 mm yttria-stabilized zirconium (YSZ) oxide beads (Glen Mills, Clifton, New Jersey, United States), using a Mini-Beadbeater-16 (BioSpec, Bartlesville, Oklahoma, United States) for 1 min. Tick DNA was extracted with the Qiagen DNeasy Blood and Tissue Kit (Qiagen, Germantown, Maryland, United States) using 100 μL of the tick homogenate, according to manufacturer’s instructions. Extracted DNA was stored at −80°C prior to PCR testing. Prior to performing the PCRs, DNA quantity and quality were measured using the Qubit dsDNA High Sensitivity Assay kit (Thermofisher Scientific, Waltham, Massachusetts, United States) and the Qubit 4 fluorometer (Thermofisher Scientific), as described by the manufacturer.
2.2 Coxiella PCR detection
Each of the tick DNA samples were screened for presence of C. burnetii DNA using three separate methods: cPCR, PCR-HRM, and the Biomeme’s C. burnetii qPCR Go-strips (Biomeme). The PCR-HRM and cPCR assays were performed at the Molecular Biology and Bioinformatics Unit at the International Centre for Insect Physiology and Ecology (ICIPE, Nairobi, Kenya). Tests using the Biomeme were conducted at Mpala Research Centre (Laikipia, Kenya), following manufacturers’ instructions. Primers utilized in all PCRs targeted the IS1111 transposase elements of the C. burnetii genome (Table 1).
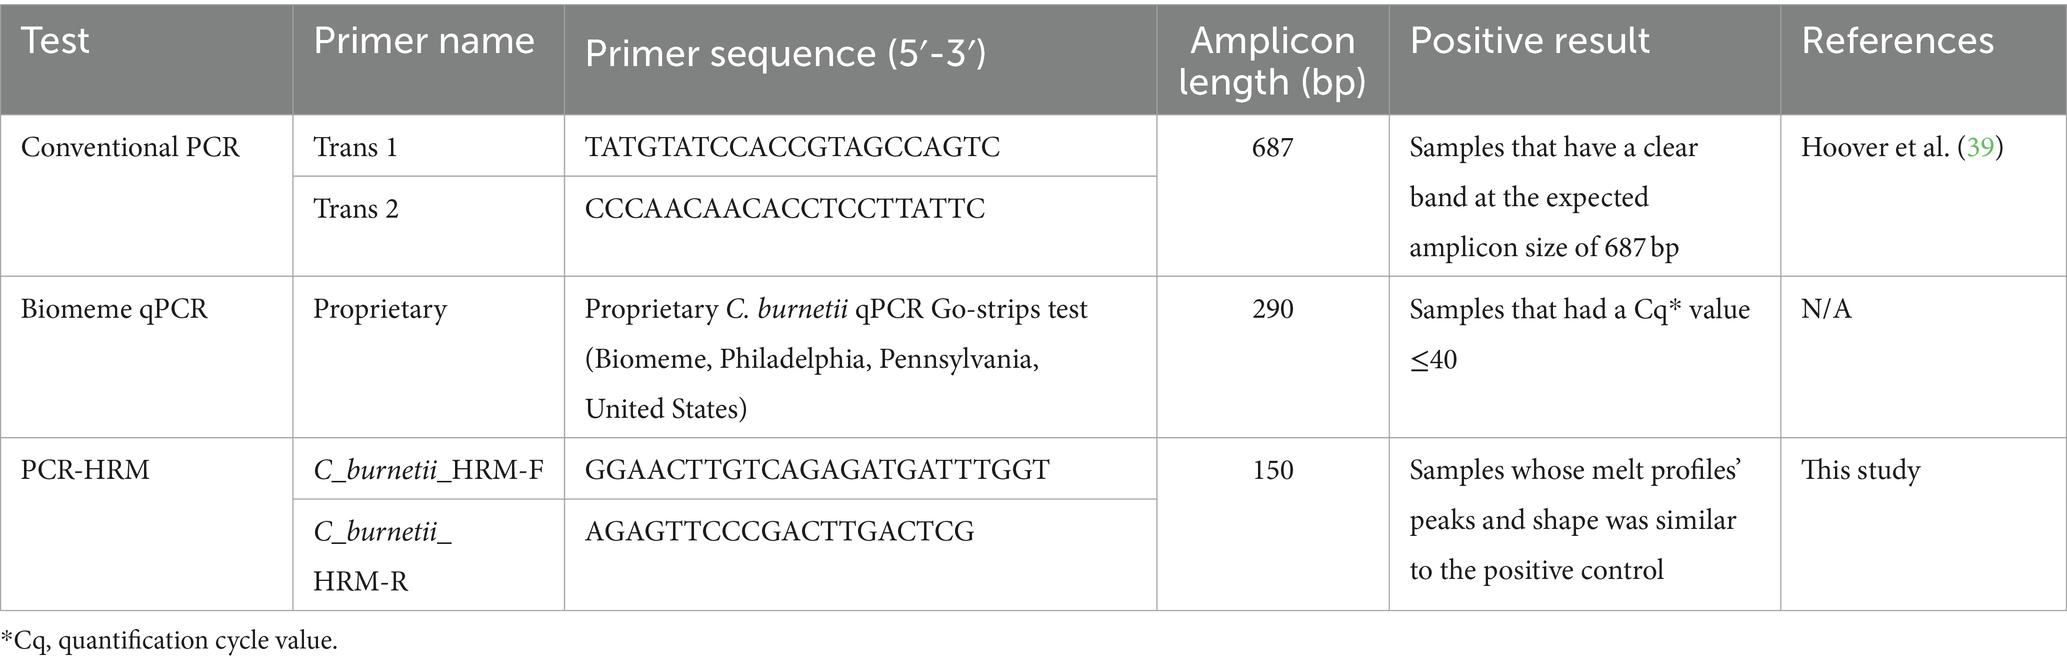
Table 1. Test type, primer sequence and criteria for positive results for the three evaluated Coxiella burnetii PCR tests targeting the IS1111 transposase elements in the C. burnetii genome, using DNA from ticks collected from wildlife and cattle in Kenya between May 2011 and 2019.
2.2.1 Coxiella burnetii conventional PCR
This PCR assay included a touch-down PCR amplification, followed by 1.5% agarose gel electrophoresis to visualize the PCR product. Primers used were trans 1 and trans 2 (Table 1), which amplified a 687 bp fragment of the repetitive, transposon-like element, as described previously (40).
The 11 μL PCR mixture consisted of 0.5 μL of each forward and reverse primer at a final reaction concentration of 0.5 μM, 2 μL of template DNA, 2 μL of HOT FIREPol® Blend Master Mix (Solis BioDyne, Tartu, Estonia), and 6 μL of nuclease free water. Known C. burnetii positive tick DNA samples and nuclease free water were included on each plate as a positive control and no template control, respectively. The Supercycler Trinity thermocycler (Kyratec, Queensland, Australia) was used for the PCR. The cycling conditions included an initial enzyme activation step at 95°C for 12 min. This was followed by 5 cycles of denaturation at 95°C for 30 s, an annealing step where the temperature was lowered by 1°C between successive steps from 66°C to 61°C for 45 s, and extension at 72°C for 1 min. An additional 35 cycles consisting of denaturation at 95°C for 30 s, annealing at 61°C for 30 s, extension at 72°C for 45 s, and a final extension step at 72°C for 7 min were added. The PCR products were stained with ethidium bromide and loaded onto a 1.5% agarose gel submerged in a TAE (40 mM Tris-acetate, 1 mM EDTA) buffer-filled electrophoresis chamber set at 97 volts for 42 min. The sizes of the PCR products were determined using an O’rangeRuler 100 bp DNA ladder (Thermofisher Scientific). Images of the gels were recorded.
Positive samples had a clear 687 bp band and were reamplified using trans 1 and trans 2 primers with cycling conditions as described in the previous paragraph (40). The amplicons were then cleaned with the ExoSAP-IT PCR Product Cleanup kit (Affymetrix, Santa Clara, California, United States), according to manufacturer’s instructions. The purified amplicons were submitted for Sanger sequencing at Macrogen (Amsterdam, The Netherlands) to confirm the identity of the amplified sequences.
2.2.2 Biomeme Coxiella burnetii Go-strip qPCR assay
The C. burnetii Go-strips (Biomeme) were supplied as individually packaged three-well qPCR test strips. Each three-well qPCR test strip contained lyophilized master mix, primers, and probes. The primers used for this assay target a 290 bp fragment of the IS1111 transposase elements in the genome of C. burnetii (Sarah Senula, pers. comm., February 8, 2022).
The Biomeme C. burnetii Go-strip qPCR assays were performed according to the manufacturer’s instructions. In brief, 20 μL of tick DNA eluent was transferred into a single well of the Biomeme Go-Strip and a positive control included for each batch of samples. Biomeme provided a synthetic C. burnetii positive control on Whatman paper punches. Each punch was resuspended by adding 400 μL of TAE buffer to the punch and incubating overnight at room temperature. A 20 μL aliquot of the positive control eluent represented 5 copies per reaction. The Go-Strips were loaded into the Biomeme Franklin™ three9 Real-Time PCR Thermocycler and the Biomeme Go application was launched on the connected Android phone (Samsung s8+, Samsung, Ridgefield Park, New Jersey, United States). Using the Biomeme Go application, each sample was individually labeled with a sample identifier, and the QR code on the C. burnetii Go strips pouch scanned to launch the Biomeme C. burnetii qPCR cycling parameters. The PCR cycle consisted of an initial denaturation step for 1 min at 95°C, followed by 45 cycles for 1 s at 95°C, and annealing for 20 s at 60°C. The Biomeme Go mobile application provided views of amplification plots of raw data in real time. Samples positive for C. burnetii DNA showed fluorescence on the green channel and the Cq value per sample was also recorded. Samples with a Cq value ≤ 40 were categorized as positive.
2.2.3 Coxiella burnetii PCR-HRM analysis
The PCR-HRM assay involved a PCR step followed by HRM analysis, using C_burnetii_HRM-F and C_burnetii_HRM-R primers, designed using Geneious Prime software (Biomatters, Inc., San Diego, California, United States) to cross sequences in which Coxiella-endosymbiont sequences have insertions and deletions, thus preventing amplification of Coxiella-endosymbionts. The amplification regions were identified through alignments of nucleotide sequences available in the GenBank database, ensuring that the 3′ regions of the primers were specific to C. burnetii and not the closely related Coxiella endosymbionts (Supplementary Figure S1). The specificity of each primer set was evaluated using the Basic Local Alignment Search Tool (BLAST) from the National Center for Biotechnology Information (NCBI) database. The primer sets were adjusted to achieve optimal annealing temperatures and amplification efficiency. Specificity of the designed primers were tested using samples confirmed to be positive for C. burnetii, Coxiella endosymbionts, and nuclease free water, as a negative control.
The PCRs were conducted in 11 μL reaction volumes consisting of 2 μL of HOTFIREPol EvaGreen HRM mix (Solis BioDyne), 0.5 μL of each forward and reverse primer at a final reaction concentration of 0.5 μM, 2 μL of template DNA, and 6 μL of nuclease free water. Known C. burnetii positive tick DNA samples and nuclease free water were included in each test batch as a positive control and no template control, respectively. A HRM-capable MIC-4 thermocycler (Bio Molecular Systems, Upper Coomera, Queensland, Australia) was used for DNA amplification. The PCR cycling conditions included an initial enzyme activation step at 95°C for 12 min, followed by 40 cycles of denaturation at 95°C for 30 s, annealing at 62°C for 25 s, extension at 72°C for 20 s, and a final extension at 72°C for 7 min. The PCR was immediately followed by the melt curve analysis during which amplicons were gradually melted at 0.1°C increments from 75°C to 95°C, with fluorescence acquisition every 0.5 s. The Mic qPCR Software automatically generated raw graphs of fluorescence against temperature (°C) from the fluorescence acquisition data. The samples’ melt profiles were compared to that of the positive control, based on their melt-curve peaks and curve shapes. Positive samples showed melt profiles with peaks and shapes that aligned with the positive control. To confirm HRM based species identification, the positive samples were reamplified by conventional PCR using COX-F (GTCTTAAGGTGGGCTGCGTG) and COX-R (CCCCGAATCTCATTGATCAGC) primers, targeting a 295 bp fragment of the IS1111 transposase elements in the C. burnetii genome (41). The cycling parameters were programed as previously described in the conventional PCR section. The PCR products were visualized as described above. All samples with 295 bp bands were considered positive, then purified with the ExoSAP-IT PCR Product Cleanup kit (Affymetrix) and submitted for Sanger sequencing at Macrogen to confirm the identity of the amplified sequences.
2.3 Data and statistical analyses
Chromatogram files were imported into Geneious Prime software version 2022 (Biomatters Inc.) for trimming, editing, and alignment. To generate consensus sequences, the study sequences were queried against known sequences in GenBank using the Basic Local Alignment Search Tool to reveal their identity and relation to currently deposited sequences (42). The study sequences were then aligned to all available C. burnetii sequences in GenBank using the MAFFT plugin (Biomatters Inc.) in Geneious Prime software (Biomatters Inc., version 2022).
The numbers of C. burnetii DNA positive and negative ticks were summarized for each method and positive results were reported as proportions of the total number of samples tested. The number of positive and negative results were also summarized by tick genus and host species. Agreement between the three possible pairs of PCR tests was calculated with Cohen’s Kappa coefficient using the psych package (43) in R statistical software (44). A Kappa coefficient close to 1 indicated very good agreement, while 0 indicated poor agreement between tests (45).
2.3.1 Bayesian latent class analysis
A Bayesian latent class analysis (BLCA) was used to estimate the proportion of ticks with C. burnetii DNA and evaluate the performance of the three tests in the absence of a gold standard reference test. This analytic approach is well-established in human medicine and veterinary science (46–48) and the World Organization for Animal Health has accepted this method for diagnostic test validation (49). A checklist for BLCA reporting standards (47) is included in Supplementary Appendix S2.
For the present study, a three-test, one population model was used with the latent class defined as whether a tick is positive or negative for C. burnetii DNA, as an indicator of C. burnetii presence and abundance in the ecosystem. This is a similar approach as previous studies that have shown density estimates of infected ticks are better predictors of the likelihood of Lyme disease occurrence than pathogen or tick abundance alone (50). The model used in the current study included binary test outcomes from the cPCR, Biomeme Go-Strips, and PCR-HRM assays. Observations from each tick were included in the analysis if results were available for all three tests. The model was structured assuming that the different combinations of positive and negative test results followed a multinomial distribution. The analysis was implemented in OpenBugs within the R statistical software (51) and RStudio environments (52) using packages r2OpenBugs (53). Programming code for the model implementation was adapted from Cheung et al. (48) and Salgadu et al. (54) and is provided in Supplementary Appendix S3. The model was fit using non-informative priors for Bayesian estimates of Se and Sp due to either limited data (cPCR) or no published data (Biomeme and PCR-HRM) on C. burnetii detection in African ticks.
Bayesian estimates of the proportion of ticks with C. burnetii DNA, Se, and Sp were generated using a Markov Chain Monte Carlo algorithm. A model was fit to the data that assumed all tests were independent. While all three PCR tests are based on the detection of the IS1111 transposase elements in the C. burnetii genome, the primers used anneal and amplify different segments and lengths of the IS1111 transposase elements. Therefore, these were considered independent detection methods. Three separate chains were run for 30,000 iterations, with the first 10,000 discarded as “burn-in” based on examination of trace plots. Model convergence and unimodality were assessed by visual inspection of the trace plots, autocorrelation plots, and posterior median distributions of each parameter with the R packages “coda” (55) and “mcmplots” (56). Posterior median estimates of each parameter and their corresponding 95% credible intervals were reported.
3 Results
Ticks were identified to the genus level in 67 out of 179 samples; 112 ticks were not assigned a genus since metagenomic data were unavailable. The majority of identified ticks were Rhipicephalus spp. (64/67), and 3/67 of the ticks belonged to the Amblyomma genus. Extracted DNA quantity from ticks ranged between 0.03 and 116 ng/μL. Samples from 179 ticks were tested by conventional PCR and the PCR-HRM techniques, while 169 samples were tested on the Biomeme (due to limited availability of kits). Summaries of test results by source host species and tick genera are presented in Supplementary Table S1. In total, 9/179 (5.0%) ticks tested positive for C. burnetii DNA by cPCR, 21/169 (12.4%) tested positive with the Biomeme PCR, and 32/179 (17.9%) tested positive by PCR-HRM. Frequency distributions of positive test combinations are shown in Table 2. A figure showing the melt profiles of samples used to test the specificity of the C_burnetii_HRM-F and C_burnetii_HRM-R primers is included in Supplementary Figure S2.
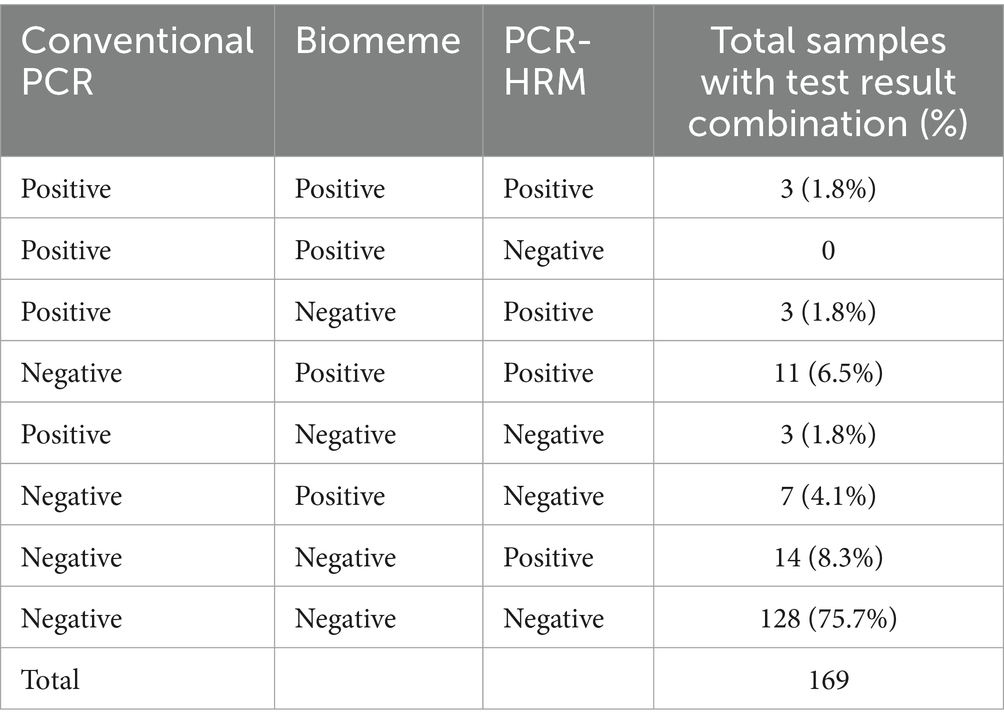
Table 2. Results for 169 tick DNA samples tested for Coxiella burnetii by conventional PCR, Biomeme’s commercially available C. burnetii Go-Strip assay, and a C. burnetii PCR-high resolution melt (HRM) technique.
There was moderate agreement beyond what would be expected by chance between the PCR-HRM and the Biomeme test results (Kappa = 0.46; 95% CI: 0.28–0.64), while agreement was fair between the cPCR and PCR-HRM results (Kappa = 0.23; 95% CI: 0.053–0.41) and only slight agreement between the cPCR and Biomeme results (Kappa = 0.14; 95% CI: 0.061–0.33).
The BLCA model was fit to the 169 data points for tick samples with a test result for all three assays. Posterior median estimates and 95% credibility intervals of Se, Sp, and the proportion of ticks with C. burnetii DNA are shown in Table 3. The model estimated that the PCR-HRM assay had the highest Se (86%; 95% credible interval: 56–99%) followed by the Biomeme (Se =57%; 95% credible interval: 34–90%), and the lowest Se for the cPCR (24, 95% credible interval: 10–47%). Specificity estimates ranged from 94 to 98% for all three assays. The estimated proportion of ticks with C. burnetii DNA was 16% (95% credible interval: 8–28%).
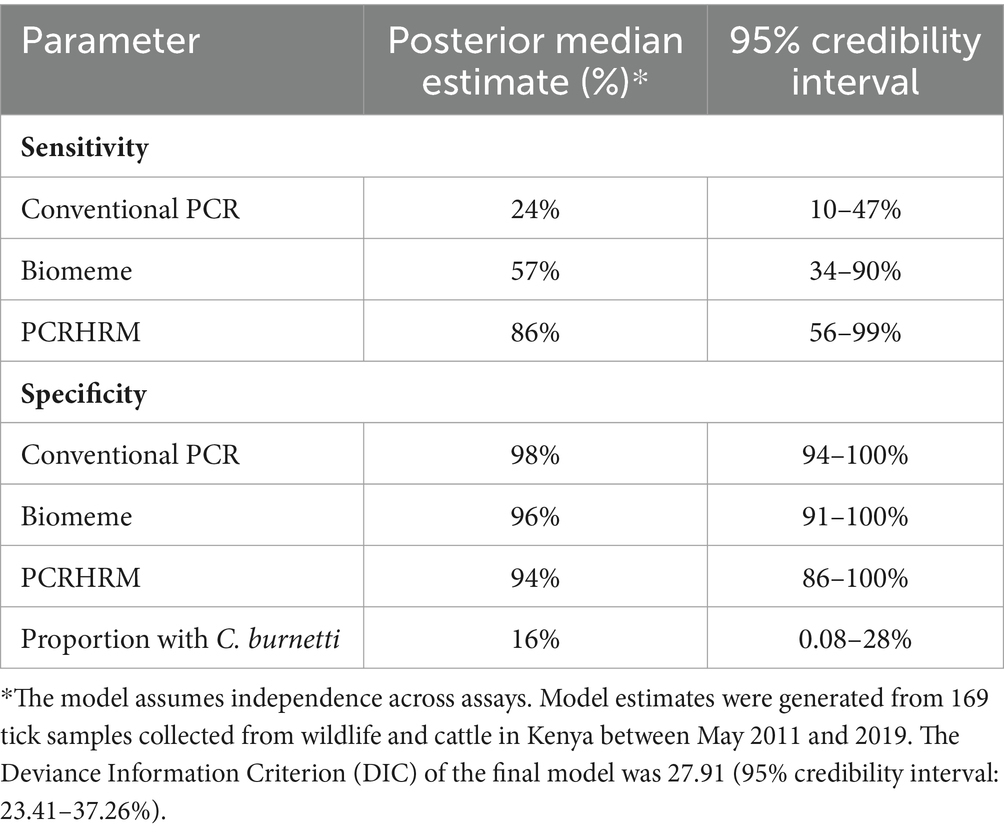
Table 3. Results from the Bayesian latent class model estimating the sensitivity and specificity of three assays (conventional PCR, Biomeme’s commercially available C. burnetii Go-Strip Assay, and a C. burnetii PCR-HRM technique) and the estimated proportion of ticks carrying C. burnetii.
4 Discussion
The pathogen C. burnetii remains endemic in rural regions of northern Kenya, posing a risk to both human and animal health (35). Although ticks have been shown to play a role in C. burnetii transmission, their use for non-invasive pathogen surveillance in these ecosystems, shared by livestock, wildlife, and humans, has been largely neglected due to limited diagnostic capability at remote satellite laboratories (2, 16, 57). Therefore, the goal in the present study was to fill this gap by using BLCA to compare cPCR, the Biomeme, and PCR-HRM assays, using tick DNA, to provide information on detection methods, presence and abundance of C. burnetii in wild animal conservancies in northern Kenya. The study found that all three assays detected C. burnetii DNA in whole tick DNA extracts, although a higher Se was found with the PCR-HRM and Biomeme assays at 86, and 57%, respectively, compared to the cPCR (24%). All three assays had high Sp (94–98%), therefore, the assays had a high probability of identifying truly negative ticks. Using BLCA, the estimated proportion of ticks that were positive was 16%, which demonstrated the feasibility of detecting C. burnetii using non-invasively collected samples for ecosystem surveillance and infection risk evaluation.
All three PCR methods detected C. burnetii positive ticks, however, the Se of the assays varied. The PCR-HRM assay had the highest Se, estimated at 86%, which supports its selection as a screening test for identifying C. burnetii positive ticks. Although the Biomeme assay had a lower Se of 57%, it might be a more convenient method for screening in remote areas. The currently used cPCR assay had a low Se (24%) when used with tick samples, which could be attributed to differences between cPCR and qPCR assays (58). In general, cPCR assays use longer amplicons and are qualitative, whereas qPCR assays are quantitative and use shorter amplicons, which ensure higher PCR efficiency and improved sensitivity (58, 59).
While PCR-HRM was found to be more sensitive, both the Biomeme and PCR-HRM had sensitivities and specificities higher than the currently used cPCR. Both the Biomeme and PCR-HRM platforms use portable, battery charged thermocyclers, making them field deployable and more reliable for remote satellite laboratories where power supply may be unreliable. At the time of this report, the Biomeme Franklin thermocycler and the MIC-4 thermocycler were similarly priced; however, the running cost for the Biomeme was approximately tenfold higher in our setting, compared to running the PCR-HRM using the MIC-4 thermocycler. Costs and availability will vary depending on setting and likely change over time. Besides cost, both assays offer advantages in different settings. The PCR-HRM approach is better suited for high throughput because the MIC-4 thermocycler can accommodate batches of 48 samples, compared to the Biomeme Franklin three 9 limit of 3 samples with 3 targets (maximum of nine tests per run). Biomeme’s lyophilized master mixes and probes are advantageous in truly field-forward situations, where cold storage facilities are unavailable, and where the operator may have limited technical experience. Based on findings from the present study, the cPCR assay using trans 1 and trans 2 primers for C. burnetii screening, was not an ideal platform to detect C. burnetii DNA in whole tick extracts. The differences in primer lengths across the PCR tests could influence the detection of C. burnetii DNA. The longer primer length in the cPCR compared to the shorter lengths in Biomeme qPCR and PCR-HRM might impact the sensitivity and specificity of each test. This variation is intrinsic to the nature of the primers and was a significant factor in our decision to compare these methods. Our results should be interpreted with this consideration in mind, and further studies could explore the impact of primer length on detection performance more comprehensively. Additional studies should evaluate the performance of cPCR using shorter primers such as those reported by Klee et al. (41). Ultimately, the choice of diagnostic test should be based on practical considerations that include the goals of the surveillance program as well as available resources (60).
Estimated specificity was high for all three tests, with the Sp central estimates ranging from 94% (PCR-HRM) to 98% (cPCR). Other reports of Sp for C. burnetii detection by Biomeme or PCR-HRM were not available for comparison. Test specificity describes the proportion of individuals without infection who are correctly identified as negative by a screening test. A high test specificity is especially important when there is low pathogen prevalence. Therefore, the C. burnetii PCR-HRM assay could be useful for surveillance in low prevalence or negative populations.
In this study, C. burnetii DNA was successfully detected in ticks collected from both wild animals and cattle, emphasizing the value of using tick samples for disease surveillance in areas where C. burnetii is endemic. Our model estimated that 16% of ticks collected tested positive for C. burnetii DNA, which is consistent with the endemic status of the pathogen in this area. Serological surveys in northern Kenya have reported seroprevalence rates of 10.3% in wild animals (30), 12.8–83.7% in livestock (19, 20, 28, 35) and 16.2–24.4% in humans (23, 35). It is unknown how accurately these estimates of C. burnetii in ticks translate into true infection prevalence due to the (inherently biased) opportunistic nature of sampling. In addition, positive tick samples may cluster by host species. Therefore, we exercise caution in interpreting our findings of C. burnetii in ticks as a true prevalence. It does, however, offer insight into the endemicity of C. burnetti in the ecosystem and the usefulness of ticks in revealing this burden.
Ticks can serve as indicators of C. burnetii presence in an ecosystem due to their involvement in the sylvatic transmission cycle (2, 14), however, their utility for disease surveillance is not well-established. Ndeereh et al. (30) reported the prevalence of C. burnetii in ticks collected from wild animals in Laikipia, Kenya, to be 0.54% (4/137 tick pools). In contrast, a study of ticks collected from ruminants in South Africa detected varying levels of zoonotic pathogens, including 7% positivity for C. burnetii DNA (61). This finding suggests that ticks may offer an advantageous and alternative sample type for surveillance of C. burnetii. They are widely distributed and can provide a non-invasive means of detecting pathogens, as shown in other studies (19, 29, 62–64). Validated methods to collect ticks from the environment already exist (65, 66) and they can facilitate widespread geographic coverage. This approach may provide insight on the C. burnetii status in a region without the need to handle individual animals, restrict sampling activities to culling/hunting seasons, or rely solely on opportunistic post-mortem examinations of wild animals.
Detection of C. burnetii in ticks may vary due infection prevalence in different hosts, sampled populations or environments, tick collection procedures, laboratory processing, and screening methods. Previously, studies have relied on cPCR for C. burnetti DNA detection in ticks, which the current study found lacking in sensitivity. Therefore, previous studies may have led to an underestimation and under recognition of the role of ticks in C. burnetii epidemiology. Further studies using larger numbers of ticks that represent multiple animal populations and incorporate more sensitive detection methods, such as the PCR-HRM assay, would improve estimates of true C. burnetii burden and could elucidate drivers of variability in C. burnetii DNA detection in ticks.
Since the primary goal of this study was to compare available detection platforms, Bayesian latent class analysis was used to estimate test performance of three C. burnetii PCR methods for detection in ticks. This analytic approach was selected since it does not depend on gold standard test results and has been increasingly used to evaluate and compare diagnostic tests (48). In the present study, a single population model was applied (48) and we assumed conditional independence of tests. This assumption was based on the three diagnostic assays using different primers and amplifying different segments of the IS1111 transposase elements in the C. burnetii genome. Models that incorporate covariance (non-independence of assays) could be considered; however, in the present study, we did not have sufficient sample size or additional populations to fit covariance models based on recommended guidelines (48). Repeated studies with larger sample sizes, and multiple comparison populations, could address this limitation as well as reduce the variability in model estimates (67). As knowledge on these assays advance, the inclusion of prior knowledge (including the estimates published herein) into the Bayesian modeling approach will improve inferences.
We acknowledge that there were limitations in this study. First, the estimates of test performance did not incorporate screening of tick pools (usually 3–5 adult ticks or 10 nymphs per pool) (68), which could be a more economic option for screening (48, 69). Therefore, future studies should evaluate test performance using a pooled testing approach. Secondly, the primer target (IS1111 insertion sequence) and length (290 bp) used in the Biomeme assay were known; however, the specific primer sequence was unavailable since it is proprietary. Therefore, confirmatory sequencing for C. burnetii could only be conducted using amplicons re-amplified by cPCR. A notable limitation was the variation in primer lengths among the PCR tests. While each test targeted different segments of the IS1111 transposase elements in the C. burnetii genome and was thus considered an independent detection method, the differences in primer lengths (687 bp for cPCR, 290 bp for Biomeme qPCR, and 150 bp for PCR-HRM) could introduce variability in test performance. Future research should aim to standardize primer lengths to minimize this variability and enhance the comparability of different PCR methods. Finally, the three assays were assessed using tick DNA samples, which are distinct from clinical samples in that they may contain Coxiella-like endosymbionts (2). These endosymbionts are solely found in ticks, where they enhance fitness, and are genetically related to C. burnetii (2). Consequently, they may be detected by certain PCR assays (based on primers) and could lead to biased estimates of C. burnetii abundance in an ecosystem (70). Future studies should determine whether the three assays perform differently when applied to clinical samples, where endosymbionts would not affect assay interpretation and infection burden can be more directly estimated.
5 Conclusion
The findings from this study demonstrate the value of using ticks from wildlife and cattle to detect the presence of C. burnetii in an ecosystem. A comparison of PCR assays showed that the PCR-HRM is a suitable screening test for C. burnetii using ticks; this test has good performance, is field-friendly, and delivers rapid results. While the PCR-HRM had higher Se compared to the Biomeme and cPCR, the Biomeme assay offers some advantages in certain settings. Findings from this study provide a first step to improve feasibility of noninvasive C. burnetii surveillance in ecosystems with human-wildlife-livestock interfaces. Future studies should evaluate these newer assays using multiple populations, different sample types, and similar BLCA methods.
Data availability statement
All relevant data are contained within the article. The original contributions presented in the study are included in the article/Supplementary material, further inquiries can be directed to the corresponding author. The sequence data have been deposited in the European Nucleotide Archive (ENA) at EMBL-EBI under accession number PRJEB67399 (https://www.ebi.ac.uk/ena/browser/view/PRJEB67399).
Ethics statement
The animal study was approved by Stellenbosch University Animal Use and Care (ACU-2023-27912) and Kenya’s National Commission for Science, Technology, and Innovation (NACOSTI/P/21/8054). The study was conducted in accordance with the local legislation and institutional requirements.
Author contributions
MK: Software, Project administration, Writing – review & editing, Writing – original draft, Visualization, Methodology, Investigation, Formal analysis, Data curation, Conceptualization. CW: Writing – review & editing, Writing – original draft, Visualization, Supervision, Software, Methodology, Formal analysis, Data curation. WG: Validation, Writing – review & editing, Writing – original draft, Visualization, Supervision, Software, Methodology, Investigation, Formal analysis, Data curation, Conceptualization. MMu: Visualization, Validation, Investigation, Writing – review & editing, Resources, Methodology, Data curation. JV: Writing – review & editing, Visualization, Validation, Supervision, Software, Resources, Methodology, Investigation, Funding acquisition, Formal analysis, Data curation. DG: Writing – review & editing, Visualization, Validation, Software, Methodology, Investigation, Formal analysis, Data curation. RK: Writing – review & editing, Visualization, Validation, Software, Methodology, Investigation. MF: Writing – review & editing, Visualization, Validation, Supervision, Software, Resources, Methodology, Investigation, Formal analysis, Data curation. EF: Supervision, Writing – review & editing, Visualization, Validation, Software, Methodology, Investigation, Formal analysis, Data curation. DZ: Writing – review & editing, Visualization, Validation, Supervision, Resources, Project administration, Methodology, Investigation, Funding acquisition, Formal analysis, Conceptualization. Y-ML: Writing – review & editing, Visualization, Validation, Supervision, Software, Resources, Project administration, Methodology, Investigation, Funding acquisition, Data curation, Conceptualization. MMi: Writing – review & editing, Writing – original draft, Visualization, Validation, Supervision, Software, Resources, Project administration, Methodology, Investigation, Funding acquisition, Formal analysis, Data curation, Conceptualization.
Funding
The author(s) declare that financial support was received for the research, authorship, and/or publication of this article. MK received support from the EcoHealth Alliance’s 2021 EcoHealthNet research exchange and virtual workshop themed, “Navigating the Age of Pandemics.” MMi and WG were partially supported by the South African government through the South African Medical Research Council; the National Research Foundation South African Research Chair Initiative (Grant #86949); and Wellcome Trust (grant number 222941/Z/21/Z). This work was also partially supported by the PrePARE4VBD project, funded by the European Union’s Horizon 2020 research and innovation program (European Research Council (ERC) under the European Union’s Horizon 2020 research and innovation program; Euratom research and training program 2019–2020) under grant agreement No. 101000365. RK received additional support from the German Academic Exchange Service (DAAD) through the icipe ARPPIS-DAAD scholarship and through a UP post-graduate bursary. We also acknowledge icipe institutional funding from the Swedish International Development Cooperation Agency (SIDA), the Swiss Agency for Development and Cooperation (SDC), the Federal Democratic Republic of Ethiopia, and the Government of the Republic of Kenya. MK and Y-ML were partially supported by the US Army Medical Research and Development Command under Contract No. W81XWH-21-C-0001, W81XWH-22-C-0093, and HT9425-23-C-0059. The Armed Forces Health Surveillance Division (AFHSD), Global Emerging Infections Surveillance (GEIS) branch also provided funding support for this work (ProMIS ID # P0053_24_WR). Material has been reviewed by the Walter Reed Army Institute of Research. There is no objection to its presentation and/or publication. The opinions or assertions contained herein are the private views of the author(s), and are not to be construed as official, or as reflecting true views of the Department of the Army or the Department of Defense, or any of the other funders.
Acknowledgments
We acknowledge the administrative support of the staff at Mpala Research Centre. Elizabeth Cook and her team at the International Livestock Research Institution (ILRI), Nairobi, for providing extracted tick DNA. Finally, we thank the Kenyan wildlife conservancies for allowing MMu to conduct the original tick collections on their lands.
Conflict of interest
The authors declare that the research was conducted in the absence of any commercial or financial relationships that could be construed as a potential conflict of interest.
The author(s) declared that they were an editorial board member of Frontiers, at the time of submission. This had no impact on the peer review process and the final decision.
Publisher’s note
All claims expressed in this article are solely those of the authors and do not necessarily represent those of their affiliated organizations, or those of the publisher, the editors and the reviewers. Any product that may be evaluated in this article, or claim that may be made by its manufacturer, is not guaranteed or endorsed by the publisher.
Supplementary material
The Supplementary material for this article can be found online at: https://www.frontiersin.org/articles/10.3389/fvets.2024.1396714/full#supplementary-material
References
1. Van Der Hoek, W, Morroy, G, Renders, NHM, Wever, PC, Hermans, MHA, Leenders, ACAP, et al. Epidemic Q fever in humans in the Netherlands. Adv Exp Med Biol. (2012) 984:329–64. doi: 10.1007/978-94-007-4315-1_17
2. Duron, O, Sidi-Boumedine, K, Rousset, E, Moutailler, S, and Jourdain, E. The importance of ticks in Q fever transmission: what has (and has not) been demonstrated? Trends Parasitol. (2015) 31:536–52. doi: 10.1016/j.pt.2015.06.014
3. Van Asseldonk, MAPM, Prins, J, and Bergevoet, RHM. Economic assessment of Q fever in the Netherlands. Prev Vet Med. (2013) 112:27–34. doi: 10.1016/J.PREVETMED.2013.06.002
4. Roest, HIJ, Tilburg, JJHC, Van Der Hoek, W, Vellema, P, Van Zijderveld, FG, Klaassen, CHW, et al. The Q fever epidemic in the Netherlands: history, onset, response and reflection. Epidemiol Infect. (2011) 139:1–12. doi: 10.1017/S0950268810002268
5. De Rooij, MMT, Van Leuken, JPG, Swart, A, Kretzschmar, MEE, Nielen, M, De Koeijer, AA, et al. A systematic knowledge synthesis on the spatial dimensions of Q fever epidemics. Zoonoses Public Health. (2019) 66:14–25. doi: 10.1111/zph.12534
6. González-Barrio, D, and Ruiz-Fons, F. Coxiella burnetii in wild mammals: a systematic review. Transbound Emerg Dis. (2019) 66:662–71. doi: 10.1111/TBED.13085
7. Christen, JR, Edouard, S, Lamour, T, Martinez, E, Rousseau, C, de Laval, F, et al. Capybara and brush cutter involvement in Q fever outbreak in remote area of Amazon rain forest, French Guiana. Emerg Infect Dis. (2020) 26:993–7. doi: 10.3201/EID2605.190242
8. Davoust, B, Lou, MJ, Pommier de Santi, V, Berenger, JM, Edouard, S, and Raoult, D. Three-toed sloth as putative reservoir of Coxiella burnetii, Cayenne, French Guiana. Emerg Infect Dis. (2014) 20:1760–1. doi: 10.3201/EID2010.140694
9. Pommier de Santi, V, Briolant, S, Mahamat, A, Ilcinkas, C, Blanchet, D, de Thoisy, B, et al. Q fever epidemic in Cayenne, French Guiana, epidemiologically linked to three-toed sloth. Comp Immunol Microbiol Infect Dis. (2018) 56:34–8. doi: 10.1016/J.CIMID.2017.12.004
10. Epelboin, L, Mahamat, A, Bonifay, T, Demar, M, Abboud, P, Walter, G, et al. Q fever as a cause of community-acquired pneumonia in French Guiana. Am J Trop Med Hyg. (2022) 107:407–15. doi: 10.4269/AJTMH.21-0711
11. Australian Government Department of Health . Q fever and contact with kangaroos in New South Wales. Commun Dis Intell. (2016) 40:1–2.
12. García, E, Espeso, G, Fernández, R, Gómez-Martín, Á, Rodríguez-Linde, JM, and de la Fe, C. Coxiella burnetii detected in three species of endangered north African gazelles that recently aborted. Theriogenology. (2017) 88:131–3. doi: 10.1016/J.THERIOGENOLOGY.2016.09.019
13. Orynbayev, MB, Beauvais, W, Sansyzbay, AR, Rystaeva, RA, Sultankulova, KT, Kerimbaev, AA, et al. Seroprevalence of infectious diseases in saiga antelope (Saiga tatarica tatarica) in Kazakhstan 2012-2014. Prev Vet Med. (2016) 127:100–4. doi: 10.1016/J.PREVETMED.2016.03.016
14. Celina, SS, and Cerný, J. Coxiella burnetii in ticks, livestock, pets and wildlife: a mini-review. Front Vet Sci. (2022) 9:9. doi: 10.3389/FVETS.2022.1068129
15. Munyua, P, Bitek, A, Osoro, E, Pieracci, EG, Muema, J, Mwatondo, A, et al. Prioritization of zoonotic diseases in Kenya, 2015. PLoS One. (2016) 11:e0161576. doi: 10.1371/JOURNAL.PONE.0161576
16. Njeru, J, Henning, K, Pletz, MW, Heller, R, and Neubauer, H. Q fever is an old and neglected zoonotic disease in Kenya: a systematic review. BMC Public Health. (2016) 16:297–8. doi: 10.1186/s12889-016-2929-9
17. Muema, J, Thumbi, SM, Obonyo, M, Wanyoike, S, Nanyingi, M, Osoro, E, et al. Seroprevalence and factors associated with Coxiella burnetii infection in small ruminants in Baringo County, Kenya. Zoonoses Public Health. (2017) 64:e31–43. doi: 10.1111/ZPH.12342
18. Muturi, M, Akoko, J, Nthiwa, D, Chege, B, Nyamota, R, Mutiiria, M, et al. Serological evidence of single and mixed infections of Rift Valley fever virus, Brucella spp. and Coxiella burnetii in dromedary camels in Kenya. PLoS Negl Trop Dis. (2021) 15:e0009275. doi: 10.1371/JOURNAL.PNTD.0009275
19. Getange, D, Bargul, JL, Kanduma, E, Collins, M, Bodha, B, Denge, D, et al. Ticks and tick-borne pathogens associated with dromedary camels (Camelus dromedarius) in northern Kenya. Microorganisms. (2021) 9:1414. doi: 10.3390/MICROORGANISMS9071414
20. Larson, PS, Espira, L, Grabow, C, Wang, CA, Muloi, D, Browne, AS, et al. The sero-epidemiology of Coxiella burnetii (Q fever) across livestock species and herding contexts in Laikipia County, Kenya. Zoonoses Public Health. (2019) 66:316–24. doi: 10.1111/ZPH.12567
21. Browne, AS, Fèvre, EM, Kinnaird, M, Muloi, DM, Wang, CA, Larsen, PS, et al. Serosurvey of Coxiella burnetii (Q fever) in dromedary camels (Camelus dromedarius) in Laikipia County, Kenya. Zoonoses Public Health. (2017) 64:543–9. doi: 10.1111/zph.12337
22. Depuy, W, Benka, V, Massey, A, Deem, SL, Kinnaird, M, O’Brien, T, et al. Q fever risk across a dynamic, heterogeneous landscape in Laikipia County, Kenya. EcoHealth. (2014) 11:429–33. doi: 10.1007/s10393-014-0924-0
23. Njeru, J, Henning, K, Pletz, MW, Heller, R, Forstner, C, Kariuki, S, et al. Febrile patients admitted to remote hospitals in northeastern Kenya: Seroprevalence, risk factors and a clinical prediction tool for Q-fever. BMC Infect Dis. (2016) 16:1–15. doi: 10.1186/S12879-016-1569-0/TABLES/5
24. Cook, EAJ, de Glanville, WA, Thomas, LF, Kiyong'a, A, Kivali, V, Kariuki, S, et al. Evidence of exposure to C. burnetii among slaughterhouse workers in western Kenya. Health. (2021) 13:100305. doi: 10.1016/J.ONEHLT.2021.100305
25. Lemtudo, AP, Mutai, BK, Mwamburi, L, and Waitumbi, JN. Seroprevalence of Coxiella burnetii in patients presenting with acute febrile illness at Marigat District hospital, Baringo County, Kenya. Vet Med Sci. (2021) 7:2093–9. doi: 10.1002/VMS3.493
26. Knobel, DL, Maina, AN, Cutler, SJ, Ogola, E, Feikin, DR, Junghae, M, et al. Coxiella burnetii in humans, domestic ruminants, and ticks in rural western Kenya. Am J Trop Med Hyg. (2013) 88:513–8. doi: 10.4269/ajtmh.12-0169
27. Wardrop, NA, Thomas, LF, Cook, EAJ, de Glanville, WA, Atkinson, PM, Wamae, CN, et al. The Sero-epidemiology of Coxiella burnetii in humans and cattle, western Kenya: evidence from a cross-sectional study. PLoS Negl Trop Dis. (2016) 10:e0005032. doi: 10.1371/JOURNAL.PNTD.0005032
28. Mwololo, D, Nthiwa, D, Kitala, P, Abuom, T, Wainaina, M, Kairu-Wanyoike, S, et al. Sero-epidemiological survey of Coxiella burnetii in livestock and humans in Tana River and Garissa counties in Kenya. PLoS Negl Trop Dis. (2022) 16:e0010214. doi: 10.1371/JOURNAL.PNTD.0010214
29. Gakuya, F, Akoko, J, Wambua, L, Nyamota, R, Ronoh, B, Lekolool, I, et al. Evidence of co-exposure with Brucella spp, Coxiella burnetii, and Rift Valley fever virus among various species of wildlife in Kenya. PLoS Negl Trop Dis. (2022) 16:e0010596. doi: 10.1371/JOURNAL.PNTD.0010596
30. Ndeereh, D, Muchemi, G, Thaiyah, A, Otiende, M, Angelone-Alasaad, S, and Jowers, MJ. Molecular survey of Coxiella burnetii in wildlife and ticks at wildlife–livestock interfaces in Kenya. Exp Appl Acarol. (2017) 72:277–89. doi: 10.1007/s10493-017-0146-6
31. González-Barrio, D, Almería, S, Caro, MR, Salinas, J, Ortiz, JA, Gortázar, C, et al. Coxiella burnetii shedding by farmed red deer (Cervus elaphus). Transbound Emerg Dis. (2015) 62:572–4. doi: 10.1111/tbed.12179
32. Kazar, J . Coxiella burnetii infection. Ann N Y Acad Sci. (2005) 1063:105–14. doi: 10.1196/ANNALS.1355.018
33. Robi, DT, Demissie, W, and Temteme, S. Coxiellosis in livestock: epidemiology, public health significance, and prevalence of Coxiella burnetii infection in Ethiopia. Vet Med (Auckl). (2023) 14:145–58. doi: 10.2147/VMRR.S418346
34. Körner, S, Makert, GR, Ulbert, S, Pfeffer, M, and Mertens-Scholz, K. The prevalence of Coxiella burnetii in hard ticks in Europe and their role in Q fever transmission revisited—a systematic review. Front Vet Sci. (2021) 8:1–16. doi: 10.3389/fvets.2021.655715
35. Muema, J, Nyamai, M, Wheelhouse, N, Njuguna, J, Jost, C, Oyugi, J, et al. Endemicity of Coxiella burnetii infection among people and their livestock in pastoral communities in northern Kenya. Heliyon. (2022) 8:e11133. doi: 10.1016/J.HELIYON.2022.E11133
36. Mwamuye, MM, Kariuki, E, Omondi, D, Kabii, J, Odongo, D, Masiga, D, et al. Novel Rickettsia and emergent tick-borne pathogens: a molecular survey of ticks and tick-borne pathogens in Shimba Hills National Reserve, Kenya. Ticks Tick Borne Dis. (2017) 8:208–18. doi: 10.1016/j.ttbdis.2016.09.002
37. Oundo, JW, Villinger, J, Jeneby, M, Ong'amo, G, Otiende, MY, Makhulu, EE, et al. Pathogens, endosymbionts, and blood-meal sources of host-seeking ticks in the fast-changing Maasai Mara wildlife ecosystem. PLoS One. (2020) 15:e0228366. doi: 10.1371/journal.pone.0228366
38. Ergunay, K, Mutinda, M, Bourke, B, Justi, SA, Caicedo-Quiroga, L, Kamau, J, et al. Metagenomic investigation of ticks from Kenyan wildlife reveals diverse microbial pathogens and new country pathogen records. Front Microbiol. (2022) 13:1–16. doi: 10.3389/fmicb.2022.932224
39. Hoover, TA, Vodkin, MH, and Williams, JC. A Coxiella burnetii repeated DNA element resembling a bacterial insertion sequence. J Bacteriol. (1992) 174:5540–8. doi: 10.1128/JB.174.17.5540-5548.1992
40. Nourollahi Fard, SR, and Khalili, M. PCR-detection of Coxiella burnetii in ticks collected from sheep and goats in Southeast Iran. Iran J Arthropod Borne Dis. (2011) 5:1.
41. Klee, SR, Tyczka, J, Ellerbrok, H, Franz, T, Linke, S, Baljer, G, et al. Highly sensitive real-time PCR for specific detection and quantification of Coxiella burnetii. BMC Microbiol. (2006) 6:2. doi: 10.1186/1471-2180-6-2
42. Altschul, SF, Gish, W, Miller, W, Myers, EW, and Lipman, DJ. Basic local alignment search tool. J Mol Biol. (1990) 215:403–10. doi: 10.1016/S0022-2836(05)80360-2
43. Revelle, WR . (2017) Psych: procedure for personality and psychological research. Software. Available at: https://www.scholars.northwestern.edu/en/publications/psych-procedures-for-personality-and-psychological-research (Accessed February 4, 2023).
44. R Project . R: The R Project for Statistical Computing. Available at: https://www.r-project.org/ (Accessed February 6, 2023).
45. Sim, J, and Wright, CC. The kappa statistic in reliability studies: use, interpretation, and sample size requirements. Phys Ther. (2005) 85:257–68. doi: 10.1093/PTJ/85.3.257
46. Johnson, WO, Jones, G, and Gardner, IA. Gold standards are out and Bayes is in: implementing the cure for imperfect reference tests in diagnostic accuracy studies. Prev Vet Med. (2019) 167:113–27. doi: 10.1016/j.prevetmed.2019.01.010
47. Kostoulas, P, Nielsen, SS, Branscum, AJ, Johnson, WO, Dendukuri, N, Dhand, NK, et al. STARD-BLCM: standards for the reporting of diagnostic accuracy studies that use Bayesian latent class models. Prev Vet Med. (2017) 138:37–47. doi: 10.1016/j.prevetmed.2017.01.006
48. Cheung, A, Dufour, S, Jones, G, Kostoulas, P, Stevenson, MA, Singanallur, NB, et al. Bayesian latent class analysis when the reference test is imperfect. Rev Sci Tech. (2021) 40:271–86. doi: 10.20506/RST.40.1.3224
49. World Organisation for Animal Health (OIE) . Principles and Methods of Validation of Diagnostic Assays for Infectious Diseases. (2009). Available at: http://www.oie.int (Accessed October 23, 2022).
50. Eisen, RJ, and Paddock, CD. Tick and Tickborne pathogen surveillance as a public health tool in the United States. J Med Entomol. (2021) 58:1490–502. doi: 10.1093/JME/TJAA087
51. R Core Team (2022). R: A language and environment for statistical computing. R foundation for statistical computing, Vienna. Available at: https://www.r-project.org/ (Accessed October 23, 2022).
52. RStudio Team (2022). RStudio: integrated development environment for R. RStudio, PBC, Boston, MA. Available at: https://www.rstudio.com/ (Accessed October 23, 2022).
53. Sturtz, S, Ligges, U, and Gelman, A. R2WinBUGS: a package for running WinBUGS from R. J Stat Softw. (2005) 12:1–16. doi: 10.18637/JSS.V012.I03
54. Salgadu, A, Cheung, A, Schibrowski, ML, Wawegama, NK, Mahony, TJ, Stevenson, MA, et al. Bayesian latent class analysis to estimate the optimal cut-off for the MilA ELISA for the detection of Mycoplasma bovis antibodies in sera, accounting for repeated measures. Prev Vet Med. (2022) 205:1–9. doi: 10.1016/J.PREVETMED.2022.105694
55. Plummer, M, Best, N, Cowles, K, and Vines, K. CODA: Convergence diagnosis and output analysis for MCMC. Comput Sci. (2006)
56. Curtis, SM . Create plots from MCMC output [R package mcmcplots version 0.4.3]. (2018). Available at: https://CRAN.R-project.org/package=mcmcplots (Accessed October 23, 2022).
57. Jourdain, E, Duron, O, Barry, S, González-Acuña, D, Sidi-Boumedine, K, Elsa, J, et al. Molecular methods routinely used to detect Coxiella burnetii in ticks cross-react with Coxiella-like bacteria. Infect Ecol Epidemiol. (2015) 5:10.3402/iee.v5.29230. doi: 10.3402/iee.v5.29230
58. Debode, F, Marien, A, Janssen, E, Bragard, C, and Berben, G. The influence of amplicon length on real-time PCR results. Biotechnol Agron Soc Environ. (2017) 21:3–11. doi: 10.25518/1780-4507.13461
59. Bustin, S, and Huggett, J. qPCR primer design revisited. Biomol Detect Quantif. (2017) 14:19–28. doi: 10.1016/J.BDQ.2017.11.001
60. Gardner, IA, Colling, A, Caraguel, CG, Crowther, JR, Jones, G, Firestone, SM, et al. Introduction. Validation of tests for OIE-listed diseases as fit-for-purpose in a world of evolving diagnostic technologies: introduction and historical perspectives. Rev Sci Tech. (2021) 40:9–28. doi: 10.20506/rst.40.1.3207
61. Mtshali, K, Khumalo, Z, Nakao, R, Grab, DJ, Sugimoto, C, and Thekisoe, O. Molecular detection of zoonotic tick-borne pathogens from ticks collected from ruminants in four south African provinces. J Vet Med Sci. (2016) 77:1573–9. doi: 10.1292/jvms.15-0170
62. Tokarevich, NK, Panferova, YA, Freylikhman, OA, Blinova, OV, Medvedev, SG, Mironov, SV, et al. Coxiella burnetii in ticks and wild birds. Ticks Tick Borne Dis. (2019) 10:377–85. doi: 10.1016/J.TTBDIS.2018.11.020
63. Knap, N, Žele, D, Glinšek Biškup, U, Avšič-Županc, T, and Vengušt, G. The prevalence of Coxiella burnetii in ticks and animals in Slovenia. BMC Vet Res. (2019) 15:1–6. doi: 10.1186/S12917-019-2130-3/FIGURES/1
64. Astobiza, I, Barral, M, Ruiz-Fons, F, Barandika, J, Gerrikagoitia, X, Hurtado, A, et al. Molecular investigation of the occurrence of Coxiella burnetii in wildlife and ticks in an endemic area. Vet Microbiol. (2011) 147:190–4. doi: 10.1016/j.vetmic.2010.05.046
65. Salomon, J, Hamer, SA, and Swei, A. A Beginner’s guide to collecting questing hard ticks (Acari: Ixodidae): a standardized tick dragging protocol. J Insect Sci. (2020) 20:11. doi: 10.1093/JISESA/IEAA073
66. Gherman, CM, Mihalca, AD, Dumitrache, MO, Györke, A, Oroian, I, Sandor, M, et al. CO2 flagging - an improved method for the collection of questing ticks. Parasit Vectors. (2012) 5:125. doi: 10.1186/1756-3305-5-125
67. Johnson, WO, Gastwirth, JL, and Pearson, LM. Screening without a “gold standard”: the hui-Walter paradigm revisited. Am J Epidemiol. (2001) 153:921–4. doi: 10.1093/AJE/153.9.921
68. Muñoz-Zanzi, C, Thurmond, M, Hietala, S, and Johnson, W. Factors affecting sensitivity and specificity of pooled-sample testing for diagnosis of low prevalence infections. Prev Vet Med. (2006) 74:309–22. doi: 10.1016/J.PREVETMED.2005.12.006
69. Clouthier, SC, McClure, C, Schroeder, T, and Anderson, ED. Bayesian latent class model estimates of diagnostic accuracy for three test methods designed to detect spring viremia of carp virus. Prev Vet Med. (2021) 190:105338. doi: 10.1016/J.PREVETMED.2021.105338
Keywords: Coxiella burnetii , diagnostics, Q fever, sensitivity, specificity, ticks, wildlife
Citation: Kamau MW, Witte C, Goosen W, Mutinda M, Villinger J, Getange D, Khogali R, von Fricken ME, Fèvre EM, Zimmerman D, Linton Y-M and Miller M (2024) Comparison of test performance of a conventional PCR and two field-friendly tests to detect Coxiella burnetii DNA in ticks using Bayesian latent class analysis. Front. Vet. Sci. 11:1396714. doi: 10.3389/fvets.2024.1396714
Edited by:
Sonja Hartnack, University of Zurich, SwitzerlandReviewed by:
Bersissa Kumsa, Addis Ababa University, EthiopiaAbbey Olsen, University of Copenhagen, Denmark
Copyright © 2024 Kamau, Witte, Goosen, Mutinda, Villinger, Getange, Khogali, von Fricken, Fèvre, Zimmerman, Linton and Miller. This is an open-access article distributed under the terms of the Creative Commons Attribution License (CC BY). The use, distribution or reproduction in other forums is permitted, provided the original author(s) and the copyright owner(s) are credited and that the original publication in this journal is cited, in accordance with accepted academic practice. No use, distribution or reproduction is permitted which does not comply with these terms.
*Correspondence: Maureen W. Kamau, bWF1cmVlbi53YW5qaWt1LmtAZ21haWwuY29t