 Lidan Wang1†Zun Hu2†Zhao Wang1†Pengchen Zhu1Guoshan Wei1Xinyi Fan1Jiali Huang1Ruixi Wang1Hui Wang1*
 Yue Xie1*
- 1Department of Parasitology, College of Veterinary Medicine, Sichuan Agricultural University, Chengdu, China
- 2Department of Food Technology and Science, College of Food Science, Shanghai Ocean University, Shanghai, China
The fish louse Argulus japonicus, a branchiuran crustacean of the Argulidae family, is attracting increasing attention because of its parasitic tendencies and significant health threats to global fish farming. The mitogenomes can yield a foundation for studying epidemiology, genetic diversity, and molecular ecology and therefore may be used to assist in the surveillance and control of A. japonicus. In this study, we sequenced and assembled the complete mitogenome of A. japonicus to shed light on its genetic and evolutionary blueprint. Our investigation indicated that the 15,045-bp circular genome of A. japonicus encodes 13 protein-coding genes (PCGs), 22 transfer RNAs (tRNAs), and 2 ribosomal RNAs (rRNAs) with significant AT and GC skews. Comparative genomics provided an evolutionary scenario for the genetic diversity of 13 PCGs: all were under purifying selection, with cox1 and nad6 having the lowest and highest evolutionary rates, respectively. Genome-wide phylogenetic trees established a close relationship between species of the families Argulidae (Arguloida) and Armilliferidae (Porocephalida) within Crustacea, and further, A. japonicus and Argulus americanus were determined to be more closely related to each other than to others within the family Argulidae. Single PCG-based phylogenies supported nad1 and nad6 as the best genetic markers for evolutionary and phylogenetic studies for branchiuran crustaceans due to their similar phylogenetic topologies with those of genome-based phylogenetic analyses. To sum up, these comprehensive mitogenomic data of A. japonicus and related species refine valuable marker resources and should contribute to molecular diagnostic methods, epidemiological investigations, and ecological studies of the fish ectoparasites in Crustacea.
1 Introduction
The fish louse Argulus japonicus, a branchiuran crustacean belonging to the family Argulidae, has garnered considerable attention due to its parasitic tendencies in various fish and significant threats to global fish farming (1, 2). This parasite is often found on the caudal fin, skin, and chin of infected fish, and its lifecycle typically involves egg, larval, and adult stages (3). After mating, female lice detach from the host and lay eggs on hard substrates in the aquatic environment. These eggs hatch into free-swimming larvae in 10 days at 35°C, and then the larvae actively seek out suitable fish hosts, initiate the parasitic phase, and develop into adults (1, 4). Morphologically, the adult has a conspicuous carapace and a pair of specialized appendages for clinging to the fish. During this attachment, the parasitic louse uses its mouthpart to penetrate the integument of fish and feed on the host blood and tissue fluids (5, 6). In fish farming, infections with A. japonicus can cause ulceration and immunological suppression, as well as secondary infections with bacteria and fungi (1, 5). Furthermore, this parasite can also act as a carrier to transmit fish pathogens, such as the spring viremia of the carp virus and dracunculoid/skrjabillanid nematode larvae (3). Increased epidemiological evidence shows that A. japonicus is becoming prevalent throughout many countries (4, 7, 8). For example, Avenant-Oldewage reported a high infection rate of A. japonicus in the Olifants River system of South Africa and Mozambique (9). Wafer et al. documented the frequent presence of A. japonicus in goldfish (Carassius auratus) from Florida, Georgia, Louisiana, California, Hawaii, Illinois, Maryland, Wisconsin, Washington, and Texas in the United States (10). Furthermore, the occurrence and prevalence of A. japonicus were recently recoded in some Asian countries, including Japan, Indonesia, Turkey, Pakistan, and Iran (7, 8, 11–13). In China, Alsarakibi et al. demonstrated a 22.3 ~ 47.8% prevalence of A. japonicus across Chinese rivers, fish farms, and ponds and emphasized the lack of approved drugs for its control in China (6, 14). Furthermore, numerous studies revealed a strong capability of A. japonicus to adapt to new surroundings, including its hosts (e.g., Amur catfish, black carp, brown trout, big-scaled redfin, and mandarin fish), suggesting its natural widespread and occurrence in various aquatic niches caused by the rapid evolution under ecological pressure rather than introduction by hosts (4, 15–18). Combined, these studies show an emerging concern for how to advance surveillance and control of A. japonicus in global fish farming.
Traditionally, A. japonicus surveillance relies on morphology-based identification and differentiation (5, 19–21). However, such taxonomic scrutiny often faces challenges due to the need for experienced microscopists to accurately identify and distinguish A. japonicus from other related species, especially at the larval stages (1, 3). Therefore, obtaining a more efficient and reliable way to identify and differentiate A. japonicus or larvae has become crucial for field diagnosis and epidemiological investigation, and achieving this goal is foreseeable only through the utilization of molecular approaches. Recently, molecular tools employing genetic markers from the nuclear and mitochondrial (mt) DNA offer a fast and sensitive approach to unveiling the genetic makeup and phylogenetic relationships of targeted species and have been widely used for species-specific identification and differentiation among various organisms, including Argulus (13, 19, 22–25). For example, nuclear genetic markers, including small ribosomal protein 18 (18S), OPC19, and OPH11, have been employed to explore the genetic diversity and species identification of Argulus parasites (6, 19, 26, 27). Moreover, the mt genes, such as cox1, nad1, and nad4, have also proven effective for Argulus identification because of their matrilineal inheritance, high copy number, lack of recombination, and rapid evolution (28–31). However, compared to single or partial genetic loci, a complete mt genomic dataset would be especially powerful for displaying sufficient interspecies variability and describing species specificity (32, 33). Unfortunately, a sequence search against GenBank revealed that there has been no information available on the complete mitogenome of A. japonicus so far. In this study, it was designed to sequence and assemble the entire mitogenome of A. japonicus using Illumina technology. Combined with genome annotation, comparative mitogenomics, and phylomitogenomics, our comprehensive molecular characterizations would refine the understanding of the genetic and evolutionary blueprint of A. japonicus and contribute to diagnostic methods, epidemiological investigations, and ecological implications of A. japonicus and related crustacean species.
2 Materials and methods
2.1 Sample collection, DNA extraction, PCR amplification, and sequencing
Between March and July 2023, a total of 530 cultured and wild fish samples were obtained from rivers and fish farms in Sichuan, China, using diverse methods, including angling, purse-seining, gill-netting, and trapping. Following capture and labeling, a meticulous examination for ectoparasites was conducted on the external surface of each fish using a hand lens. Approximately 63 Argulus specimens were harvested, preserved in 90% ethanol, and transferred to the parasitological laboratory of Sichuan Agricultural University (Chengdu, China) for morphological identification using the taxonomic keys of Wadeh et al. (34). Ten specimens were morphologically identified as A. japonicus, and then two specimens were chosen for further molecular identification by PCR amplifying and sequencing the 18S (19), followed by comparison with the previously documented A. japonicus sequence (GenBank accession number: MW857091). A result of 100% sequence identity of the 18S between both specimens and A. japonicus confirmed their species identity.
2.2 Genome sequencing, assembly, and annotation
To decode the A. japonicus mitogenome, the total genomic DNA (gDNA) was extracted from six louse specimens using the MiniBEST Universal Genomic DNA Extraction Kit Ver.5.0 (TaKaRa, Dalian, China). Following gDNA yield and integrity examination, a 0.2-μg aliquot of gDNA was fragmented, end-paired, and ligated to adaptors. The ligated fragments were isolated on agarose gels and amplified by PCR to produce the Illumina TruSeq library. A 300-bp paired-end (PE) library was constructed and sequenced. Approximately 3.2 Gb clean data emerged after quality-trimming short and low-quality reads with poly-Ns (>15 bp Ns) or > 75 bp bases with a quality score ≤ 3. These reads were further assembled with IDBA-UD using the following parameters: similarity threshold of 98% and minimum and maximum K-values of 80 and 240 bp, respectively (35). Genome assembly validation was achieved by mapping clean reads onto the acquired mitogenome sequences with Geneious v10.1.3 (36). Simultaneously, the assembled mitogenome was also confirmed by PCR, which amplified eight overlapping fragments (sizes ranging from 1.8 to 2.5 kb). These fragments were chosen based on the conserved region alignments of available Argulus mitogenomes, and their corresponding PCR primers are shown in Supplementary Table S1. All PCR reactions were conducted in a 25 μl volume, containing 2 μl of gDNA, 10 μl of 2 × TransTaq® HiFi PCR SuperMix (TaKaRa), 1.5 μl of each primer (10 pmol each), and 10 μl of ddH2O. Reaction conditions comprised 4 min denaturation at 94°C, followed by 35 cycles of 40 s at 94°C, 45 s at 2 ~ 3 min at 68°C, adhering to Tm values and product lengths, with a final extension at 68°C for 10 min. The PCR products were analyzed by agarose gel electrophoresis, and target amplicons were sequenced directly or after sub-cloning into the pMD19-T vector (TaKaRa). Each amplicon was triply sequenced for accuracy. A combination of manual alignments and online BLAST was used to annotate the final A. japonicus mitogenome (37, 38). The circular mitogenome map creation was achieved with MacVector v18.6.1 The complete A. japonicus mitogenome was deposited in GenBank under accession number: PP190482.
2.3 Sequence analyses
Using the open reading frame (ORF) finder and Primer Premier v5.0 (39), the amino acid sequences of protein-coding genes (PCGs) of the A. japonicus mitogenome were inferred using the invertebrate mt genetic code. Codon use profiles were examined using MEGA v11 (40). Additionally, the nucleotide skewness of the A. japonicus mitogenome was assessed through the following formulas: AT skew = (A − T)/(A + T) and GC skew = (G − C)/(G + C) (41). Alignments of the nucleotide and amino acid sequences of each PCG and concatenated PCGs of A. japonicus and other crustaceans were executed with MEGA. Based on pairwise alignments, the nucleotide and amino acid sequence identities were computed with DNASTAR v17.1.1.2 Synonymous (Ks) and non-synonymous (Ka) substitution rates were calculated using DnaSP v6.12.03 (42), and genetic distances were measured with MEGA using Kimura-2-parameter (K2P).
2.4 Phylogenetic analyses
To determine the classification positions of A. japonicus in the family Argulidae and of the family Argulidae within Crustacea, 29 mitogenomes of crustaceans were retrieved from GenBank (Supplementary Table S2). Phylogenetic relationships were deduced on the basis of either a concatenated amino acid dataset of 13 PCGs or an individual amino acid dataset of each PCG. During the procedures, sequence alignments were achieved using T-Coffee v7.813 and the ambiguous regions were removed using GBLOCKS v0.91b.4 Phylogenetic analyses were carried out with maximum parsimony (MP) and Bayesian inference (BI) using Calanus hyperboreus as the outgroup. In brief, the MP analysis was constructed through PAUP* (43) using either concatenated or individual PCG datasets. The equally weighted parsimony, together with heuristic searches with tree-bisection-reconnection (TBR) branch-swapping and 1,000 replicates of Wagner trees, were executed. Five trees per replication were sampled, and the optimal tree was chosen using the Kishino–Hasegawa method. Bootstrap resampling was computed for each nodal support. For the BI analysis, the phylogenetic trees were reconstructed with MrBayes v3.2.7a5 using four independent Markov chains, running for 40,000,000 (concatenated PCG dataset) and 3,000,000 (single PCG dataset) metropolises coupled Monte Carlo generations. Trees were sampled every 40,000 and 3,000 generations. Once the average standard deviation (SD) of the split frequencies dropped below 0.01, the first 25% of trees were discarded as “burn-in,” and the remaining were used to compute Bayesian posterior probabilities (PPs). The evolutionary distance was estimated using the MrBayes order (aamodelpr = mixed) with default parameters. A consensus tree was obtained and visualized using Treeview X.6
3 Results and discussion
3.1 General feature of Argulus japonicus mitogenome
The nucleotide sequence of the A. japonicus mitogenome was determined to be 15,045 bp in size (Figure 1). It was composed of 37 genes, including 13 PCGs (1 subunit of cytochrome c-ubiquinol oxidoreductase, cytb; 2 subunits of the adenosine triphosphatase synthase, atp6, and atp8; 3 subunits of cytochrome c oxidase, cox1-3; and 7 subunits of nicotinamide dehydrogenase, nad1-6, and nad4L), 22 transfer RNAs (tRNAs) (2 coding for leucine and 2 coding for serine), and 2 ribosomal RNAs (rRNAs) (small [rrnS] and large [rrnL] subunits), consistent with those found in other crustaceans for which complete mitogenomes are available (11, 37, 44–49). Twenty-three genes (14 tRNAs and 9 PCGs) were located on the J-strand, and the remaining 14 genes (8 tRNAs, 4 PCGs, and 2 rRNAs) were observed to be located on the N-strand (Table 1). Further, some genes were found to overlap with each other, and there were a total of 10 overlapping nucleotides observed between genes, as shown in Figure 1. Interestingly, two 7-bp overlaps were found between atp8 and atp6 and between nad4 and nad4L, respectively, similar to those reported in the mitogenome of the intertidal acorn barnacle Tetraclita serrata (11). Moreover, eight overlaps ranging from 1 to 2 bp were found to be Argulus-specific in comparison to other crustacean mitogenomes (44–49). Two non-coding regions ranging from 316 to 647 bp were also present in the A. japonicus mitogenome, with the longest one speculated as the control region (647 bp) and located between rrnS and trnK (Table 1), as described previously in crustacean species, such as Argulus americanus, Armillifer armillatus, and Speleonectes tulumensis (44–49). Consequently, the A. japonicus mitogenome was deemed to be compact due to more overlapping spacers (44 bp) and intergenic regions (38 bp) than other crustacean mitogenomes reported thus far (44, 46, 47, 49).
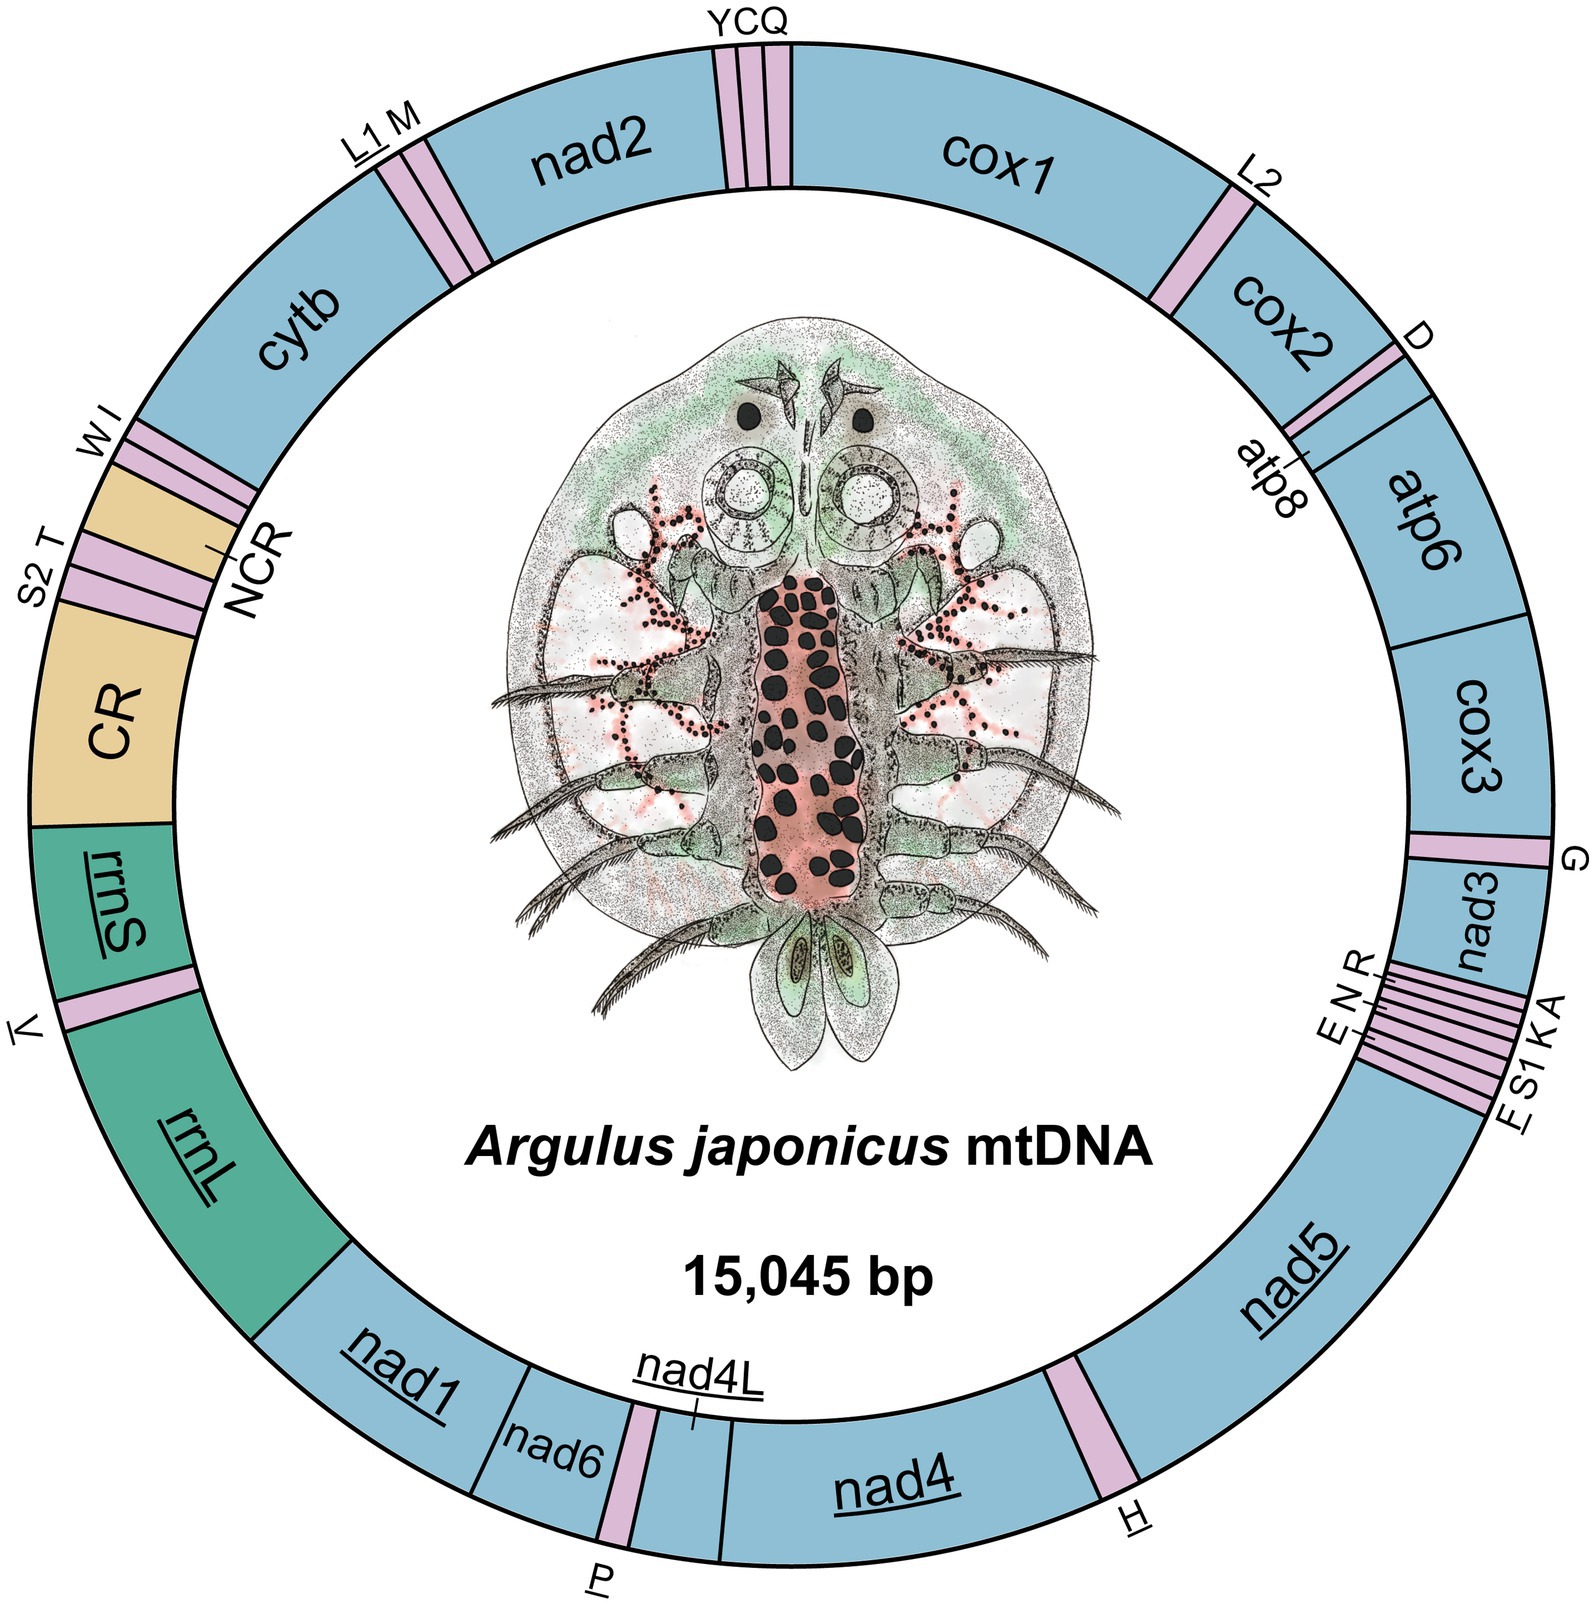
Figure 1. Circular representation of the A. japonicus mitogenome. Twenty-two tRNAs are represented by single letters corresponding to their respective amino acid codes. Two leucine genes are distinguished as L1 and L2, and two serine genes are labeled as S1 and S2. The genes located on the N-strand are underlined. NCR denotes the non-coding region, and CR denotes the control region.
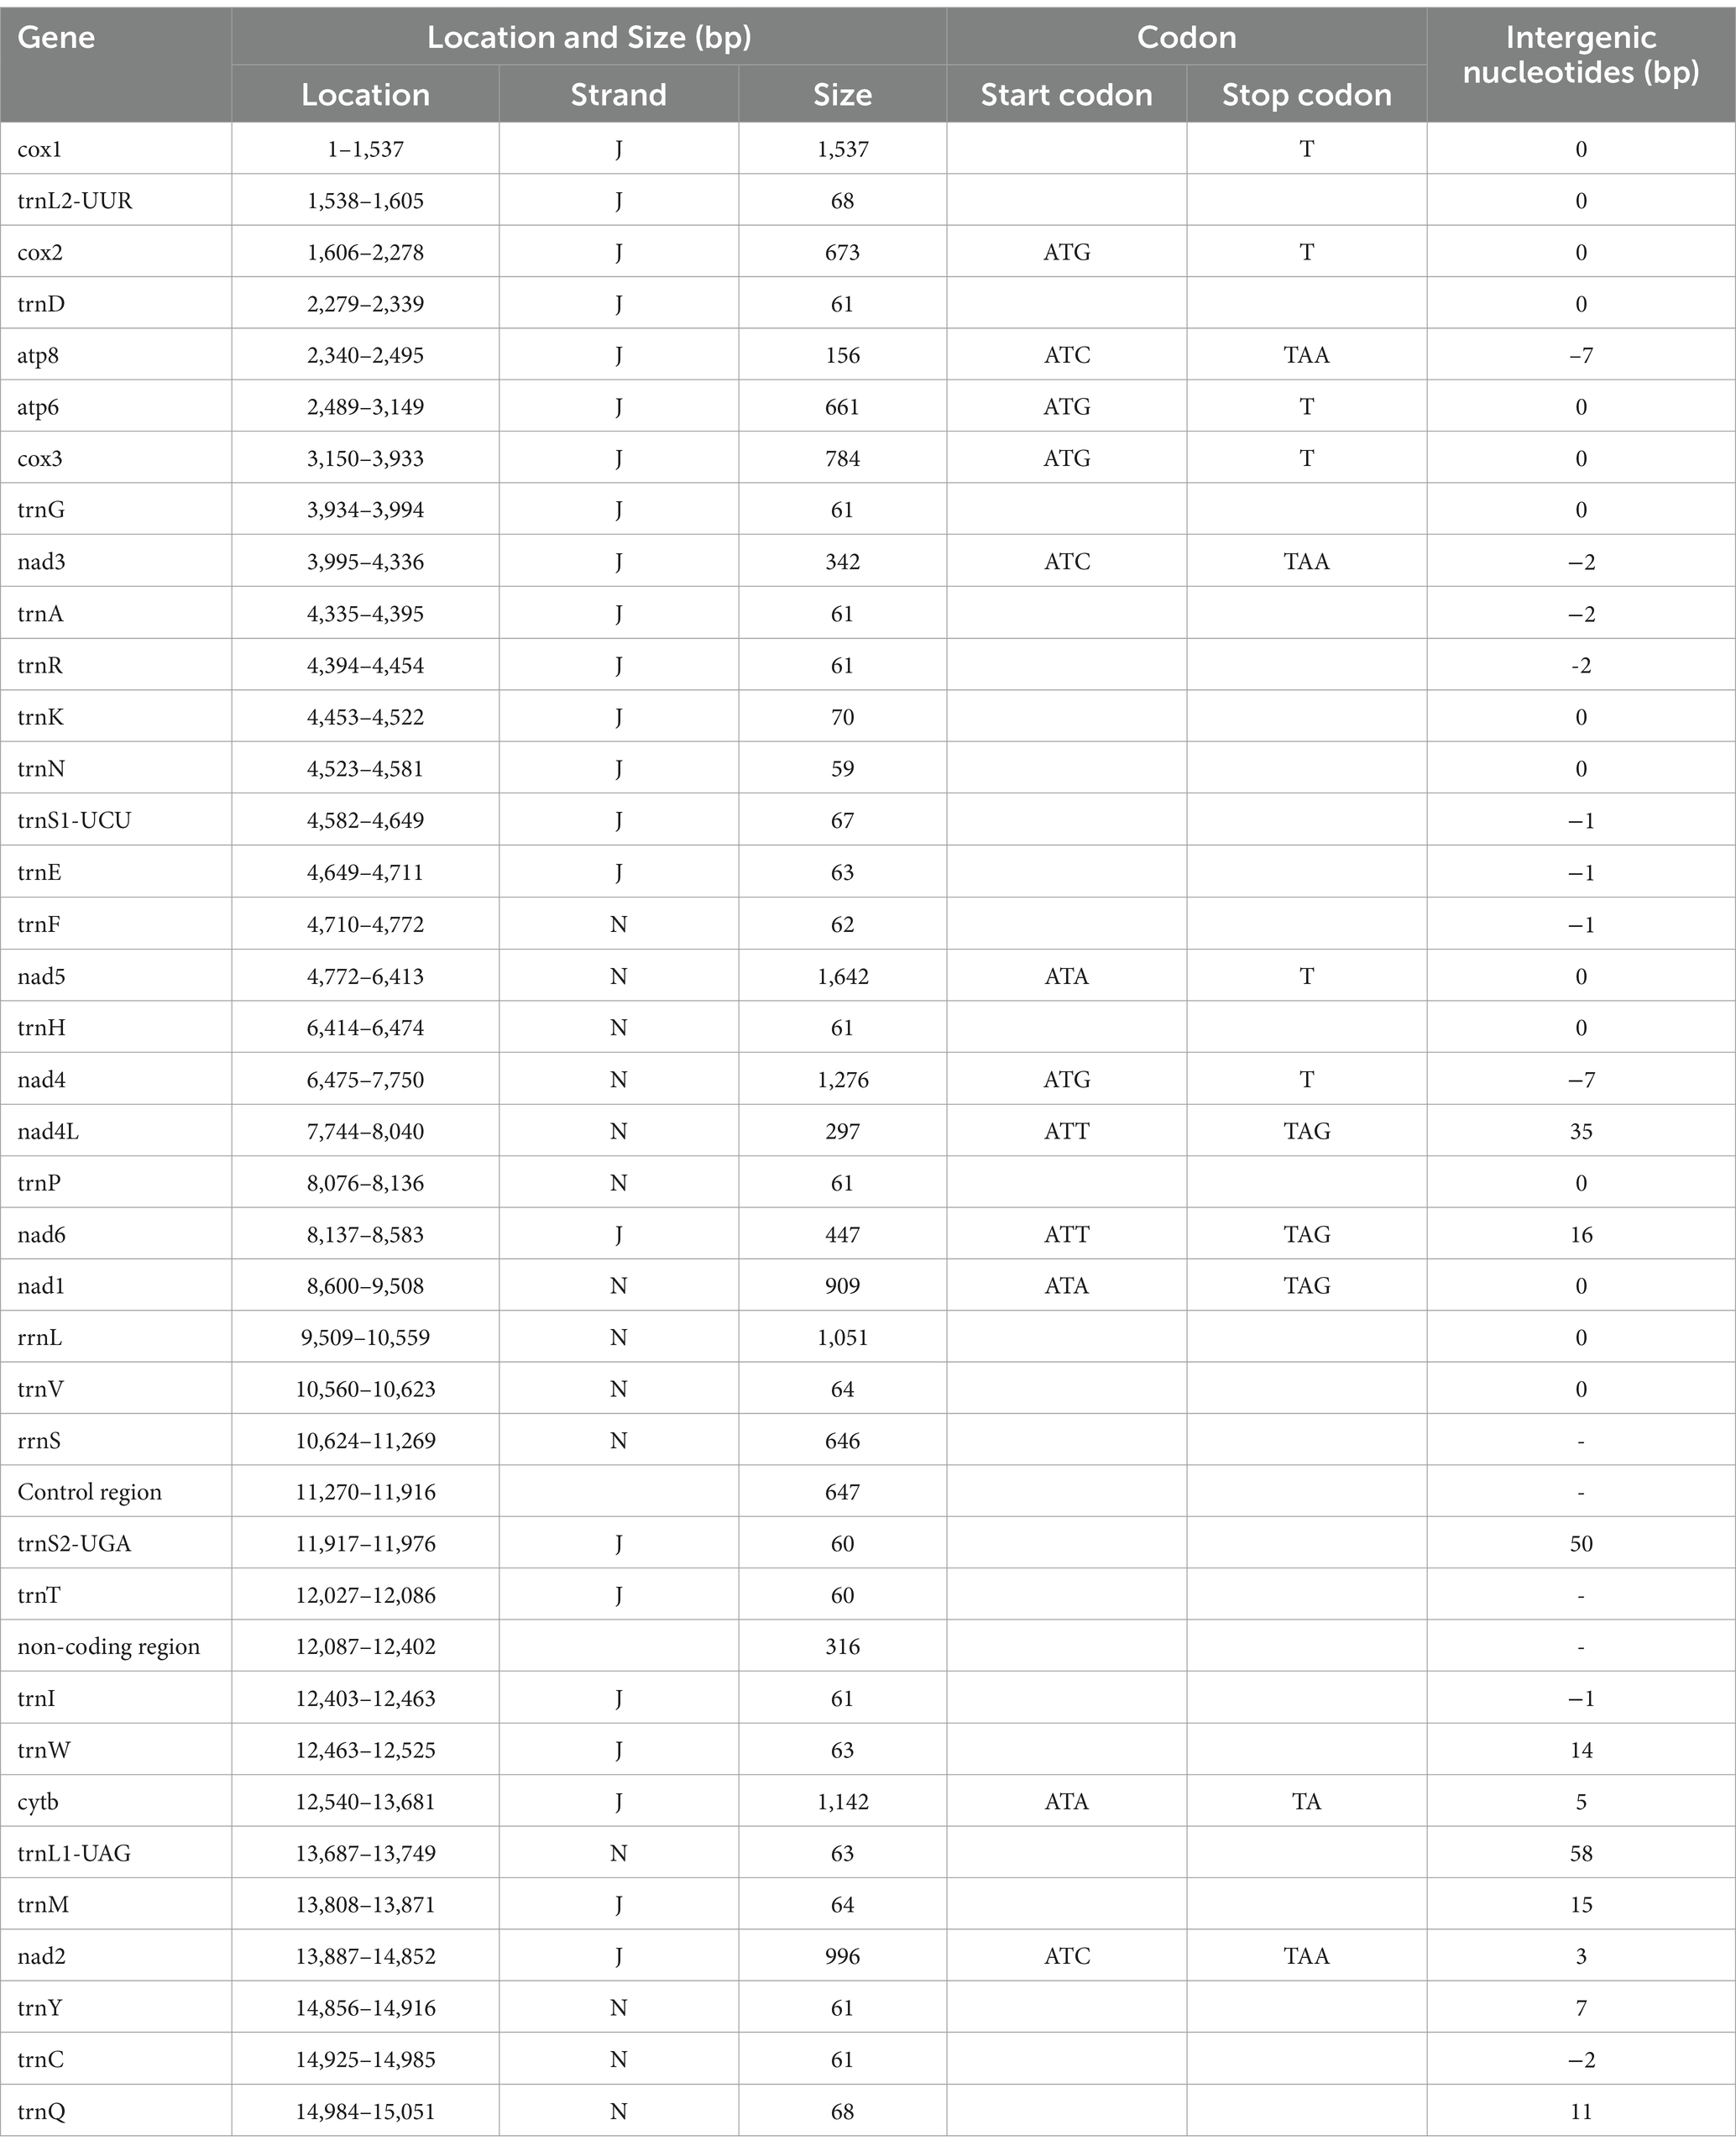
Table 1. Organization of the complete A. japonicus mitogenome.
3.2 Nucleotide composition and codon usage
The nucleotide composition of the A. japonicus mitogenome was 36.93% A, 34.71% T, 18.54% C, and 9.82% G, which led to the conclusion that A predominated while G was the least favored. It was notable that the 71.64% A + T and 28.36% G + C contents of the concatenated PCGs accounted for the largest proportions in this nucleotide composition when compared to those of rRNAs and tRNAs. Furthermore, the A. japonicus mitogenome also exhibited significant C-skew (GC skew = −0.307), similar to other Arguloida and Porocephalida species within Crustacea (44, 47, 49). Such nucleotide bias had an appreciable effect on both codon usage patterns and relative synonymous codon usage (RSCU). RSCU and codon counts in the A. japonicus mitogenome were computed and shown in Figure 2. It became apparent that the most frequently used codon was UUA (RSCU = 2.07), followed by UCA (RSCU = 1.82) and GUA (RSCU = 1.62). Correspondingly, the most frequently used amino acids included Leu (Count = 449), Lys (Count = 284), Phe (Count = 260), and Asn (Count = 255). Besides, ATG served as the predominant start codon for A. japonicus PCGs (cox2, cox3, atp6, and nad4), followed by ATC (atp8, nad3, and nad2), ATA (cytb, nad1, and nad5), and ATT (nad4L and nad6). Among these PCGs, six genes were deduced to utilize TAG (nad1, nad4L, and nad6) or TAA (nad2, nad3, and atp8) as the stop codons, and the remaining seven genes were anticipated to end with an incomplete codon, such as T (atp6, cox1-3, nad4, and nad5) or TA (cytb). A similar usage of the incomplete stop codons was also observed in other crustaceans (44, 47, 49), and they were presumably converted into complete ones by post-transcriptional polyadenylation during mRNA maturation (50, 51).
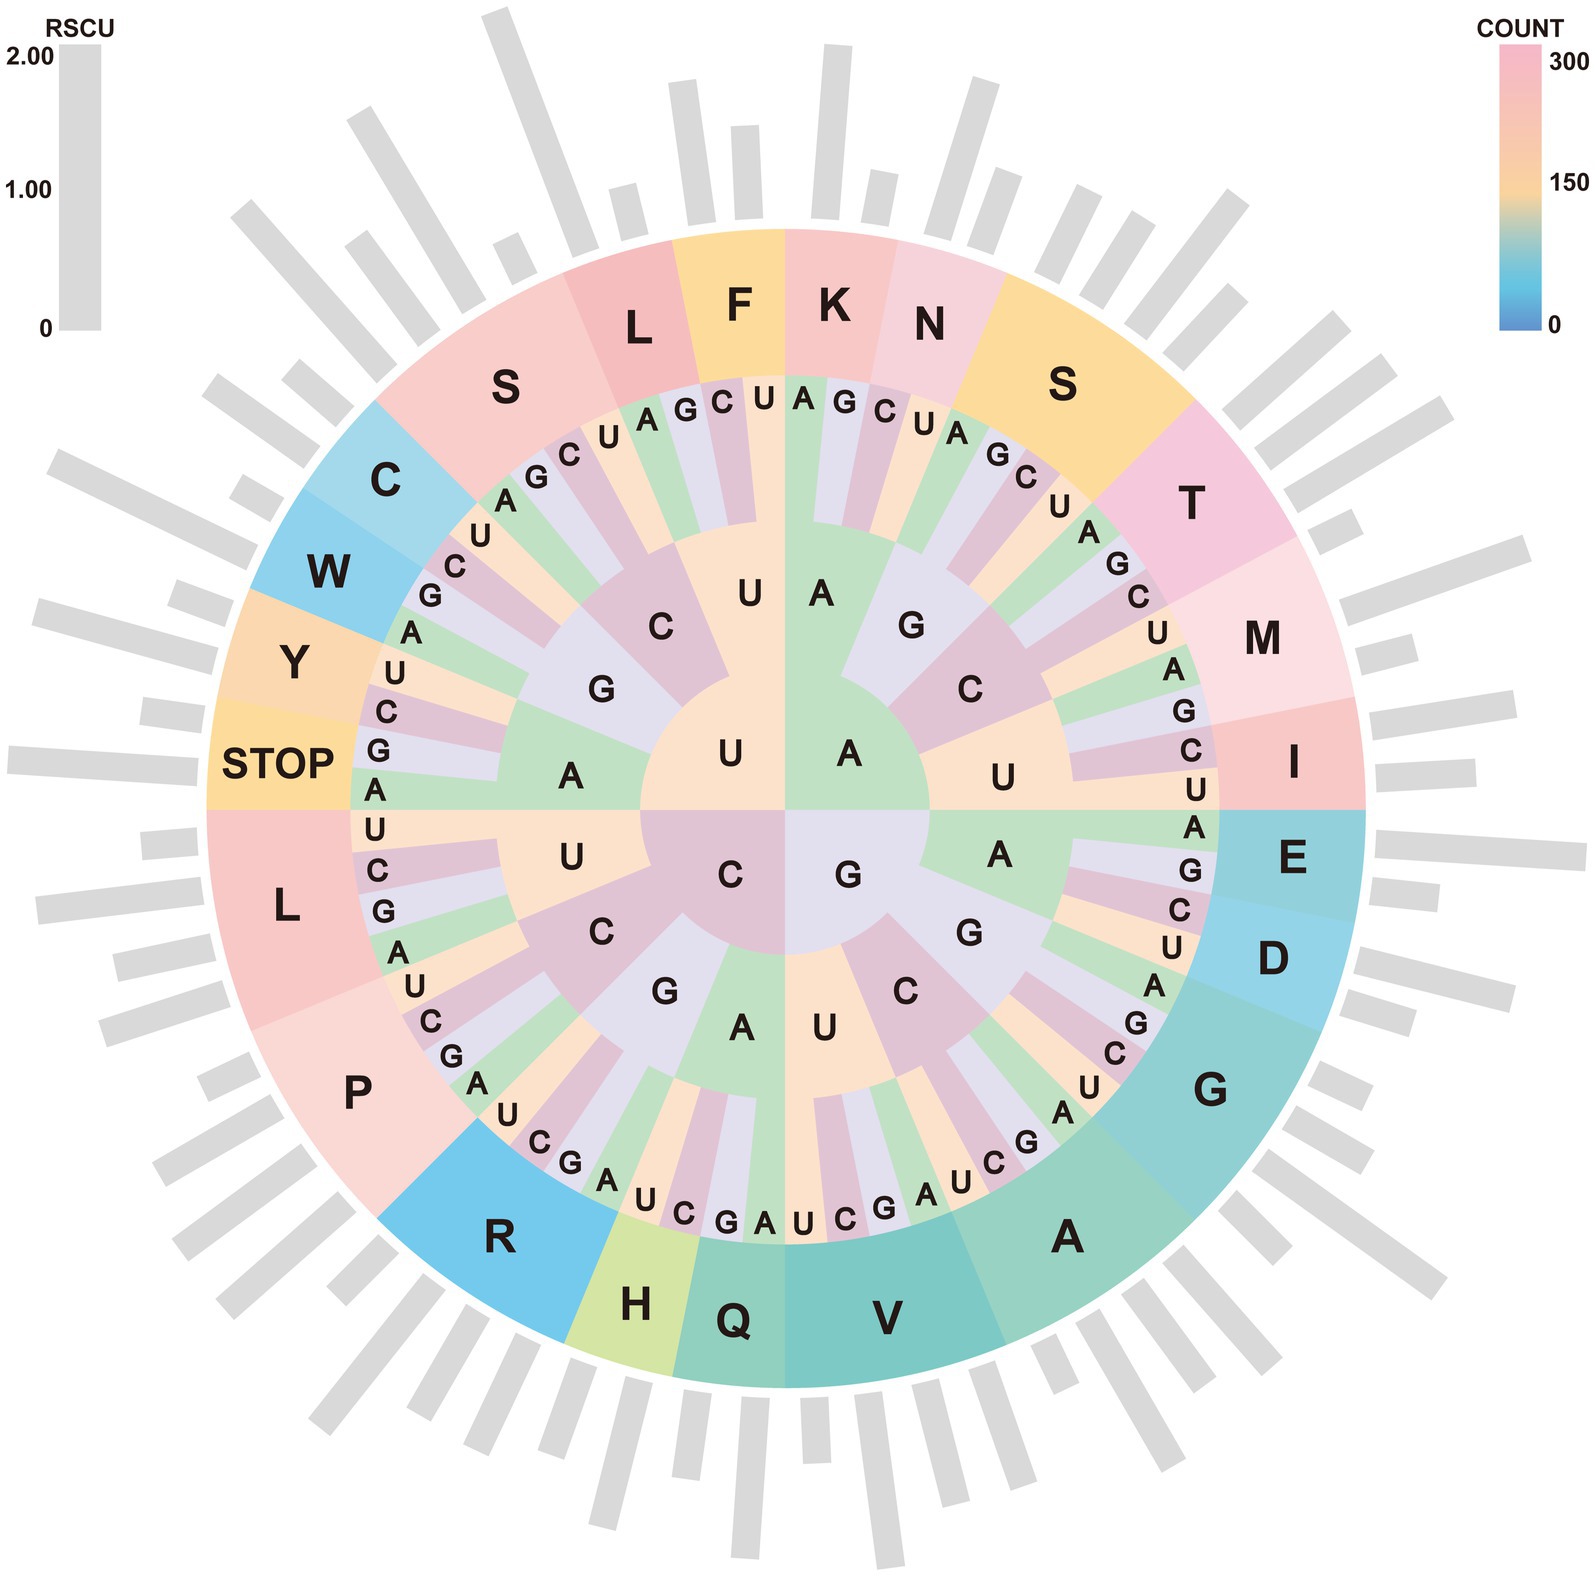
Figure 2. RSCU and codon numbers in the A. japonicus mitogenome. Outside gray bars depict the RSCU for individual codons. From inside to outside circles: first, second, and third codon positions in the codon and their coding target amino acids are represented by their abbreviations. Colors from pink to orange and then to blue indicate the different amino acid counts.
3.3 PCG variability and substitution ratios
In order to understand the evolutionary divergence between A. japonicus and other crustacean species, the nucleotide and amino acid sequence differences of 13 PCGs were measured. As shown in Supplementary Table S3, it appeared evident that A. japonicus shared the highest sequence identities with the congeneric A. americanus (49) and the lowest sequence identities with the cephalocarid C. hyperboreus (52). Among these PCGs, the cox1 gene was further determined to have the highest nucleotide (67.12%) and amino acid (70.93%) sequence identities, in contrast, the nad6 gene was determined to have the lowest nucleotide (23.09%) and amino acid (39.20%) sequence identities, to some extent, suggesting that the cox1 might be the slowest evolving and most conserved gene while the nad6 was the least conserved gene among crustacean mitogenomes. Such variability also implied the potential of the cox1 gene as a molecular marker for species- and population-level genetic investigations, in contrast with the nad6 gene as a DNA barcode for species identification and differentiation among crustaceans. Indeed, the cox1 gene has been regarded as a new marker for studying genetic variation among A. japonicus individuals from China, Egypt, and Syria (31); by contrast, the nad6 gene has been used as a DNA barcode for the identification of parasitic arthropods, including species of Tabanidae (53), Siphonostomatoida (54), and Arguloida (16).
In parallel with the sequence variability, Ka, Ks, and Ka/Ks values were also calculated for PCGs in order to estimate their evolutionary rates, and the ratio of Ka/Ks was simultaneously used for assessing the selective pressure of PCGs and indicating negative or purifying selection when Ka/Ks < 1, neutral mutation when Ka/Ks = 1, and positive or diversifying selection when Ka/Ks > 1 (55, 56). As shown in Figure 3, the atp8 gene among the 13 PCGs showed the maximum ratio of Ka/Ks (0.618), followed by nad4 (0.426), nad6 (0.421), nad4L (0.387), nad2 (0.372), nad5 (0.371), nad3 (0.282), atp6 (0.280), nad1 (0.266), cox2 (0.176), cox3 (0.147), cytb (0.132), and cox1 (0.106). Nevertheless, these ratios were all below 1, supporting a negative or purifying selection that acted on crustacean PCGs during their evolutions. Of course, to further test this certainty, it is still imperative to obtain evidence from the nuclear genomes.
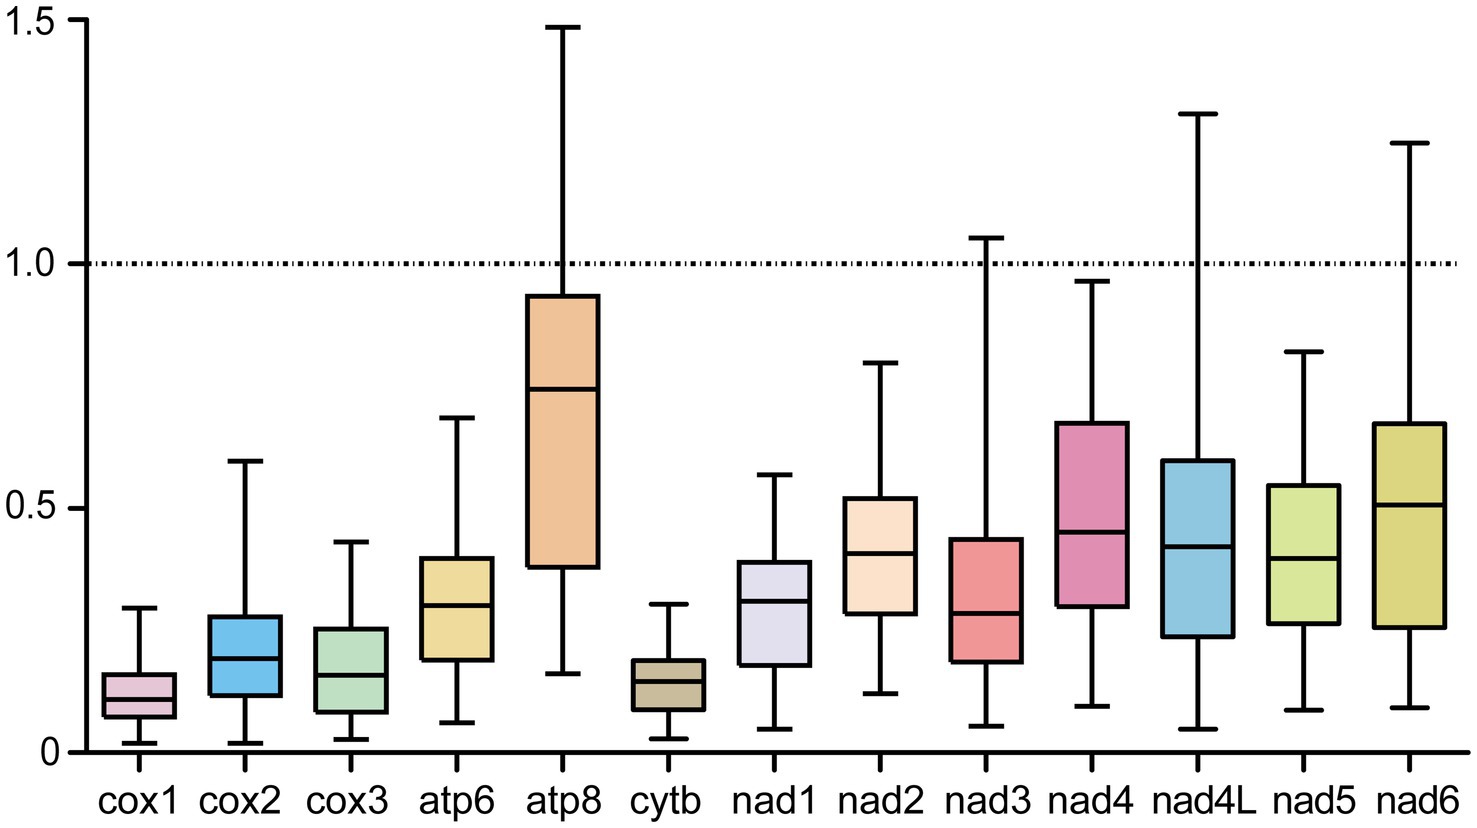
Figure 3. Evolutionary rates of PCGs between A. japonicus and other crustaceans. The rates of non-synonymous substitutions (Ka) and synonymous substitutions (Ks) and the ratio of Ka/Ks are calculated for each PCG.
3.4 Genetic distances
In addition to evolutionary divergence, we calculated the interspecific genetic distances between A. japonicus and other crustaceans using single or concatenated PCGs (Figure 4). It was clear that regardless of single or concatenated PCG datasets, the minimum K2P-based genetic distances were consistently present between A. japonicus and A. americanus (0.227–0.438 for single PCG datasets and 0.594 for concatenated PCG datasets). In contrast, the maximum genetic distances present for A. japonicus and C. hyperboreus are 0.366–0.981 for single PCG datasets and 0.641 for concatenated PCG datasets, once again confirming that A. japonicus was closely related to A. americanus but diverged from C. hyperboreus (57). Comparisons of genetic distance structures showed that the values of the cox1-based K2P genetic distances were all significantly smaller than those of other single PCG and concatenated PCGs, in agreement with the aforementioned result, in which the cox1 was regarded as the most conserved gene among crustacean species (29). Perhaps this conclusion can be further validated when additional crustacean mitogenomes become available, especially from the genus Argulus.
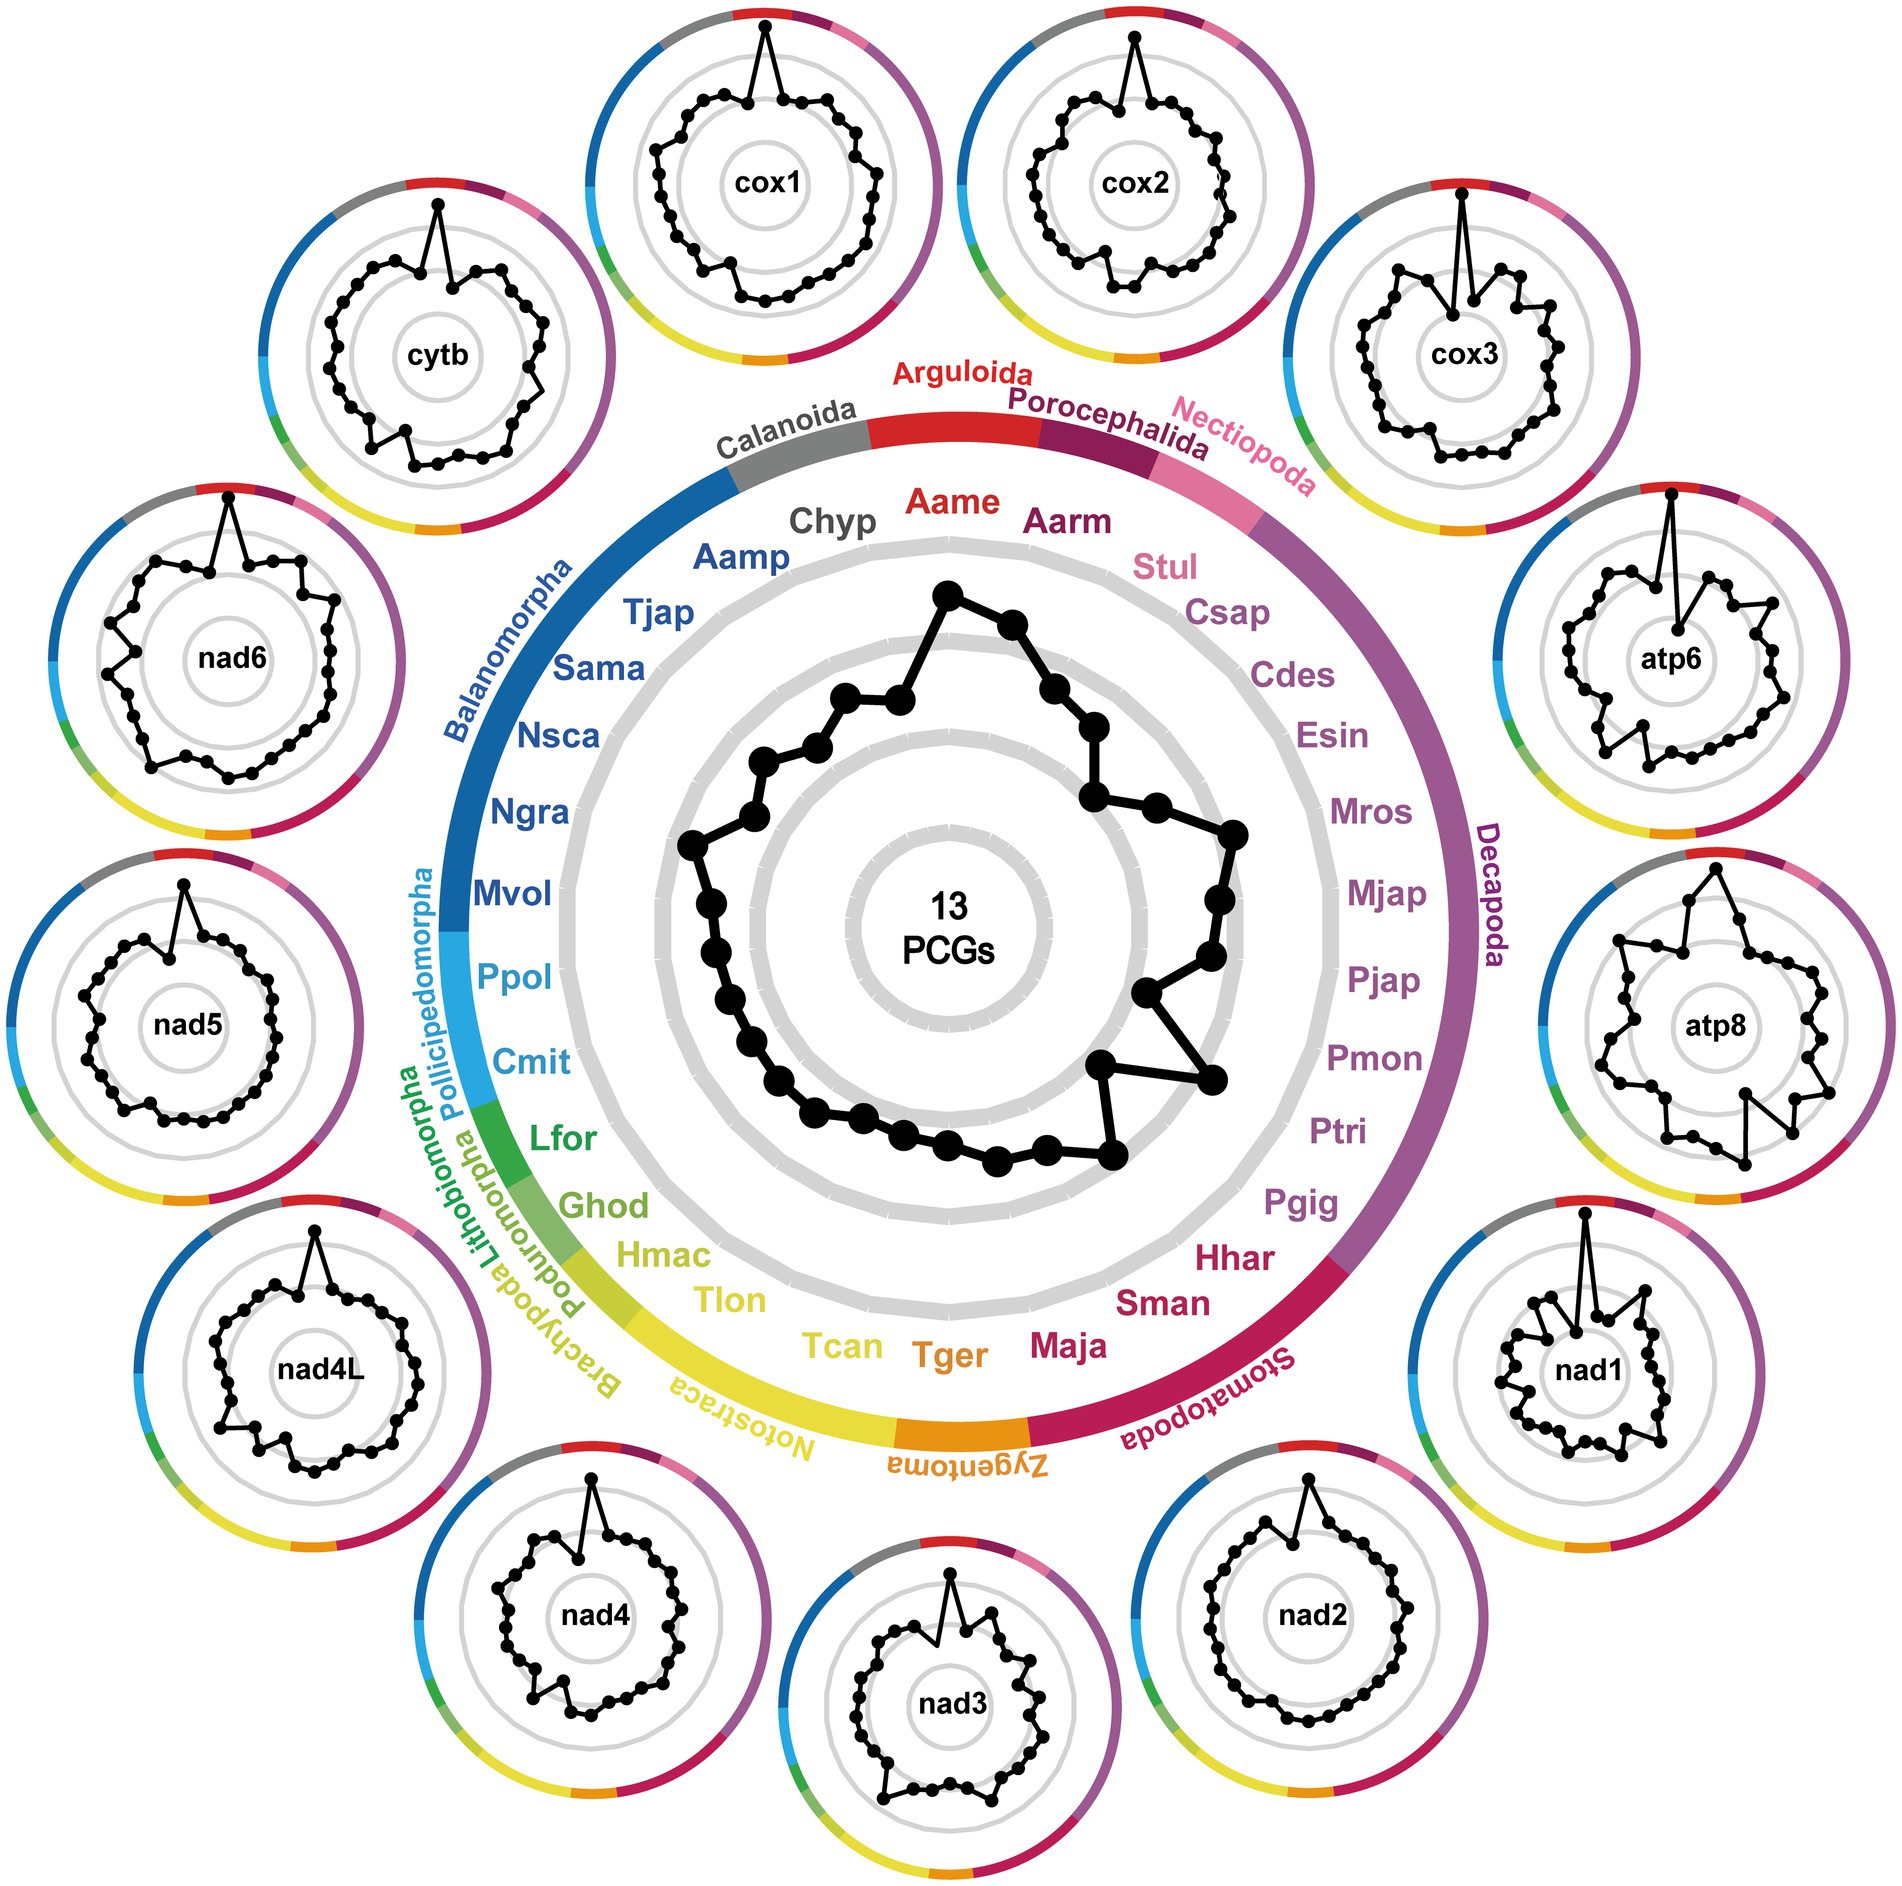
Figure 4. Patterns of K2P distances between A. japonicus and other related 30 crustaceans. The gray lines represent identical K2P distances radiating from the center. Black dots signify the relative K2P distances between A. japonicus and other crustaceans. Dots positioned closer to the edge of the pattern denote a diminished K2P distance between A. japonicus and the respective species. The central figure is generated on the basis of the concatenated amino acid sequences of 13 PCGs, and the outside individual phenogram is generated on the basis of the single PCG. The abbreviations Aamp, Aame, Aarm, Chyp, Csap, Cmit, Cdes, Esin, Ghod, Hmac, Lfor, Mros, Mjap, Mvol, Maja, Hhar, Ngra, Nsca, Pjap, Pmon, Ppol, Ptri, Pgig, Stul, Sman, Sama, Tjap, Tger, Tcan, Tcan, and Tlon represent Amphibalanus amphitrite, Argulus americanus, Armillifer armillatus, Calanus hyperboreus, Callinectes sapidus, Cherax destructor, Eriocheir sinensis, Gomphiocephalus hodgsoni, Hutchinsoniella macracantha, Lithobius forficatus, Macrobrachium rosenbergii, Marsupenaeus japonicus, Megabalanus volcano, Harpiosquilla harpax, Nobia grandis, Notochthamalus scabrosus, Panulirus japonicus, Penaeus monodon, Pollicipes polymerus, Portunus trituberculatus, Pseudocarcinus gigas, Speleonectes tulumensis, Squilla mantis, Striatobalanus amaryllis, Tetraclita japonica, Tricholepidion gertschi, Triops cancriformis, and Triops longicaudatus, respectively.
3.5 Phylogeny
The available A. japonicus mitogenome provided us with an opportunity to study the phylogenetic relationships of A. japonicus in the family Argulidae and of the family Argulidae within Crustacea. Congruent with previous phylogenetic analyses (11, 44, 47, 49), phylogenies in this study were inferred from the concatenated amino acid sequence dataset derived from 13 PCGs. As shown in Figure 5, the identical phylogenetic tree (MP/BI) robustly supported the distinct classification of Porocephalida, Nectiopoda, Decapoda, Stomatopoda, Diptera, Zygentoma, Notostraca, Brachypoda, Poduromorpha, Lithobiomorpha, Balanomorpha, and Pollicipedomorpha within Crustacea, each as a monophyletic group. It was also noteworthy that there was a closer relationship between species of the families Argulidae (Arguloida) and Armilliferidae (Porocephalida) compared to other crustacean species, and further, A. japonicus and A. americanus were determined to be more closely related to each other than to others within the family Argulidae, consistent with recent nuclear and mt DNA-based phylogenetic conclusions (57, 58). Additionally, species from Nectiopoda, Decapoda, Stomatopoda, Diptera, Zygentoma, Notostraca, Brachypoda, and Poduromorpha were individually clustered together as paraphyletic relationships in Crustacea, in accordance with the results of morphological and molecular biology studies (11, 59–63). Nevertheless, species from Lithobiomorpha exhibited a poor affinity for species from Balanomorpha and Pollicipedomorpha. Perhaps, a larger study of the evolutionary relationships among taxa within Crustacea is still needed by sequencing additional crustacean parasites, especially those from the order Lithobiomorpha.
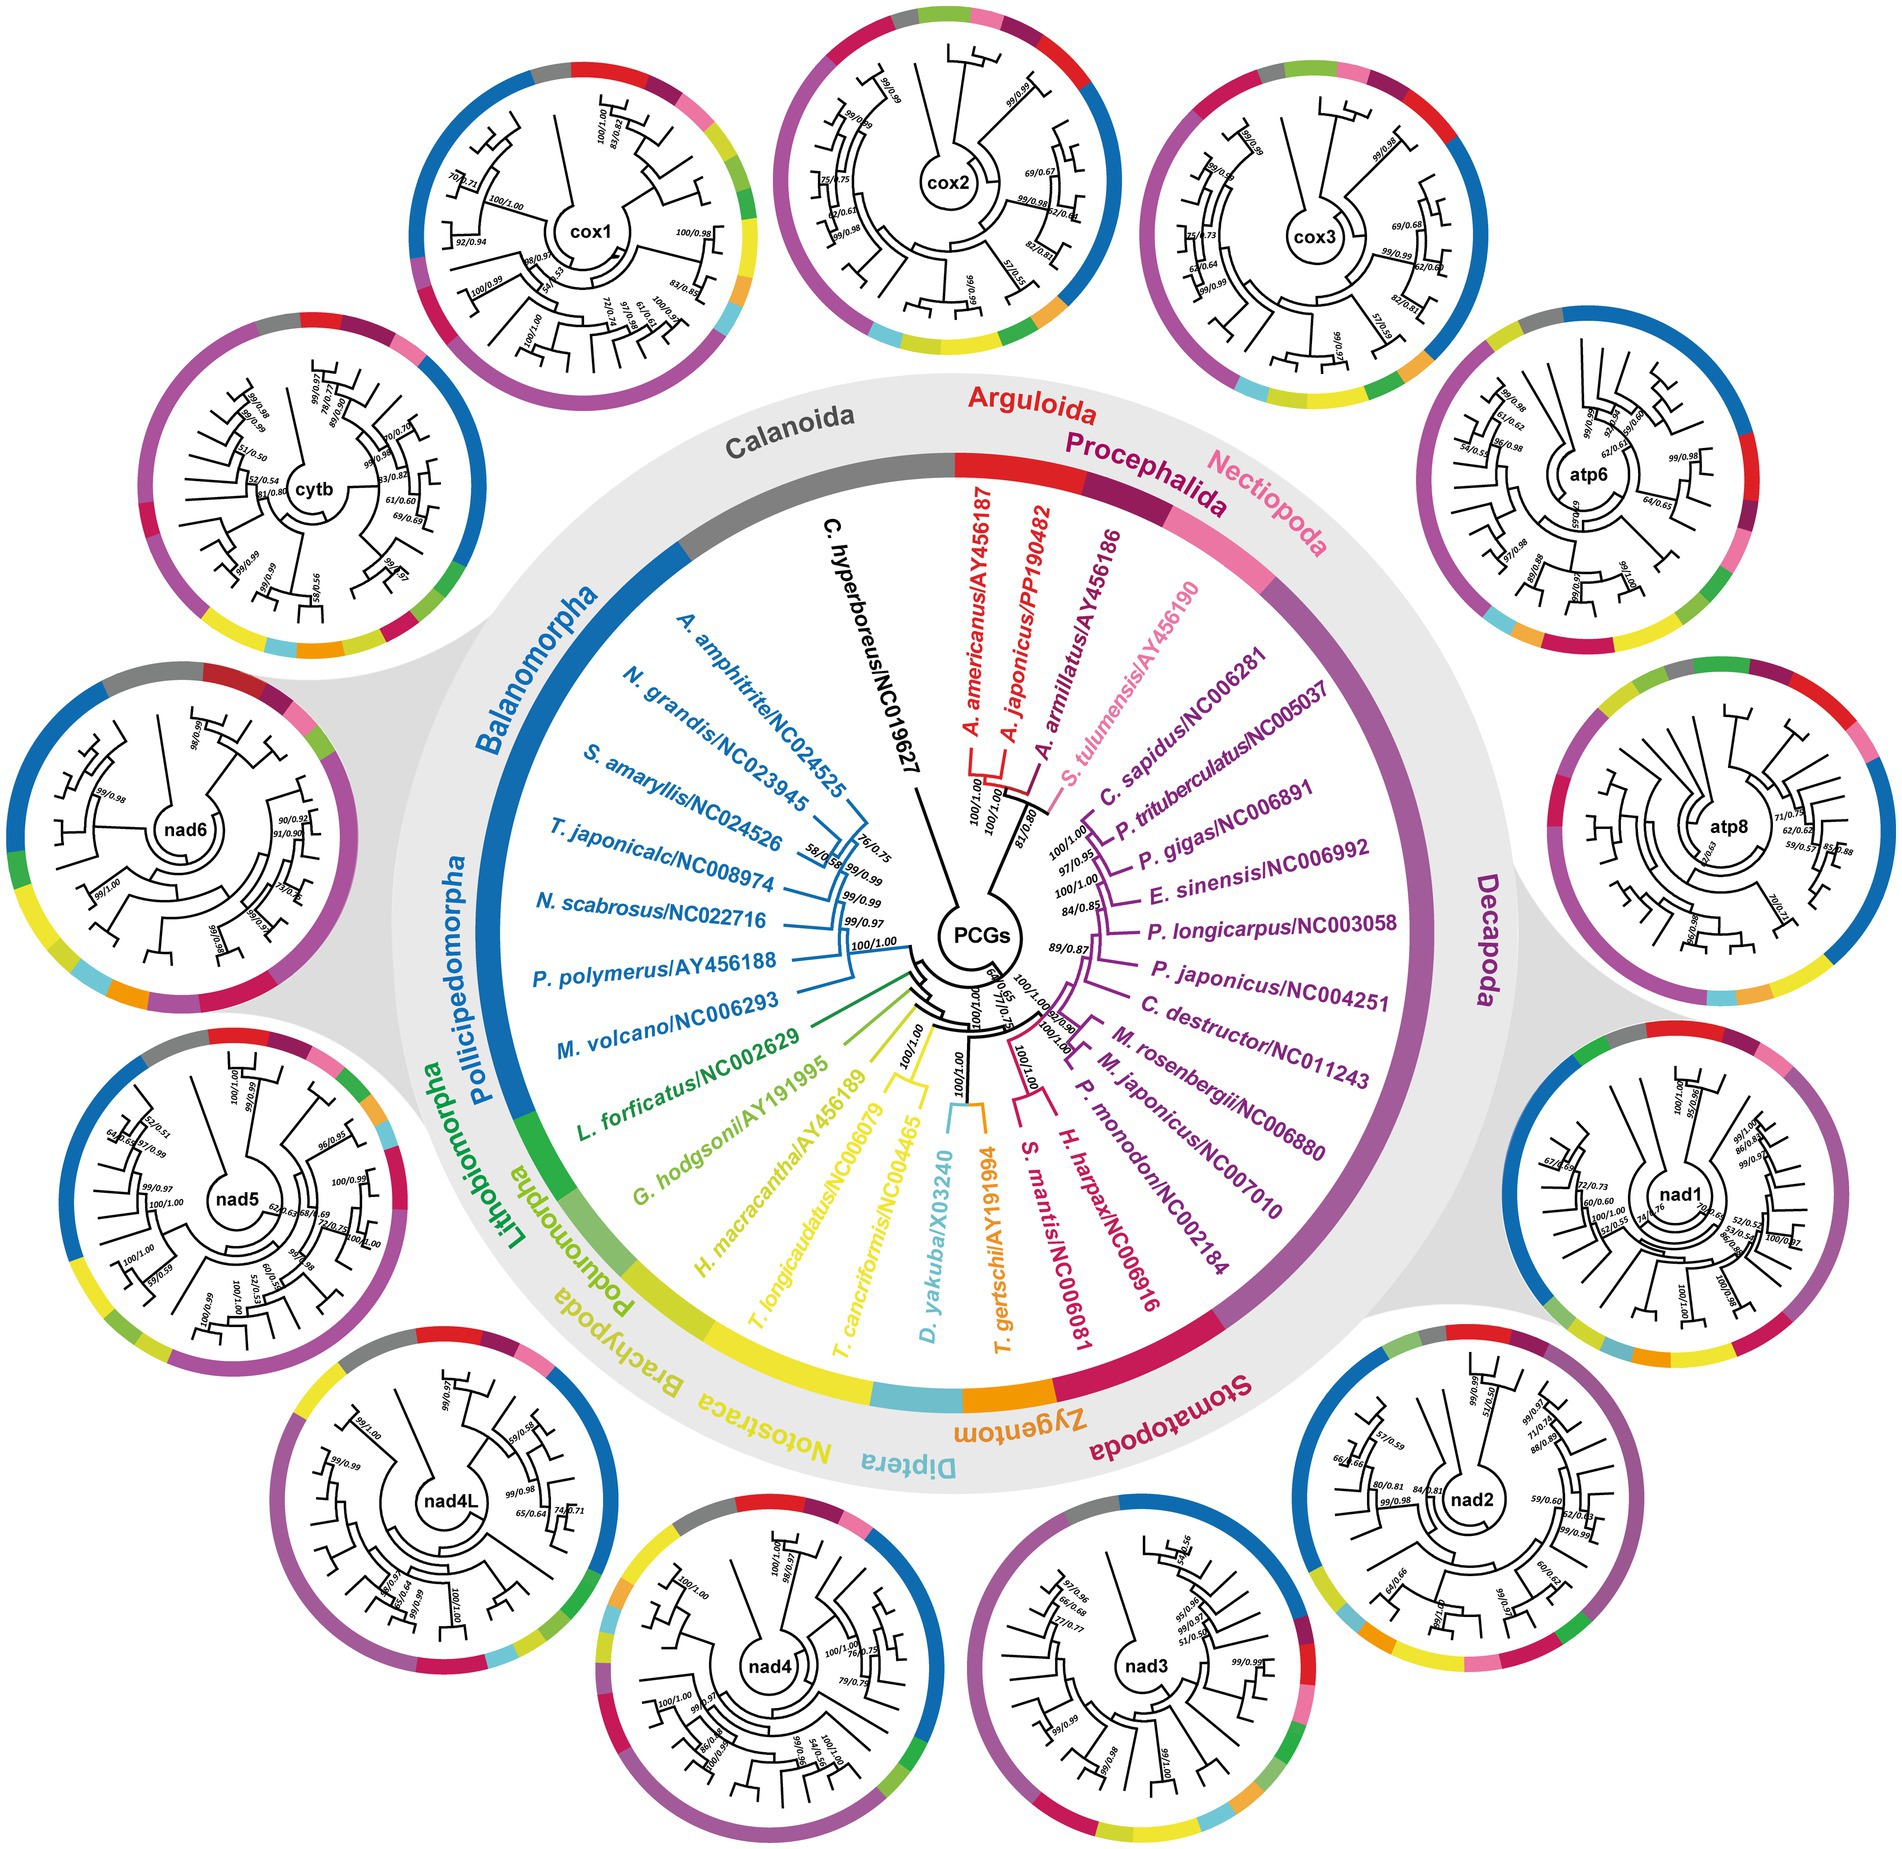
Figure 5. Phylogenetic relationships among crustacean species. Phylogenies are inferred on the basis of the amino acid sequences of single or concatenated PCGs of A. japonicus and other crustacean species using MP and BI methods. One Calanoida species (C. hyperboreus) is used as the outgroup and included in each tree. The central tree is reconstructed based on the concatenated amino acid sequences of 13 PCGs, and the outside 13 individual trees are reconstructed based on the single PCG. The single PCG-based trees that share the same topology as the concatenated PCG-based trees are highlighted with gray shading. The numbers along the branches indicate bootstrap values/posterior probabilities resulting from different analyses in the order MP/BI. Values less than 50/0.5 are not displayed.
Furthermore, single PCG-based phylogenies were also achieved to identify the potential genetic marker candidates for molecular diagnostics and phylogenetic studies in Crustacea. As shown in Figure 5, it was apparent that although most PCGs exhibited diverse topologies, the classification relationships between Arguloida and Porocephalida as well as between Diptera and Zygentoma were stable in the cytb-, cox1-, nad1-, nad2-, nad4-6-, and atp6-based analyses, consistent with findings reported in previous studies (11, 44, 47, 49, 64). Further comparisons of these tree structures revealed that the nad1 and nad6 genes shared a similar phylogenetic topology with that of the genome-based phylogeny in comparison to other PCGs, suggesting their potential as the most suitable genetic markers instead of the complete mitogenomes for molecular diagnostic, systematic, and evolutionary biological studies of A. japonicus and related crustacean species. Of course, their marker effectiveness remains to be further tested by using more crustacean mitogenomes. Therefore, there is no doubt that the concatenated PCG datasets might be the optimal marker choice for evolutionary and phylogenetic studies of crustacean species.
4 Conclusion
In the present study, we presented a comprehensive characterization of the evolutionary blueprint of A. japonicus by sequencing the complete mitogenome and its genetic comparisons with other related species. Comparative genomics indicated that among PCGs, cox1 was the most conserved gene, whereas nad6 was the most varied gene. Genome- and single-gene-based phylogenies supported a close relationship between A. japonicus and A. americanus within the family Argulidae. Further phylogenetic relationship comparisons suggested potential applications of the nad1 and nad6 genes as novel genetic markers for evolutionary and phylogenetic studies of crustacean species. These results are expected to have implications for molecular diagnostic methods, epidemiological investigations, and the control of A. japonicus. The information will also be important in the refinement of the phylogenetic relationships within Crustacea and in accumulating valid markers for systematic, population genetic, and evolutionary biological studies of parasitic crustaceans of socio-economic importance.
Data availability statement
The data presented in the study is deposited in the GenBank repository, accession number PP190482.
Ethics statement
The manuscript presents research on animals that do not require ethical approval for their study.
Author contributions
LW: Conceptualization, Data curation, Formal analysis, Investigation, Methodology, Software, Validation, Visualization, Writing – original draft. ZH: Conceptualization, Data curation, Formal analysis, Investigation, Methodology, Software, Validation, Visualization, Writing – original draft. ZW: Conceptualization, Data curation, Formal analysis, Investigation, Methodology, Software, Validation, Visualization, Writing – original draft. PZ: Formal analysis, Methodology, Software, Visualization, Writing – original draft. GW: Formal analysis, Software, Visualization, Writing – original draft. XF: Data curation, Visualization, Writing – original draft. JH: Formal analysis, Visualization, Writing – original draft. RW: Formal analysis, Writing – original draft. HW: Conceptualization, Project administration, Supervision, Writing – original draft, Writing – review & editing. YX: Conceptualization, Funding acquisition, Investigation, Project administration, Supervision, Writing – original draft, Writing – review & editing.
Funding
The author(s) declare financial support was received for the research, authorship, and/or publication of this article. This study was supported by the National Natural Science Foundation of China (grant no. 32273028 to YX).
Acknowledgments
The authors are grateful to Xuan Zhou and Ruiyi Lizhao (Sichuan Agricultural University, China), who helped in the collection of samples.
Conflict of interest
The authors declare that the research was conducted in the absence of any commercial or financial relationships that could be construed as a potential conflict of interest.
Publisher’s note
All claims expressed in this article are solely those of the authors and do not necessarily represent those of their affiliated organizations, or those of the publisher, the editors and the reviewers. Any product that may be evaluated in this article, or claim that may be made by its manufacturer, is not guaranteed or endorsed by the publisher.
Supplementary material
The Supplementary material for this article can be found online at: https://www.frontiersin.org/articles/10.3389/fvets.2024.1376898/full#supplementary-material
Abbreviations
18S, Small ribosomal protein 18; mt, mitochondrial; MP, maximum parsimony; BI, Bayesian inference; PCG, protein-coding gene; tRNA, transfer RNA; rRNA, ribosomal RNA; Ka, non-synonymous substitutions; Ks, synonymous substitutions; RSCU, relative synonymous codon usage.
Footnotes
4. ^https://www.biologiaevolutiva.org/jcastresana/Gblocks.html
References
1. Walker, PD, Flik, G, and Bonga, SEW. The biology of parasites from the genus Argulus and a review of the interactions with its host In: GF Wiegertjes and G Flik, editors. Host-parasite interactions. Abingdon: Garland Science (2004). 107–28.
2. Tam, Q. Aspects of the biology of Argulus. Master of Science (MSc): University of Johannesburg (2008).
3. Sinha, A, Kumar, S, and Kumari, K. Outlook of climate change and fish nutrition. Singapore: Springer (2022). 433 p.
4. Nagasawa, K, Nitta, M, and Azuma, N. New records of a freshwater fish parasite Argulus japonicus (Branchiura: Argulidae) from northern Honshu, Japan, with a note on its occurrence in a brackish water lake. Crustac Res. (2024) 53:1–15. doi: 10.18353/crustacea.53.0_1
5. Al Mamun, MA, Nasren, S, Rathore, S, and Ramesh, K. Histopathological studies of pond reared Indian major carp, Catla catla infested with Argulus japonicus and trial for argulosis treatment. Punjab Univ J Zool. (2021) 36:131–39. doi: 10.17582/journal.pujz/2021.36.2.131.139
6. Yang, H, and Gu, M. First report of Argulus japonicus on largemouth bass and phylogenetic analysis of Argulus. J Huazhong Agric Univ. (2021) 40:141–8. doi: 10.13300/j.cnki.hnlkxb.2021.04.017
7. Nagasawa, K. Distribution of fish parasites Argulus japonicus and Argulus coregoni (Crustacea: Branchiura: Argulidae) in the Lake Biwa Basin, Central Japan. Species Divers. (2023) 28:217–23. doi: 10.12782/specdiv.28.217
8. Koyuncu, CE. The first record of Argulus japonicus Thiele, 1900 infestations on telescope fish (Carassius auratus) of Mersin in Turkey. Adv Underw Sci. (2021) 16:66–70. doi: 10.22392/actaquatr.587691
9. Avenant-Oldewage, A. Argulus japonicus in the Olifants river system - possible conservation threat? S Afr J Wildl. (2001) 31:59–63.
10. Wafer, LN, Whitney, JC, and Jensen, VB. Fish lice (Argulus japonicus) in goldfish (Carassius auratus). Comp Med. (2015) 65:93–5.
11. Budijono, B, Kamaruddin, E, Harjoyudanto, Y, Windarti, W, Fauzi, M, Riauwaty, M, et al. First report of Argulus ectoparasite from Koto Panjang reservoir, Indonesia. IOP Conf Ser Earth Environ Sci. (2022) 1118:012061. doi: 10.1088/1755-1315/1118/1/012061
12. Radkhah, AR, and Eagderi, S. Prevalence of fish lice, Argulus (Crustacea: Branchiura) in freshwater and two ornamental fishes of Iran. J Fish. (2022) 10:103301. doi: 10.17017/j.fish.383
13. Safdar, M. Molecular identification of Argulus japonicus in red cap oranda goldfish (Carassius auratus) in Multan. Pakistan Zeugma Biol Sci. (2020) 1:42–6.
14. Alsarakibi, M, Wadeh, H, and Li, G. Influence of environmental factors on Argulus japonicus occurrence of Guangdong province, China. Parasitol Res. (2014) 113:4073–83. doi: 10.1007/s00436-014-4076-5
15. Alsarakibi, M, Wadeh, H, and Li, G. Parasitism of Argulus japonicus in cultured and wild fish of Guangdong, China with new record of three hosts. Parasitol Res. (2014) 113:769–75. doi: 10.1007/s00436-013-3708-5
16. DeSalle, R, Feindt, W, and Schierwater, B. Invertebrate phylogenomics In: B Schierwater and R DeSalle, editors. Invertebrate zoology. Boca Raton, FL: CRC Press (2021). 19–38.
17. Nagasawa, K, Katahira, H, and Mizuno, K. New host and locality of the fish ectoparasite Argulus japonicus (Crustacea, Branchiura, Argulidae) in Japan, with a note on its heavy infection. Biogeography. (2010) 12:17–20.
18. Brahmchari, RK, Kumar, S, Kumari, P, and Kumar, K. Argulus parasitism in aquaculture: an elevated temperature scenario In: A Sinha, S Kumar, and K Kumari, editors. Outlook of climate change and fish nutrition. Singapore: Springer (2022). 133–52.
19. Tandel, RS, Chanu, KV, Hussain Bhat, RA, Dash, P, Shah, TK, and Thakuria, D. Morphometric and molecular identification of Argulus japonicus (Thiele 1900) in vulnerable Himalayan snow trout, Schizothorax richardsonii (Gray 1832). Aquac Res. (2021) 52:6770–8. doi: 10.1111/are.15486
20. Chong, RSM. Chapter 3 - general introduction to pathophysiology of finfish, crustacea, and mollusks In: FSB Kibenge, B Baldisserotto, and RSM Chong, editors. Aquaculture pathophysiology. Amsterdam: Academic Press (2022). 49–71.
21. Al-Darwesh, A, Alwan, M, and Fares, B. Diagnostic and pathological study of Argulus japonicas in goldfish (Carassius auratus). GJBB. (2014) 3:384–7.
22. Zhang, W, Li, H, Zhao, Y, Guan, C, Chai, R, Yang, C, et al. Secondary structure construction and molecular identification of rRNA 18S V4 region E23-5-E23-6 of parasitic lice of Hominidae. Acta Trop. (2023) 238:106772. doi: 10.1016/j.actatropica.2022.106772
23. Ouarti, B, Mediannikov, O, Righi, S, Benakhla, A, Raoult, D, and Parola, P. Molecular detection of microorganisms in lice collected from farm animals in northeastern Algeria. Comp Immunol Microbiol Infect Dis. (2021) 74:101569. doi: 10.1016/j.cimid.2020.101569
24. Boumbanda-Koyo, CS, Mediannikov, O, Amanzougaghene, N, Oyegue-Liabagui, SL, Imboumi-Limoukou, RK, Raoult, D, et al. Molecular identification of head lice collected in Franceville (Gabon) and their associated bacteria. Parasit Vectors. (2020) 13:410. doi: 10.1186/s13071-020-04293-x
25. Sahoo, PK, Mohanty, J, Garnayak, SK, Mohanty, BR, Kar, B, Jena, J, et al. Genetic diversity and species identification of Argulus parasites collected from major aquaculture regions of India using RAPD-PCR. Aquac Res. (2013) 44:220–30. doi: 10.1111/j.1365-2109.2011.03025.x
26. Patra, A, Mondal, A, Banerjee, S, Adikesavalu, H, Joardar, SN, and Abraham, TJ. Molecular characterization of Argulus bengalensis and Argulus siamensis (Crustacea: Argulidae) infecting the cultured carps in West Bengal, India using 18S rRNA gene sequences. Mol Biol Res Commun. (2016) 5:156–66.
27. Amriana, SKD, and Sriwulan, AH. Morphological and molecular description of Argulus indicus Weber, 1892 (Crustacea: Branchiura) found from striped snakehead fish (Channa striata) in Lake Towuti, Indonesia. AACL Bioflux. (2021) 14:1373–82.
28. Vasquez, AA, Bonnici, BL, Kashian, DR, Trejo-Martinez, J, Miller, CJ, and Ram, JL. The biodiversity of freshwater crustaceans revealed by taxonomy and mitochondrial DNA barcodes In: V Zupo, editor. Crustaceans. Florida: CRC Press (2022). 10–25.
29. Feroz, KK, Sanker, G, and Prasanna, KC. Linking eggs and adults of Argulus spp. using mitochondrial DNA barcodes. Mitochondrial DNA Part DNA Mapp Seq Anal. (2016) 27:3927–31. doi: 10.3109/19401736.2014.987269
30. Mohanty, S, Mohanty, M, Sarma, K, Kumar, T, Dey, A, Das, P, et al. Classical morphology and DNA barcoding based identification of freshwater ectoparasite, Argulus foliaceus in rohu Labeo rohita: morphological and DNA barcoding based identification of fish ectoparasite. Indian J Fish. (2023) 70:132415–6. doi: 10.21077/ijf.2023.70.1.132415-16
31. Wadeh, H, Alsarakibi, M, and Li, G. Analysis of genetic variability within Argulus japonicus from representatives of Africa, Middle East, and Asia revealed by sequences of three mitochondrial DNA genes. Parasitol Res. (2010) 107:547–53. doi: 10.1007/s00436-010-1891-1
32. Song, F, Li, H, Liu, GH, Wang, W, James, P, Colwell, DD, et al. Mitochondrial genome fragmentation unites the parasitic lice of eutherian mammals. Syst Biol. (2019) 68:430–40. doi: 10.1093/sysbio/syy062
33. Sweet, AD, Johnson, KP, and Cameron, SL. Independent evolution of highly variable, fragmented mitogenomes of parasitic lice. Commun Biol. (2022) 5:677. doi: 10.1038/s42003-022-03625-0
34. Wadeh, H, Yang, JW, and Li, GQ. Ultrastructure of Argulus japonicus Thiele, 1900 (Crustacea: Branchiura) collected from Guangdong, China. Parasitol Res. (2008) 102:765–70. doi: 10.1007/s00436-007-0837-8
35. Baker, BJ, De Anda, V, Seitz, KW, Dombrowski, N, Santoro, AE, and Lloyd, KG. Diversity, ecology and evolution of Archaea. Nat Microbiol. (2020) 5:887–900. doi: 10.1038/s41564-020-0715-z
36. Rovie-Ryan, JJ, Gani, M, Lee, YP, Gan, HM, and Abdullah, MT. Mitogenome data of Nycticebus coucang insularis Robinson, 1917 (primate: Lorisidae). Data Brief. (2019) 25:104058. doi: 10.1016/j.dib.2019.104058
37. Shen, X, Tsang, LM, Chu, KH, Achituv, Y, and Chan, BKK. Mitochondrial genome of the intertidal acorn barnacle Tetraclita serrata Darwin, 1854 (Crustacea: Sessilia): gene order comparison and phylogenetic consideration within Sessilia. Mar Genomics. (2015) 22:63–9. doi: 10.1016/j.margen.2015.04.004
38. Kuznetsov, A, and Bollin, CJ. NCBI genome workbench: desktop software for comparative genomics, visualization, and gen Bank data submission. Methods Mol Biol Clifton NJ. (2021) 2231:261–95. doi: 10.1007/978-1-0716-1036-7_16
39. Lalitha, S. Primer Premier 5. Biotech Softw Internet Rep. (2000) 1:270–2. doi: 10.1089/152791600459894
40. Tamura, K, Stecher, G, and Kumar, S. MEGA11: molecular evolutionary genetics analysis version 11. Mol Biol Evol. (2021) 38:3022–7. doi: 10.1093/molbev/msab120
41. Li, W, Qiu, N, and Du, H. Complete mitochondrial genome of Rhodeus cyanorostris (Teleostei, Cyprinidae): characterization and phylogenetic analysis. Zoo Keys. (2022) 1081:111–25. doi: 10.3897/zookeys.1081.77043
42. Rozas, J, Ferrer-Mata, A, Sánchez-Del Barrio, JC, Guirao-Rico, S, Librado, P, Ramos-Onsins, SE, et al. Dna SP 6: DNA sequence polymorphism analysis of large data sets. Mol Biol Evol. (2017) 34:3299–302. doi: 10.1093/molbev/msx248
43. Goloboff, PA, Catalano, SA, and Torres, A. Parsimony analysis of phylogenomic datasets (II): evaluation of PAUP*, MEGA and MPBoot. Cladistics. (2022) 38:126–46. doi: 10.1111/cla.12476
44. Luchetti, A, Forni, G, Skaist, AM, Wheelan, SJ, and Mantovani, B. Mitochondrial genome diversity and evolution in Branchiopoda (Crustacea). Zool Lett. (2019) 5:15. doi: 10.1186/s40851-019-0131-5
45. Jakovlić, I, Zou, H, Zhao, XM, Zhang, J, Wang, GT, and Zhang, D. Evolutionary history of inversions in directional mutational pressures in crustacean mitochondrial genomes: implications for evolutionary studies. Mol Phylogenet Evol. (2021) 164:107288. doi: 10.1016/j.ympev.2021.107288
46. Baeza, JA. An introduction to the special section on crustacean mitochondrial genomics: improving the assembly, annotation, and characterization of mitochondrial genomes using user-friendly and open-access bioinformatics tools, with decapod crustaceans as an example. J Crustac Biol. (2022) 42:ruac012. doi: 10.1093/jcbiol/ruac012
47. Sterling-Montealegre, RA, and Prada, CF. Variability and evolution of gene order rearrangement in mitochondrial genomes of arthropods (except Hexapoda). Gene. (2024) 892:147906. doi: 10.1016/j.gene.2023.147906
48. Zhang, D, Zou, H, Zhang, J, Wang, G, and Jakovlić, I. Evolutionary history of inversions in the direction of architecture-driven mutational pressures in crustacean mitochondrial genomes. bioRxiv. (2020). doi: 10.1101/2020.05.09.085712
49. Lavrov, DV, Brown, WM, and Boore, JL. Phylogenetic position of the Pentastomida and (pan)crustacean relationships. Proc Biol Sci. (2004) 271:537–44. doi: 10.1098/rspb.2003.2631
50. Passmore, LA, and Coller, J. Roles of mRNA poly(a) tails in regulation of eukaryotic gene expression. Nat Rev Mol Cell Biol. (2022) 23:93–106. doi: 10.1038/s41580-021-00417-y
51. Koludarova, L, and Battersby, BJ. Mitochondrial protein synthesis quality control. Hum Mol Genet. (2024):ddae012. doi: 10.1093/hmg/ddae012
52. Kim, S, Lim, BJ, Min, GS, and Choi, HG. The complete mitochondrial genome of Arctic Calanus hyperboreus (Copepoda, Calanoida) reveals characteristic patterns in calanoid mitochondrial genome. Gene. (2013) 520:64–72. doi: 10.1016/j.gene.2012.09.059
53. Mukherjee, A, Ghosh, A, Tyagi, K, Kumar, V, Banerjee, D, and Naskar, A. Characterization of complete mitochondrial genome of three horse flies of the genus Tabanus (Diptera: Tabanidae): comparative analysis. Mol Biol Rep. (2023) 50:9897–908. doi: 10.1007/s11033-023-08837-z
54. Yasuike, M, Leong, J, Jantzen, SG, von Schalburg, KR, Nilsen, F, Jones, SRM, et al. Genomic resources for sea lice: analysis of ESTs and mitochondrial genomes. Mar Biotechnol N Y N. (2012) 14:155–66. doi: 10.1007/s10126-011-9398-z
55. Hurst, LD. The Ka/Ks ratio: diagnosing the form of sequence evolution. Trends Genet TIG. (2002) 18:486–7. doi: 10.1016/s0168-9525(02)02722-1
56. Luo, L, Xu, Y, Wang, S, Zhang, R, Guo, K, Xu, W, et al. Complete mitochondrial genome sequence and phylogenetic analysis of Procambarus clarkii and Cambaroides dauricus from China. Int J Mol Sci. (2023) 24:11282. doi: 10.3390/ijms241411282
57. Lagunas-Calvo, O, López-Jiménez, S, Oceguera-Figueroa, A, Lagunas-Calvo, O, López-Jiménez, S, and Oceguera-Figueroa, A. Phylogenetic position of Dolops bidentata (Ichthyostraca: Argulidae) based on molecular data: first record of the genus in Mexico. Rev Mex Biodivers. (2021) 92:923656. doi: 10.22201/ib.20078706e.2021.92.3656
58. Lim, JT, and Hwang, UW. The complete mitochondrial genome of Pollicipes mitella (Crustacea, Maxillopoda, Cirripedia): non-monophylies of Maxillopoda and Crustacea. Mol Cells. (2006) 22:314–22. doi: 10.1016/S1016-8478(23)17426-7
59. Chen, Q, Chen, W, Hu, Y, Ma, K, and Guo, Z. Morphology and molecular phylogeny of ornamental freshwater prawns of the genus Macrobrachium (Decapoda, Caridea, Palaemonidae) from China with the description of a new species. Crustaceana. (2021) 94:1201–20. doi: 10.1163/15685403-bja10149
60. Koenemann, S, and Jenner, R. The position of crustaceans within Arthropoda - evidence from nine molecular loci and morphology In: S Koenemann and R Jenner, editors. Crustacea and arthropod relationships. Boca Raton, FL: CRC Press (2005). 307–53.
61. Møller, O. Branchiura (Crustacea) - survey of historical literature and taxonomy. Arthropod Syst Phylogeny. (2009) 67:41–55. doi: 10.3897/asp.67.e31687
62. Humphreys, WF, Li, D, Neiber, MT, Koenemann, S, Iliffe, TM, Schram, FR, et al. Phylogenetic analysis and systematic revision of Remipedia (Nectiopoda) from bayesian analysis of molecular data. J Crustac Biol. (2013) 33:603–19. doi: 10.1163/1937240X-00002179
63. Palecanda, S, Iwanicki, T, Steck, M, and Porter, ML. Crustacean conundrums: a review of opsin diversity and evolution. Philos Trans R Soc Lond Ser B Biol Sci. (2022) 377:20210289. doi: 10.1098/rstb.2021.0289
Keywords: Argulus japonicus, fish lice, genetic markers, mitogenomes, phylomitogenomics
Citation: Wang L, Hu Z, Wang Z, Zhu P, Wei G, Fan X, Huang J, Wang R, Wang H and Xie Y (2024) Complete Mitogenome sequencing of the fish louse Argulus japonicus (Crustacea: Branchiura): Comparative analyses and phylogenetic implications. Front. Vet. Sci. 11:1376898. doi: 10.3389/fvets.2024.1376898
Edited by:
Nicola Pugliese, University of Bari Aldo Moro, ItalyReviewed by:
Zuhal Önder, Erciyes University, TürkiyeBasanta Kumar Das, Central Inland Fisheries Research Institute (ICAR), India
Copyright © 2024 Wang, Hu, Wang, Zhu, Wei, Fan, Huang, Wang, Wang and Xie. This is an open-access article distributed under the terms of the Creative Commons Attribution License (CC BY). The use, distribution or reproduction in other forums is permitted, provided the original author(s) and the copyright owner(s) are credited and that the original publication in this journal is cited, in accordance with accepted academic practice. No use, distribution or reproduction is permitted which does not comply with these terms.
*Correspondence: Hui Wang, aHVpd2FuZzAxMEBzaWNhdS5lZHUuY24=; Yue Xie, eHl1ZTE5ODVAZ21haWwuY29t
†These authors have contributed equally to this work and share first authorship