 Antti Iivanainen1*†
 Carlos Fernando Collares2†
 Jakob Wandall3,4
 Anna Parpala5
 Anne Nevgi6
 Riikka Keto-Timonen7
 Andrea Tipold8
 Elisabeth Schaper9
 Theo van Haeften10,11Tina Holberg Pihl12
 Charles McLean Press13
 Peter Holm4 for VetRepos consortium
- 1Department of Biosciences, Faculty of Veterinary Medicine, University of Helsinki, Helsinki, Finland
- 2Medical Education Unit, Faculty of Medicine and Biomedical Sciences, University of Algarve, Faro, Portugal
- 3NordicMetrics ApS, Copenhagen, Denmark
- 4Department of Veterinary and Animal Science, Faculty of Medical and Health Sciences, University of Copenhagen, Frederiksberg, Denmark
- 5Centre for University Teaching and Learning HYPE, Faculty of Educational Sciences, University of Helsinki, Helsinki, Finland
- 6Caledonia Hub (Campus Learning and Development Initiatives), Faculty of Educational Sciences, University of Helsinki, Helsinki, Finland
- 7Department of Food Hygiene and Environmental Health, Faculty of Veterinary Medicine, University of Helsinki, Helsinki, Finland
- 8Clinic for Small Animals, Neurology, University of Veterinary Medicine Hannover, Foundation, Hannover, Germany
- 9Centre for E-learning, Didactics and Educational Research, University of Veterinary Medicine Hannover, Foundation, Hannover, Germany
- 10Department of Biomolecular Health Sciences, Faculty of Veterinary Medicine, University of Utrecht, Utrecht, Netherlands
- 11Center for Academic Teaching and Learning, Utrecht University, Utrecht, Netherlands
- 12Department of Veterinary Clinical Sciences, Faculty of Health and Medical Sciences, University of Copenhagen, Taastrup, Denmark
- 13Department of Preclinical Sciences and Pathology, Faculty of Veterinary Medicine, Norwegian University of Life Sciences, Ås, Norway
Introduction: This study investigates the relationship between approaches to learning, self-perceived study burnout, and the level of knowledge among veterinary students. Veterinary educational programs are under regular development and would benefit greatly from detailed feedback on students' knowledge, proficiency, influencing factors, and coping mechanisms.
Methods: The VetRepos consortium developed and calibrated an item repository testing knowledge across the entire veterinary curriculum. Two hundred forty-eight students from seven European veterinary institutions took the VetRepos test, comprising a subset of the repository. They also responded to a questionnaire assessing deep and unreflective learning approaches and self-perceived study burnout, represented by exhaustion and cynicism. Structural equation modeling analyzed the relationship between these latent traits and the VetRepos test score.
Results: The model failed the exact-fit test but was retained based on global fit indices, inter-item residual correlations, and standardized residual covariances. Root Mean Square Error of Approximation with robust standard errors and scaled test statistic was 0.049 (95% confidence interval 0.033–0.071), scaled and robust Comparative Fit Index 0.95 (0.90–0.98), and scaled Standardized Root Mean Square Residual 0.056 (0.049–0.071). Measurement invariance across study years was not violated (ΔCFI = 0.00, χ2 = 3.78, Δdf = 4, p = 0.44), but it could not be confirmed between genders or universities. The VetRepos test score regressed on the study year [standardized regression coefficient = 0.68 (0.62–0.73)], showed a negative regression on the unreflective learning approach [−0.25 (−0.47 to −0.03)], and a positive regression on the deep approach [0.16 (0.03–0.28)]. No direct association with perceived burnout was observed; however, a significant, medium-sized association was found between the unreflective approach and self-perceived study burnout. No significant differences in learning approaches or perceived burnout were found between study years.
Discussion: The most important source of variance in VetRepos test scores, unrelated to the study year, was the learning approach. The association between the VetRepos test score and self-perceived burnout was indirect. Future research should complement this cross-sectional approach with longitudinal and person-oriented studies, further investigating the relationship between study burnout and learning approaches.
1 Introduction
Progress testing (PT) is a longitudinal assessment strategy that has become integral to student assessment in medical education (1). Students take the test several times during their studies. A test typically contains ~100–200 multiple-choice questions or true/false statements covering the entire curriculum. As studies progress, the students' knowledge and proficiency accumulate in parallel with an increase in their test scores. In veterinary medical education, PT is, however, still relatively uncommon. After a pilot project at Utrecht University (2), PT has been implemented to our knowledge only in German-speaking programs in Germany, Austria, and Switzerland (3). In 2019, representatives from veterinary educational establishments in Denmark, Finland, Germany, the Netherlands, Norway, and Sweden, together with the European Association of Establishments for Veterinary Education (EAEVE), formed the VetRepos consortium for creating and calibrating an item repository for progress testing (4). The repository contains 821 test items of varying degrees of difficulty that test the veterinary curriculum, as outlined by EAEVE (5). The VetRepos test uses the unidimensional Rasch model to calculate scores and calibrate item difficulty parameters (6). The item difficulty parameters from the VetRepos test have been calibrated using anchor items to compare the scores across test trials. A thorough description of the VetRepos test can be found in Schaper et al. (4). A single test score per student was used in the current cross-sectional study. Our study does not utilize the longitudinal aspects of PT.
The theoretical basis of deep and unreflective dimensions in the approach to learning stems from the 1970s and 1980s (7–9), and the related scales have been iteratively refined (7–9). Approaches to learning are not psychological states but are learned during schooling (10). The deep approach refers to the focus on meaning during learning; concurrently, the unreflective approach (also called the surface approach) refers to students' focus on memorizing details without attempting to understand the meaning of the subject (11, 12). Although various other approaches to learning and studying, including, e.g., strategic, achieving, or organized approaches, have been identified and characterized over the decades (9), we decided to focus on the deep and unreflective approaches. These fundamental learning approaches have been replicated in several studies and are widely accepted in the community of pedagogical scientists (7, 9, 13–15).
Burnout at work is an occupational stress-related affective response encompassing exhaustion, cynicism, and feelings of inadequacy (16). Similar dimensionality has also been discovered in the perception of burnout related to school or university studies (17, 18). The perception of burnout is common among students in medicine as well as in veterinary medicine, with a >40% prevalence (19, 20).
The unreflective approach to learning has been associated with self-perceived study burnout: students with an unreflective (superficial) approach experienced more exhaustion than students with a deep approach to learning, and students with a deep approach to learning experienced less exhaustion than other student groups (13, 21). The deep approach is associated with study success as measured by grade point average (GPA) or similar metrics (22, 23) that depend on an individual test, study program, or university.
The purpose of the present study is to investigate the use of VetRepos test scores as a simple measure of study success across European veterinary schools in the VetRepos consortium and to illustrate the relationships between the VetRepos test score, deep and unreflective approaches to learning, and self-perceived study burnout. In addition, we hope to identify patterns between these variables, which warrant additional research.
2 Methods
2.1 Data collection
As a part of a progress test development project, “VetRepos,” between European establishments of veterinary education (4, 24), veterinary students from seven European universities were invited to participate in a trial test (hereafter, the VetRepos test) that was open from June to August 14, 2023. The test comprised questions across the veterinary curriculum as outlined by EAEVE (5). Students were also invited to fill out an electronic questionnaire with 17 statements on approaches to learning and self-perceived study burnout (hereafter, the study questionnaire).
The trial was announced using email lists, in-house news bulletins, and face-to-face discussions on various occasions where students gathered. Participation in the study was voluntary. The students were free to participate in the study at any time between the opening and closing of the VetRepos test and the study questionnaire. There was no time limit for their participation. The participants were instructed not to prepare specifically for the test or use additional reference materials. Whether the participants had prepared for the test or used additional materials was not controlled.
2.2 Data protection regulation
The European Union's General Data Protection Regulation 2016/679 (GDPR) was strictly followed during all study phases. Before being allowed to proceed with the VetRepos test or the study questionnaire, the students were informed about the purpose of the study, the methods of data storage and handling, and their rights, including the right to be forgotten (25) and to withdraw their consent at any time. Only those students who provided explicit consent were allowed to proceed with the VetRepos test or the study questionnaire. The data were collected via a secure web interface, and both the VetRepos test questions and study questionnaire statements were hosted on QualtricsXM at Utrecht University, ensuring compliance with GDPR standards (26).
2.3 The respondents
The data comprised responses from 257 veterinary students who filled out the study questionnaire and participated in the VetRepos test. Twelve students had participated in a similar VetRepos test earlier (see Section 2.4) and filled out only the study questionnaire. Nine respondents with incomplete data on the study questionnaire were removed, leaving the responses of 248 students from Denmark, Finland, France, Germany, the Netherlands, Norway, and Sweden for the analyses.
The number of students between the universities ranged from 5 to 105 (Table 1A). A total of 166 (66.94%) students were in their first 3 years of their studies. The data included 29 male and 217 female students. Two students entered a gender category, “other.” The distribution of the students across study years and between women and men is presented in Table 1B.
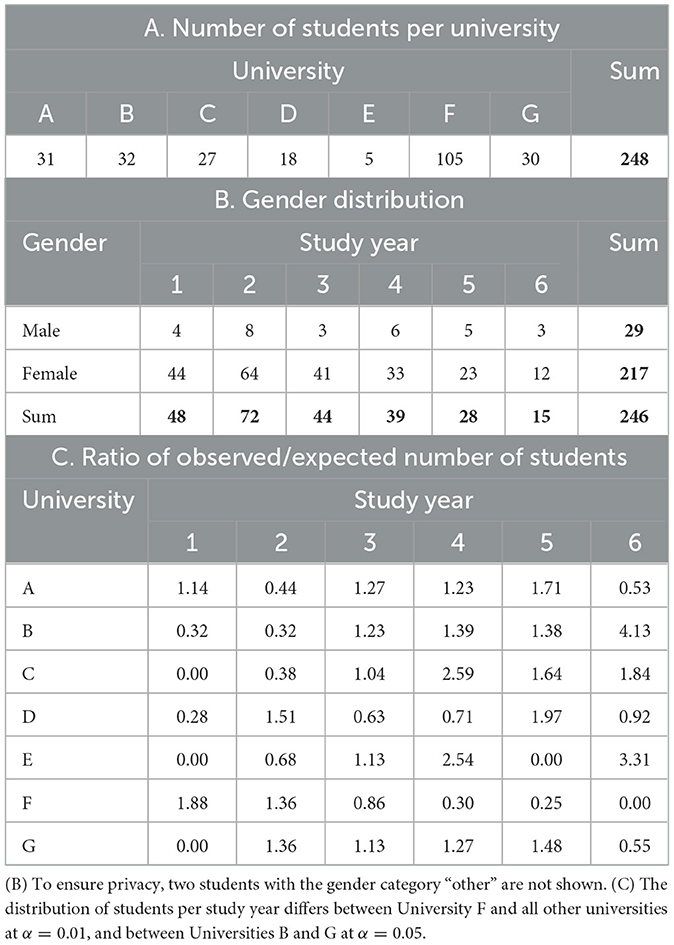
Table 1. Distribution of students across universities, study years and genders.
The participants from University F included noticeably many 1st and 2nd year students. The distribution of study years differed between students from University F vs. the other universities (Table 1C, χ2-test: χ2 statistic = 116.43, simulated p-value = 0.00050 with 2,000 iterations, followed by pairwise χ2-tests at α = 0.01). Study year distribution differed also between Universities B and G at α = 0.05 (χ2 = 12.95).
2.4 VetRepos test score
The data comprised responses to single-best-answer multiple-choice questions and true/false type statements based on additional questions or vignettes (4). The VetRepos items test knowledge across the entire veterinary curriculum, covering a range of disciplines in four subscales (17 disciplines in the basic sciences, 10 in companion animal and equine clinical sciences, 12 in animal production and production animal clinical sciences, and five in food safety and quality, public health, and one health concept). Each test trial contained 28 anchor items for test equating purposes so that the scores could be interpreted similarly throughout different test applications. The total number of items was 161 for the 245 students who took the test during the summer. The number of items ranged between 110 and 216 for the other 12 students who had taken the test earlier. The responses were scored as one (1) point for a correct answer and zero (0) points for an incorrect answer. Rasch model analysis (6) software RUMM (27) was used to place the student ability score (θ) and the item difficulty on a single linear logit scale where the mean item difficulty has a value of zero. The range of item difficulty for the items in the VetRepos database covered approximately six logit units (4).
The logit scale was linearly transformed, as has been done in the large-scale assessment studies by the International Association for the Evaluation of Educational Achievement (28, 29). The resulting VetRepos integral scale has a mean value of 500 and a standard deviation of 100 and is easier to interpret than the logit scale. This score is based on the entire VetRepos project database, which includes 1,948 respondents from the six VetRepos tests. Because of the shared anchor items, simple comparisons can be made between scores from any of the six trials. The Person Separation Index (PSI = 0.86, 95% confidence interval = 0.85–0.87) was used to estimate the reliability of the model. PSI is a more appropriate reliability estimate in Rasch model analyses than Cronbach's α coefficient, as it uses logit scores rather than raw scores for its calculation, even though they can be interpreted in the same manner. Furthermore, ~80% of the observations contained missing values, which Cronbach's α is sensitive to. The details of the development and structure of the VetRepos test are described in Schaper et al. (4).
2.5 Instruments
We used 17 items from the HowULearn (HUL, previously Learn (15, 30)] project questionnaire of the University of Helsinki to measure the students' approaches to learning and their perception of study burnout (Supplementary Table 1). All the study questionnaire statements were responded to using the Likert scale: “I completely disagree” (0), “I disagree” (1), “I neither agree nor disagree” (2), “I agree” (3), and “I completely agree” (4).
2.5.1 Approaches to learning
Eight items measuring deep vs. unreflective learning approaches (Supplementary Table 1) were partly derived from the Enhancing Teaching-Learning Environments project (8, 31). The original surface approach subscale has been renamed the unreflective approach (12). The items were tested using a large cohort of university students from Denmark, Finland, and the UK (12, 32, 33). An example statement measuring the deep approach reads, “Ideas and perspectives I've come across while I'm studying make me contemplate them from all sides,” in contrast to a statement measuring the unreflective approach, such as “Much of what I've learned seems no more than unrelated bits and pieces.”
Inspection of pairwise Spearman correlation coefficients between the items revealed that item unreflective_4 (“Often I have to repeat things in order to learn them”) differed from the rest of the indicators of the unreflective approach (Supplementary Tables 2A, B). In addition, confirmatory factor analysis revealed a low factor loading of 0.28 (0.15–0.40) for item unreflective_4 (Table 2). In exploratory factor analysis, this item loaded similarly onto two factors (Table 2). Additional evidence about the inadequacy of item unreflective_4 to measure the purported construct was further suggested by the results of a polytomous Rasch model analysis (Figure 1), as it was not able to differentiate between participants with different levels of the unreflective approach, consequently yielding visibly less information than the other items. Based on the above, responses to item unreflective_4 were removed from the data. The removal of the item slightly increased the Cronbach's α reliability coefficient from 0.61 (0.52–0.68) to 0.64 (0.56–0.71) for the unreflective approach scale (Table 3).
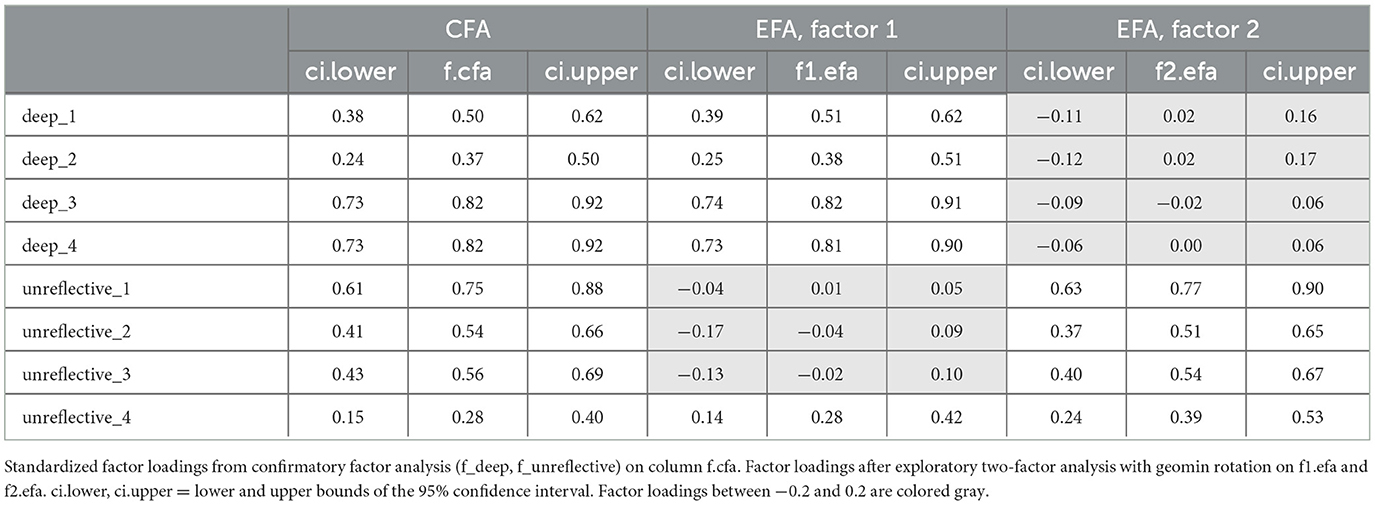
Table 2. Factor loadings on the learning approach indicator items.
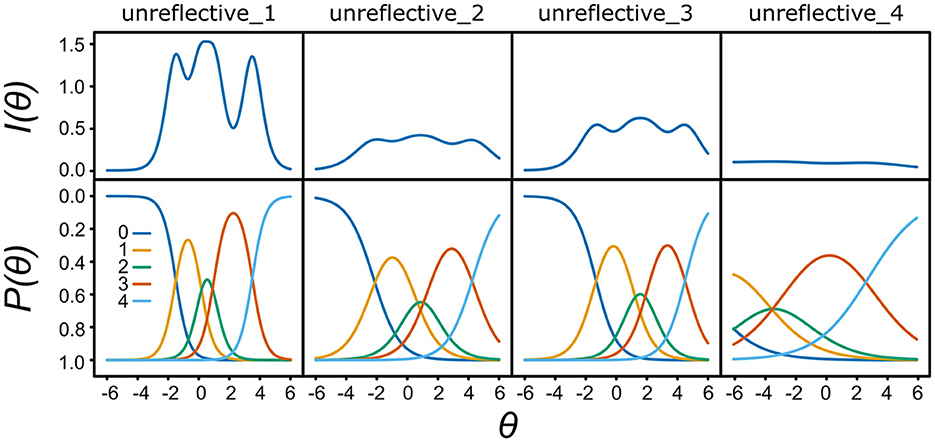
Figure 1. Information content (I) and probability (P) as functions of the level of the unreflective approach (θ). unreflective_1–4: indicator items for the unreflective approach. The Likert scale key (0–4) is indicated for P(θ). N = 248.
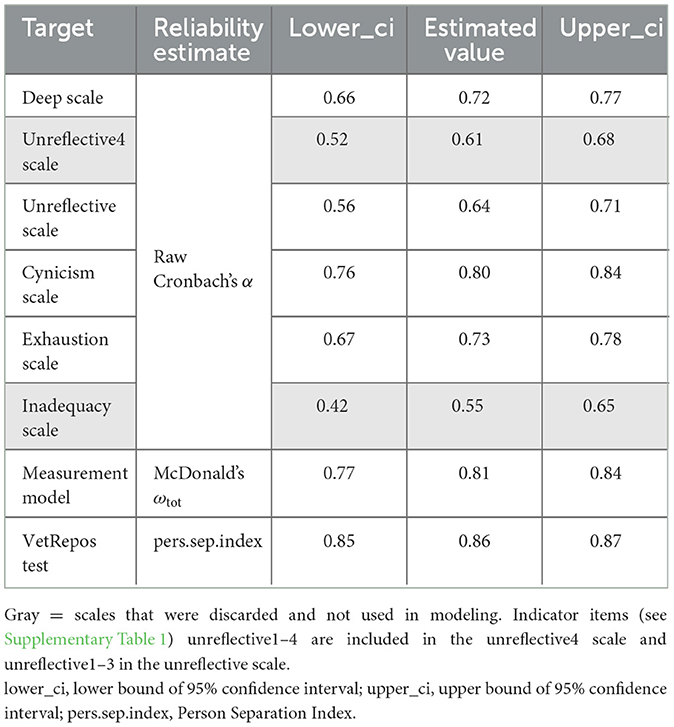
Table 3. Reliability estimates: Cronbach's α with 95% Feldt confidence intervals for the various scales, McDonald's ωtot for the entire measurement model, and Person Separation Index for the VetRepos test.
2.5.2 Self-perceived study burnout
We utilized the nine-item School Burnout Inventory (SBI-9) (17), which has been used to investigate self-perceived burnout among university students [see e.g., (13)]. The following statements from SBI-9 represent each dimension in turn (Supplementary Table 1): “I brood over matters related to my studies during my free time” (exhaustion), “I feel that I am losing interest in my studies” (cynicism), and “I often have feelings of inadequacy in my studies” (inadequacy).
As the original factor structure of SBI-9 has not been optimal for some datasets (34–36), we decided to explore the factor structure of this scale in our data. Exploratory factor analysis indicated that the indicator items for inadequacy did not measure a single factor in our data (Table 4). We also observed a low-reliability coefficient for inadequacy [Cronbach's α = 0.55 (0.42–0.65)] in our data (Table 3). Based on the equivocal factor structure and the low reliability of the inadequacy subscale, we decided to remove the responses to the two inadequacy items from our data. The scales on cynicism and exhaustion were retained unaltered despite the mixed factor loadings on cynicism_1 (Table 4).
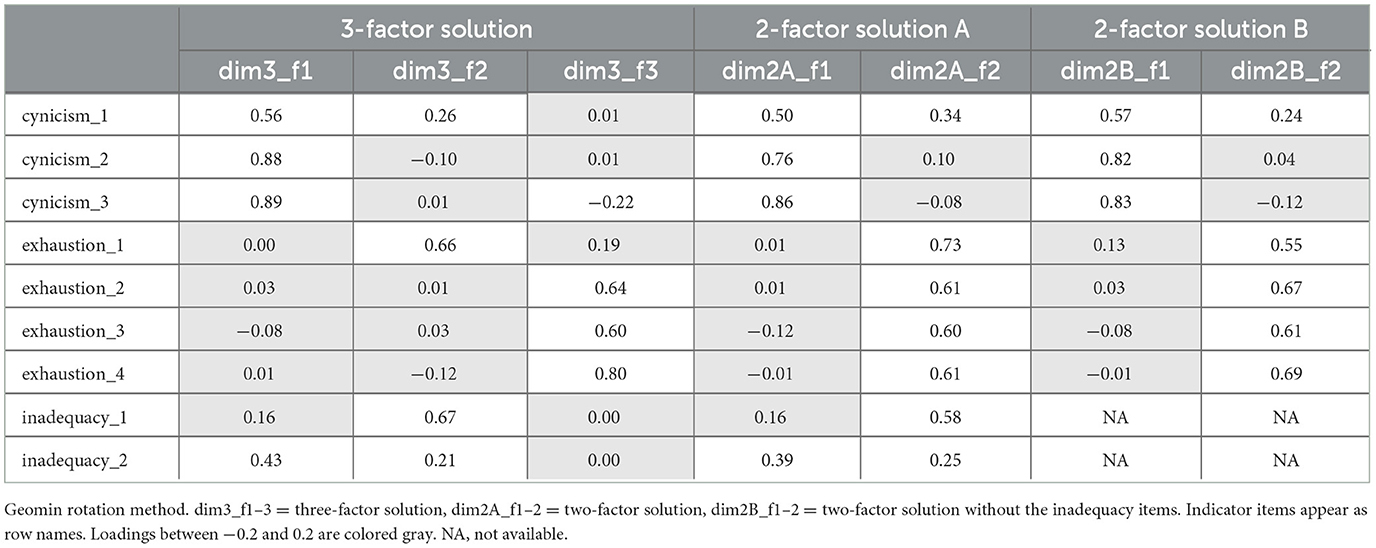
Table 4. Factor loadings from exploratory factor analysis of SBI-9 using the complete set of unweighted observations (N = 248).
2.5.3 Reliability of the measurement model
McDonald's ωtot was used as the reliability coefficient for the measurement model comprising the four factors and their 14 indicator items (Table 3). McDonald's ωtot is suited for multidimensional data (37, 38) and thus complements reliability assessments of the individual unidimensional scales that were based on the coefficient Cronbach's α.
2.6 Structural equation modeling
The data were not normally distributed. The VetRepos test score distribution was platykurtic [kurtosis = −0.75 (−0.98, −0.48), Supplementary Table 3A] and failed the Shapiro-Wilk normality test (W = 0.99, p-value = 0.013). The scales failed the multivariate Mardia normality test (Supplementary Table 3B). Thus, the maximum likelihood estimation of model parameters was extended by the estimation of robust errors and a robust χ2 statistic, as suggested by the lavaan manual (39). The maximum likelihood-based χ2 statistic was rescaled by the Satorra-Bentler correction factor 1.074. These modifications were implemented by specifying estimator = “MLM” in the lavaan() command.
2.7 Adjusting the data by down-sampling and applying a weight matrix
To mitigate the potential disproportionate effect of University F on 105 (42.34%) of the observations, we repeated the modeling on two sets of adjusted data. The down-sampled dataset contained 1,000 iterations of 173 observations, of which 30 observations (17.34%) were randomly selected from University F. The weighted dataset was modified with the help of a weight matrix, where the weights were inversely proportional to the relative number of observations from each university. Five students from University E were removed as their weight constant would have been 7.09, with potentially distorting effects on the dataset.
2.8 Scripting
The analyses in this study were conducted in R version 4.3.3 (40) with the help of the following R packages: lavaan (39), mirt (41), and psych (42). The pdf version of the documented custom R script with the complete list of the required packages is attached as a Supplementary material (R-code.pdf). The script is available at https://dx.doi.org/10.6084/m9.figshare.25470436.
3 Results
3.1 Distribution of VetRepos test scores
The median VetRepos test score in the current dataset was 508 (N = 248), with a range from 290 to 700. The mean value was 507.48, with a standard deviation of 92.51. The distribution of the scores is shown in Figure 2A. As expected, there was an increasing trend in the scores with an increase in study years (Figure 2B).
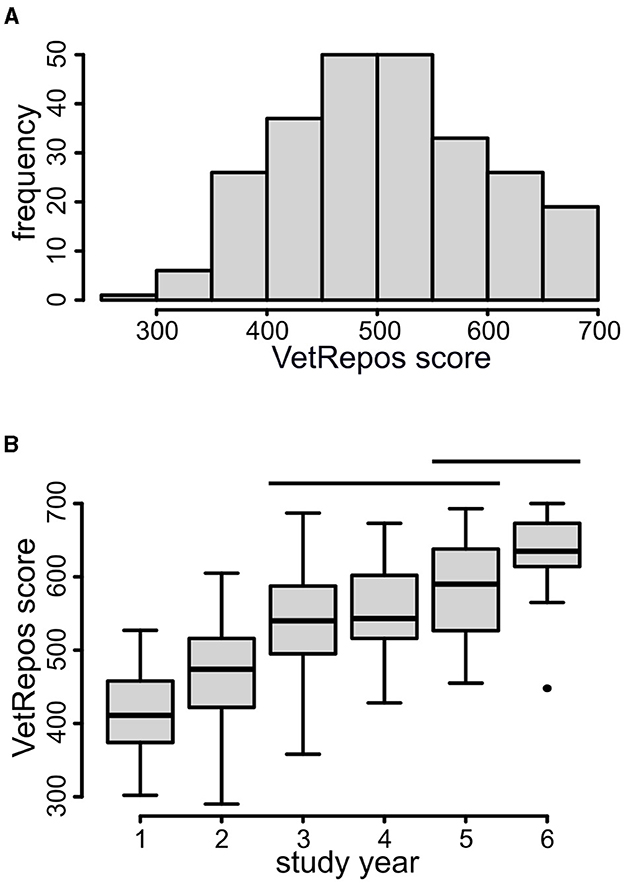
Figure 2. VetRepos test score. (A) The distribution of the VetRepos test score in the study population (N = 248). (B) Box plot of the VetRepos test score in each study year. The horizontal bars indicate groups with non-significant differences in the mean value (Kruskal test with Dunn's post hoc test for the pairwise comparison of the means). The horizontal bars in the boxes indicate median values. N = 248.
3.2 Interitem correlations, reliability indices, and the indicator sum scores for deep and surface learning approaches and self-perceived burnout
The interitem bivariate Spearman correlation coefficients for all indicator item pairs are shown in Supplementary Tables 2A, B. The Cronbach's α reliability coefficient varied between 0.64 and 0.80 for the final set of scales used in the modeling (Table 3). The measurement model of the four scales (deep and unreflective approaches and perceived cynicism and exhaustion) was fitted using CFA. Although the model failed the exact-fit test ( = 113.62, df = 71, p = 0.001), global fit statistics suggested retaining the model (Table 5A) (43). The fitted model was used to estimate McDonald's ωtot = 0.81 with a 95% bootstrapped confidence interval = (0.76–0.84; 1,000 iterations, Table 3). A path diagram and the standardized factor loadings of the measurement model are presented in Figure 3. A complete list of the standardized coefficients of the measurement model is available in Supplementary Table 4A.
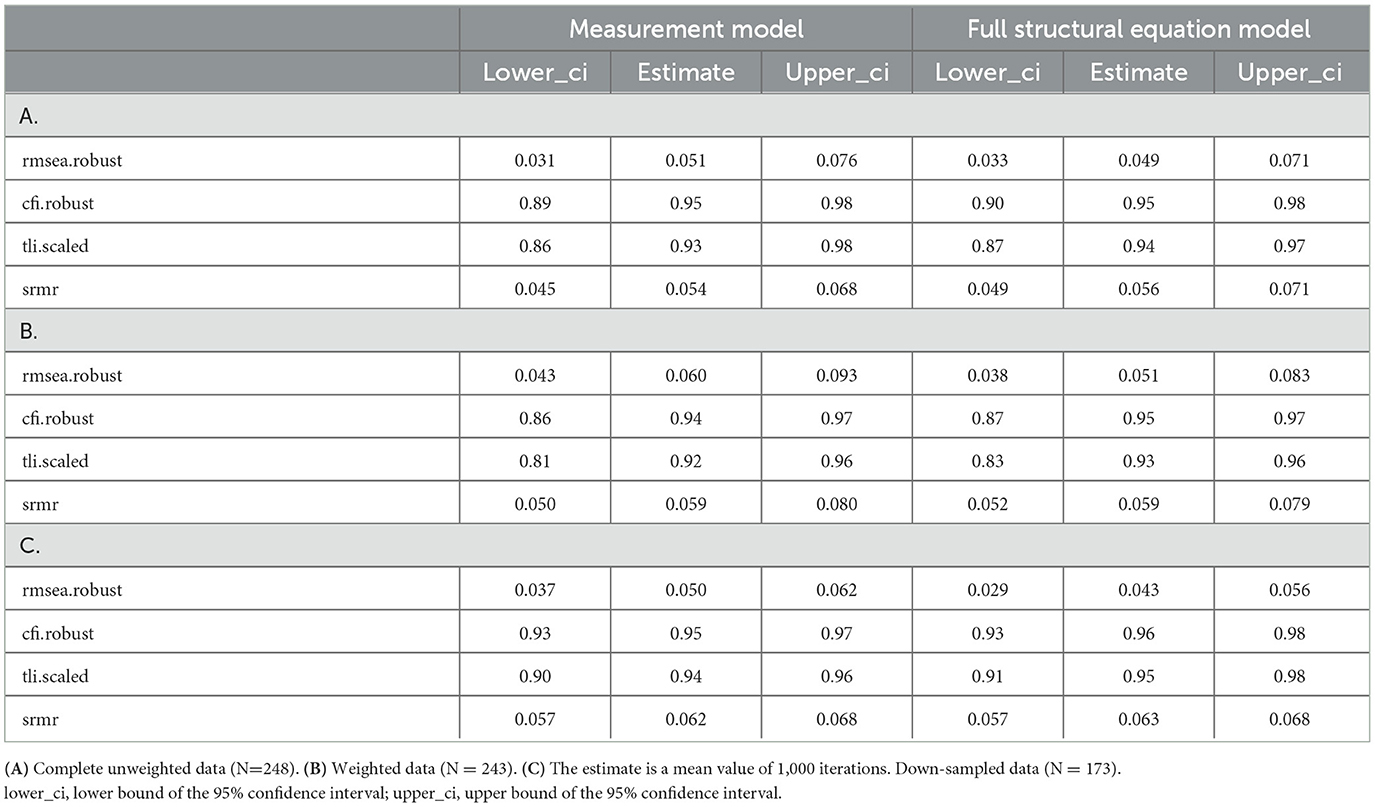
Table 5. Global fit index estimates and their bootstrapped 95% confidence intervals for the measurement (Figure 3) and full structural equation models (Figure 5).
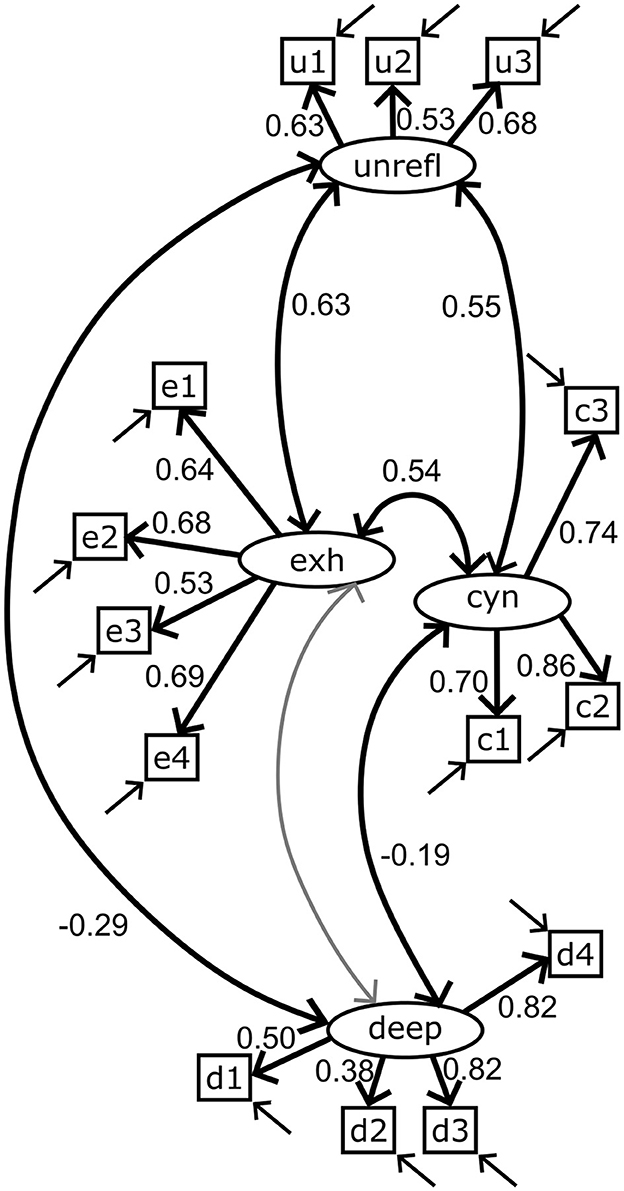
Figure 3. Path diagram of the measurement model. The four factors and their indicator items are deep approach (deep, d1–4), unreflective approach (unrefl, u1–3), cynicism (cyn, c1–3), and exhaustion (exh, e1–4). Straight single arrow: factor loadings. Bidirectional curved arrow: correlation. Standardized factor loadings and correlation coefficients are shown. The gray color indicates a non-significant relationship (α = 0.05). Errors on the indicator items are indicated by arrows, but the error variables remain hidden. A complete list of estimated coefficients is presented in Supplementary Table 4.
The responses to the indicator items as sum scores are compared in Figure 4. A positive correlation of 0.47 (95% bootstrapped confidence interval with 1,000 iterations: 0.36–0.57) was observed between the sum scores of the unreflective approach (unreflective_1–3) and the perceived study burnout indicators (not shown).
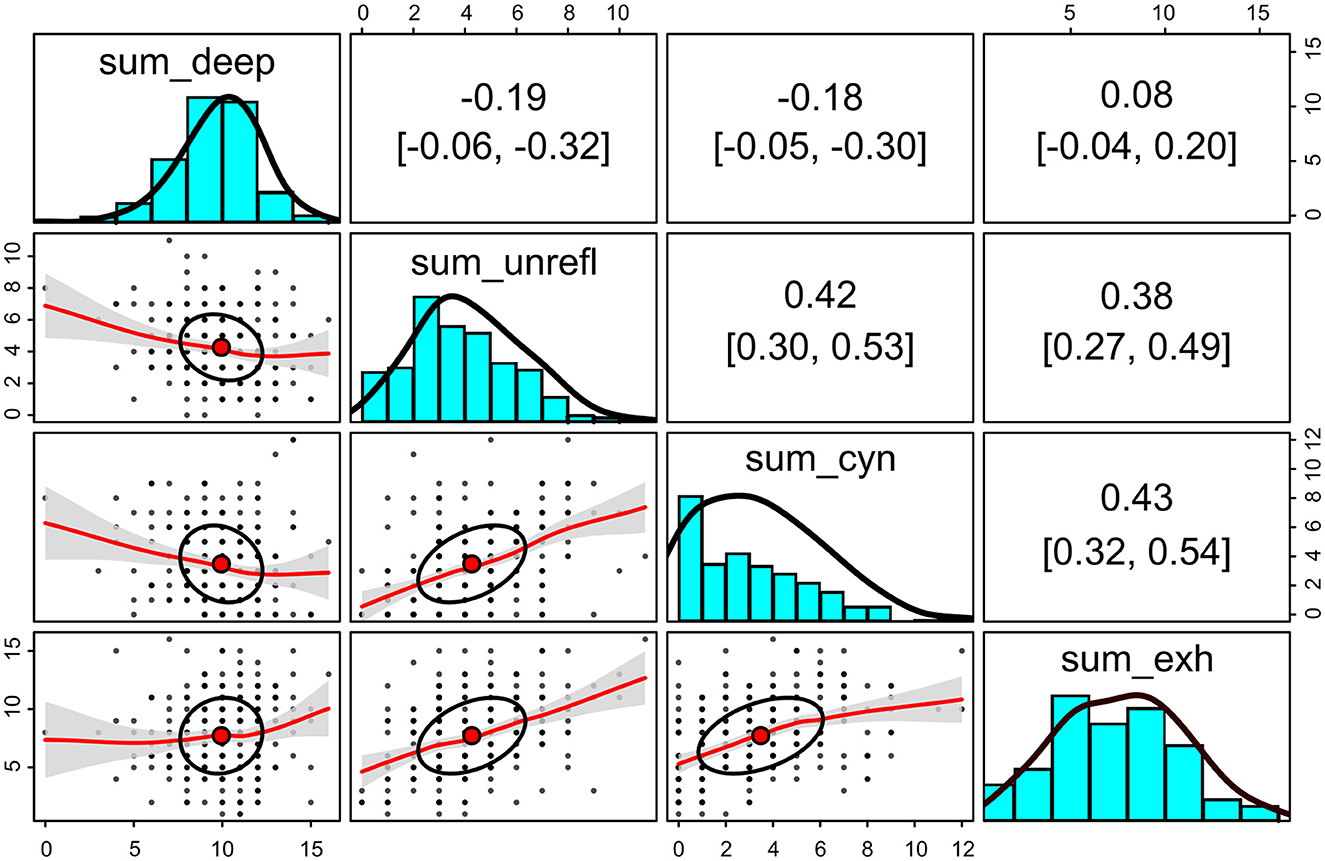
Figure 4. Sum scores of the indicator items for deep and unreflective approaches to learning and for the self-perceived study burnout for each participant. Upper triangle: bivariate Spearman correlation coefficients with bootstrapped 95% confidence intervals (2,000 iterations). Lower triangle: bivariate scatter plots with correlation ellipses and loess fit with confidence intervals (α = 0.05). Diagonal: histograms with density plots. The raw scores are on the x-axis and the counts on the y-axis. N = 248.
3.3 Structure and global and local fit of the full structural equation model
A path diagram of the model with standardized coefficients is shown in Figure 5. The model failed the exact-fit test ( = 148.20, df = 95, p-value = 0.00039). As the χ2 test is easily significant with larger sample sizes and more complex models, other global fit indices were computed (Table 5A). The robust RMSEA was 0.049 (95% ci = 0.033–0.072), robust CFI = 0.95 (0.90–0.98), scaled TLI = 0.94 (0.87–0.97), and SRMR = 0.056 (0.049–0.071). The global indices are compatible with retaining the model (43). We then assessed the local fit by inspecting the interitem residual correlation coefficients and standardized residual covariances (Supplementary Tables 5A and 6A). All residual correlation coefficients were between −0.3 and 0.3. The standardized residual covariances are plotted in Figure 6. The highest value of standardized residual covariance was 4.86 (between items cynicism_1 and exhaustion_1). The Shapiro–Wilk normality test statistic (W = 0.99, p = 0.35) was compatible with the normality of the residuals. Based on the global fit indices and the local fit, we retained the model despite its failure to meet the exact-fit test and the large standardized residual covariance between cynicism_1 and exhaustion_1.
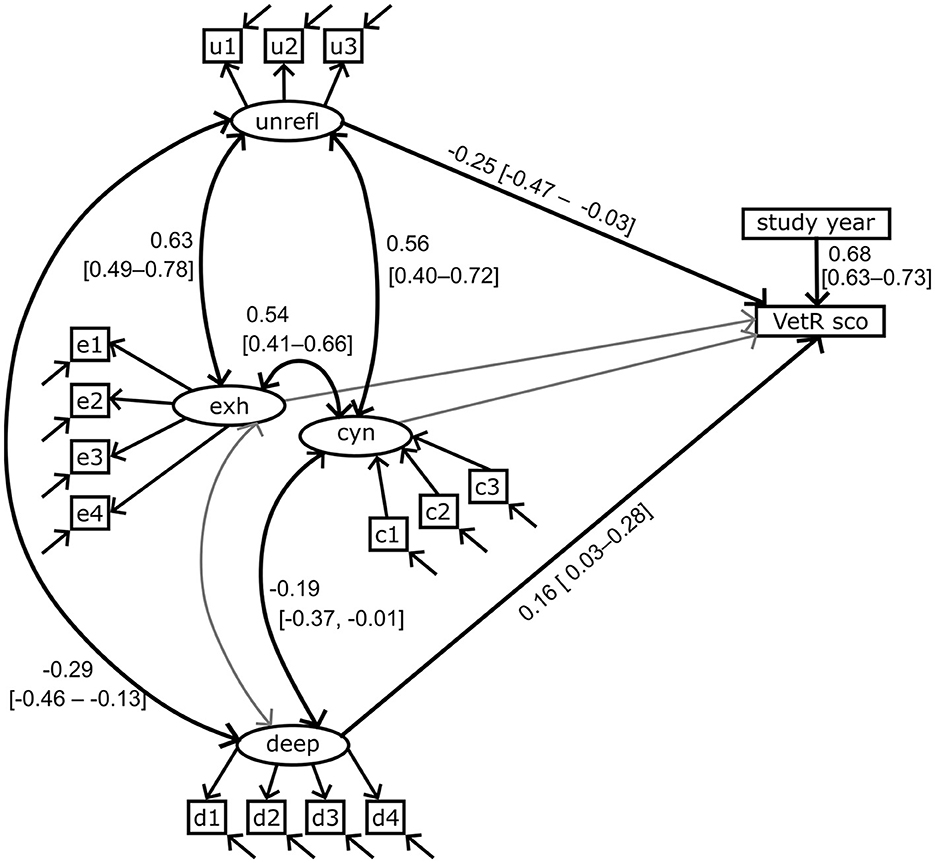
Figure 5. Path diagram of the full structural equation model. The four factors and their indicator items are deep approach (deep, d1–4), unreflective approach (unrefl, u1–3), cynicism (cyn, c1–3) and exhaustion (exh, e1–4). VetR sco, VetRepos test score. Statistically significant (α = 0.05) standardized covariances and regression coefficients with 95% confidence intervals are shown. Bidirectional curved arrow: correlation. Straight single arrow: regression. The gray color indicates a non-significant relationship. Errors on the indicator items are indicated by arrows, but the error variables remain hidden. A complete list of estimated coefficients is presented in Supplementary Table 7.
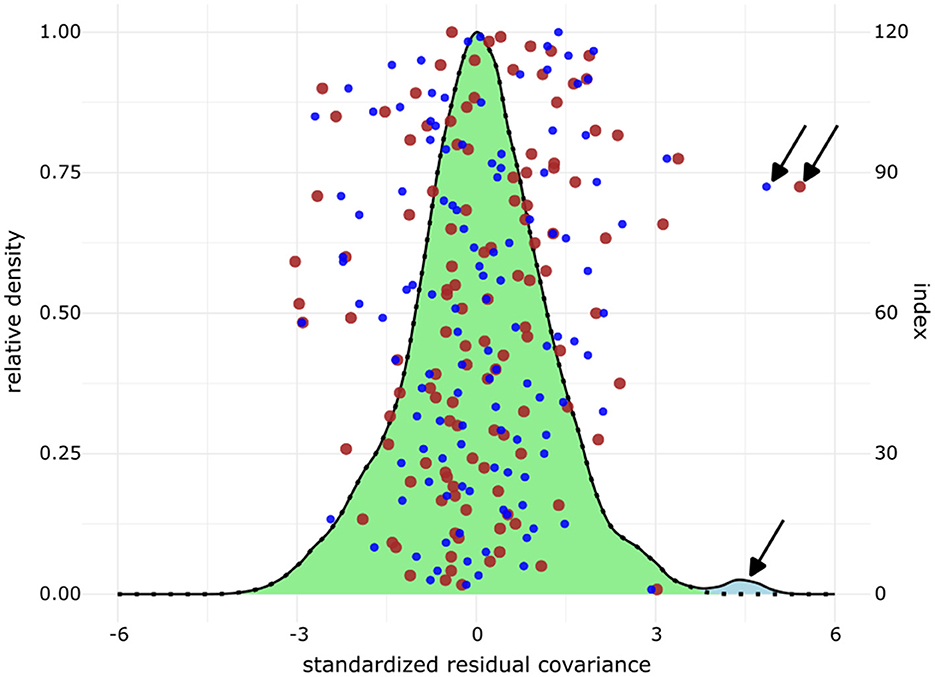
Figure 6. Standardized interitem residual covariances of the full structural equation model. Small blue dots = unweighted data (N = 248 observations). Large brown dots = weighted data (N = 243 observations). Density plot with a light blue area under the curve = down-sampled data (173 observations, 1,000 iterations). Dotted density plot with a light green area under the curve = down-sampled data with a mask on the residual between cynicism_1 and exhaustion_1. For the down-sampled data, the mean residual between cynicism_1 and exhaustion_1 was 4.44, 2.5% quantile = 3.80, 97.5% quantile = 5.02, and range = 3.44–5.29. x-axis: residuals, left y-axis: relative density, right y-axis: index from the residual data frame. Arrows mark the residual covariance between cynicism_1 and exhaustion_1.
3.4 Estimated coefficients
All the estimated standardized coefficients from the fitted model are presented in Supplementary Table 7A. Except for the loading on item deep_2, all the factor loadings are >0.4. The communalities (squared standardized loadings) explain more than 50% of the variance in the indicators deep_3, deep_4, cynicism_2, and cynicism_3. Communalities for the indicators of exhaustion and the unreflective approach range from 0.28 to 0.46 (95% ci = 0.17–0.61).
The size of the observed regression coefficients ranged from small to very large, as determined by the criteria discussed in Funder and Ozer (44). The VetRepos test score regressed on the deep learning approach with a small coefficient of 0.16 (95% ci = 0.03–0.28) and on the unreflective approach with a medium-sized coefficient of −0.25 (−0.47 to −0.03; Figure 5, Supplementary Table 7A). As expected, a large regression coefficient [0.68 (0.62–0.73)] on the study year was also observed (44).
The unreflective learning approach correlated with cynicism [r = 0.56 (0.40–0.72)] and exhaustion [r = 0.63 (0.49–0.78)]. Cynicism correlated with exhaustion [r = 0.54 (0.41–0.66)]. We also observed a small negative correlation coefficient between the deep learning approach and cynicism [r = −0.19 (−0.01 to −0.37); Figure 5, Supplementary Table 7A].
3.5 Measurement invariance
3.5.1 Study year
We assessed measurement invariance with multiple indicators and multiple-causes (MIMIC) modeling by comparing the fits of a constrained vs. an unconstrained model. The regression coefficients of the latent traits (deep approach, unreflective approach, cynicism, and exhaustion) during the study year were freely estimated in the unconstrained model. There was no difference in the robust CFI global fit metric between the models (cfi.robust = 0.942), and the scaled χ2-difference test (45, 46) was non-significant (Δχ2 = 3.78, Δdf = 4, p-value = 0.44, Table 6A). Together, these results argue for measurement invariance between the study years in the full structural equation model (47, 48).
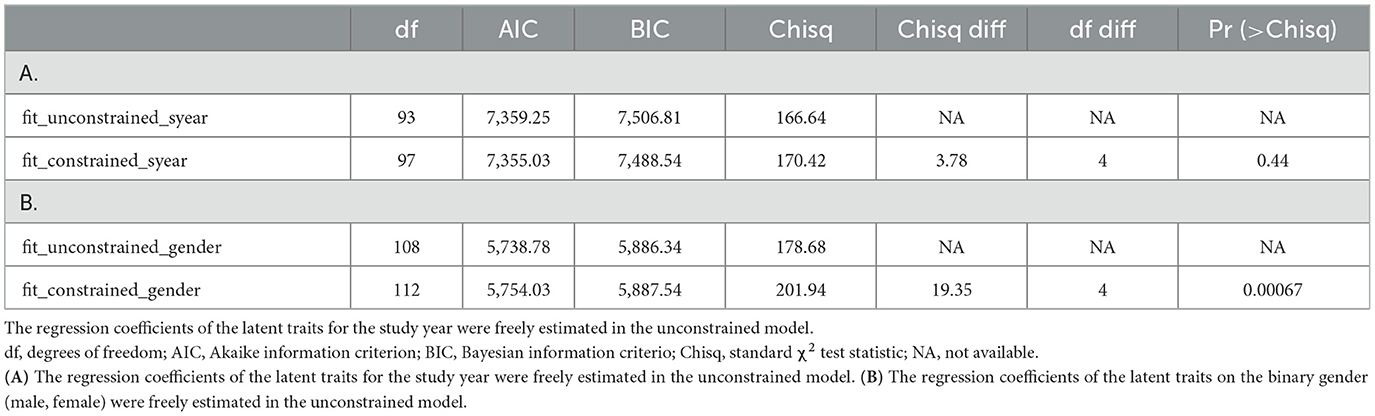
Table 6. Akaike and Bayesian information criterion and scaled χ2-difference test between the constrained and unconstrained models.
3.5.2 Gender and university
Measurement invariance between men and women was analyzed by treating gender as a numerical variable (0 for men and 1 for women) in the MIMIC models. Invariance was rejected because of a large difference in robust CFI metrics (ΔCFI = −0.013) (47, 48) and a significant scaled χ2-difference test (Δχ2 = 19.35, Δdf = 4, p-value = 0.00067, Table 6B). Measurement invariance could not be assessed between universities for several reasons, including the small sample sizes in each university, which prevented measurement alignment, and the absence of some categories in the responses to some items in some groups, preventing the use of multiple group confirmatory factor analysis.
3.6 Analyses of down-sampled and weighted data
The comparison between models fitted on the original complete (N = 248), weighted (N = 243), and down-sampled data (N = 173, 1,000 iterations) was carried out on the global and local fit and by comparing model estimated parameter values. All the fitted models failed the exact test. The global fit indices (rmsea.robust, cfi.robust, tli.scaled, and srmr) were comparable between models fitted on the different datasets (Tables 5A–C). The local fit was assessed by the distribution of residuals. The interitem residual correlations ranged between −0.23 and 0.31 for all datasets (see Supplementary Tables 5A, B for exact values for unweighted complete and weighted datasets). The standardized residual covariances ranged between −4.36 and 5.29 (1,000 down-sampled datasets). The most extreme and larger-than-expected standardized residual covariance value was always observed between items cynicism_1 and exhaustion_1 regardless of the data that were fitted to the full SE model (Figure 6, Supplementary Tables 6A, B). Based on the above-described results, we conclude that the model fits were comparable between the datasets.
Next, we compared the values of the parameter estimates from the full SE model that were fitted to each of the datasets. As shown in Figure 7, all estimates fall within the 95% confidence interval determined by the unweighted complete data. The complete lists of the estimated values from measurement and full SE models are found in Supplementary Tables 4A, B, 7A, B, 8, 9.
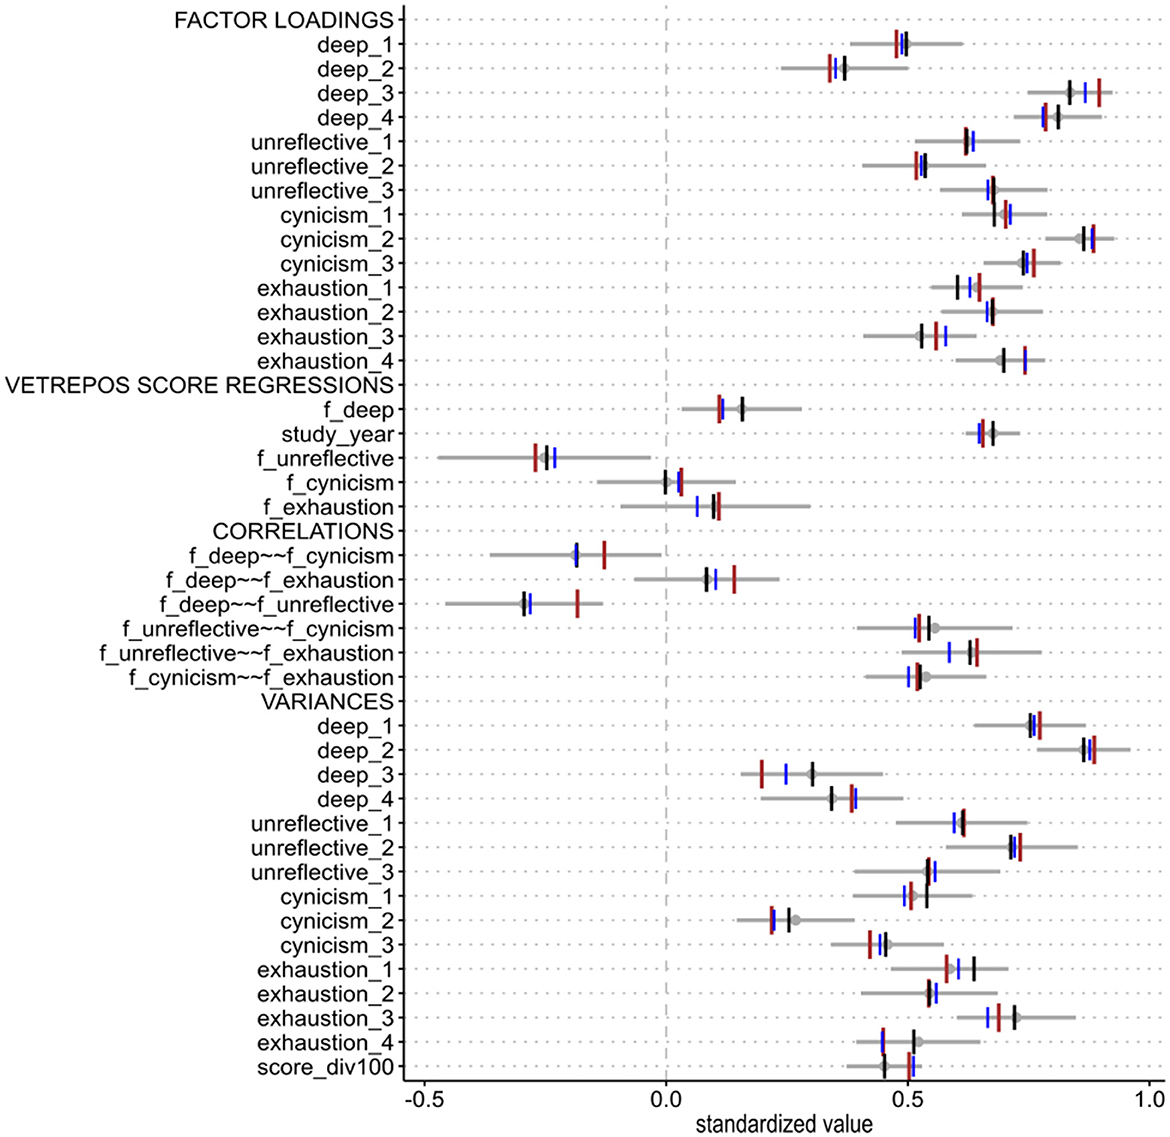
Figure 7. Standardized parameter estimates based on down-sampled (N = 173) or weighted data (N = 243) are compared with the estimates based on the unweighted complete data (N = 248). Blue = mean values of the estimates from down-sampled data (30 students from University F, 1,000 iterations). Brown = estimates from weighted data without University E. Gray = the complete data with a mean estimate and a 95% confidence interval. Black = estimates on the unweighted complete data with the covariance term between cynicism_1 and exhaustion_1 included in the model.
3.7 Comparison of the latent traits and VetRepos test scores across study years
No differences were detected in the estimated latent factor scores (Figure 8). Instead, a significant and strong effect of the study year on VetRepos test scores was observed (Figure 2B). However, the difference in the scores was statistically non-significant from third to fifth year and between fifth- and sixth-year students (Kruskal test followed by Dunn's test for pairwise comparison of the means). Measurement non-invariance was found between the men and women, preventing direct comparisons between genders.
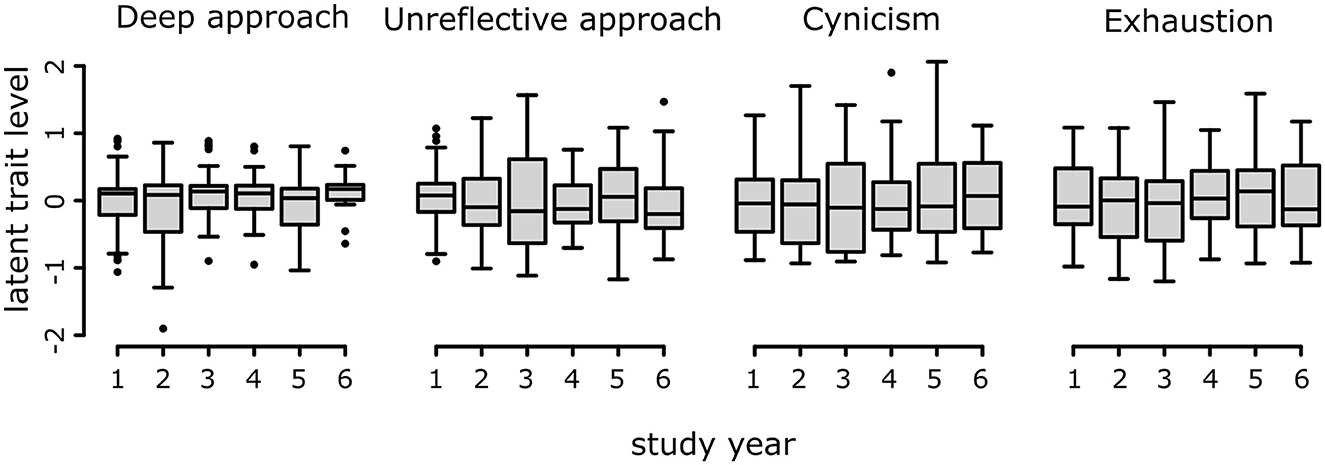
Figure 8. Latent factor scores across study years.
4 Discussion
This study reports the results of a cross-sectional structural equation modeling of the relationships of a single pan-curricular VetRepos test score with four latent traits: deep and unreflective approaches to learning, and the cynicism and exhaustion dimensions of self-perceived study burnout (Figure 5, Supplementary Table 7A). The modeling confirmed the regression of the VetRepos test score on the learning approaches. On the other hand, the observed association with self-perceived burnout was only indirect.
4.1 Scales, model fits and data structures
We carefully assessed the reliability of the scales and fit of the proposed model at different levels. The reliability coefficients (McDonald's ωtot and Cronbach's α) suggest that the contribution of the true variance to the total variance in the responses to indicator items was acceptable (Table 3). The Person Separation Index for the VetRepos test database also suggests acceptable reliability for the knowledge measure used in this study (Table 3). Even though the full structural equation model failed the exact-fit test ( = 148.20, df = 95, p-value = 0.00039), the estimated global fit indices (Table 5A) and the local fit assessed by inter-item correlation coefficient residuals and the standardized covariance residuals (Supplementary Tables 5A, 6A and Figure 6) support retaining the proposed theoretical model (43, 49). We acknowledge the unexpectedly large residual covariance between the indicators cynicism_1 and exhaustion_1. A modified model with a covariance term between these indicators fitted the data better than the original full SE model, as assessed by the χ2 difference test (Δχ2 = 17.68, df = 1, p-value = 0.0014) and by the drop in information criteria (ΔAIC = 15.7, ΔBIC = 12.2). As we cannot theoretically justify the covariance term and saw no improvement in the model parameter estimates (Supplementary Figure 1), we decided to retain the original model.
The students from University F accounted for 42.34% of the observations, and they were more junior (numerous 1st and 2nd year students) than students from the other universities. The inability to control the test settings, the students' preparation before the test, or their use of additional materials during the test could introduce bias into the data. Further, differences in language or cultural conventions between student groups that the model does not account for might influence the students' responses and, therefore, undermine the usefulness of the model. To mitigate the potential influence of the uneven distribution of the students between universities, we repeated the analyses using down-sampled and weighted datasets. The results from all of the control analyses conformed with the original results from the unweighted complete set of observations.
One of the advantages of structural equational modeling over alternative methods, such as factorial analysis of variance, is that structural equation modeling (SEM) can estimate the attenuated (error-free) values of latent traits. Even though SEM cannot determine the true levels of latent traits, it effectively separates measurement errors from the observed values. This separation results in disattenuated correlation coefficients, which are typically larger between trait level estimates than between raw scores calculated from indicator items. For example, the disattenuated correlation coefficient between the estimated latent levels of the unreflective approach and cynicism was r = 0.70 (0.62–0.77; Figure 9). In contrast, the correlation coefficient between the raw sum scores of corresponding indicator items was only 0.42 (0.30–0.53; Figure 4).
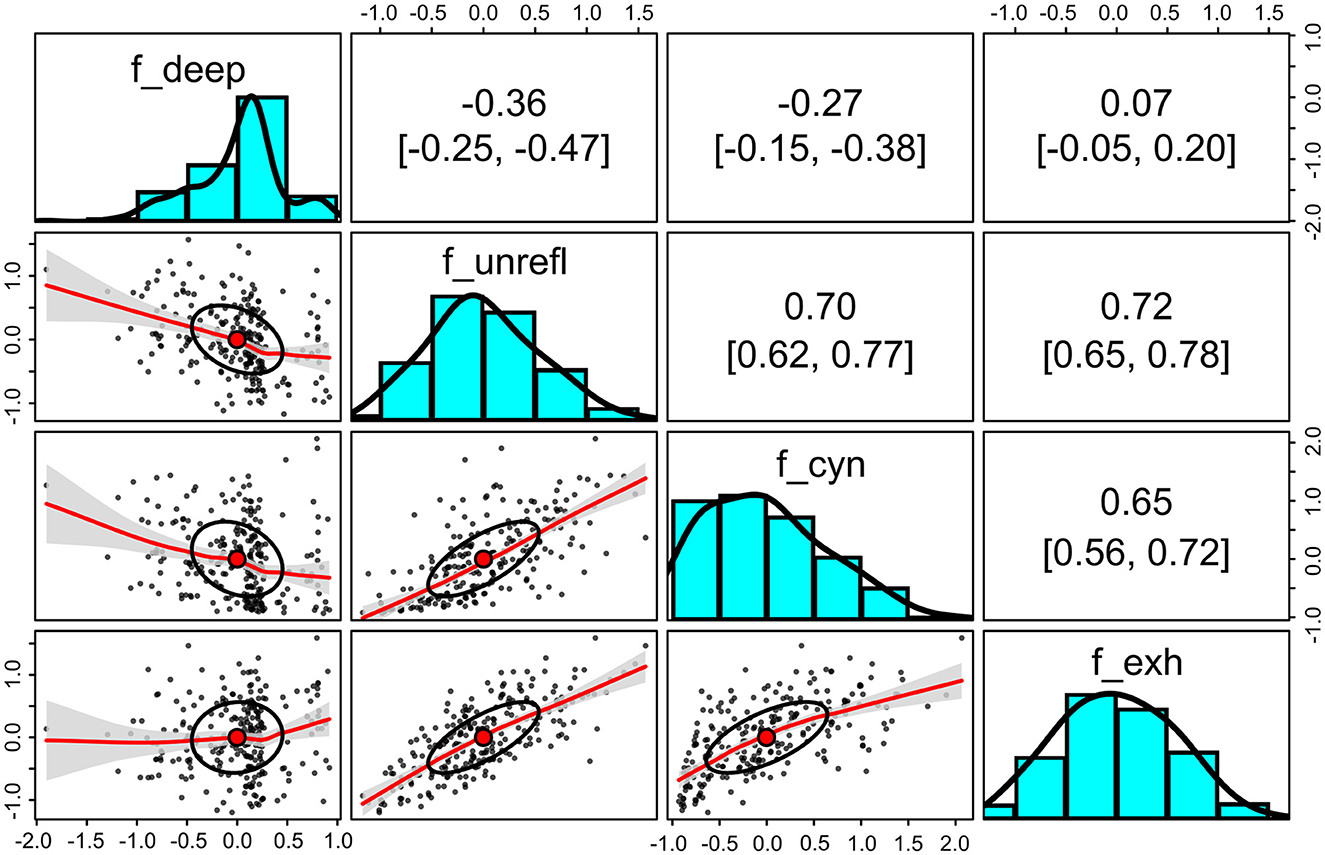
Figure 9. Estimated standardized levels of the deep and unreflective approaches to learning and for the self-perceived study burnout for each participant. Upper triangle: bivariate Spearman correlation coefficients with bootstrapped 95% confidence intervals (2,000 iterations). Lower triangle: bivariate scatter plots with correlation ellipses and loess fit with confidence intervals (α = 0.05). Diagonal: histograms with density plots. The raw scores are on the x-axis and the counts on the y-axis. N = 248.
The score of the VetRepos test, which spans the entire core of the veterinary curriculum, regresses positively on the study year (Figures 5 and 2B). The squared value of the standardized regression suggests that the study year explains ~46% of the variation in the VetRepos test score. A similar approach to square the regression coefficients of the full structural equation model suggests that the combined effect size of the learning approaches explains only ~9% of the total variation of the VetRepos test score. The remaining 45% of the variation is not accounted for by the model and probably includes differences between individuals, universities, and genders, as well as the error variance that could not be captured.
4.2 Burnout perceived by veterinary students
We did not estimate the prevalence of study burnout as the SBI-9 instrument is not designed for this purpose (17). However, other studies have reported burnout prevalence levels >40% among students in medicine and veterinary medicine (19, 20). Learning environments, including perceived low levels of support from staff and peers, cynical residents or interns, and clinical rotations with overnight calls, were associated with study burnout among medical students (50). Interestingly, a comparison of veterinary students with or without burnout revealed no differences between genders (19, 20), the stages of study, or study success regarding exam grades and passed exams (20). In contrast, burnout was associated with the perceived stress related to exams and various social contexts like colloquiums, contacts with teachers or pet owners, and fieldwork (20).
We, too, did not find an association between burnout and study success. The model-estimated regressions of the VetRepos test score on the latent traits of perceived burnout were non-significant (Figure 5). However, cynicism and exhaustion correlated significantly (α = 0.05) with the unreflective approach with very large correlation coefficients [r = 0.56 (95% ci = 0.40–0.72) vs. 0.63 (0.49–0.78), Supplementary Table 7A] (44). This suggests that the relationship between perceived burnout and the VetRepos test score is indirect and possibly mediated by the association with the unreflective approach (Figure 5). The nature of this relationship should be further investigated. Understanding the causality's direction and nuances would help design interventions for improving the students' wellbeing and learning. For example, to distance themselves from the unreflective approach, students might need help seeing how different courses and contents are linked. This could be done at various levels, including curriculum and course development. Increasing teacher interaction to support them in understanding the cumulative knowledge building in the curriculum could also benefit the students. In addition to improving the learning environment, the interventions could also be targeted to enhance the students' psychological flexibility (51, 52), which in working life has been shown to mitigate burnout (53, 54).
4.3 Comparison between genders
Unfortunately, we could not reject non-invariance between genders, which prevented the rigorous comparison of the factor scores between men and women. As there might be gender differences in students' learning approaches and in how they perceive study burnout, we carried out a superficial descriptive analysis of the responses to the study questionnaire in male and female students (Supplementary Figure 2, Supplementary Table 10). The female students responded by perceiving more exhaustion than the male students (Krustal.test χ2 = 14.80, df = 1, false discovery rate controlled p-value = 0.00012). No other differences were detected (α = 0.05).
The failure to show measurement invariance may have been due to the small size of our dataset, particularly the small number of men. However, the gender distribution of veterinary students in the current study reflects the international gender distribution in veterinary universities in general, and an increase in student numbers filling out the questionnaire would not have changed the ratio between female and male participants. On the other hand, there might be genuine gender-dependent differences that the model cannot account for. There is a need for additional studies to clarify these issues.
4.4 Conclusions
Our small pilot investigation underlines the potential of cooperation between European veterinary educational establishments for developing and improving veterinary education and supporting the students' wellbeing. We have demonstrated in this cross-sectional study that a single VetRepos test score can be successfully used in multinational settings to investigate the relationships between study success, learning approaches, and self-perceived burnout. Longitudinal and person-oriented investigations should complement our observations. Emphasis should be placed on the relationships between self-perceived burnout and learning approaches, including potential gender differences in these traits.
Data availability statement
The dataset used in this study has been anonymized and deposited to the Finnish Social Science Data Archive from where it is available for research, teaching and study by the accession number FSD3873 (https://urn.fi/urn:nbn:fi:fsd:T-FSD3873). To ensure the anonymity of the participants information on the gender and home university has been removed.
Ethics statement
The study was approved by the data protection officers of the participating universities and by the University of Helsinki Ethical Review Board in Humanities and Social and Behavioral Sciences (Statement 16/2022) according to the guidelines of the Finnish National Board on Research Integrity (55). The studies were conducted in accordance with the local legislation and institutional requirements. The participants provided their written informed consent to participate in this study.
Author contributions
AI: Conceptualization, Data curation, Formal analysis, Funding acquisition, Investigation, Methodology, Project administration, Writing – original draft, Writing – review & editing. CC: Writing – review & editing, Formal analysis, Supervision. JW: Data curation, Formal analysis, Methodology, Supervision, Validation, Writing – review & editing. AP: Writing – review & editing, Supervision. AN: Writing – review & editing. RK-T: Funding acquisition, Writing – review & editing. AT: Writing – review & editing. ES: Funding acquisition, Writing – review & editing, Project administration. TH: Funding acquisition, Project administration, Writing – review & editing. TP: Writing – review & editing. CP: Writing – review & editing. PH: Funding acquisition, Project administration, Writing – review & editing.
Group Members of VetRepos consortium
Marlies Beek, Harold G. J. Bok, Nina Dam Otten, Ann Kristin Egeli, Theo van Haeften, Peter Holm, Antti Iivanainen, Riikka Keto-Timonen, Hans Petter Kjæstad, Pierre Lekeux, Adam Dunstan Martin, Johanna Penell, Tina Holberg Pihl, Charles McLean Press, Andrea Tipold, Elisabeth Schaper, Karin Vargmar, Dax J. C. Vendrig, Jakob Wandall, Karin Elisabeth Zimmer.
Funding
The author(s) declare financial support was received for the research, authorship, and/or publication of this article. This study was supported by European Union, Erasmus+ Programme (2020-1-DK01-KA203-075135).
Acknowledgments
We are grateful to all VetRepos consortium members for creating a validated progress test item bank, Kati Hakkarainen, and Mirja Ruohoniemi for their invaluable advice and insights, Lisa van der Graaff for her generous help in numerous practical tasks, and all the item writers and students across our home institutions for their priceless contribution to the VetRepos project.
Conflict of interest
JW was employed by NordicMetrics ApS.
The remaining authors declare that the research was conducted in the absence of any commercial or financial relationships that could be construed as a potential conflict of interest.
The author(s) declared that they were an editorial board member of Frontiers, at the time of submission. This had no impact on the peer review process and the final decision.
Publisher's note
All claims expressed in this article are solely those of the authors and do not necessarily represent those of their affiliated organizations, or those of the publisher, the editors and the reviewers. Any product that may be evaluated in this article, or claim that may be made by its manufacturer, is not guaranteed or endorsed by the publisher.
Supplementary material
The Supplementary Material for this article can be found online at: https://www.frontiersin.org/articles/10.3389/fvets.2024.1292750/full#supplementary-material
References
1. Tio RA, Schutte B, Meiboom AA, Greidanus J, Dubois EA, Bremers AJA, et al. The progress test of medicine: the Dutch experience. Perspect Med Educ. (2016) 5:51–5. doi: 10.1007/S40037-015-0237-1
2. Favier RP, Van Der Vleuten CPM, Ramaekers SPJ. Applicability of progress testing in veterinary medical education. J Vet Med Educ. (2017) 44:351–7. doi: 10.3138/jvme.0116-008R
3. Herrmann L, Beitz-Radzio C, Bernigau D, Birk S, Ehlers JP, Pfeiffer-Morhenn B, et al. Status quo of progress testing in veterinary medical education and lessons learned. Front Vet Sci. (2020) 7:559. doi: 10.3389/fvets.2020.00559
4. Schaper E, Van Haeften T, Wandall J, Iivanainen A, Penell J, Press CM. Development of a shared item repository for progress testing in veterinary education. Front Vet Sci. (2023) 10:1296514. doi: 10.3389/fvets.2023.1296514
5. European Association for Establishments of Veterinary Education. European System of Evaluation of Veterinary Training - Standard operating procedures 2023. (2023). Available online at: https://www.eaeve.org/fileadmin/downloads/SOP/ESEVT_SOP_2023_adopted_by_the_36th_GA_in_Leipzig_on_8_June_2023.pdf (accessed June 12, 2024).
6. Rasch George. Probabilistic Models for Some Intelligence and Attainment Tests. København: Danmarks pædagogiske institut (1960).
7. Biggs J, Kember D, Leung DYP. The revised two-factor study process questionnaire: R-SPQ-2F. Br J Educ Psychol. (2001) 71:133–49. doi: 10.1348/000709901158433
8. Entwistle N, McCune V, Hounsell J. Investigating ways of enhancing university teaching-learning environments: measuring students' approaches to studying and perceptions of teaching. In:De Corte E, Verschaffel L, Entwistle N, van Merrienboer J, , editors. Powerful Learning Environments: Unravelling Basic Components and Dimensions. Amsterdam: Elsevier Science Limited (2003), p. 89–107.
9. Entwistle N, McCune V. The conceptual bases of study strategy inventories. Educ Psychol Rev. (2004) 16:325–45. doi: 10.1007/s10648-004-0003-0
10. Jackson M. Deep Approaches to learning in higher education. In: Seel NM, , editor. Encyclopedia of the Sciences of Learning. Boston, MA: Springer US (2012), p. 913–5 doi: 10.1007/978-1-4419-1428-6_1843
11. Entwistle NJ. Teaching for Understanding at University: Deep Approaches and Distinctive Ways of Thinking. Basingstoke: Palgrave Macmillan (2009).
12. Lindblom-Ylänne S, Parpala A, Postareff L. What constitutes the surface approach to learning in the light of new empirical evidence? Stud High Educ. (2019) 44:2183–95. doi: 10.1080/03075079.2018.1482267
13. Asikainen H, Salmela-Aro K, Parpala A, Katajavuori N. Learning profiles and their relation to study-related burnout and academic achievement among university students. Learn Individ Differ. (2020) 78:101781. doi: 10.1016/j.lindif.2019.101781
14. Kember D, Biggs J, Leung DYP. Examining the multidimensionality of approaches to learning through the development of a revised version of the Learning Process Questionnaire. Br J Educ Psychol. (2004) 74:261–79. doi: 10.1348/000709904773839879
15. Parpala A, Mattsson M, Herrmann KJ, Bager-Elsborg A, Hailikari T. Detecting the variability in student learning in different disciplines—a person-oriented approach. Scand J Educ Res. (2022) 66:1020–37. doi: 10.1080/00313831.2021.1958256
16. Maslach C, Schaufeli WB, Leiter MP. Job burnout. Annu Rev Psychol. (2001) 52:397–422. doi: 10.1146/annurev.psych.52.1.397
17. Salmela-Aro K, Kiuru N, Leskinen E, Nurmi J-E. School Burnout Inventory (SBI): reliability and validity. Eur J Psychol Assess 2009. (2009) 25:48–57. doi: 10.1027/1015-5759.25.1.48
18. Schaufeli WB, Martínez IM, Pinto AM, Salanova M, Bakker AB. Burnout and engagement in University students: a cross-national study. J Cross-Cult Psychol. (2002) 33:464–81. doi: 10.1177/0022022102033005003
19. Frajerman A, Morvan Y, Krebs M-O, Gorwood P, Chaumette B. Burnout in medical students before residency: a systematic review and meta-analysis. Eur Psychiatry. (2019) 55:36–42. doi: 10.1016/j.eurpsy.2018.08.006
20. Ilić Živojinović J, Backović D, Belojević G, Valčić O, Soldatović I, Janković J. Predictors of burnout among Belgrade veterinary students: a cross-sectional study. PLoS ONE. (2020) 15:e0230685. doi: 10.1371/journal.pone.0230685
21. Asikainen H, Nieminen JH, Häsä J, Katajavuori N. University students' interest and burnout profiles and their relation to approaches to learning and achievement. Learn Individ Differ. (2022) 93:102105. doi: 10.1016/j.lindif.2021.102105
22. Sæle RG, Dahl TI, Sørlie T, Friborg O. Relationships between learning approach, procrastination and academic achievement amongst first-year university students. High Educ. (2017) 74:757–74. doi: 10.1007/s10734-016-0075-z
23. Zeegers P. Approaches to learning in science: a longitudinal study. Br J Educ Psychol. (2001) 71:115–32. doi: 10.1348/000709901158424
24. VetRepos consortium. A shared item repository for progress testing in European veterinary schools. VetRepos. (2020). Available online at: https://www.vetrepos.eu (accessed June 12, 2024).
25. European Union. Everything you need to know about the “Right to be forgotten.” GDPR.eu. (2018). Available online at: https://gdpr.eu/right-to-be-forgotten/ (accessed September 11, 2023).
26. Qualtrix. Qualtrics XM - Experience Management Software. Qualtrics. (2023). Available online at: https://www.qualtrics.com/ (accessed September 6, 2023).
27. Andrich D, Sheridan B, Luo G. RUMM2030: Rasch unidimensional models for measurement. Perth RUMM Lab. (2009) 3:1–10.
28. Mullis IVS, Martin MO, editors. Pirls 2021 Assessment Frameworks. Chestnut Hill, MA: TIMSS & PIRLS. (2019). Available online at: https://timssandpirls.bc.edu/pirls2021/frameworks/ (accessed August 29, 2023).
29. Mullis IVS, Martin MO, editors. Timss 2019 Frameworks. Chestnut Hill, MA: TIMSS & PIRLS. (2017). Available online at: http://timssandpirls.bc.edu/timss2019/frameworks/ (accessed August 29, 2023).
30. Parpala A, Lindblom-Ylänne S. Using a research instrument for developing quality at the university. Qual High Educ. (2012) 18:313–28. doi: 10.1080/13538322.2012.733493
31. Hounsell D, Entwistle N, Anderson C, Bromage A, Day K, Hounsell J, et al. Enhancing Teaching-Learning Environments in Undergraduate Studies. (2005). Available online at: https://www.etl.tla.ed.ac.uk/project.html (accessed June 12, 2024).
32. Herrmann KJ, Bager-Elsborg A, Parpala A. Measuring perceptions of the learning environment and approaches to learning: validation of the learn questionnaire. Scand J Educ Res. (2017) 61:526–39. doi: 10.1080/00313831.2016.1172497
33. Parpala A, Lindblom-Ylänne S, Komulainen E, Entwistle N. Assessing students' experiences of teaching–learning environments and approaches to learning: validation of a questionnaire in different countries and varying contexts. Learn Environ Res. (2013) 16:201–15. doi: 10.1007/s10984-013-9128-8
34. Herrmann J, Koeppen K, Kessels U. Do girls take school too seriously? Investigating gender differences in school burnout from a self-worth perspective. Learn Individ Differ. (2019) 69:150–61. doi: 10.1016/j.lindif.2018.11.011
35. Hoferichter F, Raufelder D, Schweder S, Salmela-Aro K. Validation and reliability of the German version of the school burnout inventory. Z Für Entwicklungspsychol Pädagog Psychol. (2022) 54:1–14. doi: 10.1026/0049-8637/a000248
36. May RW, Rivera PM, Rogge RD, Fincham FD. School burnout inventory: latent profile and item response theory analyses in undergraduate samples. Front Psychol. (2020) 11:188. doi: 10.3389/fpsyg.2020.00188
37. Revelle W, Zinbarg RE. Coefficients Alpha, Beta, Omega, and the glb: comments on Sijtsma. Psychometrika. (2009) 74:145–54. doi: 10.1007/s11336-008-9102-z
38. McDonald RP. The dimensionality of tests and items. Br J Math Stat Psychol. (1981) 34:100–17. doi: 10.1111/j.2044-8317.1981.tb00621.x
39. Rosseel Y. lavaan: an R package for structural equation modeling. J Stat Softw. (2012) 48. doi: 10.18637/jss.v048.i02
40. R Core Team. R: A Language and Environment for Statistical Computing. Vienna, Austria: R Foundation for Statistical Computing. (2023). Available online at: https://www.R-project.org/ (accessed June 12, 2024).
41. Chalmers RP. MIRT: a multidimensional item response theory package for the R environment. J Stat Softw. (2012) 48. doi: 10.18637/jss.v048.i06
42. Revelle W. psych: Procedures for Psychological, Psychometric, and Personality Research. Evanston, IL: Northwestern University (2023). Available online at: https://CRAN.R-project.org/package=psych (accessed June 12, 2024).
43. Hu L, Bentler PM. Cutoff criteria for fit indexes in covariance structure analysis: conventional criteria versus new alternatives. Struct Equ Model Multidiscip J. (1999) 6:1–55. doi: 10.1080/10705519909540118
44. Funder DC, Ozer DJ. Evaluating effect size in psychological research: sense and nonsense. Adv Methods Pract Psychol Sci. (2019) 2:156–68. doi: 10.1177/2515245919847202
45. Satorra A, Bentler PM. Ensuring positiveness of the scaled difference chi-square test statistic. Psychometrika. (2010) 75:243–8. doi: 10.1007/s11336-009-9135-y
46. Satorra A, Bentler PM. A scaled difference chi-square test statistic for moment structure analysis. Psychometrika. (2001) 66:507–14. doi: 10.1007/BF02296192
47. Meade AW, Johnson EC, Braddy PW. Power and sensitivity of alternative fit indices in tests of measurement invariance. J Appl Psychol. (2008) 93:568–92. doi: 10.1037/0021-9010.93.3.568
48. Putnick DL, Bornstein MH. Measurement invariance conventions and reporting: the state of the art and future directions for psychological research. Dev Rev. (2016) 41:71–90. doi: 10.1016/j.dr.2016.06.004
49. Kline RB. Principles and Practice of Structural Equation Modeling, 5th Edn. New York, NY: Guilford Publishers (2023).
50. Dyrbye LN, Thomas MR, Harper W, Massie FS, Power DV, Eacker A, et al. The learning environment and medical student burnout: a multicentre study. Med Educ. (2009) 43:274–82. doi: 10.1111/j.1365-2923.2008.03282.x
51. Asikainen H, Katajavuori N. Exhausting and difficult or easy: the association between psychological flexibility and study related burnout and experiences of studying during the pandemic. Front Educ. (2023) 8:1215549. doi: 10.3389/feduc.2023.1215549
52. Ditton E, Knott B, Hodyl N, Horton G, Walker FR, Nilsson M. Medical student experiences of engaging in a psychological flexibility skill training app for burnout and well-being: pilot feasibility study. JMIR Form Res. (2023) 7:e43263. doi: 10.2196/43263
53. Lloyd J, Bond FW, Flaxman PE. The value of psychological flexibility: examining psychological mechanisms underpinning a cognitive behavioural therapy intervention for burnout. Work Stress. (2013) 27:181–99. doi: 10.1080/02678373.2013.782157
54. Puolakanaho A, Tolvanen A, Kinnunen SM, Lappalainen R. A psychological flexibility-based intervention for Burnout: a randomized controlled trial. J Context Behav Sci. (2020) 15:52–67. doi: 10.1016/j.jcbs.2019.11.007
55. Finnish National Board on Research Integrity TENK. Ethical review in human sciences. Finn Natl Board Res Integr TENK. (2021). Available online at: https://tenk.fi/en/ethical-review/ethical-review-human-sciences (accessed August 30, 2023).
Keywords: knowledge assessment, structural equation modeling, item response theory, veterinary medical education, learning approaches, study burnout
Citation: Iivanainen A, Collares CF, Wandall J, Parpala A, Nevgi A, Keto-Timonen R, Tipold A, Schaper E, van Haeften T, Pihl TH, Press CM and Holm P (2024) Knowledge attainment, learning approaches, and self-perceived study burnout among European veterinary students. Front. Vet. Sci. 11:1292750. doi: 10.3389/fvets.2024.1292750
Received: 12 September 2023; Accepted: 30 May 2024;
Published: 18 July 2024.
Edited by:
Jared Andrew Danielson, Iowa State University, United StatesReviewed by:
Stefan Schauber, University of Oslo, NorwayRich Feinberg, National Board of Medical Examiners, United States
Elizabeth Oddone Paolucci, University of Calgary, Canada
Copyright © 2024 Iivanainen, Collares, Wandall, Parpala, Nevgi, Keto-Timonen, Tipold, Schaper, van Haeften, Pihl, Press and Holm. This is an open-access article distributed under the terms of the Creative Commons Attribution License (CC BY). The use, distribution or reproduction in other forums is permitted, provided the original author(s) and the copyright owner(s) are credited and that the original publication in this journal is cited, in accordance with accepted academic practice. No use, distribution or reproduction is permitted which does not comply with these terms.
*Correspondence: Antti Iivanainen, YW50dGkuaWl2YW5haW5lbkBoZWxzaW5raS5maQ==
†These authors have contributed equally to this work