 Zhijiang Xie1
 Limin Xing1
 Mengqiao Zhao1Lei Zhao1Jinling Liu1
 Yushan Li1Jiankang Gan2
 Siyu Chen1*
 Hua Li1*
- 1Guangdong Provincial Key Laboratory of Animal Molecular Design and Precise Breeding, Key Laboratory of Animal Molecular Design and Precise Breeding of Guangdong Higher Education Institutes, School of Life Science and Engineering, Foshan University, Foshan, China
- 2Guangdong Tinoo’s Foods Group Co., Ltd., Qingyuan, China
Dominance hierarchy exists in social animals and shows profound impacts on animals’ survival, physical and mental health, and reproductive success. Aggressive interaction, as the main indicator used to calculate social hierarchy, however, is not found in some female animals. In this study, we aimed to figure out the establishment of social hierarchy in hens that almost perform aggressive behaviors and investigated the interactions of social hierarchy with production performance and gut microbiome. Forty 49-day-old Qingyuan hens were randomly divided into four groups. The social hierarchy of hens was calculated by the relative position around the feeder. The rank 1 (R1), R2, R3, R4, R5, R6, R7, R8, R9, and R10 birds were determined in ascending order. Then, R1 and R2 birds (four duplicates, n = 8) were named as the high-ranking hens (HR) group, while R9 and R10 individuals were named as the low-ranking hens (LR) group (four duplicates, n = 8). The heart index (p = 0.01), number of visits per day, daily feed intake, and occupation time per day were higher in the HR group than LR group, but the LR group had a higher feed intake per visit than the HR group. The alpha diversity was significantly lower in the HR group than the LR group (p = 0.05). The relative abundance of phylum Firmicutes was higher while that of phylum Deferribacterota was lower in the HR group than LR group (p < 0.05). At the genus level, the relative abundance of Succinatimonas, Eubacterium hallii group, and Anaerostipes were higher in HR group than in LR group. The relative abundance of Bacteroides, Mucispirillum, Subdoligranulum, and Barnesiellaceae unclassified was higher in the LR group than HR group (p < 0.05). In conclusion, the rank of hens could be calculated by the relative position around the feeder when they compete for food. The dominant hens have a versatile. Moreover, they are more vigilant and have priority when foraging. Low-ranking hens adopt strategies to get enough food to sustain themselves. Hens of high-rank possess beneficial bacteria that use favorable substances to maintain the balance of the gut environment.
Introduction
Social dominance is a ubiquitous phenomenon, which is among social creatures from insects to primates (1, 2). Social rank affects the distribution of dominant resources among individuals, and individuals with high rank tend to select areas where dominant resources are densely distributed, thus obtaining more relative resources. For example, cattle with high rank spend more time eating grains while grazing, and cattle with low rank spend more time circling along the pasture (3). The establishment of a social hierarchy is conducive to avoiding unnecessary conflicts, fights, and resource competition within groups. Low-ranking rhesus monkeys avoid attacks and threats from the dominant monkeys by “playing dumb” (4). The dominant individuals reproduce preferentially (5), which is essential for population development as well as the improvement of interspecific competitiveness (6).
Up to date, increased studies conducted on the social hierarchy have been also reported in chickens. It was already known that the highest-ranking rooster had priority for feeding (7) and crowing (8). Additionally, high-ranking roosters had higher plasma testosterone concentrations and lower ejaculatory testosterone compared to low-ranking individuals, suggesting that the social order in chickens has a significant impact on their hormonal regulation (9). Dominant hens force subdominant hens to produce submissive behavior through threat or force (10), and higher-rank hens had heavier eggs than lower-rank hens (11). This was because low-ranking hens were pecked at by the dominant hens, which caused them to stay in the nest for a shorter period and therefore tend to delay laying eggs (12). Notably, in the above-mentioned studies, aggressive interaction was the only indicator used to calculate the social hierarchy. However, there were rare aggressive behaviors in the group of some female animals. Thus, how to calculate the social hierarchy of these animals attracts our great attention.
In recent years, gut microbiota has become one of the major topics because of its association with the health and disease of the host. In chickens, a healthy microorganism balance is maintained within the gut (13), and complex functional interactions between intestinal microbes and host immunity are important for intestinal health (14). Our previous study has found that the health of the dominant roosters appears to benefit from short-chain fatty acids activity, while that of subdominant roosters may benefit from microbial function (15). However, little is known about the interaction between the social hierarchy of individuals with the production performance and gut microbiota in hens.
Thus, we will implement a precision feeding system to monitor the production performance of individuals. Accordingly, in this study, we aimed to figure out the establishment of social hierarchy in hens that almost perform aggressive behaviors, and investigate the interactions of social hierarchy with production performance and gut microbiome. Understanding these interactions would give new insights into strategies for enhancing hen health and well-being, as well as the improvement of management strategies for animals.
Materials and methods
Animals and feeding
Forty Qingyuan hens provided by Guangdong Tiannong Food Co., Ltd., at the age of 49 days with an average body weight of 652.5 g (SD = 50.12) were randomly selected for the study. Then 40 hens were randomly divided into four groups, with ten hens in each group. They were housed in a separate barn (1.5 m × 1.5 m × 2.5 m) with concrete ground with no litter material. All the experimental animals were tagged using colored leg rings and given free access to water and a commercial diet that was provided daily at 8:00 a.m.
Establishment of social rank
Ten-minute feeding competition tests for hens in each group were performed at 57–59, and 76–78 days of age, a total of 6 times. Birds were deprived of food but not water from 18:00 the day before each test. Each separated barn contained a feeder, which only allowed two to four birds at a time to feed. Since aggressive behaviors were rare among these animals, a four-grade evaluation system was used for the relative position of foraging behavior at 30-s intervals for each bird. A score of 3 means hens were consuming the feed; score 2 means hens were not feeding but were within 2 to 6 cm of the feeder or had great motivation to approach the feeder; a score of score 1 means hens were squeezed out by the hens with score 2, or wandering around and seeking chances to approach the feeder; and a score of 0 means hens were independent and not fighting for food, or were over 20 cm away from the, or showed no desire to approach the feeder as they were foraging in the opposite direction of the feeder. The higher the score, the higher the social rank. The social rank of each hen was calculated for each test, and the final ranking was based on the sorted sum of the six evaluations. The higher the “sorted sum,” the lower the social rank. Subsequently, the rank 1 (R1), R2, R3, R4, R5, R6, R7, R8, R9, and R10 birds were determined in ascending order according to social rank. Then, R1 and R2 birds (four duplicates, n = 8) were named as the HR group, while R9 and R10 individuals were named as the LR group (four duplicates, n = 8).
Feeding behavior, production performance, and organ index
From 67 days of age, a precise feeding system (9WJJ-20 produced by Guangdong Guangxing Animal Husbandry Equipment Co.) was introduced into the experiment, which allows only one bird at a time to feed. Each bird wore an ankle bracelet on its feet for system identification. By using the system, data including body weight, duration of feeding time, number of visits per day, occupation time per visit, feed intake per visit, occupation time per day, and daily feed intake were automatically recorded. Accordingly, the initial body weight, final body weight, and average daily weight gain were calculated during the whole experimental period. At the age of 91 days, all hens were humanely euthanized, and the bursa of the fabricius, heart, liver, and spleen of each bird was collected for weighing immediately. Organ index (%) = (organ weight/body weight) x 100% was used to determine the index for these organs.
Vigilance test
At 61, 75, 79, 82, and 87 days of age, the same arena was used to measure the attentiveness of the birds in each group in response to a predator. The birds were accustomed to living worms (200 g/d) as a highly prized food source before the test, and they received them alongside regular meals from days 49 to 55. Hens were not provided with food and water at 18.00 on the day before the test. Regular feed was provided in one corner of the testing area, and regular feed containing live worms was placed in the other corner, 50 cm vertically above the feed, along with a hawk model (length: 30 cm; width: 30 cm). Additionally, during the 12-min test, hawk vocalizations were played three times (at 4, 8, and 12 min), and the hens’ response was graded on a scale from 0 to 2, with 0 denoting the lowest level of fear. Briefly, score 0 meant that there was no discernible change in the hen’s behavior; score 1 meant that the hen raised its head once and immediately went back to explore or eat; score 2 meant that the hen raised its head once and made an alarm call or walked quickly for more than 3 s or stopped moving for 3 to 10 s.
Gut microbiome
On the slaughter day, the cecum contents of HR and LR birds were collected. Before being processed, they were kept in dry ice and then at-80°C. In order to create a library for sequencing, cecal DNA was extracted using the QIAamp DNA stool micro kit (Tiangen Biotech, Beijing, China) in accordance with the manufacturer’s instructions. Then, DNA quality was evaluated using agarose gel electrophoresis, and DNA quantity was determined using a UV spectrophotometer. 16S rRNA gene fragments containing the V3 and V4 hypervariable regions were amplified using primers 5’-CCTACGGGNBGCASCAG-3′ and 5’-GACTACNVGGGTATCTAATCC-3′ (16). The Illumina NovaSeq platform was used to sequence a total of 16S rRNA amplicons. QIIME2 (Version 2022–2) (17) was used to preprocess, quality filter, trim, denoise, merge, model, and analyze sequences through DADA2. The SILVA database was used to annotate feature sequences for each typical sequence, and the R package (v3.5.2) was used to graph the results. The concept of ASVs (Amplicon Sequence Variants) was used to construct classes of OTUs (Operational Taxonomic Units). Bioinformatics analysis was done using the ASV data to determine the relative abundance of taxonomic ranks and alpha diversity. Alpha diversity in terms of observed_otus, Shannon, Simpson, chao1, and Pielou_e indexes were used to explore within-group sample diversity. Higher index numbers represent higher alpha diversity. Utilizing the OmicStudio tools found at https://www.omicstudio.cn, a clustering correlation heatmap with indications was created.
Statistical analysis
All data were analyzed by SPSS 25 and displayed as mean ± standard error (SE). Production performance data were checked for normality and homogeneity of variance, transformed where necessary, and analyzed by t-test. The Wilcoxon test was used to analyze the score obtained in the vigilance test. All values with p < 0.05 were considered statistically significant (Table 1).
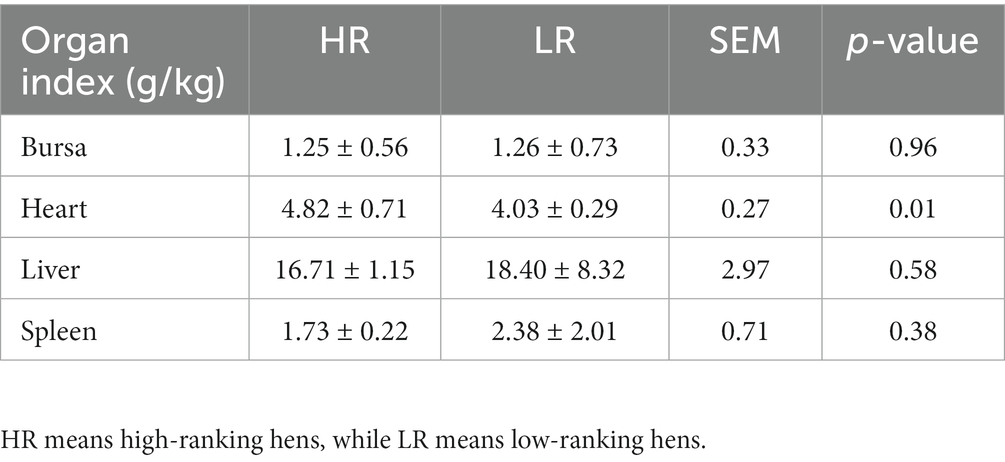
Table 1. Organ index of birds between high-and low-ranking hens.
Ethical statement
This study was approved by the Animal Care Committee of Foshan University (Approval ID: FOSU#121).
Results
Social rank
As shown in Figure 1, hens numbered 5 (sorted sum: 14), 9 (18), 15 (9), 18 (13), 26 (17), 29 (18), 31 (10), and 39 (17) were in HR group and hens numbered 3 (sorted sum: 44), 6 (55), 14 (55), 20 (47), 22 (51), 25 (60), 32 (46), and 38 (51) were in LR group.
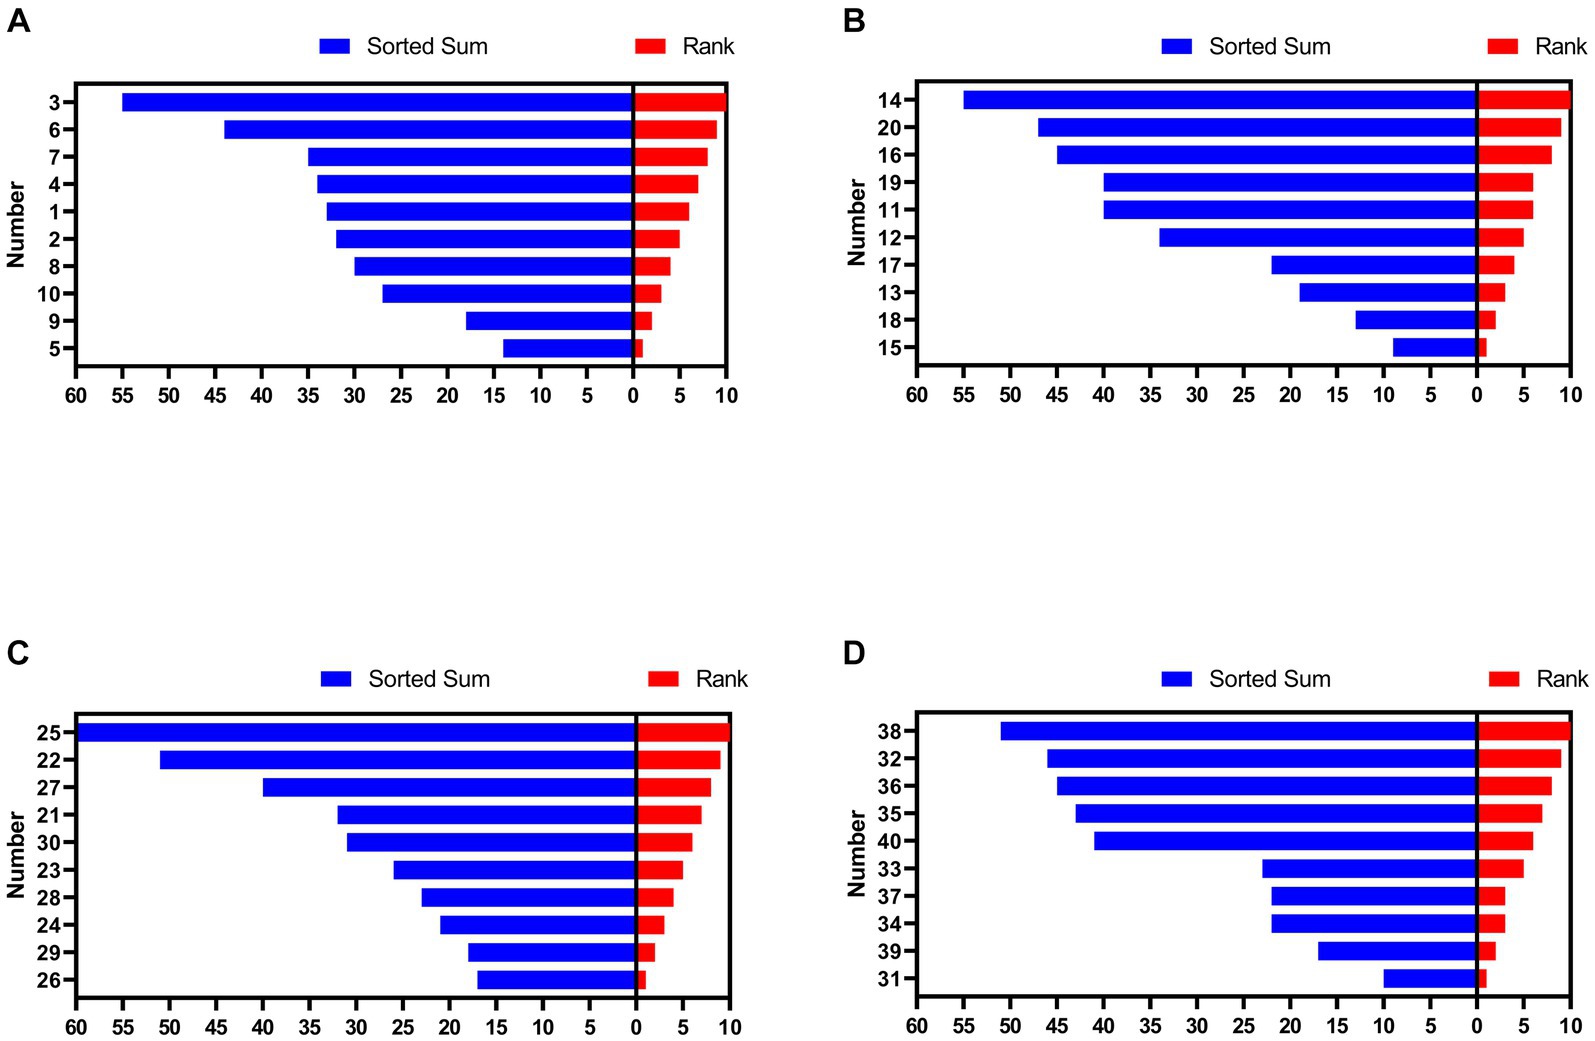
Figure 1. Social rank of hens in each group. (A) Group 1. (B) Group 2. (C) Group 3. (D) Group 4. The numbers on the y-axis represent each hen. HR means high-ranking hens, while LR means low-ranking hens.
Feeding behavior, production performance, and organ index
The body weight of all animals increased gradually from 67 to 90 days of age, but that of the HR group was consistently heavier than that of the LR group (Figure 2A). Initial body weight (Figure 2B), final body weight (Figure 2C), average daily gain (Figure 2D), occupation time per visit (Figure 2G), and feed conversion ratio (Figure 2J), were not significantly different between HR and LR hens. Number of visits per day (Figure 2E; p < 0.05), daily feed intake (Figure 2H; p < 0.05), and occupation time per day (Figure 2F; p < 0.01) were significantly higher, while feed intake per visit (Figure 2I; p < 0.05) was significantly lower in the HR than LR. The heart index was significantly higher in the HR group than in the LR group (Table 2; p = 0.01), but there was no significant difference between the two groups in the bursal, liver, and spleen indexes.
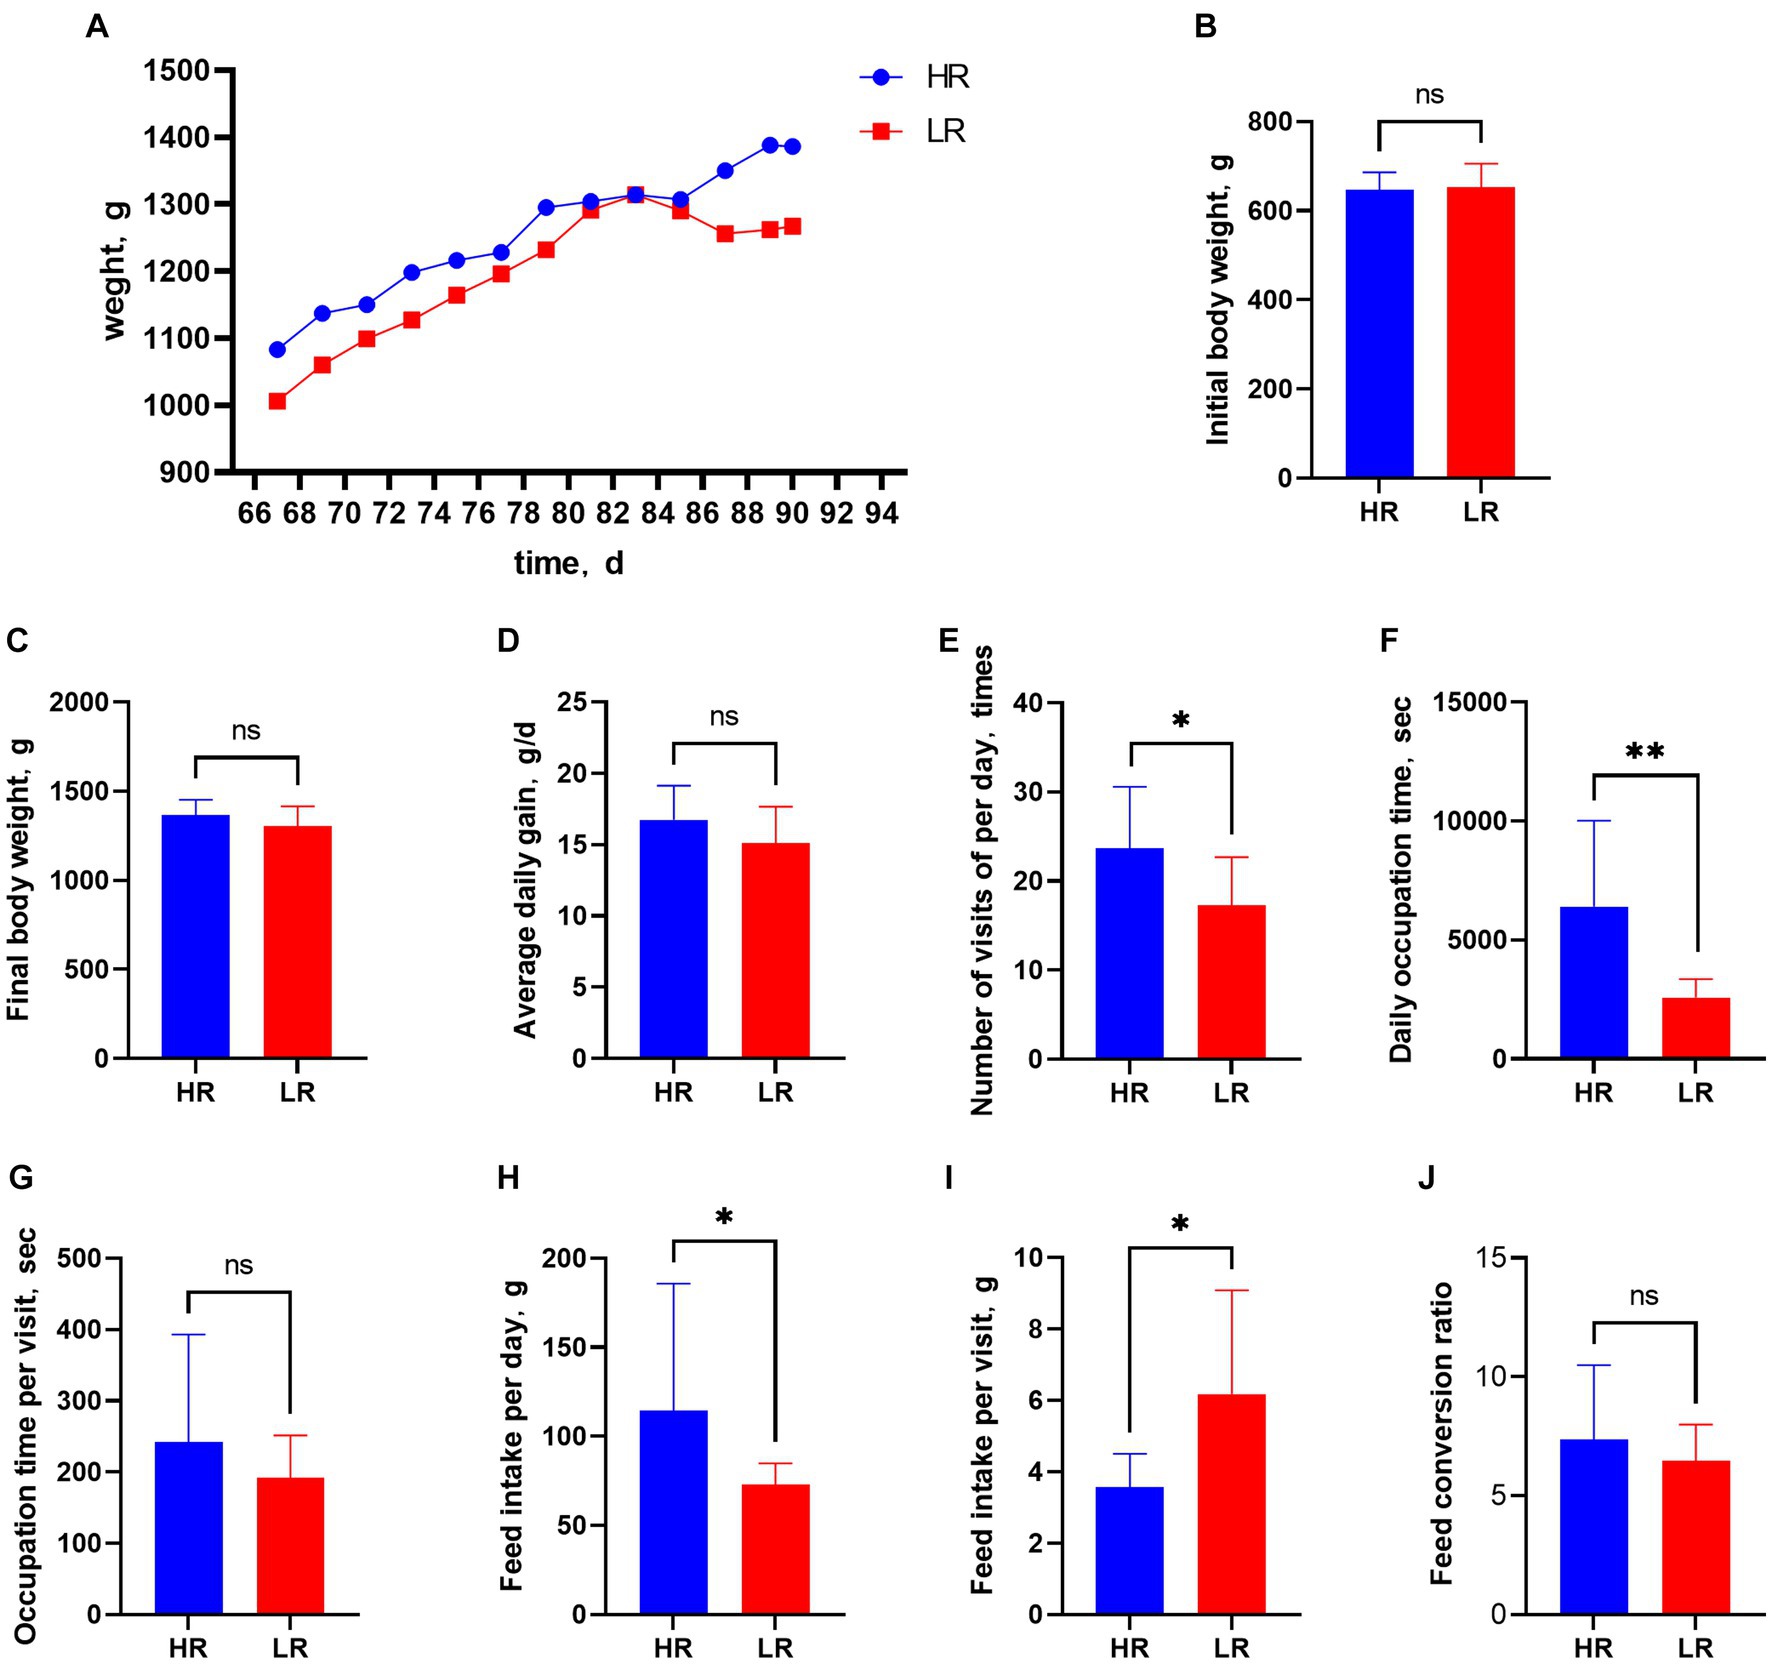
Figure 2. Feeding behavior and production performance. Figure 2 Feeding behavior and production performance. (A) Body weight from 67 to 90 days of age. (B) Initial body weight. (C) Final body weight. (D) Average daily gain. (E) Number of visits per day. (F) Occupation time per day. (G) Occupation time per visit. (H) Daily feed intake. (I) Feed intake per visit. (J) Feed conversion ratio. HR means high-ranking hens, while LR means low-ranking hens. “ns” means not significant. Asterisks denote significant deviations (*p < 0.05, **p < 0.01).
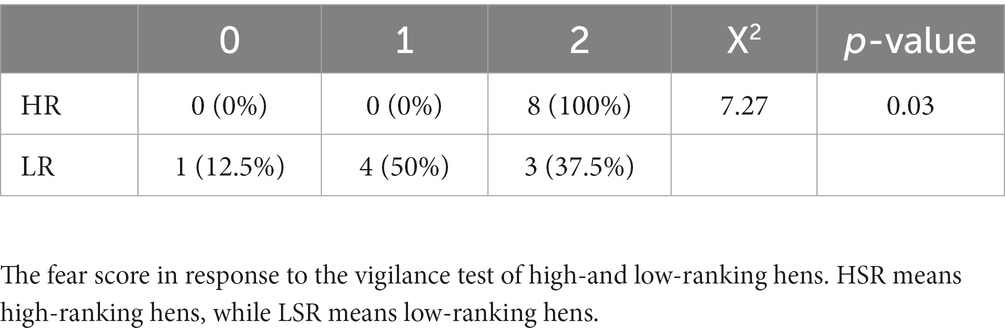
Table 2. Vigilance tests.
Vigilance tests
In response to the vigilance test (Table 2), score 2 of the HR group was (100%) significantly higher than that of the LR group (50%).
Gut microbiome
In our analysis, a total of 5,144 ASVs were observed across both HR and low-risk LR groups. Among them, 1,528 ASVs were exclusively present in the HR group, while 2,170 ASVs were unique to the LR group (Figure 3A). At the phylum level, the top three phyla in the chicken cecum were Bacteroidetes, Firmicutes, and Proteobacteria (Figure 3C). The relative abundance of Firmicutes (p < 0.05) was higher in high-ranking hens than in low-ranking hens, while the relative abundance of Deferribacterota (p < 0.05) was lower in high-ranking hens than in low-ranking hens (Figure 3E). At the genus level, the top three microbes were Bacteroides, Rikenellaceae RC9 gut group, and Clostridia UCG-014 unclassified (Figure 3D). The relative abundance of Succinatimonas (p < 0.05), Eubacterium hallii group (p < 0.05), and Anaerostipes (p < 0.05) in the high-ranking hens was higher than that of low-ranking hens. At the same time, the relative abundance of Bacteroides (p < 0.01), Mucispirillum (p < 0.05), Subdoligranulum (p < 0.05), and Barnesiellaceae unclassified (p < 0.05) was lower in high-ranking hens than in low-ranking hens (Figure 3F).
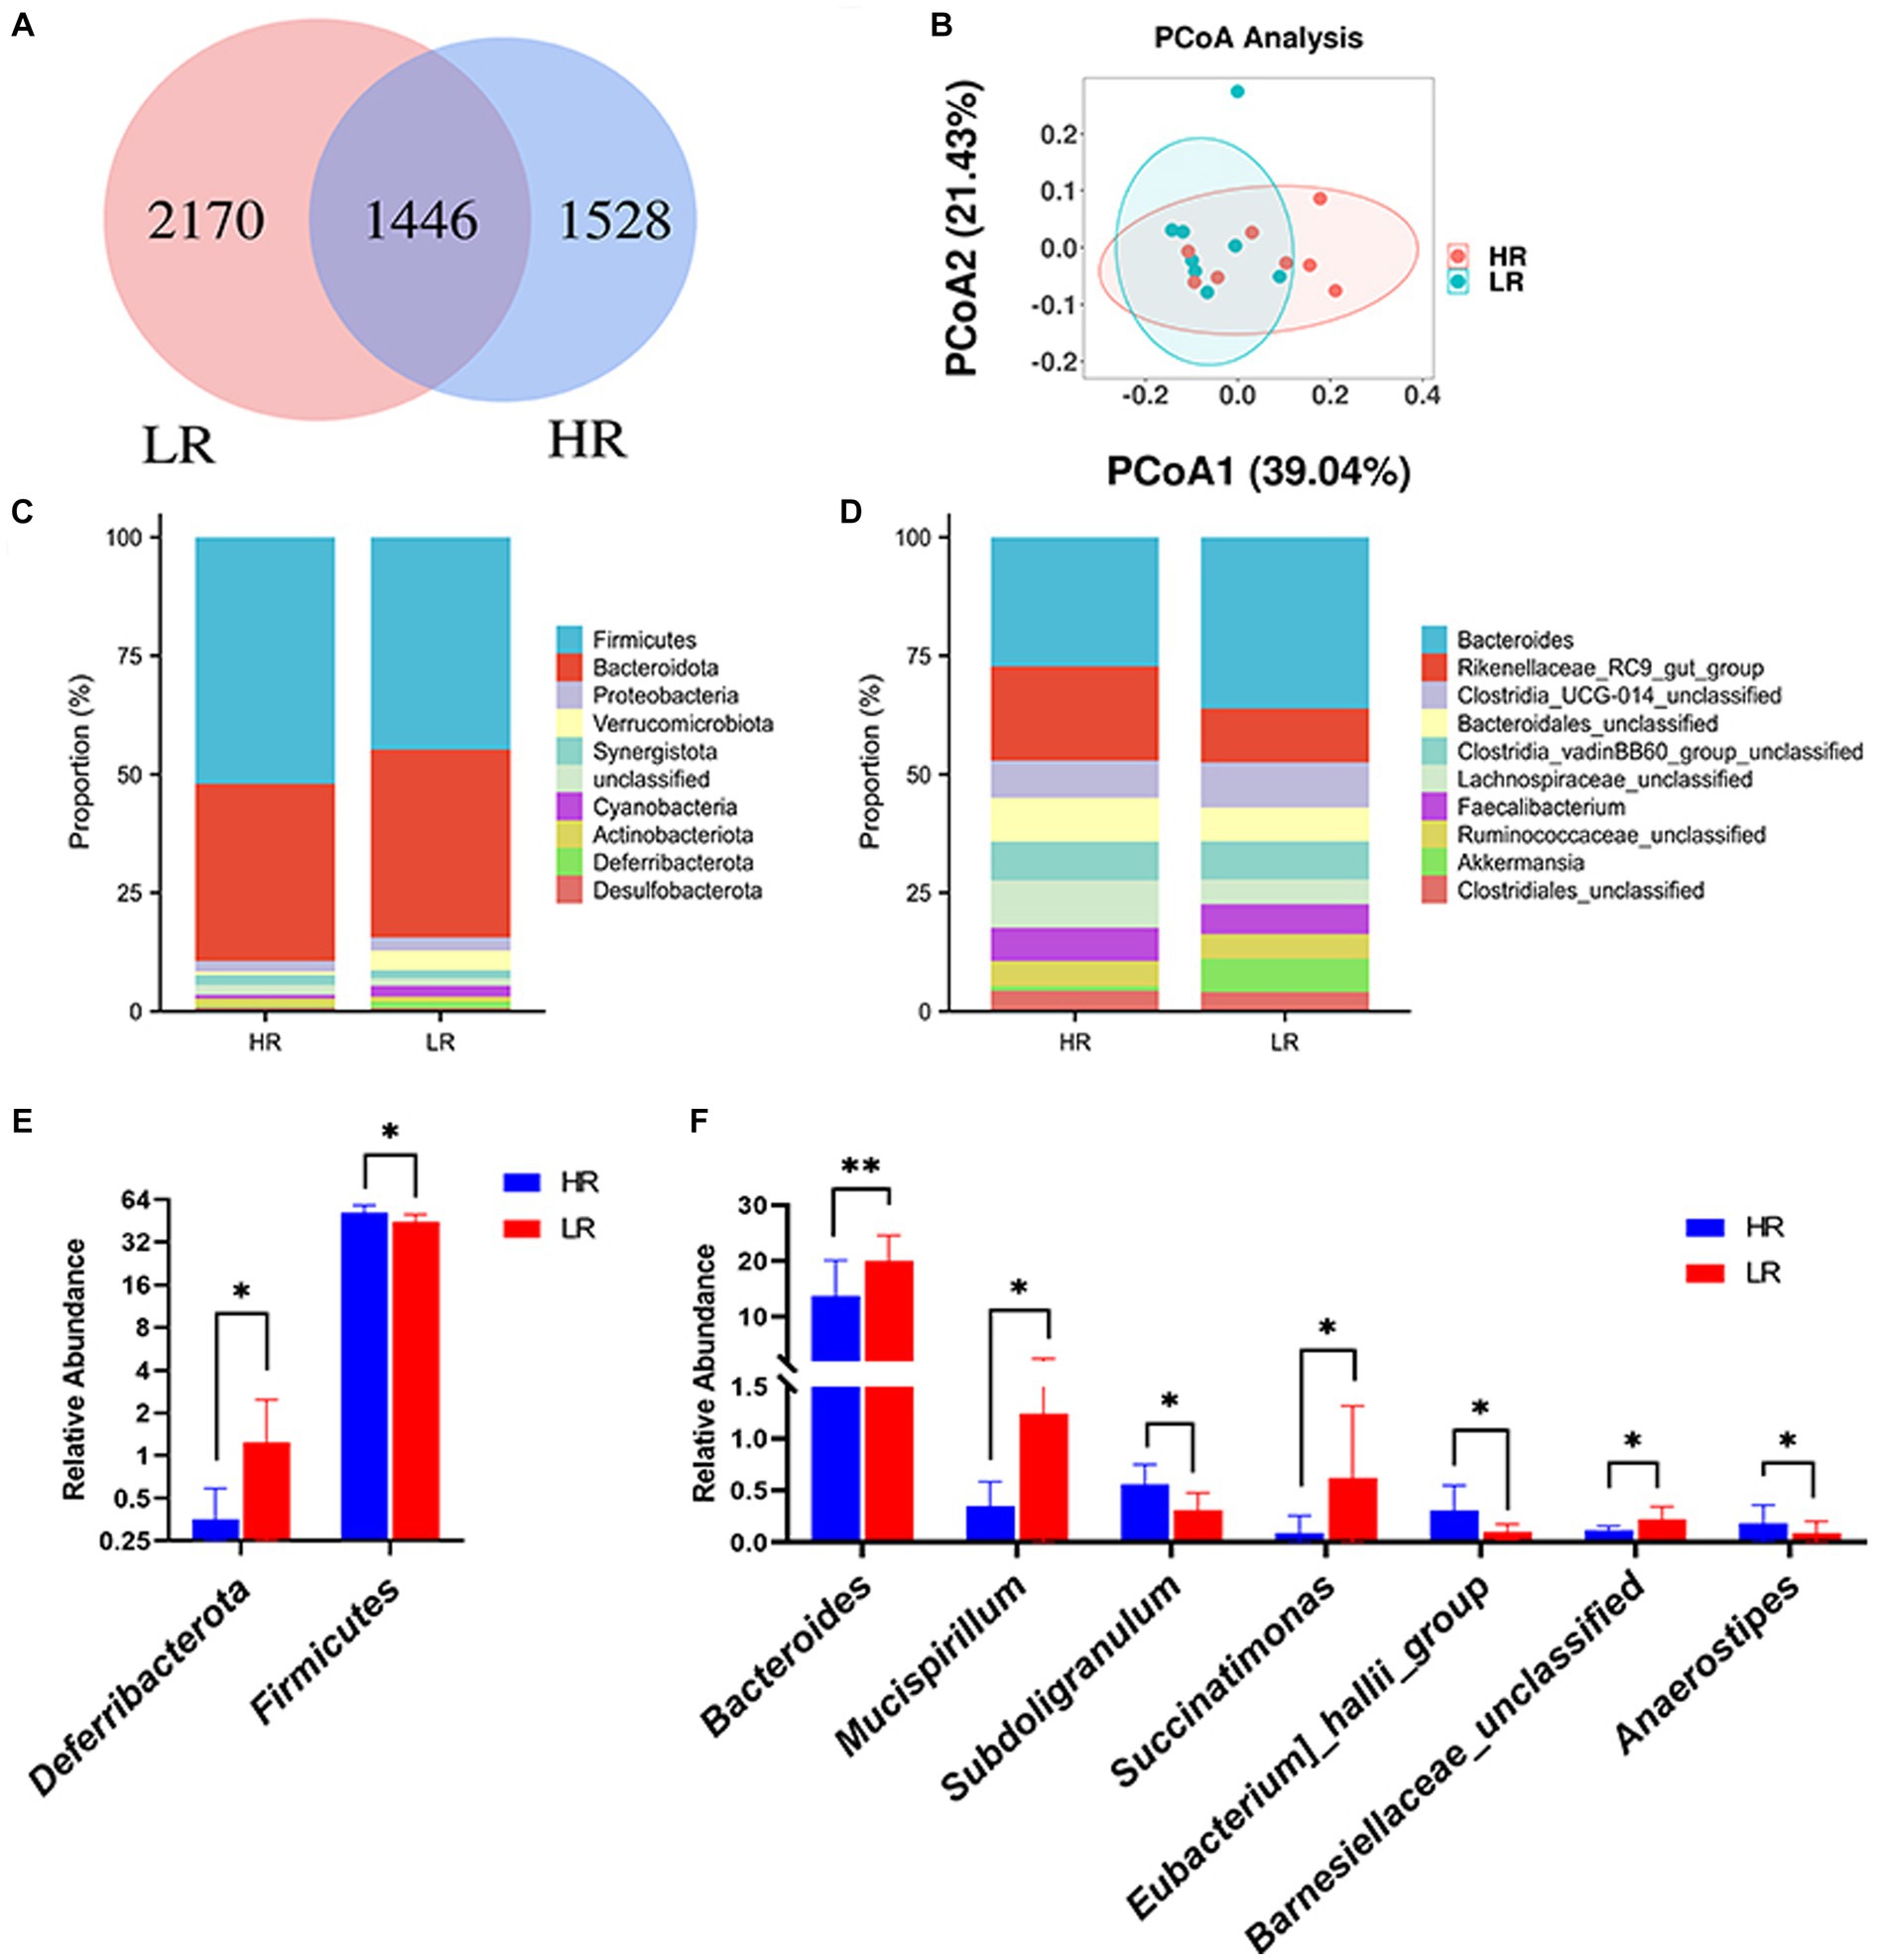
Figure 3. Gut microbiome. (A) ASV distribution Venn diagram. (B) Principal coordinate analysis (PCOA) of the cecal microbiota. (C) Relative abundance of gut microbes at phylum level. (D) Relative abundance of gut microbes at genus level. (E) Differential analysis of gut microbes at phylum level. (F) Differential analysis of gut microbes at the genus level. HR means high-ranking hens, while LR means low-ranking hens. Asterisks denote significant deviations (*p < 0.05, **p < 0.01).
The beta diversity of the gut microbiome between HR and LR hens was significantly different by PCoA analysis based on the weighted unifrac distance matrix (Figure 3B). Alpha diversity was significantly lower in the HR group than in the LR group in terms of observed_otus and chao1 index (Table 3; p = 0.05), with no difference in terms of the Shannon, Simpson, and Pielou indexes.
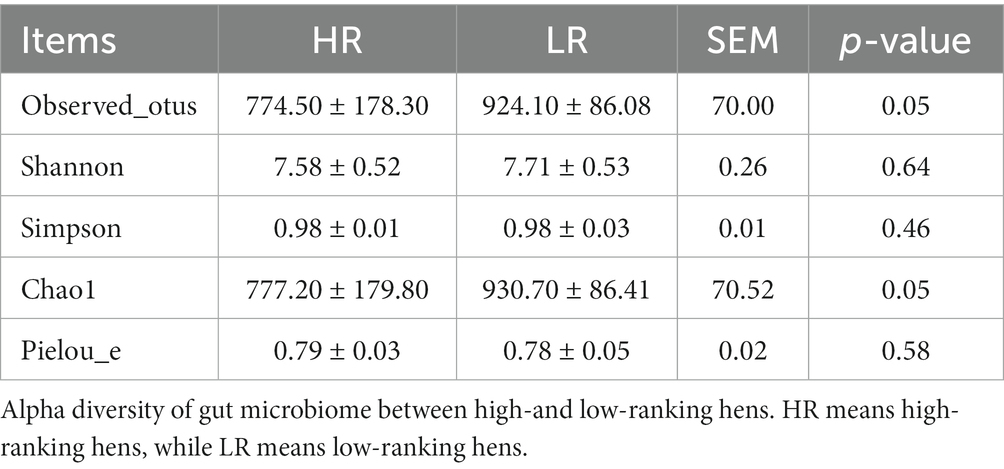
Table 3. Alpha diversity.
The relative abundance of phylum_Firmicutes was significantly and positively correlated with occupation time per day (p < 0.01), and that of phylum Deferribacterota was significantly and negatively correlated with occupation time per day (p < 0.05) (Figure 4A). At the genus level (Figure 4B), the relative abundance of Anaerostipes was significantly and positively correlated with occupation time per day (p < 0.01). The relative abundance of Eubacterium hallii group was significantly and positively correlated with feed intake per visit (p < 0.05) and negatively correlated with occupation time per day (p < 0.05). Subdoligranulum was significantly and positively correlated with daily feed intake (p < 0.05). The relative abundance of Bacteroides significantly and positively correlated with feed intake per visit (p < 0.05), and negatively correlated with average daily gain (p < 0.05). The relative abundance of Barnesiellaceae unclassified was significantly and negatively correlated with final body weight (p < 0.05). The relative abundance of Mucispirillum and Succinatimonas was significantly negatively correlated with occupation time per day (p < 0.05).
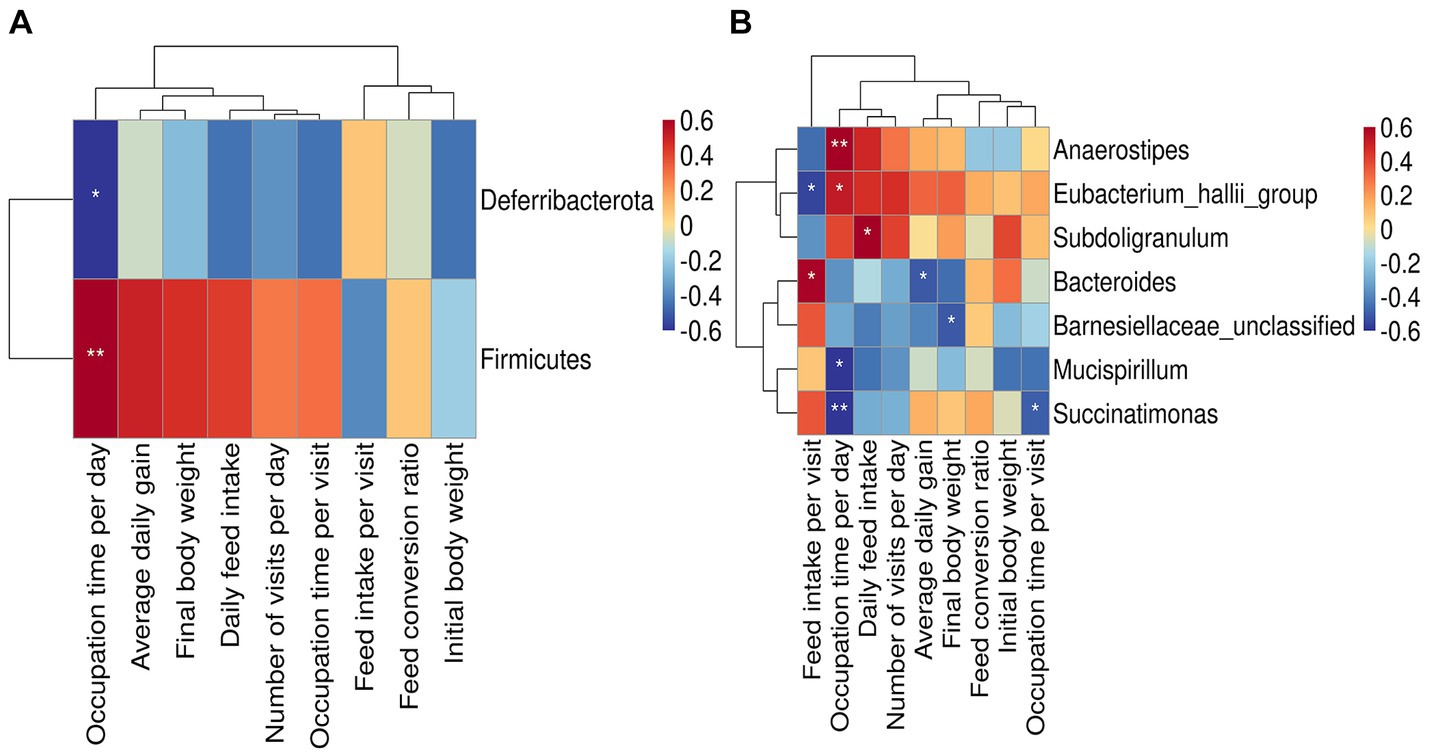
Figure 4. Relationship between bacteria and feeding behavior or production performance. (A) Heat map of the correlation between gut microbes at phylum level and feeding behavior or productive performance. (B) Heat map of the correlation between gut microbes at genus level and feeding behavior or productive performance. Asterisks denote significant deviations (*p < 0.05, **p < 0.01).
Discussions
The social hierarchy is usually established in terms of aggressive interactions in both the male and female animals as mentioned above (7, 10). However, in some cases aggressive behavior is rare in female animals, which makes the establishment of a social hierarchy difficult to identify. In this study, we set up food competition and found a clear order of access to food resources among the Qingyuan partridge hens. The higher-ranking birds had priority to forage food, the subdominant birds always observed and then searched for opportunities to forage, and the low-ranking birds were not involved in the food competition or surrendered to higher-rank birds. Accordingly, we used the relative position around the feeder to calculate the social rank. The principle of advantageous rank benefit suggests that social rank affects the distribution of advantageous resources among individuals, and higher-ranking individuals are prone to have more advantageous resources (18). For example, Shimmura et al. (19) found the results of the competition for food resources were positively correlated with the social rank of hens, and high-ranking hens had priority to use welfare facilities such as perches and laying boxes (20). In this study, the number of visits per day as well as the occupation time per day in the HR group was significantly higher than that in the LR group, indicating that hens in higher social rank had more opportunities to feed. However, initial body weight, final body weight, and average daily gain were not different between high-and low-ranking hens. This is consistent with a pig study (21) and may be explained by the fact that animals in the same environment will ensure their own required intake by selecting multiple equally effective feeding strategies (22). Pigs will adopt different dietary patterns of meat eaters (few long meals every day) or nibblers (many short meals every day). We found out that chickens of high-ranking had feeding priority (7) while low-ranking chickens also had access to food to satisfy their needs after the higher rank birds finished feeding. Feed intake per visit was significantly higher in the LR group than in the HR group, which was unexpected and may suggest that hens with low social rank need to meet their energy and nutritional requirements within a limited period of time. This is probably the main reason why no difference in body weight between the high-and low-ranking hens, regardless of the consistently higher body weight of HR than LR. Our results show that hens of high social rank have a tremendous advantage in terms of access to resources. While, hens of lower rank use a strategy of increasing feed intake per visit to ensure daily food intake.
In a previous study, better immune functions were found in higher-rank rhesus monkeys than in lower individuals (23). We calculated organ indexes related to immune function and did not find the difference in liver, spleen, and bursa indexes between high-and low-ranking birds. Additionally, the heart index of the hens in the HR group was significantly higher than that in the LR group, which may suggest better aerobic capacity in HR birds than in LR birds (24). Notably, greater exercise capacity means more energy consumption, that is to say, the high-ranking hens may get more food but also consume more energy, which may be one of the causes for no differences in body weight between high-and low-ranking hens.
Anti-predator behavior refers to a range of behaviors exhibited by prey species in response to predators, including alertness, aggression, and vocalization (25). Low-ranking avians are reported to be more vigilant when they take the form of visual scanning (26). Stress is a manifestation of hypervigilance and is considered to be a response to uncertainty (27). Therefore, low-ranking animals are deemed to be more fearful and suffer more stress as compared to high-ranking animals (28). Nevertheless, high-ranking hens showed more vigilance in the face of danger than low-ranking hens in this study. As known, an appropriate level of stress is considered an adaptive coping mechanism because it allows animals to avoid potential threats and seize opportunities to improve ranking or access resources (29). We speculated that the higher vigilance of high-ranking hens may be due to perceived threats from outside.
The alpha diversity is mainly used to reflect species richness and as a stressor indicator reported in chicken (30), mice (31), and dairy studies (32). In the present study, the alpha diversity of low-ranking hens was higher than those of high-ranking hens. This finding may suggest the higher stress of higher-ranking birds than lower-ranking birds, which is somehow supported by the fear response between HR and LR hens. At the phylum level, Bacteroidetes, Firmicutes, and Proteobacteria were the most abundant in the cecal microbiota, which was consistent with previous studies (33, 34). Firmicutes play a pivotal role in the fermentation of complex polysaccharides (35) and contribute significantly to the digestion of plant fibers (36). Their higher abundance in the gastrointestinal tract aids in providing growing animals with essential nutrients and energy resources (37). Additionally, Firmicutes encompass a substantial number of gram-positive bacteria, some of which are beneficial and contribute to pathogenic defense while maintaining a balance in intestinal microflora (38). Deferribacteres, another bacterial group, obtain energy through exclusive or parthenogenetic anaerobic metabolism, influencing iron metabolism and being associated with intestinal iron homeostasis (39). Microorganisms need iron for growth and metabolism (40), and thus the lower abundance of Deferribacteres may be one of the reasons for the lower alpha diversity in high-ranking hens than in low-ranking hens. Genus Succinatimonas can utilize small amounts of sugar and produce succinic and acetic acids from glucose as the primary fermentation end products (41). A more prosperous abundance of the intestinal genus Eubacterium hallii represents a better level of social function (42), which can use glucose, fermentation intermediates acetate, and lactate to create the beneficial butyrate for intestinal health (43, 44). Anaerostipes are known for their ability to produce butyrate from sugars as well as lactate and acetate (45), which has a potentially beneficial role in promoting host health (46). Bacteroides are anaerobic, bile-resistant, non-spore-forming gram-positive rods that are clinically important pathogens seen in most anaerobic infections (47). In the cecum samples of pigs, Bacteroides were negatively associated with fatness traits (48). Besides, the reduction of Mucispirillum abundance in gut microbiota was known to be linked with decreased blood triglycerides and free fatty acids in mouse (44). There is evidence that subdoligranulum is associated with chronic inflammation and inefficient metabolic control (45). Barnesiellaceae unclassified was significantly and positively correlated with propionic acid in mice (46). These results may suggest more beneficial bacteria and better intestinal environment in high ranking than low ranking hens.
The relative abundance of Firmicutes, Deferribacterota, Anaerostipes, Eubacterium hallii group, Mucispirillum, and Succinatimonas were correlated with occupation time per day. The magnitude of occupation time per day represents the appetite of individuals. Appetite is an inherent drive required to support organic existence (49). Feed intake per visit and occupation time per visit depend on the degree of stomach fullness and gastric capacity of individual hens. In our study, feed intake per visit was related to the relative abundance of Eubacterium hallii group and Bacteroides, while occupation time per visit was related to the relative abundance of Succinatimonas. In cattle, feed intake depends mainly on appetite and rumen capacity (50). Whether these bacteria have any effect on appetite is not yet known, and further research is needed to figure out this interaction between appetite and above gut microbes, so as to better understand the microbial function on production performance.
Conclusion
The social hierarchy of hens that rarely express aggressive interaction could be calculated by the relative position around the feeder when they compete for food. The dominant hens have an versatile, are more vigilant, and have priority access to food resources, while low-ranking hens adopt strategies to get enough food to sustain themselves, and therefore show no differences in body weight with high-ranking hens. Hens of high rank possess beneficial bacteria that use favorable substances to maintain gut health. The relative abundance of some bacteria is found to be associated with appetite; however, their underlying mechanism should be further classified.
Data availability statement
The datasets presented in this study can be found in online repositories. The names of the repository/repositories and accession number(s) can be found at: https://www.ncbi.nlm.nih.gov/, PRJNA1029363.
Ethics statement
The animal studies were approved by Institutional Animal Care and Use Committee of Foshan University. The studies were conducted in accordance with the local legislation and institutional requirements. Written informed consent was obtained from the owners for the participation of their animals in this study.
Author contributions
ZX: Data curation, Formal analysis, Investigation, Methodology, Writing – original draft, Writing – review & editing. LX: Data curation, Formal analysis, Investigation, Methodology, Writing – review & editing. MZ: Data curation, Investigation, Methodology, Writing – review & editing. LZ: Data curation, Investigation, Methodology, Writing – review & editing. JL: Methodology, Writing – review & editing. YL: Methodology, Writing – review & editing. JG: Data curation, Resources, Writing – review & editing. SC: Conceptualization, Methodology, Project administration, Writing – original draft, Writing – review & editing. HL: Conceptualization, Writing – review & editing.
Funding
The author(s) declare financial support was received for the research, authorship, and/or publication of this article. This research was funded by the National Natural Science Foundation (32102596), Major projects in agricultural biology breeding (2023ZD0406401), the Guangdong Provincial Key Laboratory of Animal Molecular Design and Precise Breeding (2019B030301010, 2019KSYS011), and the Characteristic innovation research project for Teachers in College and University (BKS209111).
Conflict of interest
JG was employed by Guangdong Tinoo’s Foods Group Co., Ltd.
The remaining authors declare that the research was conducted in the absence of any commercial or financial relationships that could be construed as a potential conflict of interest.
Publisher’s note
All claims expressed in this article are solely those of the authors and do not necessarily represent those of their affiliated organizations, or those of the publisher, the editors and the reviewers. Any product that may be evaluated in this article, or claim that may be made by its manufacturer, is not guaranteed or endorsed by the publisher.
Supplementary material
The Supplementary material for this article can be found online at: https://www.frontiersin.org/articles/10.3389/fvets.2023.1324937/full#supplementary-material
References
1. Pandey, A, and Bloch, G. Kruppel-homologue 1 mediates hormonally regulated dominance rank in a social bee. Biology-Basel. (2021) 10:1188. doi: 10.3390/biology10111188
2. Vargas-Perez, H, Sellings, L, Grieder, T, and Diaz, JL. Social dominance rank influences wheel running behavior in mice. Neurosci Lett. (2009) 457:137–40. doi: 10.1016/j.neulet.2009.03.098
3. Bica, GS, Filho, LCPM, Teixeira, DL, Sousa, KTD, and Htzel, MJ. Time of grain supplementation and social dominance modify feeding behavior of heifers in rotational grazing systems. Frontiers in Veterinary Science. (2020) 7:61. doi: 10.3389/fvets.2020.00061
4. Ma, M, Xiong, W, Hu, F, Deng, MF, and Zhu, LQ. A novel pathway regulates social hierarchy via lncRNA AtLAS and postsynaptic synapsin IIb. Cell Res. (2020) 30:105–18. doi: 10.1038/s41422-020-0273-1
5. Giavazzi, F, Saino, N, and Vailati, A. High-ranking alleviates male local competition in lek mating systems. Sci Rep. (2018) 8:15189. doi: 10.1038/s41598-018-33292-3
6. Rárová Pinka, M, and Ceacero, F. Higher dominance position does not result in higher reproductive success in female beef cattle. J Anim Sci. (2017) 95:3301–9. doi: 10.2527/jas.2017.1415
7. Rohwer, S. The social significance of avian winter plumage variability. Evolution. (1975) 29:593–610. doi: 10.1111/j.1558-5646.1975.tb00853.x
8. Shimmura, T, Ohashi, S, and Yoshimura, T. The highest-ranking rooster has priority to announce the break of dawn. Sci Rep. (2015) 5:5. doi: 10.1038/srep11683
9. Lelono, A, Riedstra, B, and Groothuis, T. Ejaculate testosterone levels affect maternal investment in red junglefowl (Gallus gallus gallus). Sci Rep. (2019) 9:1–10. doi: 10.1038/s41598-019-48563-w
10. Appleby, MC, Walker, AW, Nicol, CJ, Lindberg, AC, and Elson, HA. Development of furnished cages for laying hens. Br Poult Sci. (2002) 43:489–500. doi: 10.1080/0007166022000004390
11. Cunningham, DL, and Tienhoven, AV. Relationship between production factors and dominance in white Leghorn hens in a study on social rank and cage design. Appl Anim Ethol. (1983) 11:33–44. doi: 10.1016/0304-3762(83)90077-9
12. Lundberg, A, and Keeling, LJ. The impact of social factors on nesting in laying hens (Gallus gallus domesticus). Appl Anim Behav Sci. (1999) 64:57–69. doi: 10.1016/s0168-1591(99)00020-9
13. Cox, CM, and Dalloul, RA. Immunomodulatory role of probiotics in poultry and potential in ovo application. Benefic Microbes. (2015) 6:45–52. doi: 10.3920/bm2014.0062
14. Broom, LJ, and Kogut, MH. The role of the gut microbiome in shaping the immune system of chickens. Vet Immunol Immunopathol. (2018) 204:44–51. doi: 10.1016/j.vetimm.2018.10.002
15. Chen, SY, Yan, C, Liu, W, Chen, KC, Xing, LM, Li, H, et al. Research note: integrated gut microbiome and short-chain fatty acids responds to dominance hierarchy in roosters. Poult Sci. (2022) 101:101670. doi: 10.1016/j.psj.2021.101670
16. Logue, JB, Stedmon, CA, Kellerman, AM, Nielsen, NJ, Andersson, AF, Laudon, H, et al. Experimental insights into the importance of aquatic bacterial community composition to the degradation of dissolved organic matter. ISME J. (2016) 10:533–45. doi: 10.1038/ismej.2015.131
17. Bolyen, E, Rideout, JR, Dillon, MR, Bokulich, NA, Abnet, CC, Al-Ghalith, GA, et al. Reproducible, interactive, scalable and extensible microbiome data science using QIIME 2. Nat Biotechnol. (2019) 37:1091–1. doi: 10.1038/s41587-019-0252-6
18. Leinfelder, I, De Vries, H, Deleu, R, and Nelissen, M. Rank and grooming reciprocity among females in a mixed-sex group of captive hamadryas baboons. Am J Primatol. (2001) 55:25–42. doi: 10.1002/ajp.1036
19. Shimmura, T, Nakamura, T, Azuma, T, Eguchi, Y, and Tanaka, T. Effects of social rank and familiarity on dustbathing in domestic fowl. Anim Welfare (South Mimms, England). (2010) 19:67–73. doi: 10.1016/j.anbehav.2009.11.016
20. Freire, R, Appleby, MC, and Hughes, BO. Effects of social interactions on pre-laying behaviour in hens. Appl Anim Behav Sci. (1998) 56:47–57. doi: 10.1016/s0168-1591(96)01196-3
21. Hoy, S, Schamun, S, and Weirich, C. Investigations on feed intake and social behaviour of fattening pigs fed at an electronic feeding station. Appl Anim Behav Sci. (2012) 139:58–64. doi: 10.1016/j.applanim.2012.03.010
22. Fernandez, J, Fabrega, E, Soler, J, Tibau, J, Ruiz, JL, Puigvert, X, et al. Feeding strategy in group-housed growing pigs of four different breeds. Appl Anim Behav Sci. (2011) 134:109–20. doi: 10.1016/j.applanim.2011.06.018
23. Snyder-Mackler, N, Sanz, J, Kohn, JN, Brinkworth, JF, Morrow, S, Shaver, AO, et al. Social status alters immune regulation and response to infection in macaques. Science. (2016) 354:1041–5. doi: 10.1126/science.aah3580
24. Stoyell-Conti, FF, Irigoyen, MC, Sartori, M, Ribeiro, AA, and Angelis, KD. Aerobic training is better than resistance training on cardiac function and autonomic modulation in female Ob/Ob mice. Front Physiol. (2019) 10:10. doi: 10.3389/fphys.2019.01464
25. Fichtel, C. Avoiding predators at night: antipredator strategies in red-tailed sportive lemurs (Lepilemur ruficaudatus). Am J Primatol. (2007) 69:611–24. doi: 10.1002/ajp.20363
26. Ekman, J. Exposure and time use in willow tit flocks: the cost of subordination. Anim Behav. (1987) 35:445–52. doi: 10.1016/S0003-3472(87)80269-5
27. Clauss, JA, Avery, SN, Benningfield, MM, and Blackford, JU. Social anxiety is associated with BNST response to unpredictability. Depress Anxiety. (2019) 36:666–75. doi: 10.1002/da.22891
28. Otten, W, Puppe, B, Kanitz, E, Schön, PC, and Stabenow, B. Physiological and behavioral effects of different success during social confrontation in pigs with prior dominance experience. Physiol Behav. (2002) 75:127–33. doi: 10.1016/S0031-9384(01)00630-8
29. Wright, EC, Hostinar, CE, and Trainor, BC. Anxious to see you: neuroendocrine mechanisms of social vigilance and anxiety during adolescence. Eur J Neurosci. (2020) 52:2516–29. doi: 10.1111/ejn.14628
30. Chen, SY, Xiang, H, Zhang, H, Zhu, X, Wang, D, Wang, JK, et al. Rearing system causes changes of behavior, microbiome, and gene expression of chickens. Poult Sci. (2019) 98:3365–76. doi: 10.3382/ps/pez140
31. Bailey, MT, Dowd, SE, Parry, NMA, Galley, JD, Schauer, DB, and Lyte, M. Stressor exposure disrupts commensal microbial populations in the intestines and leads to increased colonization by Citrobacter rodentium. Infect Immun. (2010) 78:1509–19. doi: 10.1128/IAI.00862-09
32. Chen, SY, Wang, J, Peng, DD, Li, G, Chen, J, and Gu, XH. Exposure to heat-stress environment affects the physiology, circulation levels of cytokines, and microbiome in dairy COWS. Sci Rep. (2018) 8:14606. doi: 10.1038/s41598-018-32886-1
33. Lee, KC, Kil, DY, and Sul, WJ. Cecal microbiome divergence of broiler chickens by sex and body weight. J Microbiol. (2017) 55:939–45. doi: 10.1007/s12275-017-7202-0
34. Dong, XX, Hu, B, Wan, WL, Gong, YZ, and Feng, YP. Effects of husbandry systems and Chinese indigenous chicken strain on cecum microbial diversity. Asian Australas J Anim Sci. (2020) 33:1610–6. doi: 10.5713/ajas.19.0157
35. Campos, P, Guivernau, M, Prenafeta-Boldu, FX, and Cardona, L. Fast acquisition of a polysaccharide fermenting gut microbiome by juvenile green turtles Chelonia mydas after settlement in coastal habitats. Microbiome. (2018) 6:69. doi: 10.1186/s40168-018-0454-z
36. Thoetkiattikul, H, Mhuantong, W, Laothanachareon, T, Tangphatsornruang, S, Pattarajinda, V, Eurwilaichitr, L, et al. Comparative analysis of microbial profiles in cow rumen fed with different dietary Fiber by tagged 16S rRNA gene pyrosequencing. Curr Microbiol. (2013) 67:130–7. doi: 10.1007/s00284-013-0336-3
37. Sun, BH, Wang, X, Bernstein, S, Huffman, MA, Xia, DP, Gu, ZY, et al. Marked variation between winter and spring gut microbiota in free-ranging Tibetan macaques (Macaca thibetana). Sci Rep. (2016) 6:26035. doi: 10.1038/srep26035
38. Garneau, JE, Tremblay, DM, and Moineau, S. Characterization of 1706, a virulent phage from Lactococcus lactis with similarities to prophages from other Firmicutes. Virology. (2008) 373:298–309. doi: 10.1016/j.virol.2007.12.002
39. Luan, Y, Li, Y, Yue, X, Fei, X, and Zhi, X. Effects of Codonopis bulleynana Forest ex Diels on Deferribacteres in constipation predominant intestine tumor: differential analysis. Saudi J Biol Sci. (2018) 26:395–401. doi: 10.1016/j.sjbs.2018.11.008
40. Hasmik, H, Roland, S, Tjakko, A, and Masja, NG. Comparative genomics of Iron-transporting systems in Bacillus cereus strains and impact of Iron sources on growth and biofilm formation. Front Microbiol. (2016) 7:842. doi: 10.3389/fmicb.2016.00842
41. Morotomi, M, Nagai, F, Watanabe, Y, and Tanaka, R. Succinatimonas hippei gen. Nov., sp. nov., isolated from human faeces. Int J Syst Evol Microbiol. (2010) 60:1788–93. doi: 10.1099/ijs.0.015958-0
42. Kong, XJ, Liu, J, Liu, K, Koh, M, Sherman, H, Liu, SY, et al. Probiotic and oxytocin combination therapy in patients with autism Spectrum disorder: a randomized, double-blinded, placebo-controlled pilot trial. Nutrients. (2021) 13:1552. doi: 10.3390/nu13051552
43. Cao, X, Liu, K, Liu, J, Liu, YW, and Kong, XJ. Dysbiotic gut microbiota and dysregulation of cytokine profile in children and teens with autism Spectrum disorder. Front Neurosci. (2021) 15:635925. doi: 10.3389/fnins.2021.635925
44. Udayappan, S, Manneras-Holm, L, Chaplin-Scott, A, Belzer, C, Herrema, H, Dallinga-Thie, GM, et al. Oral treatment with Eubacterium hallii improves insulin sensitivity in db/db mice. NPJ Biofilms Microbiomes. (2016) 2:16009. doi: 10.1038/npjbiofilms.2016.9
45. Louis, P, and Flint, HJ. Diversity, metabolism and microbial ecology of butyrate-producing bacteria from the human large intestine. FEMS Microbiol Lett. (2009) 294:1–8. doi: 10.1111/j.1574-6968.2009.01514.x
46. Bui, T, Manners-Holm, L, Puschmann, R, Wu, H, and Devos, WM. Conversion of dietary inositol into propionate and acetate by commensal Anaerostipes associates with host health. Nat Commun. (2021) 12:4798. doi: 10.1038/s41467-021-25081-w
47. Wexler, HM. Bacteroides: the good, the bad, and the nitty-gritty. Clin Microbiol Rev. (2007) 20:593–621. doi: 10.1128/CMR.00008-07
48. He, M, Fang, S, Huang, X, Zhao, Y, Ke, S, Yang, H, et al. Evaluating the contribution of gut microbiota to the variation of porcine fatness with the cecum and fecal samples. Front Microbiol. (2016) 7:2108. doi: 10.3389/fmicb.2016.02108
49. Chen, X, Nie, X, Wang, H, Yan, S, and Zhang, Y. Stearic acid induces CCK and GLP-1 upregulation via GPR120/PLC-β, leading to reduced appetite in Hu sheep fed with rice straw. Front Vet Sci. (2022) 9:948074. doi: 10.3389/fvets.2022.948074
Keywords: social hierarchy, hens, production performance, vigilance, gut microbiome
Citation: Xie Z, Xing L, Zhao M, Zhao L, Liu J, Li Y, Gan J, Chen S and Li H (2023) Versatile, vigilance, and gut microbiome support the priority of high-ranking hens. Front. Vet. Sci. 10:1324937. doi: 10.3389/fvets.2023.1324937
Edited by:
Sabine G. Gebhardt-Henrich, University of Bern, SwitzerlandReviewed by:
R. X. Zhang, Northeast Agricultural University, ChinaIvan Rychlik, Veterinary Research Institute (VRI), Czechia
Copyright © 2023 Xie, Xing, Zhao, Zhao, Liu, Li, Gan, Chen and Li. This is an open-access article distributed under the terms of the Creative Commons Attribution License (CC BY). The use, distribution or reproduction in other forums is permitted, provided the original author(s) and the copyright owner(s) are credited and that the original publication in this journal is cited, in accordance with accepted academic practice. No use, distribution or reproduction is permitted which does not comply with these terms.
*Correspondence: Siyu Chen, Y2hlbnNpeXVAZm9zdS5lZHUuY24=; Hua Li, b2todWFsaUBmb3N1LmVkdS5jbg==