 Lea Carisch
 Blanca Lindt
 Henning Richter
 Francesca Del Chicca
- Clinic for Diagnostic Imaging, Department of Diagnostics and Clinical Services, Vetsuisse Faculty, University of Zurich, Zurich, Switzerland
Introduction: Diffusion-weighted magnetic resonance imaging is increasingly available for investigation of canine brain diseases. Apparent diffusion coefficient (ADC) of normal canine brains is reported only in small numbers of subjects. The aim of the study was to investigate the ADC of different anatomical regions in the morphologically normal brain in a large population of canine patients in clinical setting. Additionally, possible influence on the ADC value of patient-related factors like sex, age and body weight, difference between the left and right side of the cerebral hemispheres, and between gray and white matter were investigated.
Methods: Brain magnetic resonance studies including diffusion-weighted images of dogs presented at the Vetsuisse Faculty-University Zurich between 2015 and 2020 were reviewed retrospectively. Only morphologically normal brain magnetic resonance studies of dogs presented with neurological signs or non-neurological signs were included. Apparent diffusion coefficient values of 12 regions of interest (ROIs) in each hemisphere and an additional region in the cerebellar vermis were examined in each dog.
Results: A total of 321 dogs (including 247 dogs with neurological signs and 62 dogs with non-neurological signs) of various breeds, sex and age were included. Apparent diffusion coefficient significantly varied among most anatomical brain regions. A significantly higher ADC was measured in the gray [median 0.79 (range 0.69–0.90) × 10−3 mm2/s] compared to the white matter [median 0.70 (range 0.63–0.85) × 10−3 mm2/s]. No significant differences were found between the left and right cerebral hemispheres in most of the regions, neither between sexes, different reproductive status, and not consistently between body weight groups. Age was correlated first with a decrease from dogs <1 year of age to middle-age (⩾3 to <8 years) dogs and later with an increase of ADC values in dogs ⩾8 years.
Discussion: Apparent diffusion coefficient values of 25 ROIs were described in 321 morphologically normal canine brains in clinical setting. Apparent diffusion coefficient differences depending on the brain anatomical region are present. Apparent diffusion coefficient differences among age classes are present, likely consistent with brain maturation and aging. The described data can be a reference for future studies in clinical settings on the canine brain.
Introduction
Diffusion-weighted imaging (DWI) is gaining popularity in advanced imaging in veterinary medicine and allows quantification of water molecule movement in tissue based on Brownian motion (1). Two diffusion sensitizing gradients – a dephasing and a rephasing gradient - of the same strength, are used next to a 180° radiofrequency pulse. Missing signal return is the result of moving water molecules not being rephased, causing a quantifiable reduction of the magnetic resonance (MR) signal. Movement of water molecules is anti-proportional to tissue cellularity, therefore signal loss can be used to evaluate water molecule’s degree of restricted diffusion (2). The strength of the diffusion sensitizing gradient is defined by its b-value (s/mm2).
Hence, DWI provides information about integrity and to some extent functionality of tissue, and consequently potential pathology (3–5). Based on DWI sequences, apparent diffusion coefficient (ADC) maps can be generated, and the ADC quantified (in mm2/s) in specific regions of interest (ROIs). Variations in ADC can be used to detect and characterize pathological processes (6).
In human medicine DWI is widely used not only with diagnostic purposes to evaluate infarction (7–10), trauma (11) and infection (12) but also for assessment of different neoplasia and individual treatment response (13–16). Further studies investigate mapping of brain regions for identification of epileptogenic zones (17, 18). Moreover, DWI has been used to describe brain maturation and aging in the human brain (19–23) and ADC is known to vary in different regions of the human brain (24). In veterinary medicine, earlier studies mainly describe the use of DWI investigating cerebrovascular incidents in dogs (25, 26), cats (27), rats (28) and brain edema in cats (29). Potential use of DWI also includes evaluation of neoplastic, inflammatory, and epileptic disorders (30–36). Studies evaluating ADC values in the morphologically normal canine brain are rare, (4, 5, 37) with reported differences depending on the anatomical region and on the side of the cerebral hemisphere (4, 5) in small numbers of dogs.
The present study aimed to investigate regional ADC in selected brain regions in the morphologically normal dog brain in clinical setting. No influence of sex, reproductive status and body weight (BW) on ADC has been hypothesized. Difference in ADC depending on the side of the brain hemisphere, on age of the patients, between gray and white matter, and among anatomical regions have been hypothesized.
Materials and methods
Animals
Clinical records of the small animal clinic, Vetsuisse Faculty of the University of Zurich, were reviewed retrospectively. Dogs that underwent magnetic resonance imaging (MRI) examination of the brain, including DWI sequences (see MRI technique), between January 2015 and February 2020 were reviewed. Only dogs with a morphologically normal brain MR examination (absence of abnormalities in morphology and signal intensity in all provided sequences) were included in the study. The diagnosis of a morphologically normal brain study had been stated by a board-certified radiologist, and the images were reviewed by another board-certified radiologist (FDC) at the time of inclusion in the study. If cerebrospinal fluid (CSF) tap was performed, only dogs with normal CSF tap were included. Mildly blood-contaminated samples that were marked by our laboratory, but considered diagnostic, were also included. The analysis consisted of: cell count (reference value: <5 cells/μL), protein concentration (reference value: ≤30 mg/dL) and cytological analysis of cell type as well as serological analysis if indicated. Dogs with any laboratory records of CSF tap abnormalities were excluded. As of the retrospective nature of this study, there was no need to inquire ethical consent. However, a consent form for the use of the dogs’ data for academic purposes was signed by the owners of all dogs included.
Magnetic resonance imaging technique
The MRI examinations of all dogs were performed at the Vetsuisse Faculty, University of Zurich. A 3 T MRI scanner (Philips Ingenia 3.0 T scanner, Philips AG Healthcare, Zurich, Switzerland) and a 32-channel coil (dStream HeadNeck, 32ch MR coil; Philips AG Healthcare) or 16-channel coil (dStream HandWrist, 16ch MR coil; Philips AG Healthcare) for small dogs was used. The dogs were positioned in dorsal recumbency under general anesthesia, using case-by-case anesthetic protocols. Images of the brain including the olfactory lobes to at least the second cervical vertebrae were acquired. The standard brain protocol included the sequences with the parameters listed in Supplementary Table S1. Diffusion-weighted (DW) images were acquired in a transverse plane, setting the two b-values at 0 s/mm2 and 1,000 s/mm2, respectively, and using sensitivity encoding (SENSE) technique and diffusion gradients in all three planes (x-, y- and z-plane). Contrast medium was injected after the DW sequence (DOTAREM 0.2 mL/kg IV [Gadoteric acid; Guerbet Gmbh, Sulzbach, Germany]) followed by saline solution (NaCl 0.9% 5 mL IV).
Data analysis
The signalment, including breed, sex, reproductive status, age, BW, and the symptomatology at presentation was recorded from the medical records of all dogs. Further, body temperature as well as duration of the MRI examination was recorded. All acquired MR images were assessed using a dedicated software (Philips IntelliSpace Portal version 10.1.1; Philips AG, Amsterdam, NL). After acquisition of the DW images, using the IntelliSpace software diffusion package, if necessary, motion correction has been performed. From the DWI sequence, the B0-treshold was adjusted to exclude background pixels from the functional map calculations. The used b-values were selected, and a new imaging series (ADC iso map) generated. Anatomical co-registration (align registration) with the T2W sequence was performed and visually controlled to ensure quality of registration prior to ROI placement.
A total of 13 anatomical brain regions were defined as ROIs and manually drawn in the transverse plane on the ADC map as follows: caudate nucleus, internal capsule (two locations, one rostral and one caudal), piriform lobe, thalamus, hippocampus, occipital lobe (white and gray matter combined and separate), cerebellar lobe (white and gray matter combined and separate), cerebellar vermis (Figure 1). With exception of the cerebellar vermis each ROI was drawn in both left and right hemisphere of the brain, leading to a total of 25 ROIs drawn in each dog. Each ROI was drawn on the slice representing the structure most accurately. Whenever a structure was visible on more than one slice (e.g., thalamus), the slice representing the region with the subjectively largest extent was chosen. Images of all the other sequences and planes and co-registration were used as reference to better identify the anatomy while drawing the ROI. Typically, the ROIs were drawn as follows: on the head of the caudate nucleus; on the rostral and caudal internal capsule (rostral at the level of the head of the caudate nucleus or one slice caudally; and caudal, one or two slices apart from the rostral localization); on the thalamus hemisphere as published in cats (38). The other ROIs were drawn at the level of the best definition and largest extent of the corresponding anatomical structure. ROIs were drawn excluding adjacent brain regions or CSF. ROIs were not drawn in the presence of any kind of artifacts. Considering the different anatomical structures and dogs’ sizes, the position and size of the ROI was adapted to each animal. Therefore, the size of the ROI varied strongly among the different brain regions and among dogs. Drawn regions of interest underwent an internal alignment control: in the first 20 cases, all ROIs were drawn by consensus of two of the authors (BL, a veterinarian specifically trained and FDC, an experienced board-certified radiologist). ROIs of the remaining cases were drawn by only one of the authors (BL). In case of uncertainty, the ROIs were placed by consensus of the two authors. ROI ADC values were expressed in 10−3 mm2/s and size in mm2.
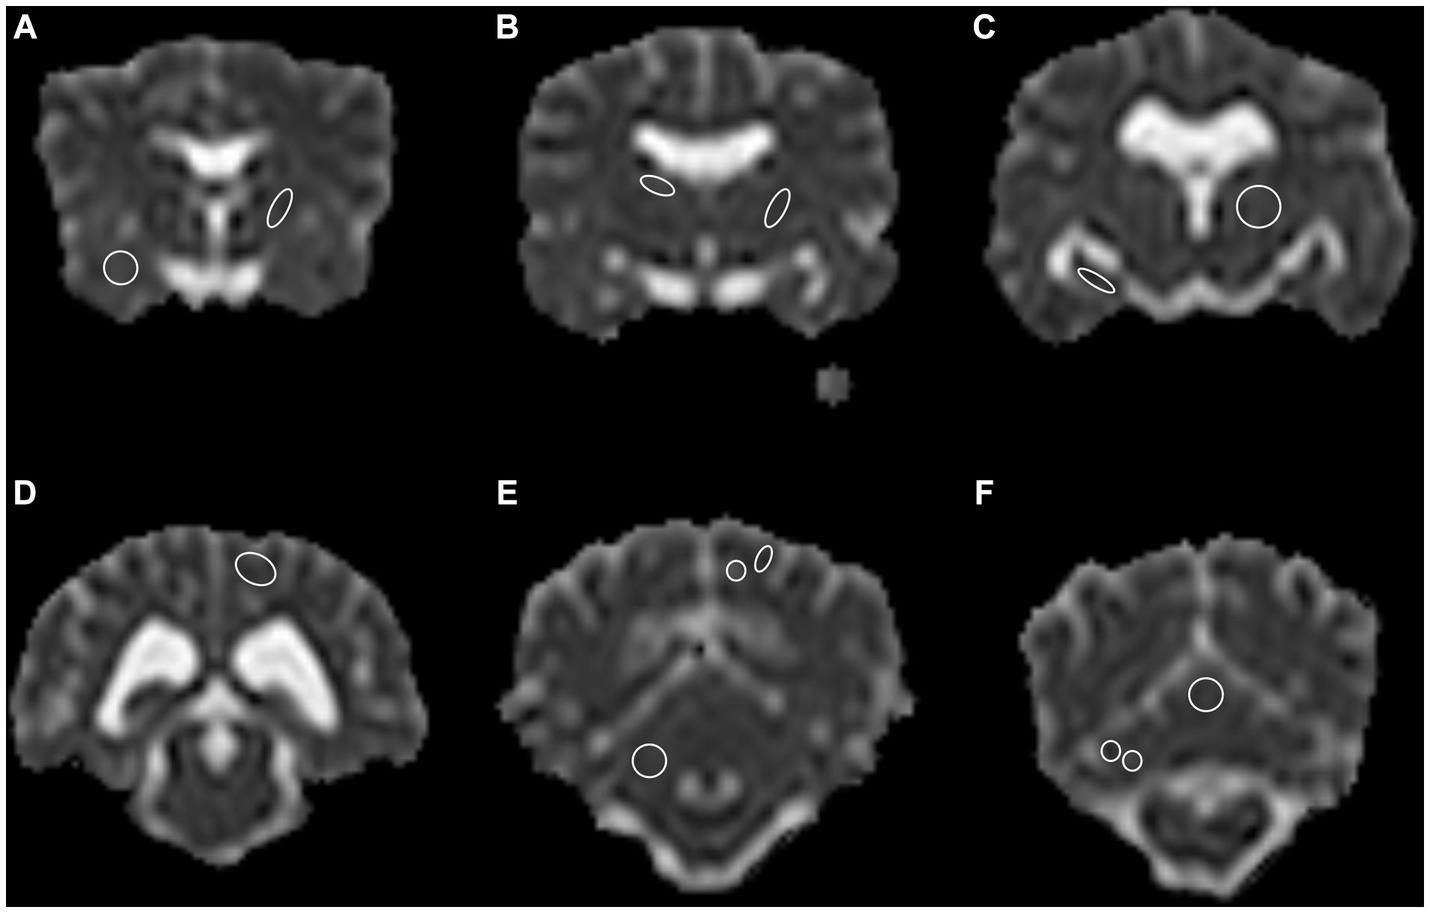
Figure 1. A total of 13 anatomical regions were defined as regions of interest (ROI) and drawn on both cerebral hemispheres in the transverse plane, except for the cerebellar vermis, only drawn in the center. (A) Right piriform lobe; left rostral internal capsule, (B) Right caudate nucleus; left caudal internal capsule, (C) Right hippocampus; left thalamus, (D) Left occipital lobe, gray and white matter combined, (E) Right cerebellum gray and white matter combined; left occipital lobe, gray and white matter separate, (F) Right cerebellar hemisphere gray and white matter separate; central vermis, gray and white matter combined. Note the limited spatial resolution of the apparent diffusion coefficient (ADC) map. The left side is on the right side of the image. Border ROI thickness has been increased for representative purposes. Only one side per ROI for representative purposes depicted.
To assess possible influence of age on ADC values, the study population was grouped in four age classes selected to match different dog life stages: <1 year – early and late puppyhood; ⩾1 to <3 years – young adults; ⩾3 to <8 years – mature adults; and ⩾8 years – senior dogs. Depending on BW, animals were grouped into three BW groups: ⩽10 kg, >10 – ⩽25 kg, >25 kg. Dogs were grouped depending on the reason for MR examination at presentation. Dogs presented with neurological signs were compared to dogs presented with non-neurological signs. Dogs with unclear neurological status were excluded for this analysis. Classifications were based on medical records.
Statistical analysis
Data were collected in a spreadsheet software (Microsoft Excel version 16.45; Microsoft, Redmond, WA, United States) and analyzed using statistical software (IBM SPSS Statistics version 27.0; SPSS, IBM Corp, Armonk, NY, United States). Data for ADC values were not normally distributed and analyzed as non-parametrical. Descriptive statistic was performed, data reported as median (range) and mean ± SD was added when appropriate. The ADC values were tested for statistical difference according to sex and reproductive status, BW group and age classes; as well as differences between right and left cerebral hemisphere and between white and gray matter regions. The ADC between ROIs was analyzed using Friedman’s test for dependent variables, followed by Bonferroni post-hoc correction for multiple pairwise tests. Independent variables were analyzed with the Kruskal–Wallis test (for multiple comparisons) or the Mann–Whitney test (for pairwise comparisons), followed by Bonferroni post-hoc correction for multiple pairwise tests. Overall, the level of significance was set at p < 0.05.
Results
A total of 321 dogs met the inclusion criteria and were included in the study (Table 1). Eighty-eight different pure breeds were represented including: French Bulldog (n = 22), Labrador Retriever (n = 16), Chihuahua (n = 13), Pug (n = 9), Australian Shepherd (n = 8), Border Collie (n = 7), German Shepherd (n = 7), Dachshund (n = 6), Maltese (n = 6), Miniature Spitz (n = 6), Yorkshire Terrier (n = 6), Bernese Mountain Dog (n = 5), Golden Retriever (n = 5), Jack Russel Terrier (n = 5), Beagle (n = 4), Cocker Spaniel (n = 4), Papillon (n = 4), Rhodesian Ridgeback (n = 4). Other pure breeds were represented by less than 3 dogs per breed. Sixty-four dogs were of mixed breed and 7 of unknown breed (breed information not disclosed in patient history). Of the pure breeds 63 were brachycephalic, 145 mesocephalic and 42 dolichocephalic (39, 40). One hundred and ninety-seven dogs were male (61.4%) and 122 (38.0%) were female. Eighty-two (25.6%) were intact male dogs, 115 (35.8%) were castrated males. Thirty-five (10.9%) were intact females and 87 (27.1%) were spayed females. Two dogs were of unknown sex (0.6%). Median age was 71.8 months (range 4.1–194.4 months). Dogs were grouped depending on the age as follows: <1 year (n = 21); ⩾1 to <3 years (n = 41); ⩾3 to <8 years (n = 142); and ⩾8 years (n = 117). BW was recorded for 320 dogs (median 16.7 kg and range 1.4–72 kg) and grouped as follows: ⩽10 kg (n = 104), >10 – ⩽25 kg (n = 109), >25 kg (n = 107). In one dog the BW was unknown.
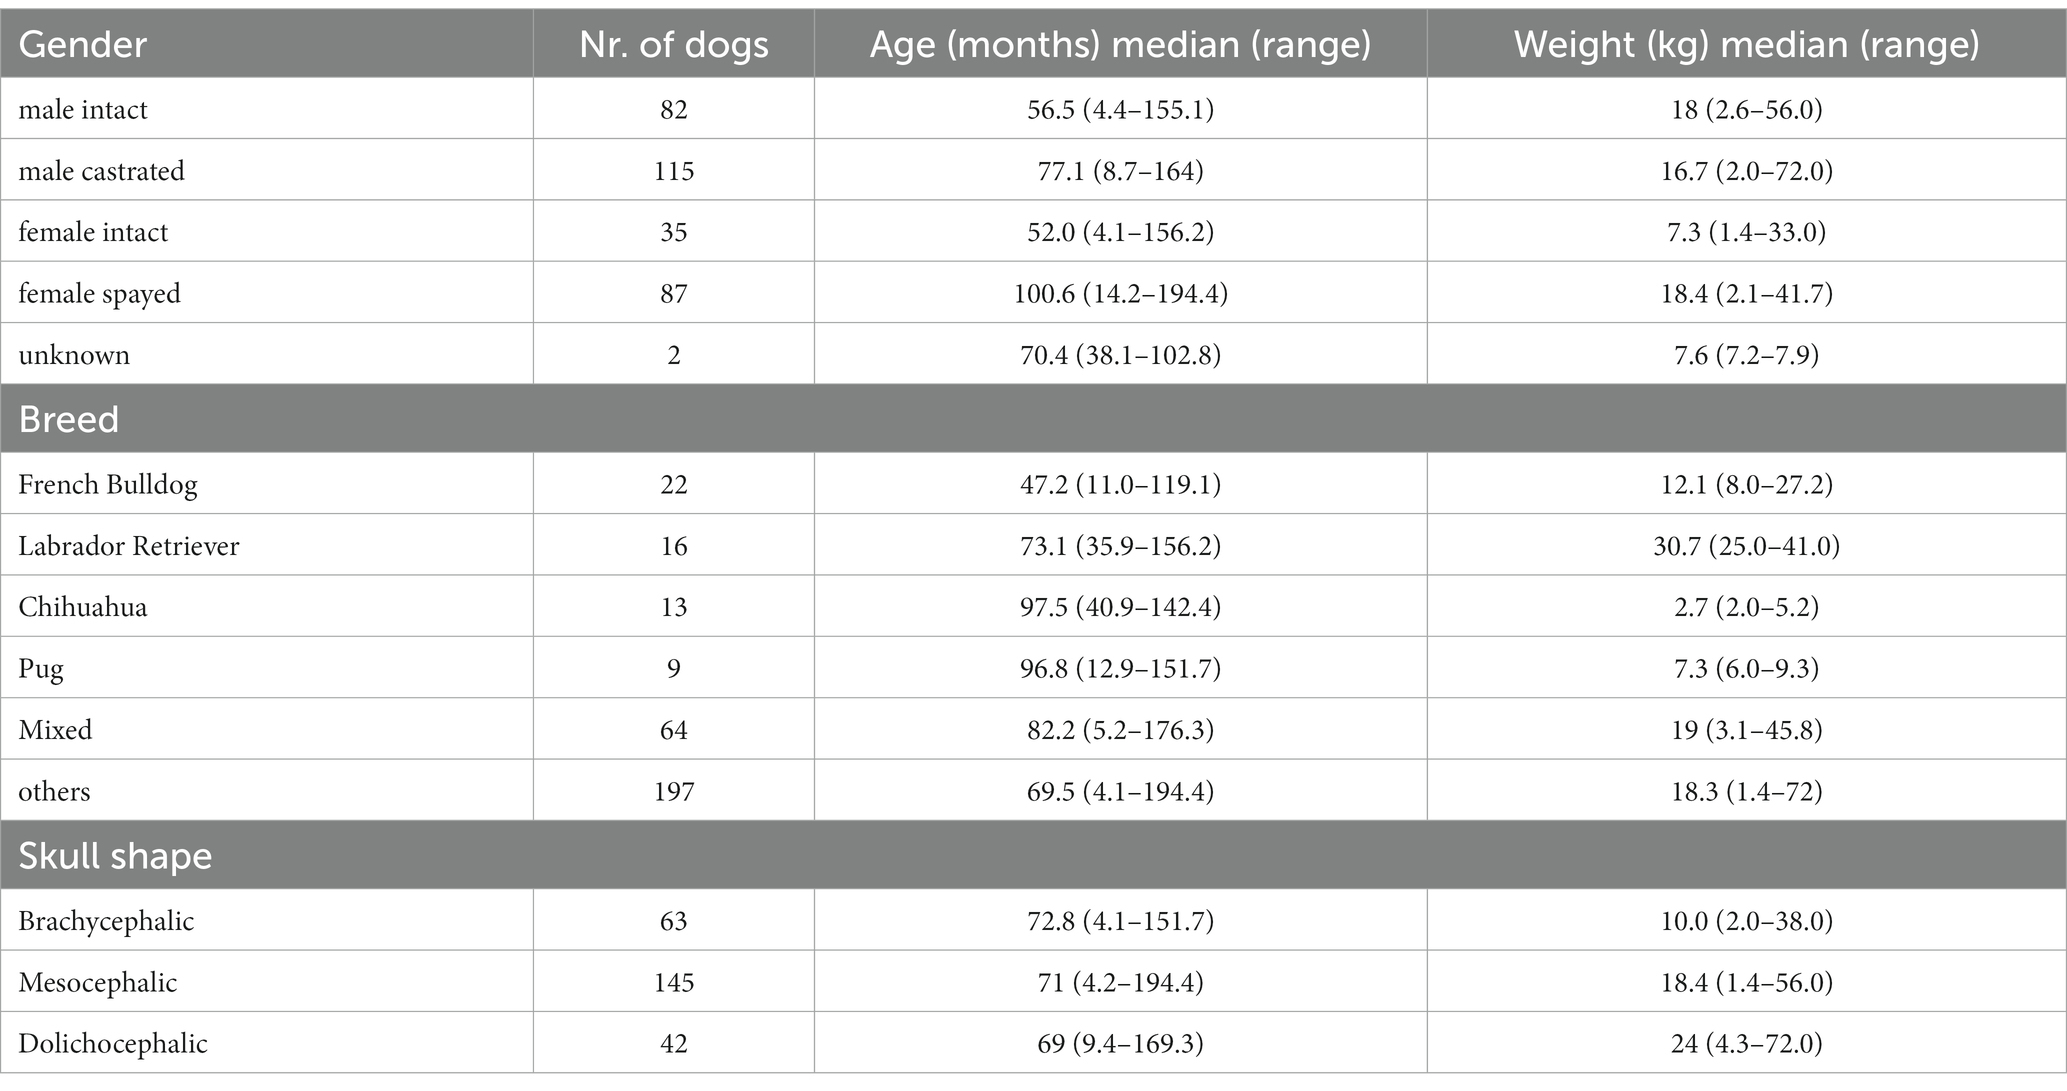
Table 1. Demographic table of dogs included in the study.
The study population included clinical patients and consisted of dogs with neurological signs (n = 247) and with clinical signs other than neurological signs (n = 62). Dogs were presented for MRI examination with neurological signs (n = 247) including seizures (epileptic n = 114, non-epileptic n = 15), cranial nerve dysfunction (n = 25) vestibular dysfunction (peripheral n = 33, indistinguishable n = 6, central n = 1), balance impairment and gait disturbances other than vestibular dysfunction (n = 39), and impaired consciousness (n = 14). Sixty-two dogs underwent MRI examination for reasons other than neurological signs, including behavioral changes (n = 27), ophthalmologic disease (n = 13), head/neck pain (n = 11), ear disease without neurological deficits (n = 6), musculoskeletal disorder (n = 2), endocrine disease (n = 2) and one dog with nasal discharge. In 12 dogs the neurological status remained unclear, and they were excluded for the analysis of comparison between dogs with neurological signs and those presented for non-neurological signs. In 225 dogs, CSF was tapped from atlanto-occipital (n = 224) or lumbar site (n = 1). Body temperature was recorded in 253/321 dogs at the time of induction of general anesthesia (median 38.2°C; range 34.5–39.8°C) and at the end of the MR examination (median 37.0°C; range 33.5–40.5°C). The median examination time was 48 min (range 23–121 min). Typically, the DW sequence was performed in the second half of the examination. A total of 7,921 ROIs were drawn. The ADC values (mean ± SD and median and range) and the ROIs size are reported in Table 2. Artifacts prevented the drawing of one or more ROIs in 11 dogs (for a total of 100 ROIs).
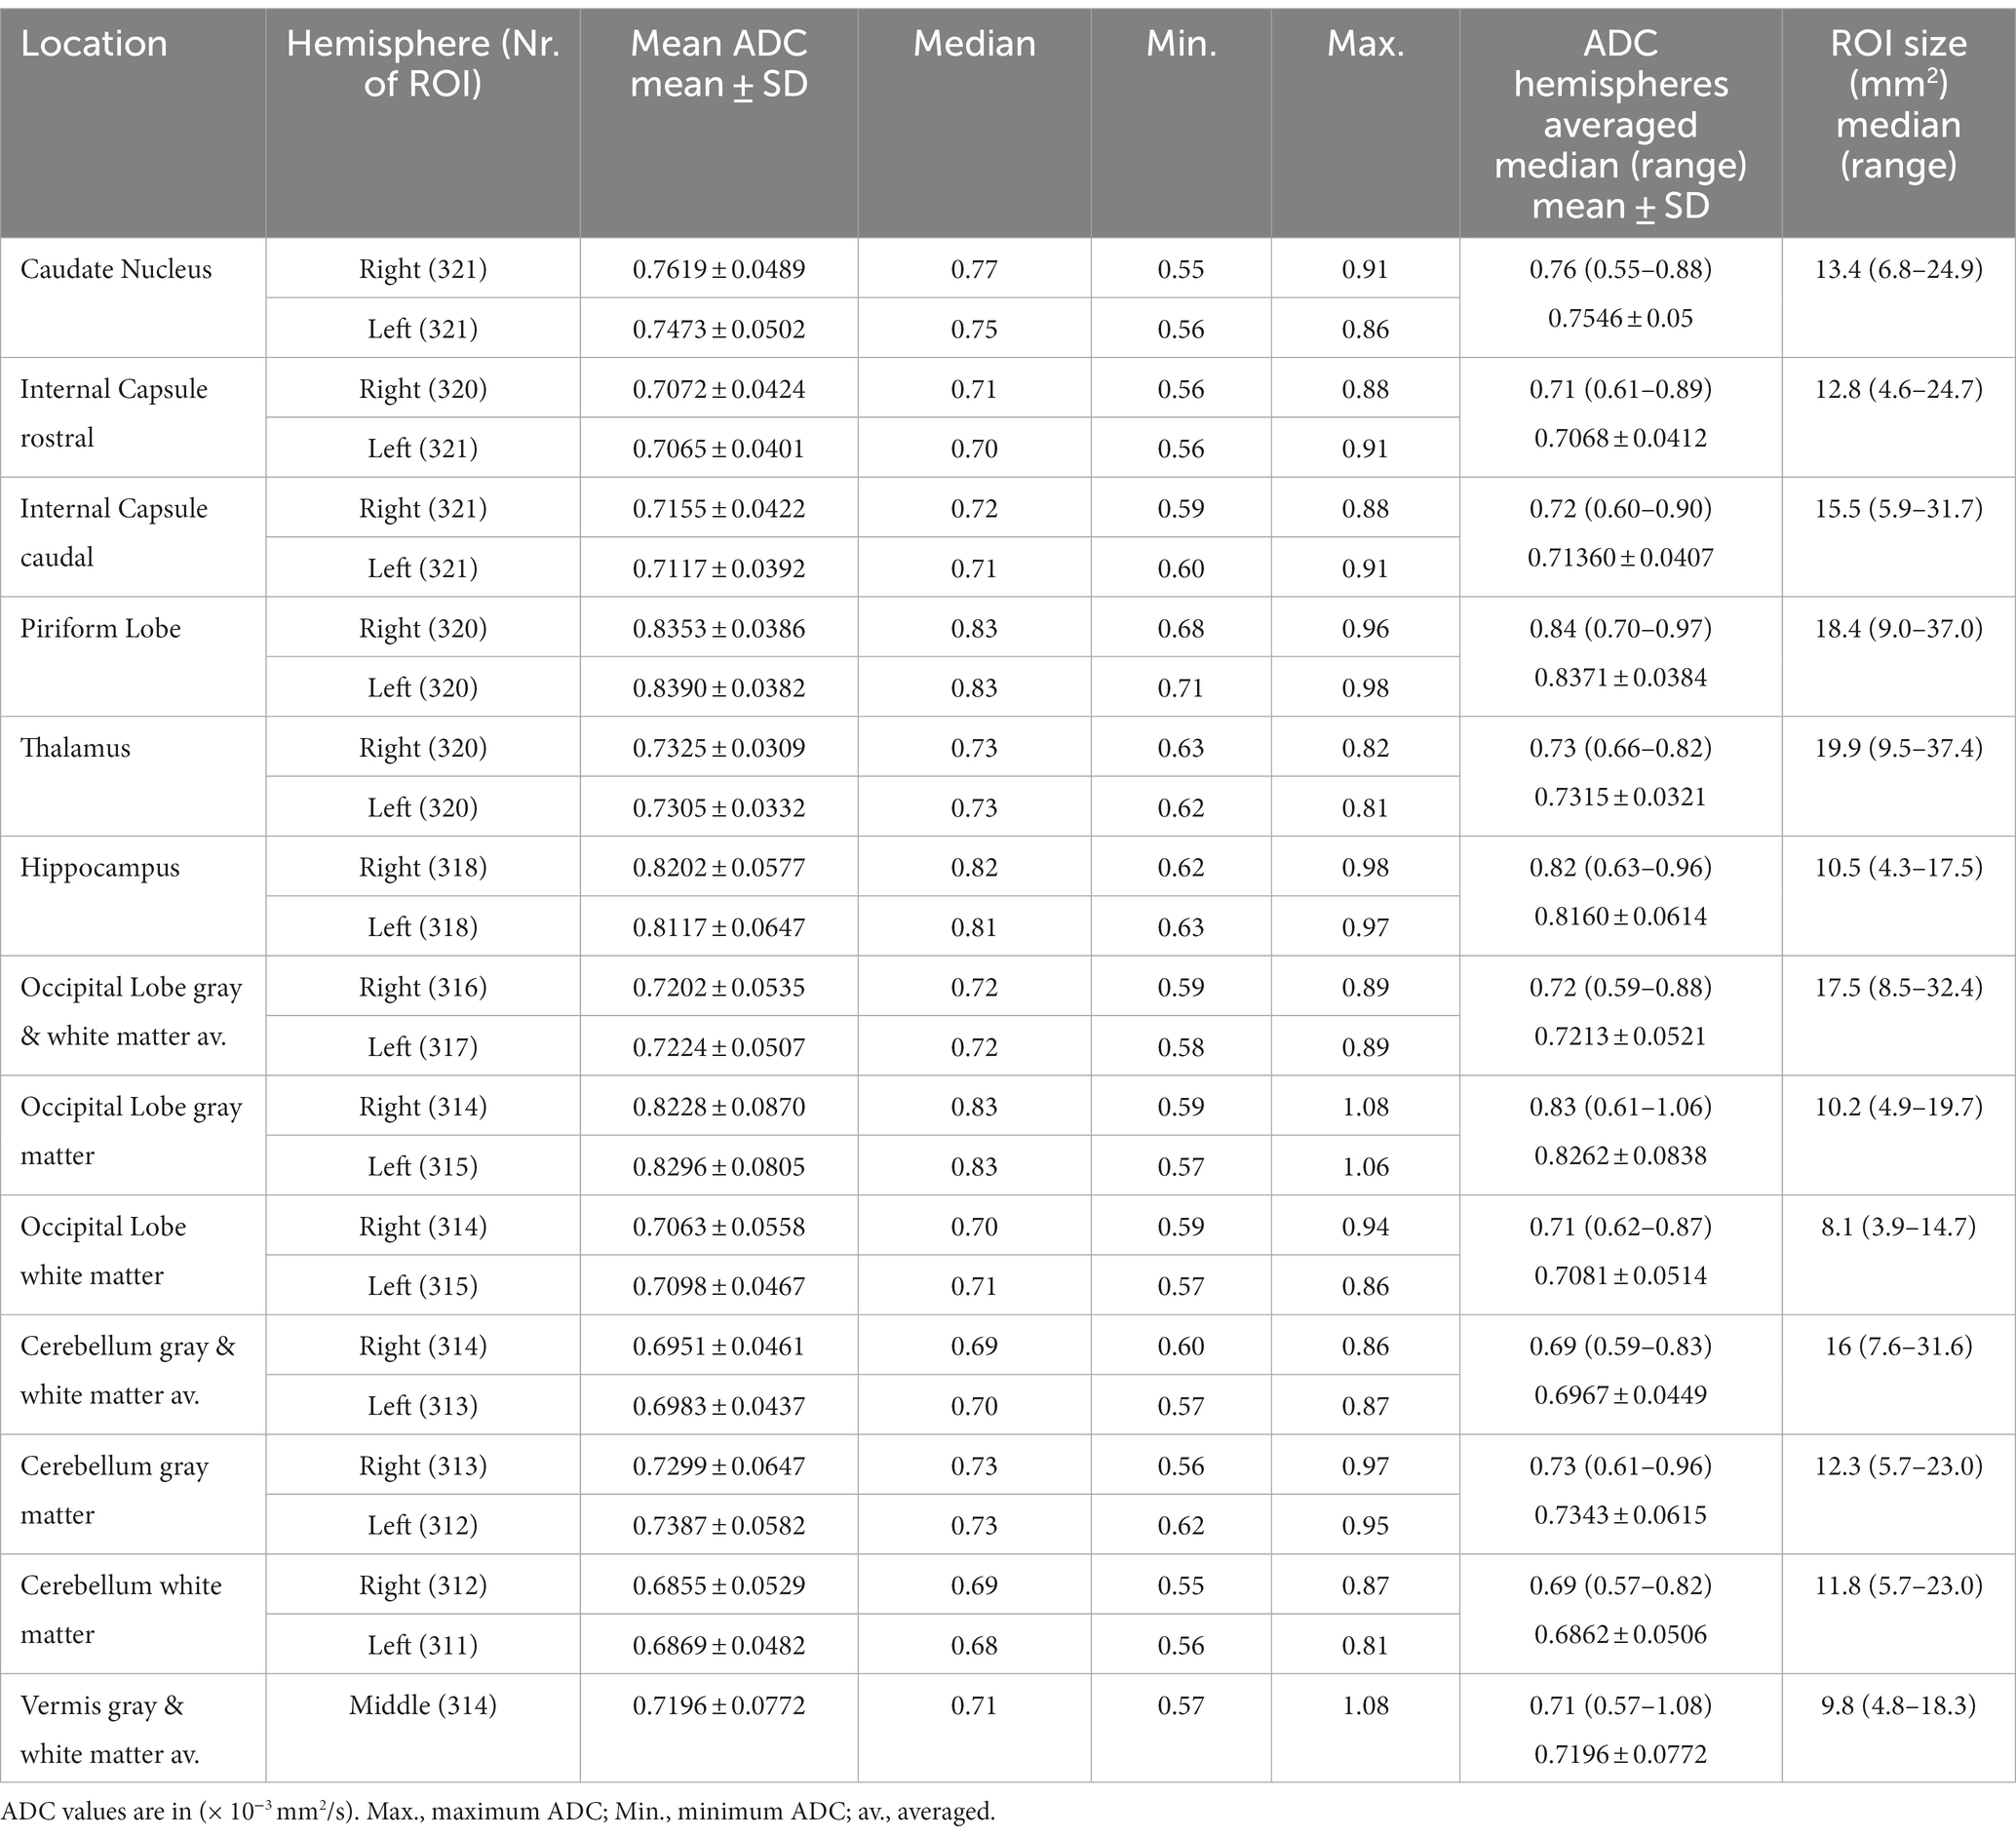
Table 2. Apparent diffusion coefficient (ADC) and the region of interest (ROI) size in 321 dogs of the right and left hemisphere separately and averaged.
The highest ADC values (details in Table 2 and overview in Figure 2) were recorded in the piriform lobe [0.84 (0.70–0.97) × 10−3 mm2/s], followed by the occipital lobe gray matter [0.83 (0.61–1.06) × 10−3 mm2/s] and the hippocampus [0.82 (0.63–0.96) × 10−3 mm2/s]. The lowest ADC value was recorded in the cerebellar white matter region [0.69 (0.57–0.82) × 10−3 mm2/s]. The largest ROI size was drawn in the thalamus [19.9 (9.5–37.4) mm2] and the smallest in the white matter of the occipital lobe [8.1 (3.9–14.7) mm2; Table 2]. For most of the analyzed ROIs, the difference in ADC was statistically significant (Table 3). Significantly higher ADC (p < 0.001) were measured in the gray [0.79 (0.69–0.90) × 10−3 mm2/s] compared to the white matter [0.70 (0.63–0.85) × 10−3 mm2/s]. Statistically significant difference was present between right and left hemisphere in 5 ROIs (p < 0.001–p = 0.047): the caudate nucleus [left 0.75 (0.56–0.86) × 10−3 mm2/s, right 0.77 (0.55–0.91) × 10−3 mm2/s], internal capsule caudal [left 0.71 (0.60–0.91) × 10−3 mm2/s, right 0.72 (0.59–0.88) × 10−3 mm2/s], piriform lobe [left 0.83 (0.71–0.98) × 10−3 mm2/s, right 0.83 (0.68–0.96) × 10−3 mm2/s], hippocampus [left 0.81 (0.63–0.97) × 10−3 mm2/s, right 0.82 (0.62–0.98) × 10−3 mm2/s] and cerebellum gray matter [left 0.73 (0.62–0.95) × 10−3 mm2/s, right 0.73 (0.56–0.91) × 10−3 mm2/s]. No hemisphere side had consistently higher ADC values. No statistically significant difference in ADC values between male and female dogs or depending on reproductive status was present.
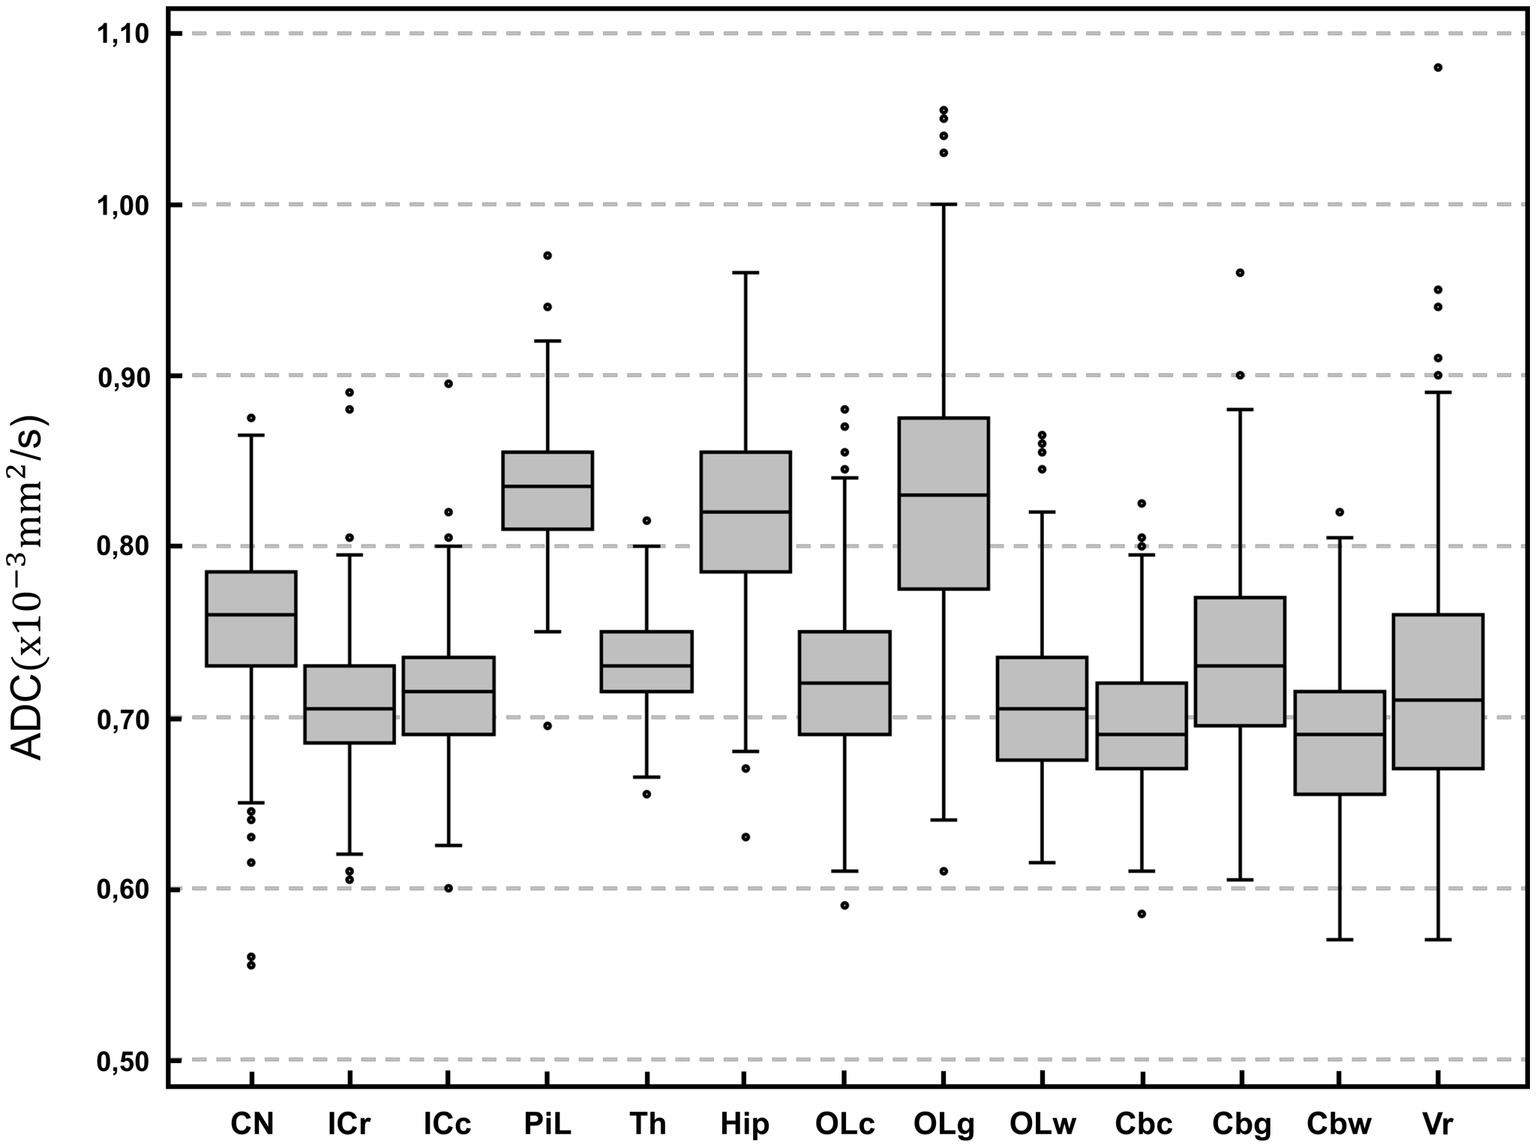
Figure 2. Box-plot comparison of apparent diffusion coefficient (ADC; × 10−3 mm2/s) among anatomical regions of interest. For each plot, the box represents the 25th to 75th percentiles, the horizontal line represents the median. Whiskers indicate the highest value within 1.5-times the interquartile range (IQR) and the lowest value within 1.5-times the IQR. Dots represent the outliers. CN, caudate nucleus; ICr, internal capsule rostral; ICc, internal capsule caudal; PiL, piriform lobe; Th, thalamus; Hip, hippocampus; OLc, Occipital lobe combined; OLg, occipital lobe gray matter; OLw, occipital lobe white matter; Cbc, cerebellum combined; Cbg, Cerebellum gray matter; Cbw, cerebellum white matter; Vr, vermis. Except for vermis, right and left hemisphere values are averaged.
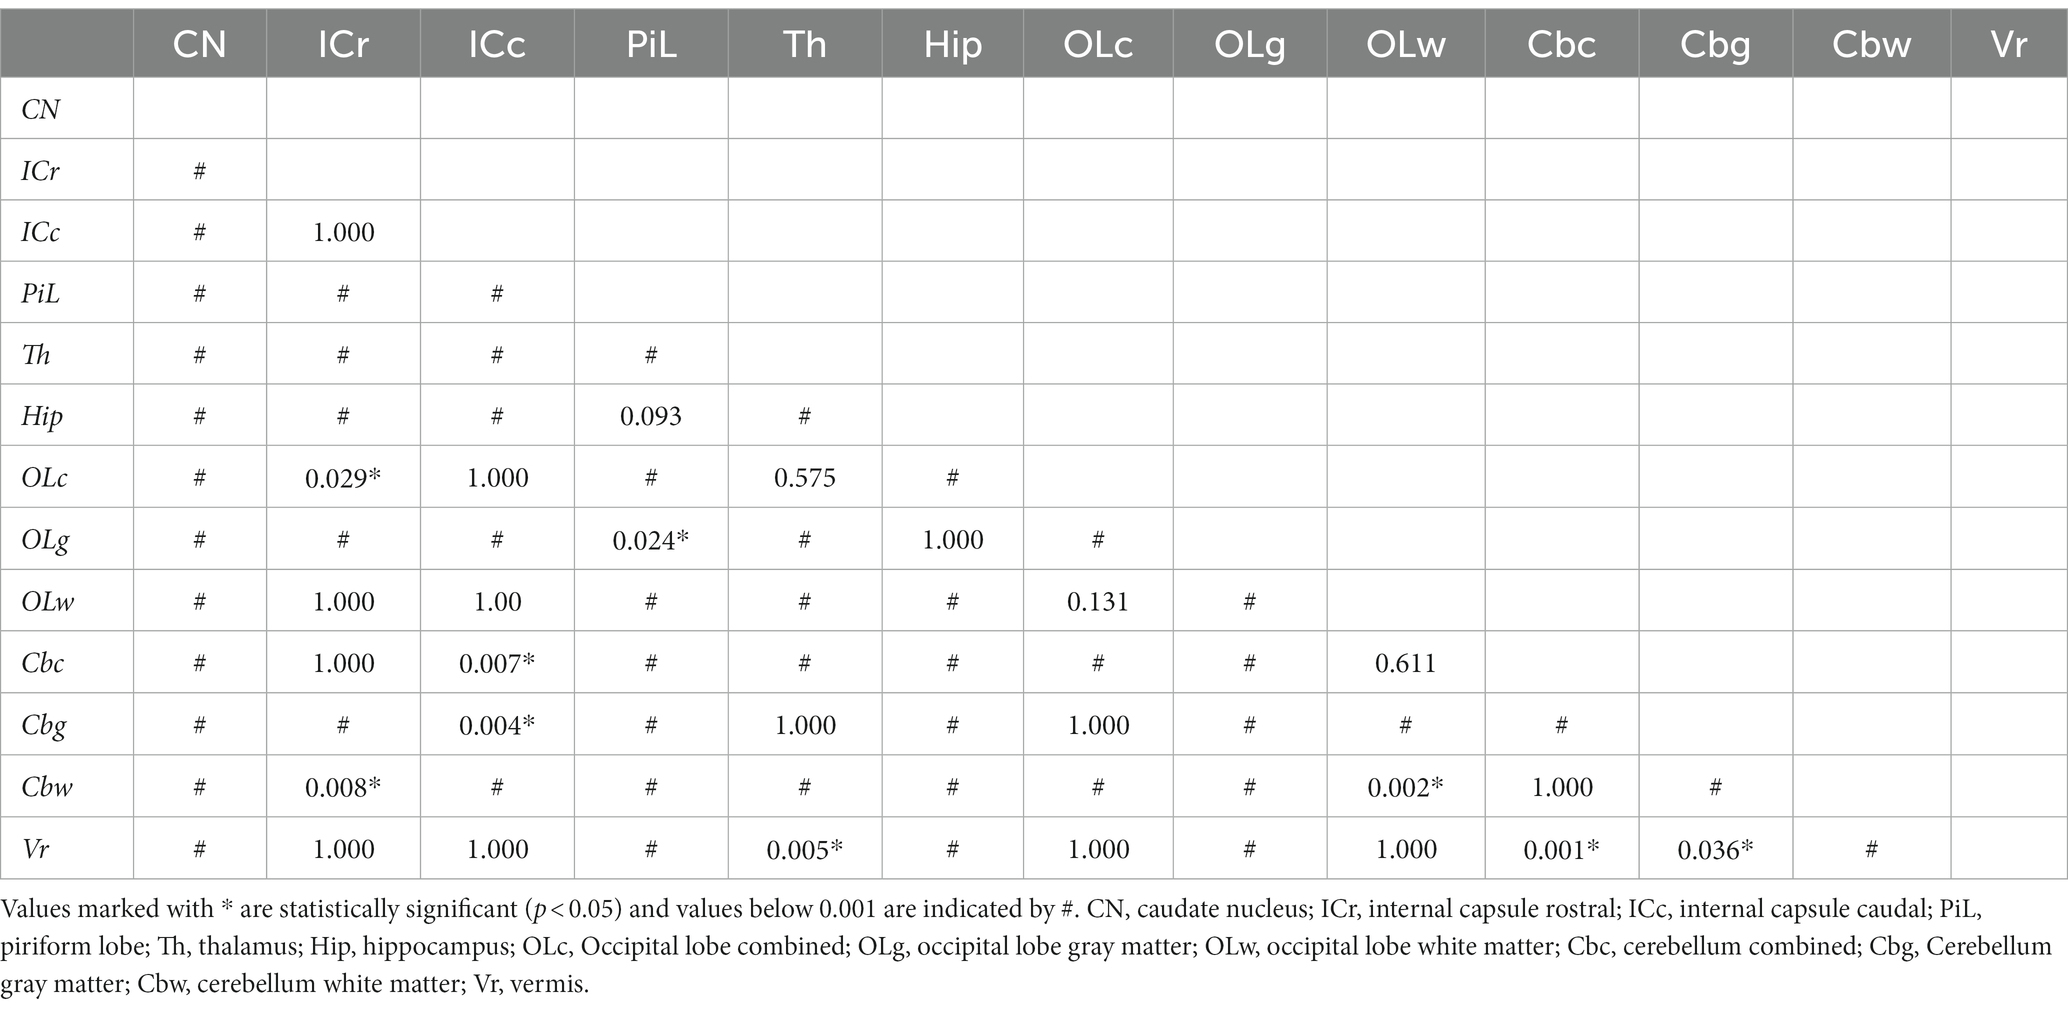
Table 3. Statistical comparison (Friedman test with post-hoc test Bonferroni correction for multiple testing) of ADC values among anatomical regions of interest.
Depending on the BW classes, differences were found in 3 ROIs (occipital lobe combined matter, cerebellum gray matter, cerebellar vermis; p < 0.001–p = 0.011). In 1 ROI (occipital lobe combined matter) the median values were higher within the ⩽10 kg group whereas in 2 ROIs (vermis, cerebellum gray matter) the median values were higher within the >25 kg group. No BW group had consistently higher ADC. Statistically significant differences were mainly but not consistently found between the age class <1 year to the middle-aged class (⩾3 to <8 years) with highest median values within dogs <1 year of age (Figure 3). Overall, median ADC values within gray and white matter decreased from dogs under 1 year of age to middle-aged dogs (⩾3 to <8 years) and increased again in dogs over 8 years of age.
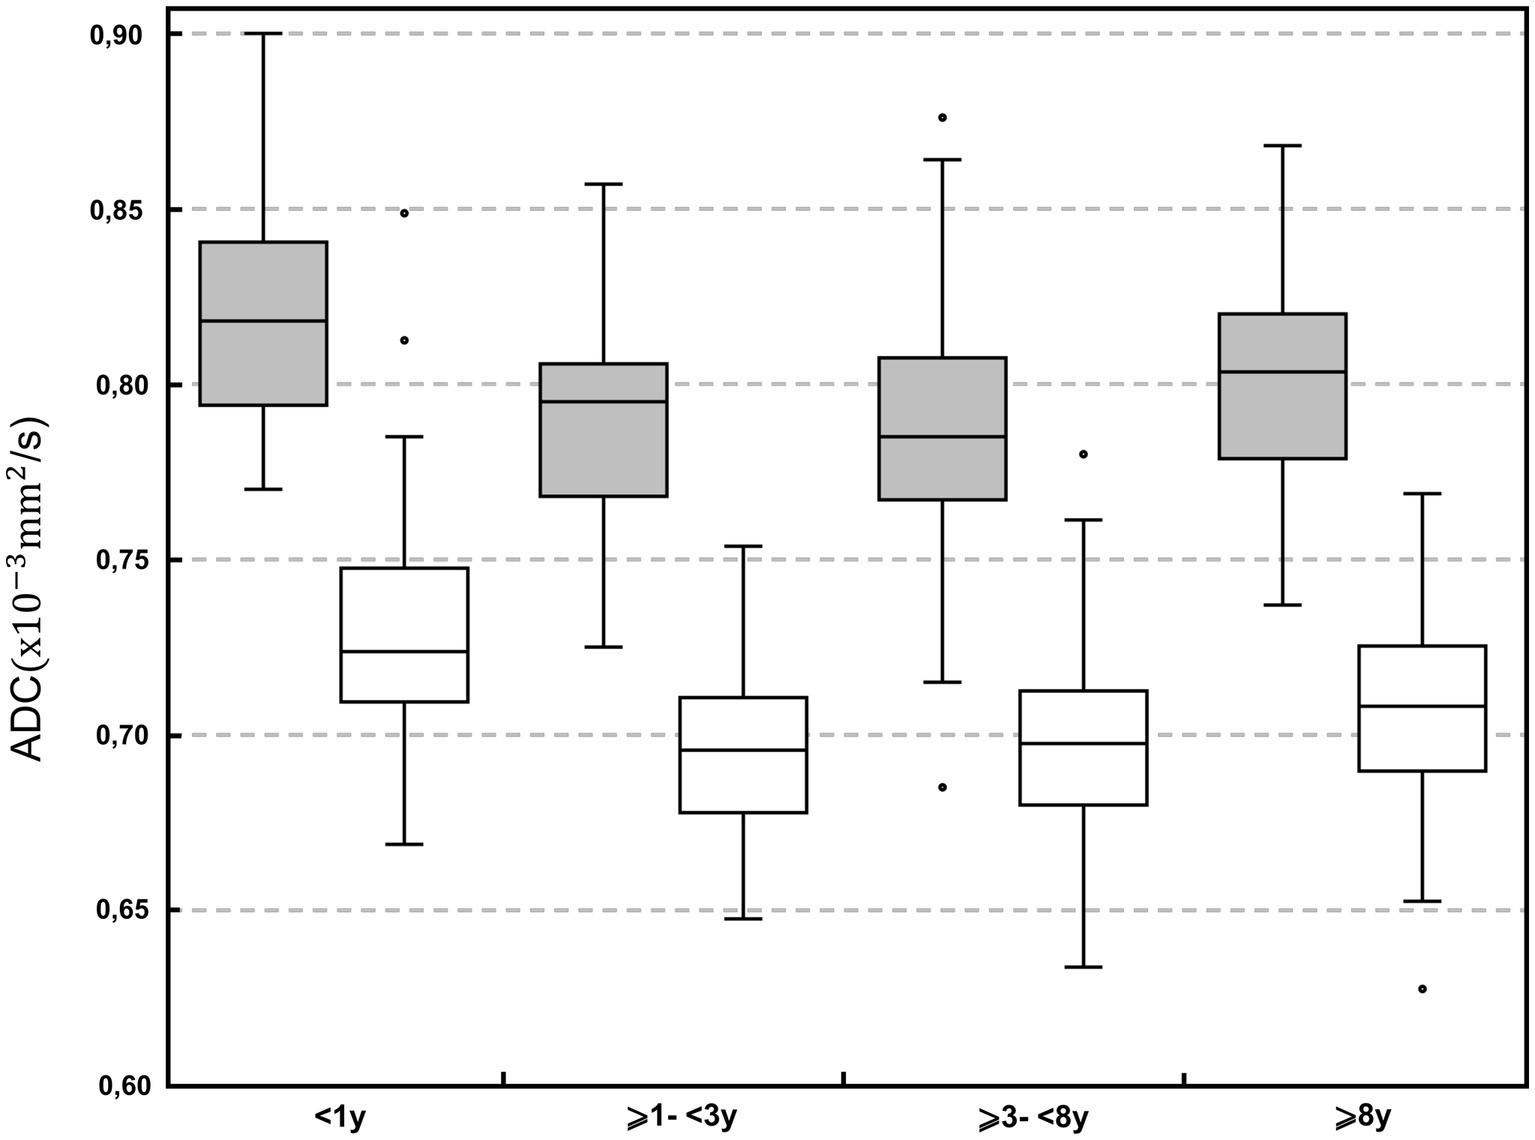
Figure 3. Boxplot of the apparent diffusion coefficient (ADC; × 10−3 mm2/s) in the different age classes: <1; ⩾1 to <3 years; ⩾3 to <8 years; and ⩾8 years. Grey boxes represent gray matter; white boxes represent white matter. For each plot, the box represents the 25th to 75th percentiles, the horizontal line represents the median. Whiskers represent the highest value within 1.5-times the interquartile range (IQR) and the lowest value within 1.5-times the IQR. Dots represent the outliers.
Statistically significant differences were found in the internal capsule (rostral and caudal) in dogs presented with neurological signs compared to dogs presented with non-neurological signs. In both ROIs the ADC values were higher in the group with neurological signs. No difference was found between ADC drawn by consensus and values from the single observer.
Discussion
The study describes the regional ADC values in morphologically normal brains in a large population of canine patients in clinical settings. The highest ADC values were measured in the piriform lobe followed by the occipital lobe and the hippocampus. Other studies report the highest ADC values in the hippocampus followed by the piriform lobe (4); in the cortex of the frontal and parietal lobes followed by the occipital lobe and hippocampus (5). The lowest ADC value was found in the cerebellar white matter, similar to findings in cats (3). As shown in Table 4, ADC values of the present study were substantially similar as reported (5), except for the gray matter of the cerebellum. Higher regional ADC values have also been reported (4). However, different ADC values of different studies should be compared cautiously because they are strongly influenced by differences in equipment and technology used. This includes the system type, the strength of the magnet and the applied scanning protocol. Even using the same coil, variations in ADC values are reported (41). To minimize these variations, the same magnet, coils, and protocol were used in the present study. Similar ADC values were reported with identical magnet strength and b-values (5).
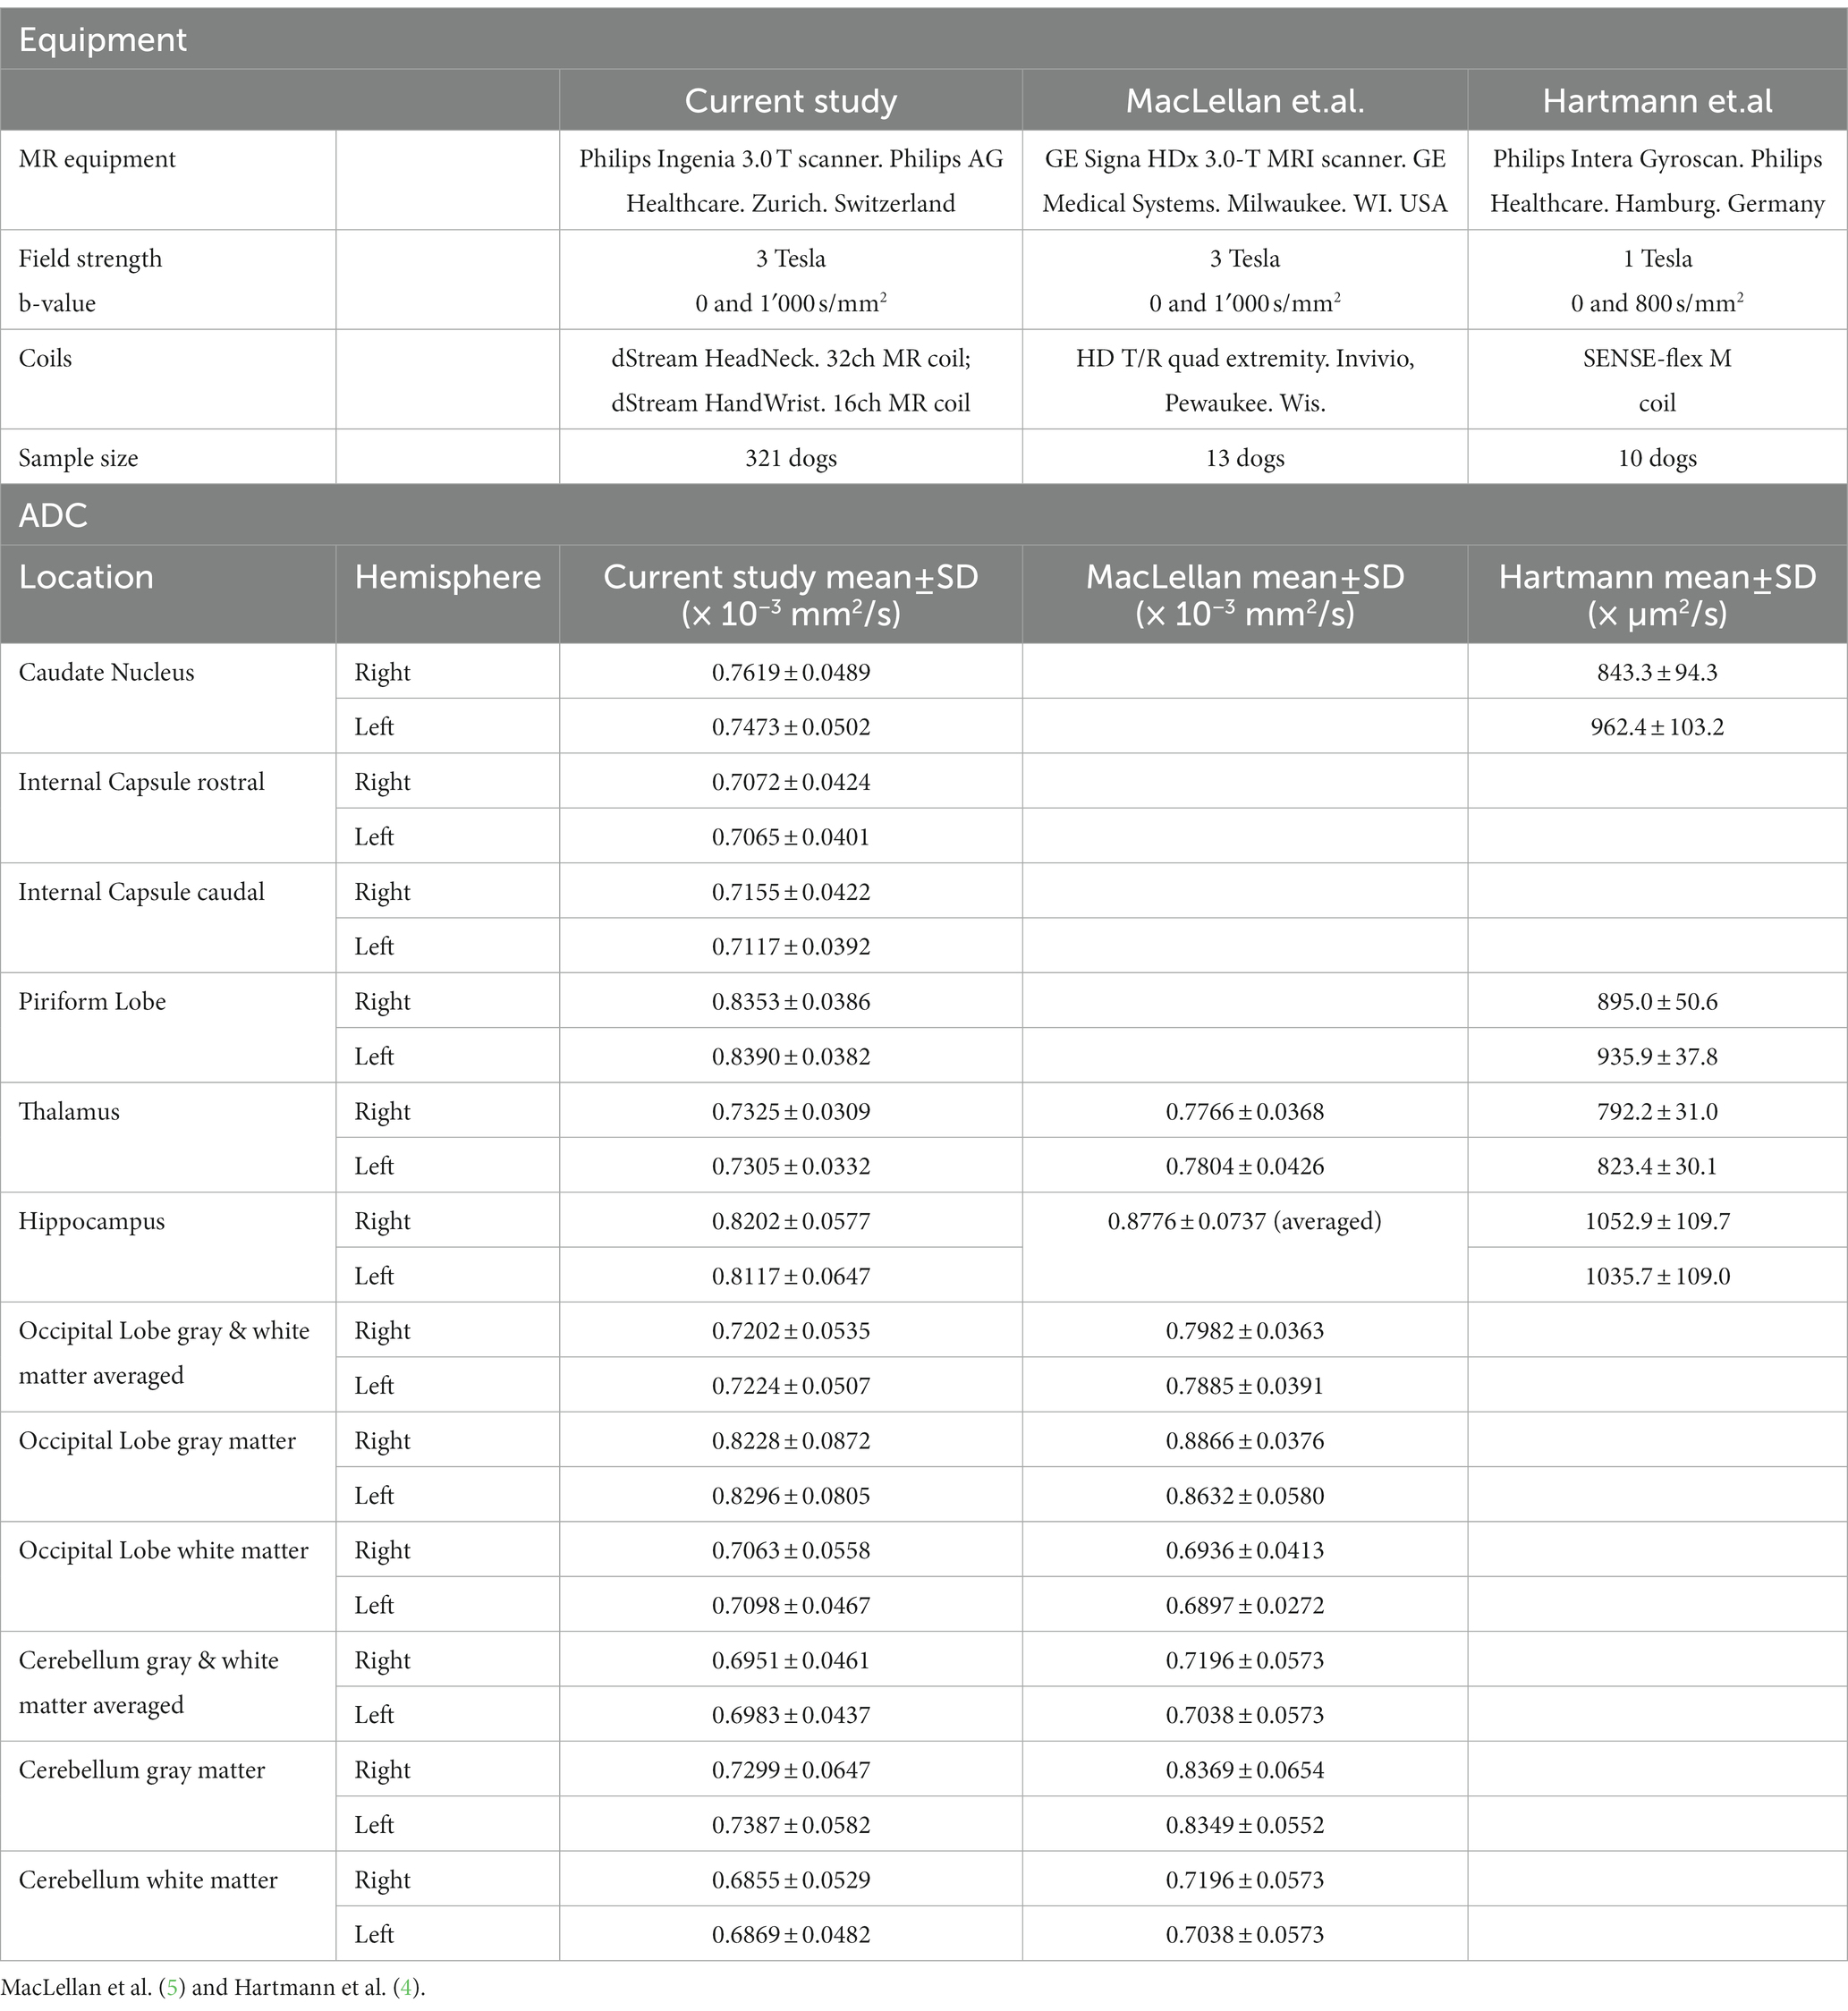
Table 4. Comparison of ADC values between current and previous studies.
Apparent diffusion coefficient values of white matter regions were significantly lower compared to gray matter. This is expected since white matter, contrary to gray matter, mainly consists of myelinated axons, which act as diffusion barriers and lead to lower ADC values (5). Moreover, myelinated axons are responsible for a directional diffusion pattern, parallel to the axonal pathways, called anisotropy (5, 42). This finding is reproducible in dogs and humans (4, 5, 23, 43) and has been recently described also in cats (3).
The median ADC significantly differed in 5 ROIs between right and left cerebral hemisphere. Apparent diffusion coefficient was not consistently higher on one hemisphere side: significantly higher ADC was found in the right caudate nucleus, internal capsule and hippocampus, and in the left piriform lobe and cerebellum gray matter. Statistically higher ADC values in the left cerebral hemisphere have been reported (4), as well as higher, but not significantly different values in the right hemisphere (5) in a smaller number of dogs. Asymmetry in ADC values in several regions has been described in humans, with some correlation to age and gender (44). One of the most accredited explanations is that asymmetry in cerebral structures or neuronal density could influence cell density and therefore diffusivity, causing differences in ADC depending on the side. Higher neuronal density leads to lower diffusion and the right canine brain hemisphere has been reported being heavier than the left (45). Handedness is a discussed explanation for laterality in human brains (46) influencing cell density and therefore diffusivity, causing differences in ADC depending on the side (47). Pawedness in dogs and associated brain asymmetry is also described. However, in studies on dogs that do show pawedness, no overrepresentation of the left or right paw was found (48–50) This could support the lack of consistency for higher ADC values in one side of the hemispheres in our study.
Similarly, to our results, no difference in ADC values depending on the sex has been found in cats (3). Studies in canines and humans showed an effect of age on diffusivity in the brain. In humans ADC values decrease until adulthood and increase during the senescence period. Myelination during adolescence and, inversely, loss of extracellular volume and demyelination during senescence have been discussed as underlying causes. (5, 44, 51, 52) In our study, median ADC values decreased from dogs younger than 1 year of age to middle aged dogs (⩾3 to <8 years) and increased again in the age class of dogs older than 8 years. The changes in myelination would support our results, considering the different life span between humans and dogs, and likely according to different pace of age-relating changes of the brain.
Similarly, as reported (5), no consistent differences between BW groups and median ADC values were found in our study. There is no convincing explanation for the described difference in three ROIs depending on the BW. Two of these ROIs (caudal internal capsule and gray matter of the cerebellum) were among the smaller sized ROIs. It can be speculated that through limited spatial resolution in the ADC maps, further decreasing in smaller animals, ROI placement in smaller dogs may be more inaccurate than in larger animals. In smaller dogs, pixels may represent a larger proportion of the optically resolved patient anatomy and a mismatch between morphological sequences, with higher spatial resolution, might lead to inaccurate ROI placement. Therefore, differences to smaller sized dogs may simply be an inaccuracy effect.
The majority of the dogs were, as expected, presented with neurological signs (n = 247), less than the half of them with epileptic seizures. In dogs diagnosed with idiopathic epilepsy, the ADC values during the interictal phase are described to be higher in the piriform lobe and the semioval center, compared to values of healthy dogs. This fact might be explained by cell loss and an increased intercellular space (35). During ictus the opposite is found, and regional ADC decreases in human patients and canine experimental model of status epilepticus (53, 54). Our data did not confirm this variation in the ADC of the piriform lobe in dogs depending on the clinical signs. No ADC differences were found between dogs presented with neurological signs vs. dogs presented with non-neurological signs in all ROI, except for the internal capsule. In our patient population, dogs presented with neurological sings included highly heterogeneous etiology and the difference in ADC in the internal capsule cannot be clearly interpreted. It can be only speculated if the different ADC could suggest a possible link between neurological signs and region integrity or if this variation could represent a cause or the sequela of the neurological signs. Since a final histological diagnosis was not available in these dogs, caution should be used in the interpretation of these results.
Many other patient related factors can influence the ADC. In rats and mice, ADC is described to correlate positively with body temperature (55, 56). The patient temperature was recorded when available and was maintained in the physiological range. The exact temperature at the time of the acquisition of the DW images was not recorded though, and its influence on the ADC remains unknown. Anesthesia and its effect on neuronal activity can also influence water diffusivity. This phenomenon may cause increased ADC in specific brain regions, reflecting decreased neuronal activity (57). In our study, anesthesia was not standardized, and the anesthetic protocol elected on case-by-case evaluation by the anesthetist in charge. The possible influence of anesthesia was therefore not investigated.
The major limitation of this study is the examined population, consisting of clinical patients. Even though only dogs with morphologically normal MR brain studies were included, non-visible or microstructural pathological processes cannot be ruled out since most of the dogs were presented with neurological signs and obviously, no histopathological examination was possible. Pathologies of different nature beyond the optical resolution of the standard morphological MR images might go undetected (58, 59) but could potentially affect the ADC. Moreover, the analyzed population suffers the selection bias of a clinical population. The age groups are unequal in size, being older dogs presented more often for MRI examination. This disproportionate distribution of age group size could have had an impact on the results.
Another limitation consists in the retrospective nature of the study. Individual case management and the time between MRI examination and presence of clinical signs was neither investigated nor standardized and could influence ADC values in relation to the onset of the clinical signs. Apparent diffusion coefficient values were analyzed in the context of the clinical patient work-up. The influence of technically related factors potentially affecting the ADC, phantom reference values or signal-to-noise ratio in every single examination, as well as influence of non-optically visible artifacts were not investigated. The reported ADC based on the images acquired with described technique does not allow quantification of the anisotropy, particularly marked in the white matter of the brain. ADC ROI placement was largely performed by a single observer and no repetition of measurements was performed. Possible inter-observer variabilities should be therefore considered a limitation.
Conclusion
The present study investigates the ADC in different regions of canine brain with morphologically normal MRI examination. Three-hundred and twenty-one dogs of varying breeds, sex, reproductive status, and age were included in the study. Apparent diffusion coefficient significantly varies among most anatomical brain regions. Apparent diffusion coefficient was significantly lower in the white than in the gray matter. The left and right cerebral hemispheres had similar ADC values in most of the regions, and no differences depending on sex or reproductive status were observed. No consistent correlation between body-weight groups and ADC values was found. Age was correlated first with a decrease and later increase of ADC values, likely consistent with brain maturation and aging. The described data can be reference for future studies in clinical settings on the canine brain.
Data availability statement
The original contributions presented in the study are included in the article/Supplementary material, further inquiries can be directed to the corresponding author.
Ethics statement
A consent form for the use of the dogs’ data for academic purposes was signed by the owners of all dogs included.
Author contributions
Conception and design done by FC and LC. Acquisition of data done by BL. Statistical analysis done by HR. Drafting of the article done by LC. All authors contributed to the article and approved the submitted version.
Acknowledgments
Part of the study was presented at the ECVDI annual meeting (Edinburgh in 2022) as an oral presentation.
Conflict of interest
The authors declare that the research was conducted in the absence of any commercial or financial relationships that could be construed as a potential conflict of interest.
Publisher’s note
All claims expressed in this article are solely those of the authors and do not necessarily represent those of their affiliated organizations, or those of the publisher, the editors and the reviewers. Any product that may be evaluated in this article, or claim that may be made by its manufacturer, is not guaranteed or endorsed by the publisher.
Supplementary material
The Supplementary material for this article can be found online at: https://www.frontiersin.org/articles/10.3389/fvets.2023.1219943/full#supplementary-material
References
1. Feynman, R. The Brownian movement In: R Feynman, R Leighton, and M Sands, editors. The Feynman lectures on physics. Boston, MA: Addison-Wesley (1963). 41.
2. Guo, A, Cummings, T, Dash, R, and Provenzale, J. Lymphomas and high-grade astrocytomas: comparison of water diffusibility and histologic characteristics. Radiology. (2002) 224:177–83. doi: 10.1148/radiol.2241010637
3. Lindt, B, Richter, H, and Del Chicca, F. Investigated regional apparent diffusion coefficient values of the morphologically normal feline brain. J Feline Med Surg. (2022) 24:e214–22. doi: 10.1177/1098612X221101535
4. Hartmann, A, Söffler, C, Failing, K, Schaubmar, A, Kramer, M, and Schmidt, M. Diffusion-weighted magnetic resonance imaging of the normal canine brain. Vet Radiol Ultrasound. (2014) 55:592–8. doi: 10.1111/vru.12170
5. McLellan, M, Ober, C, Feeney, D, and Jessen, C. Diffusion-weighted magnetic resonance imaging of the brain of neurologically normal dogs. Am J Vet Res. (2017) 78:601–8. doi: 10.2460/ajvr.78.5.601
6. Le Bihan, D, and Breton, E. MR imaging of Intravoxel incoherent motions: application to diffusion and perfusion in neurologic disorders. RSNA. (1986) 161:401–7. doi: 10.1148/radiology.161.2.3763909
7. Olivot, J, and Marks, M. Magnetic resonance imaging in the evaluation of acute stroke. Top Magn Reson Imaging. (2008) 19:225–30. doi: 10.1097/RMR.0b013e3181aaf37c
8. Fiebach, J, Schellinger, P, Jansen, O, Meyer, M, Wilde, P, Bender, J, et al. CT and diffusion-weighted MR imaging in randomized order: diffusion-weighted imaging results in higher accuracy and lower interrater variability in the diagnosis of hyperacute ischemic stroke. Stroke. (2002) 33:2206–10. doi: 10.1161/01.STR.0000026864.20339.CB
9. Kucinski, T, Väterlein, O, Glauche, V, Fiehler, J, Klotz, E, Eckert, B, et al. Correlation of apparent diffusion coefficient and computed tomography density in acute ischemic stroke. Stroke. (2002) 33:1786–91. doi: 10.1161/01.STR.0000019125.80118.99
10. Mullins, M, Schaefer, P, Sorensen, A, Halpern, E, Ay, H, He, J, et al. CT and conventional and diffusion-weighted MR imaging in acute stroke: study in 691 patients at presentation to the emergency department. Radiology. (2002) 224:353–60. doi: 10.1148/radiol.2242010873
11. Liu, A, Maldjian, J, Bagley, L, Sinson, G, and Grossman, R. Traumatic brain injury: diffusion-weighted MR imaging findings. AJNR Am J Neuroradiol. (1999) 20:1636–41.
12. Dmytriw, A, Sawlani, V, and Shankar, J. Diffusion-weighted imaging of the brain: beyond stroke. Can Assoc Radiol J. (2017) 68:131–46. doi: 10.1016/j.carj.2016.10.001
13. Provenzale, J, Mukundan, S, and Barboriak, D. Diffusion-weighted and perfusion MR imaging for brain tumor characterization and assessment of treatment response. Radiology. (2006) 239:632–49. doi: 10.1148/radiol.2393042031
14. Barboriak, DP. Imaging of brain tumors with diffusion-weighted and diffusion tensor MR imaging. Magn Reson Imaging Clin N Am. (2003) 11:379–401. doi: 10.1016/S1064-9689(03)00065-5
15. Guzman, R, Altrichter, S, El-Koussy, M, Gralla, J, Weis, J, Barth, A, et al. Contribution of the apparent diffusion coefficient in perilesional edema for the assessment of brain tumors. J Neuroradiol. (2008) 35:224–9. doi: 10.1016/j.neurad.2008.02.003
16. Perrone, A, Guerrisi, P, Izzo, L, D’Angeli, I, Sassi, S, Mele, L, et al. Diffusion-weighted MRI in cervical lymph nodes: differentiation between benign and malignant lesions. Eur J Radiol. (2011) 77:281–6. doi: 10.1016/j.ejrad.2009.07.039
17. Diehl, B, Najm, I, Ruggieri, P, Tkach, J, Mohamed, A, Morris, H, et al. Postictal diffusion-weighted imaging for the localization of focal epileptic areas in temporal lobe epilepsy. Epilepsia. (2001) 42:21–8. doi: 10.1046/j.1528-1157.2001.19500.x
18. Engel, J, McDermott, M, Wiebe, S, Langfitt, J, Stern, J, Dewar, S, et al. Early surgical therapy for drug-resistant temporal lobe epilepsy: a randomized trial. JAMA. (2012) 307:922–30. doi: 10.1001/jama.2012.220
19. Nusbaum, A, Tang, C, Buchsbaum, M, Wei, C, and Atlas, S. Regional and global changes in cerebral diffusion with Normal aging. Am J Neuroradiol. (2001) 22:136–42.
20. Engelter, S, Provenzale, J, Petrella, J, DeLong, D, and MacFall, J. The effect of aging on the apparent diffusion coefficient of Normal-appearing white matter. Am J Roentgenol. (2000) 175:425–30. doi: 10.2214/ajr.175.2.1750425
21. Sotardi, S, Gollub, R, Bates, S, Weiss, R, Murphy, S, Grant, P, et al. Voxelwise and regional brain apparent diffusion coefficient changes on MRI from birth to 6 years of age. Radiology. (2021) 298:415–24. doi: 10.1148/RADIOL.2020202279
22. Neil, J, Miller, J, Mukherjee, P, and Hüppi, P. Diffusion tensor imaging of normal and injured developing human brain - a technical review. NMR Biomed. (2002) 15:543–52. doi: 10.1002/nbm.784
23. Helenius, J, Soinne, L, Perkiö, J, Salonen, O, Kangasmäki, A, Kaste, M, et al. Diffusion-weighted MR imaging in Normal human brains in various age groups. AJNR. (2002) 23:194–9.
24. Ahlhelm, F, Hagen, T, Schneider, G, Dorenbeck, U, Nabhan, A, and Reith, W. ADC mapping of normal human brain. Med Sci Monit. (2004) 10:MT121–5.
25. Garosi, L, McConnell, J, Platt, S, Barone, G, Baron, J, Lahunta, A, et al. Clinical and topographic magnetic resonance characteristics of suspected brain infarction in 40 dogs. J Vet Intern Med. (2006) 20:311–21. doi: 10.1111/j.1939-1676.2006.tb02862.x
26. McConnell, J, Garosi, L, and Platt, S. Magnetic resonance imaging findings of presumed cerebellar cerebrovascular accident in twelve dogs. Vet Radiol Ultrasound. (2005) 46:1–10. doi: 10.1111/j.1740-8261.2005.00001.x
27. Moseley, M, Kucharczyk, J, Mintorovitch, J, Cohen, Y, Kurhanewicz, J, Derugin, N, et al. Diffusion-weighted MR imaging of acute stroke: correlation with T2-weighted and magnetic susceptibility-enhanced MR imaging in cats. AJNR. (1990) 11:423–9.
28. Liu, K, Li, F, Tatlisumak, T, Garcia, J, Sotak, C, Fisher, M, et al. Regional variations in the apparent diffusion coefficient and the intracellular distribution of water in rat brain during acute focal ischemia. Stroke. (2001) 32:1897–905. doi: 10.1161/01.str.32.8.1897
29. Kuroiwa, T, Nagaoka, T, Ueki, M, Yamada, I, Miyasaka, N, Akimoto, H, et al. Correlations between the apparent diffusion coefficient, water content, and ultrastructure after induction of vasogenic brain edema in cats. J Neurosurg. (1999) 90:499–503. doi: 10.3171/jns.1999.90.3.0499
30. McLellan, M, Ober, C, Feeney, D, and Jessen, C. Evaluation of diffusion-weighted magnetic resonance imaging at 3.0 tesla for differentiation between intracranial neoplastic and noninfectious inflammatory lesions in dogs. JAVMA. (2019) 255:71–7. doi: 10.2460/javma.255.1.71
31. Wada, M, Hasegawa, D, Hamamoto, Y, Yu, Y, Asada, R, Fujiwara-Igarashi, A, et al. Comparison of canine and feline Meningiomas using the apparent diffusion coefficient and fractional anisotropy. Front Vet Sci. (2021) 7:614026. doi: 10.3389/fvets.2020.614026
32. Fages, J, Oura, T, Sutherland-Smith, J, and Jennings, S. Atypical and malignant canine intracranial meningiomas may have lower apparent diffusion coefficient values than benign tumors. Vet Radiol Ultrasound. (2020) 61:40–7. doi: 10.1111/vru.12814
33. Scherf, G, Sutherland-Smith, J, and Uriarte, A. Dogs and cats with presumed or confirmed intracranial abscessation have low apparent diffusion coefficient values. Vet Radiol Ultrasound. (2022) 63:197–200. doi: 10.1111/vru.13064
34. Carloni, A, Bernardini, M, Mattei, C, De Magistris, A, Llabres-Diaz, F, Williams, J, et al. Can MRI differentiate between ring-enhancing gliomas and intra-axial abscesses? Vet Radiol Ultrasound. (2022) 63:563–72. doi: 10.1111/vru.13098
35. Hartmann, A, Sager, S, Failing, K, Sparenberg, M, and Schmidt, M. Diffusion-weighted imaging of the brains of dogs with idiopathic epilepsy. BMC Vet Res. (2017) 13:338. doi: 10.1186/s12917-017-1268-0
36. Sutherland-Smith, J, King, R, Faissler, D, Ruthazer, R, and Sato, A. Magnetic resonance imaging apparent diffusion coefficients for histologically confirmed intracranial lesions in dogs. Vet Radiol Ultrasound. (2011) 52:142–8. doi: 10.1111/j.1740-8261.2010.01764.x
37. Anaya García, M, Hernández Anaya, J, Marrufo Meléndez, O, Velázquez Ramírez, J, and Palacios, AR. In vivo study of cerebral white matter in the dog using diffusion tensor tractography. Vet Radiol Ultrasound. (2015) 56:188–95. doi: 10.1111/vru.12211
38. Vite, C, Magnitsky, S, Aleman, D, O’Donnell, P, Cullen, K, Ding, W, et al. Apparent diffusion coefficient reveals gray and white matter disease, and T2 mapping detects white matter disease in the brain in feline alpha-mannosidosis. Am J Neuroradiol. (2008) 29:308–13. doi: 10.3174/ajnr.A0791
39. Reich, L, Hartnack, S, Fitzi-Rathgen, J, and Reichler, IM. Life expectancy of mesocephalic, dolichocephalic and brachycephalic dog breeds in Switzerland. Schweiz Arch Tierheilkd. (2023) 165:235–11. doi: 10.17236/sat00390
40. O’Neill, DG, Pegram, C, Crocker, P, Brodbelt, DC, Church, DB, and Packer, RMA. Unravelling the health status of brachycephalic dogs in the UK using multivariable analysis. Sci Rep. (2020) 10:17251. doi: 10.1038/s41598-020-73088-y
41. Sasaki, M, Yamada, K, Watanabe, Y, Matsui, M, Ida, M, Fujiwara, S, et al. Variability in absolute apparent diffusion coefficient values across different platforms may be substantial: a multivendor, multi-institutional comparison study. Radiology. (2008) 249:624–30. doi: 10.1148/radiol.2492071681
42. Sen, P, and Basser, P. A model for diffusion in white matter in the brain. Biophys J. (2005) 89:2927–38. doi: 10.1529/biophysj.105.063016
43. Moraru, L, and Dimitrievici, L. Apparent diffusion coefficient of the normal human brain for various experimental conditions. AIP conference proceedings. American Institute of Physics Inc. (2017).
44. Naganawa, S, Sato, K, Katagiri, T, Mimura, T, and Ishigaki, T. Regional ADC values of the normal brain: differences due to age, gender, and laterality. Eur Radiol. (2003) 13:6–11. doi: 10.1007/s00330-002-1549-1
45. Tan, Ü, and Caliskan, S. Allometry and asymmetry in the dog brain: the right hemisphere is heavier regarless of paw preference. Int J Neurosci. (1987) 35:189–94. doi: 10.3109/00207458708987127
46. Good, C, Johnsrude, I, Ashburner, J, Henson, R, Friston, K, and Frackowiak, R. Cerebral asymmetry and the effects of sex and handedness on brain structure: a voxel-based morphometric analysis of 465 normal adult human brains. Neuroimage. (2001) 14:685–700. doi: 10.1006/nimg.2001.0857
47. Powell, J, Parkes, L, Kemp, G, Sluming, V, Barrick, T, and García-Fiñana, M. The effect of sex and handedness on white matter anisotropy: a diffusion tensor magnetic resonance imaging study. Neuroscience. (2012) 207:227–42. doi: 10.1016/j.neuroscience.2012.01.016
48. Aydinlioǧlu, A, Arslan, K, Cengiz, N, Raǧbetli, M, and Erdoǧan, E. The relationships of dog hippocampus to sex and paw preference. Int J Neurosci. (2006) 116:77–88. doi: 10.1080/00207450690962433
49. Aydinlioǧlu, A, Arslan, K, Erdogan, A, Ragbetli, M, Keleh, P, and Diyarbakırlı, S. The relationship of Callosal anatomy to paw preference in dogs. Eur J Morphol. (2000) 38:128–33. doi: 10.1076/0924-3860(200004)38:2;1-F;FT128
50. Hackert, R, Maes, L, Herbin, M, Libourel, P, and Abourachid, A. Limb preference in the gallop of dogs and the half-bound of pikas on flat ground. Laterality. (2008) 13:310–9. doi: 10.1080/13576500801948692
51. Watanabe, M, Sakai, O, Ozonoff, A, Kussman, S, and Jara, H. Age-related apparent diffusion coefficient changes in the normal brain. Radiology. (2013) 266:575–82. doi: 10.1148/radiol.12112420
52. Gross, B, Garcia-Tapia, D, Riedesel, E, Ellinwood, N, and Jens, J. Normal canine brain maturation at magnetic resonance imaging. Vet Radiol Ultrasound. (2010) 51:361–73. doi: 10.1111/j.1740-8261.2010.01681.x
53. Chatzikonstantinou, A, Gass, A, Förster, A, Hennerici, M, and Szabo, K. Features of acute DWI abnormalities related to status epilepticus. Epilepsy Res. (2011) 97:45–51. doi: 10.1016/j.eplepsyres.2011.07.002
54. Hasegawa, D, Orima, H, Fujita, M, Nakamura, S, Takahashi, K, Ohkubo, S, et al. Diffusion-weighted imaging in kainic acid-induced complex partial status epilepticus in dogs. Brain Res. (2003) 983:115–27. doi: 10.1016/S0006-8993(03)03041-5
55. Hasegawa, Y, Latour, L, Sotak, H, Dardzinski, B, and Fisher, M. Temperature dependent change of apparent diffusion coefficient of water in Normal and ischemic brain of rats. J Cereb Blood Flow Metab. (1994) 14:383–90. doi: 10.1038/jcbfm.1994.49
56. Bertalan, G, Boehm-Sturm, P, Schreyer, S, Morr, A, Steiner, B, Tzschätzsch, H, et al. The influence of body temperature on tissue stiffness, blood perfusion, and water diffusion in the mouse brain. Acta Biomater. (2019) 96:412–20. doi: 10.1016/j.actbio.2019.06.034
57. Abe, Y, Tsurugizawa, T, and Le Bihan, D. Water diffusion closely reveals neural activity status in rat brain loci affected by anesthesia. PLoS Biol. (2017) 15:e2001494. doi: 10.1371/journal.pbio.2001494
58. Smith, E, Schneider, J, Wardlaw, J, and Greenberg, S. Cerebral microinfarcts: the invisible lesions. Lancet Neurol. (2012) 11:272–82. doi: 10.1016/S1474-4422(11)70307-6
Keywords: magnetic resonance imaging, canine, MRI, apparent diffusion coefficient, ADC, DWI, neuroimaging
Citation: Carisch L, Lindt B, Richter H and Del Chicca F (2023) Regional ADC values of the morphologically normal canine brain. Front. Vet. Sci. 10:1219943. doi: 10.3389/fvets.2023.1219943
Edited by:
Philippa Johnson, Cornell University, United StatesReviewed by:
Erica Andrews, Cornell University, United StatesYoshihiko Yu, Independent researcher, Mitaka, Japan
Copyright © 2023 Carisch, Lindt, Richter and Del Chicca. This is an open-access article distributed under the terms of the Creative Commons Attribution License (CC BY). The use, distribution or reproduction in other forums is permitted, provided the original author(s) and the copyright owner(s) are credited and that the original publication in this journal is cited, in accordance with accepted academic practice. No use, distribution or reproduction is permitted which does not comply with these terms.
*Correspondence: Lea Carisch, bGVhLmNhcmlzY2hAdXpoLmNo