 Yunna Li1,2†
 Hua Yang2†
 Jing Guo1,2Yonglin Yang2Qian Yu2
 Yuanyuan Guo1,2Chaoxin Zhang1,2
 Zhipeng Wang1,2*Peng Zuo2,3*
- 1College of Animal Science and Technology, Northeast Agricultural University, Harbin, China
- 2State Key Laboratory of Sheep Genetic Improvement and Healthy Production, Xinjiang Academy of Agricultural and Reclamation Science, Shihezi, China
- 3College of Science, Northeast Agricultural University, Harbin, China
In sheep, body weight is an economically important trait. This study sought to map genetic loci related to weaning weight and yearling weight. To this end, a single-trait and multi-trait genome-wide association study (GWAS) was performed using a high-density 600 K single nucleotide polymorphism (SNP) chip. The results showed that 43 and 56 SNPs were significantly associated with weaning weight and yearling weight, respectively. A region associated with both weaning and yearling traits (OARX: 6.74–7.04 Mb) was identified, suggesting that the same genes could play a role in regulating both these traits. This region was found to contain three genes (TBL1X, SHROOM2 and GPR143). The most significant SNP was Affx-281066395, located at 6.94 Mb (p = 1.70 × 10⁻¹⁷), corresponding to the SHROOM2 gene. We also identified 93 novel SNPs elated to sheep weight using multi-trait GWAS analysis. A new genomic region (OAR10: 76.04–77.23 Mb) with 22 significant SNPs were discovered. Combining transcriptomic data from multiple tissues and genomic data in sheep, we found the HINT1, ASB11 and GPR143 genes may involve in sheep body weight. So, multi-omic anlaysis is a valuable strategy identifying candidate genes related to body weight.
1. Introduction
GWAS have been widely used in gene mapping research to understand the genetic mechanisms governing economically important traits in sheep, including weight, reproductive fitness, horn number, ear type, hair color, and disease resistance (1–6). The first study to use this approach in sheep focused on horn shape and revealed that the RXFP2 gene is related to horn type in sheep (7).
Body weight is the most important index of growth and development in farmed sheep. Studies have noted heritabilities of 0.30–0.35 for weaning weight and 0.40–0.45 for yearling weight, indicating that the heritability of these traits is moderately (8). Based on GWAS, Gholizadeh et al. (9) who used the Illumina ovine SNP50 BeadChip in 96 Baluchi sheep discovered the candidate genes TRBP and TRAMIL1 for birth weight; APIP and DAAM1 for weaning weight; PHF15, PRSS12, and MAN1A1 for 6-month weight; and SYNE1, WAPAL, and DAAM1 for yearling weight. Al-Mamun et al. (10) used data from 1781 Australian Merino sheep genotyped with the Illumina Ovine SNP 50 K BeadChip and found that the genes LAP3, NCAPG, and LCORL are related to body weight traits in sheep. Similarly, using GWAS, Ghasemi et al. (11) demonstrated that RAB6B and GIGYF2 are candidate genes for birth weight using Illumina Ovine SNP50 Bead Chip from 132 Lori-Bakhtiari sheep, and Lu et al. (1) performed a genome-wide associations of birth, weaning, yearling, and adult weights of 460 fine-wool sheep were determined using resequencing technology. The results showed that 113 single nucleotide polymorphisms (SNPs) reached the genome-wide significance levels for the four body weight traits and 30 genes were annotated effectively, including AADACL3, VGF, NPC1, and SERPINA12.
When traits are highly correlated with each other, multi-trait analysis is more advantageous than single-trait analysis. Because multi-trait GWAS involves only one statistical test and considers both the intra- and inter-trait variance components of multiple traits (12), it can reduce the errors caused by multiple testing (13). Hence, it improves the accuracy (14, 15) and precision of parameter estimation (16). Multi-trait GWAS also increases the statistical power by exploiting the genetic correlation between different traits.
In this study, we used the Affymetrix Ovis600K genotyping bead chip to identify candidate genes related to weaning weight and yearling weight using multi-trait and single-trait GWAS. Our findings provide a reference for understanding the inheritance mechanism of weight traits in sheep.
2. Materials and methods
2.1. Ethics statement
All experimental procedures were in accordance with animal welfare legislation and were approved by the Experimental Animal Care and Use Committee of Xinjiang Academy of Agricultural and Reclamation Sciences (Shihezi, China, Ethics committee approval number: XJNKKXY-2020-34; December 30, 2020).
2.2. Sample collection and genotyping
A total of 218 ewes (a composite line bred from Australian Suffolk sheep, Chinese Hu sheep, and Chinese Kazakh sheep) were collected from the Xinjiang Academy of Agricultural and Reclamation Science. We recorded their weights at two stages: weaning and yearling. All sheep were fasted for 12 h before their weaning weights and first yearling weights were measured.
Single nucleotide polymorphisms (SNPs) were examined using the Affymetrix Ovis600K genotyping bead chip, which contains 604,721 SNPs. Plink 1.9 software (17) was used to control the quality of genotype data; (1) minor allele frequency (MAF) ≥5% SNPs, (2) SNP call rate ≥ 95%, (3) individual call rate ≥ 90%, and (4) SNPs mapped to X chromosomes and autosomes were evaluated. After the quality control was performed on the raw genotypes, a total of 218 animals and 479,470 SNPs were obtained. In this study, Beagle software was used to fill in the missing genotypes. The Haploview software (18) was used to analyze the linkage disequilibrium (LD). The haplotype block recognition algorithm proposed by Gabriel et al. (19), their criterion is that the one-sided upper 95% confidence bound on D′ is >0.98 and the lower bound is >0.70.
2.3. Estimation of genetic parameters of weaning weight and yearling weight
GCTA was developed as a method for estimation the variance explained by all the SNPs on a chromosome or on the whole genome for a complex trait (20). In this study, −-reml and −-reml-bivar were set to calculate heritability and genetic correlation, respectively. Using SAS9.4 (21), descriptive statistics were performed for these two traits, including mean, standard deviations, coefficients of variation.
2.4. Single-trait and multi-trait GWAS
In this study, a mixed linear model was used to analyze the association between SNPs and body weight traits, including weaning weight and yearling weight. The model used was as follows:
where Y is the phenotype value vector, b is the fixed effect vector (year effect), p is the top three eigenvectors of principal component analysis (PCA), s is the SNP effect vector and SNP genotypes coded as 0, 1 and 2 for aa, Aa and AA, a is the individual residual polygene effect (random effect), c is the birth weight vector (covariant), e is the random residual effect vector, and X, K, Z, Q are the design matrices of b, p, s, a, and c, respectively.
Multivariate mixed linear models (mvLMMs) were used to conduct joint association analysis between SNPs and two traits due to strong genetic correlation between weaning weight and yearling weight.
GEMMA software (16) was used to perform single-trait and bi-trait GWAS. The Wald test was used to evaluate the significance of each genetic marker. In order to reduce false positives, the Bonferroni correction method was applied correction, and the threshold value was p = 0.05/479470 = 1.04 × 10⁻⁷ (single-trait) and p = 0.05/479470/2 = 5.70 × 10⁻⁸ (bi-trait).
2.5. Function annotations
In this study, we first downloaded the sheep Ovis aries (Oar_v3.1) gene annotation information1 from the Ensembl database (22), then used the intersect parameter of BEDTools 2.1.2 software to annotatin the significant SNPs and identifying gene within 200 kb upstream and downsteam of these SNPs (23). We collected quantitative trait loci (QTLs) related to sheep weight traits from the animal QTL database.2
2.6. Expression analysis
We collected RNA-Seq data from the European Bioinformatics Institute (EBI) for 17 tissues, including muscle long dorsal, muscle biceps, spleen, lung, pituitary gland, brain, hypothallamus, mammary gland, kidney cortex, kidney medulla, heart, rectum, abomasum, uterus, colon, rumen, ovary tissues of juvenile and adult sheep (BioProject number: PRJEB6169). There are more than 3 samples each tissues of juvenile or adult sheep. After using Trimmomatic to remove adapter and low-quality sequences (24), all RNA-Seq datasets were processed using FastQC v0.11.33 and quality inspection was conducted. Reads were aligned to the sheep reference genome (OARv3.1) using STAR v.2.7.6a (25) and counted with the RNA-Seq by Expectation Maximization (RSEM) software v. 1.3.3 (26). The DESeq2 package in R was used to DEGs with significant differences between different samples (27). The tissue specificity index (τ) of the candidate genes was calculated, which is defined as
where is the expression profile component normalized by the maximal component value and N is the number of tissues (28).
3. Results
3.1. Descriptive statistics and genetic parameters
In this study, the descriptive statistics of weaning weight and yearling weight traits were analyzed including mean, standard deviations, coefficients of variation (Table 1). Based on SNP genotype, we used the GCTA software calculate genetic parameter of weaning and yearling weight traits. We found the heritability of weaning weight and yearling weight was 0.54 and 0.44, respectively. There was a significant positive genetic correlation between weaning weight and yearling weight with a correlation coefficient of 0.73 (p < 0.05).
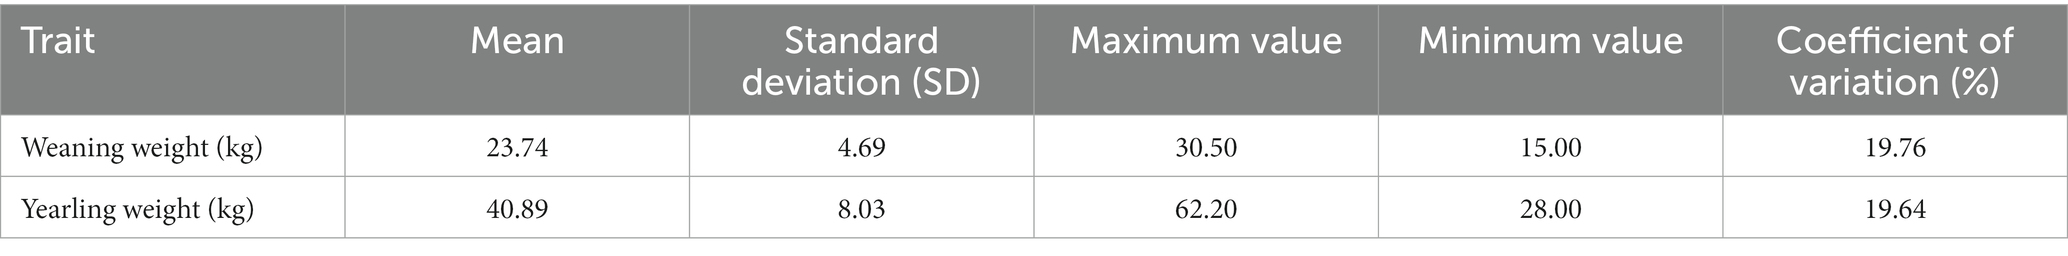
Table 1. Descriptive statistics of body weight.
3.2. Single-trait GWAS
In this study, single-trait GWAS was conducted for weaning weight and yearling weight based on a linear mixed model. We identified 43 and 56 SNPs significantly related to weaning weight and yearling weight (Table 2), respectively. The corresponding Manhattan and quantile-quantile (Q-Q) plots are shown in Figure 1. For weaning weight, significantly SNPs were detected on the chromosomes OAR9, OAR13, OAR17 and OARX. These SNPs were located nearest to the genes including ESRP1 (Epithelial Splicing Regulatory Protein 1), MPP7 (MAGUK P55 Scaffold Protein 7), WDR66 (WD Repeat-containing protein 66), SHROOM2 (Shroom Family Member 2). For yearling weight, significantly SNPs were located on OAR1, OAR9, OAR13, OAR17, OAR20 and OARX. The following genes are annotated FOXD3 (Forkhead box D3), ESRP1, MPP7, WDR66, DOCK11 (Dedicator Of Cytokinesis 11).
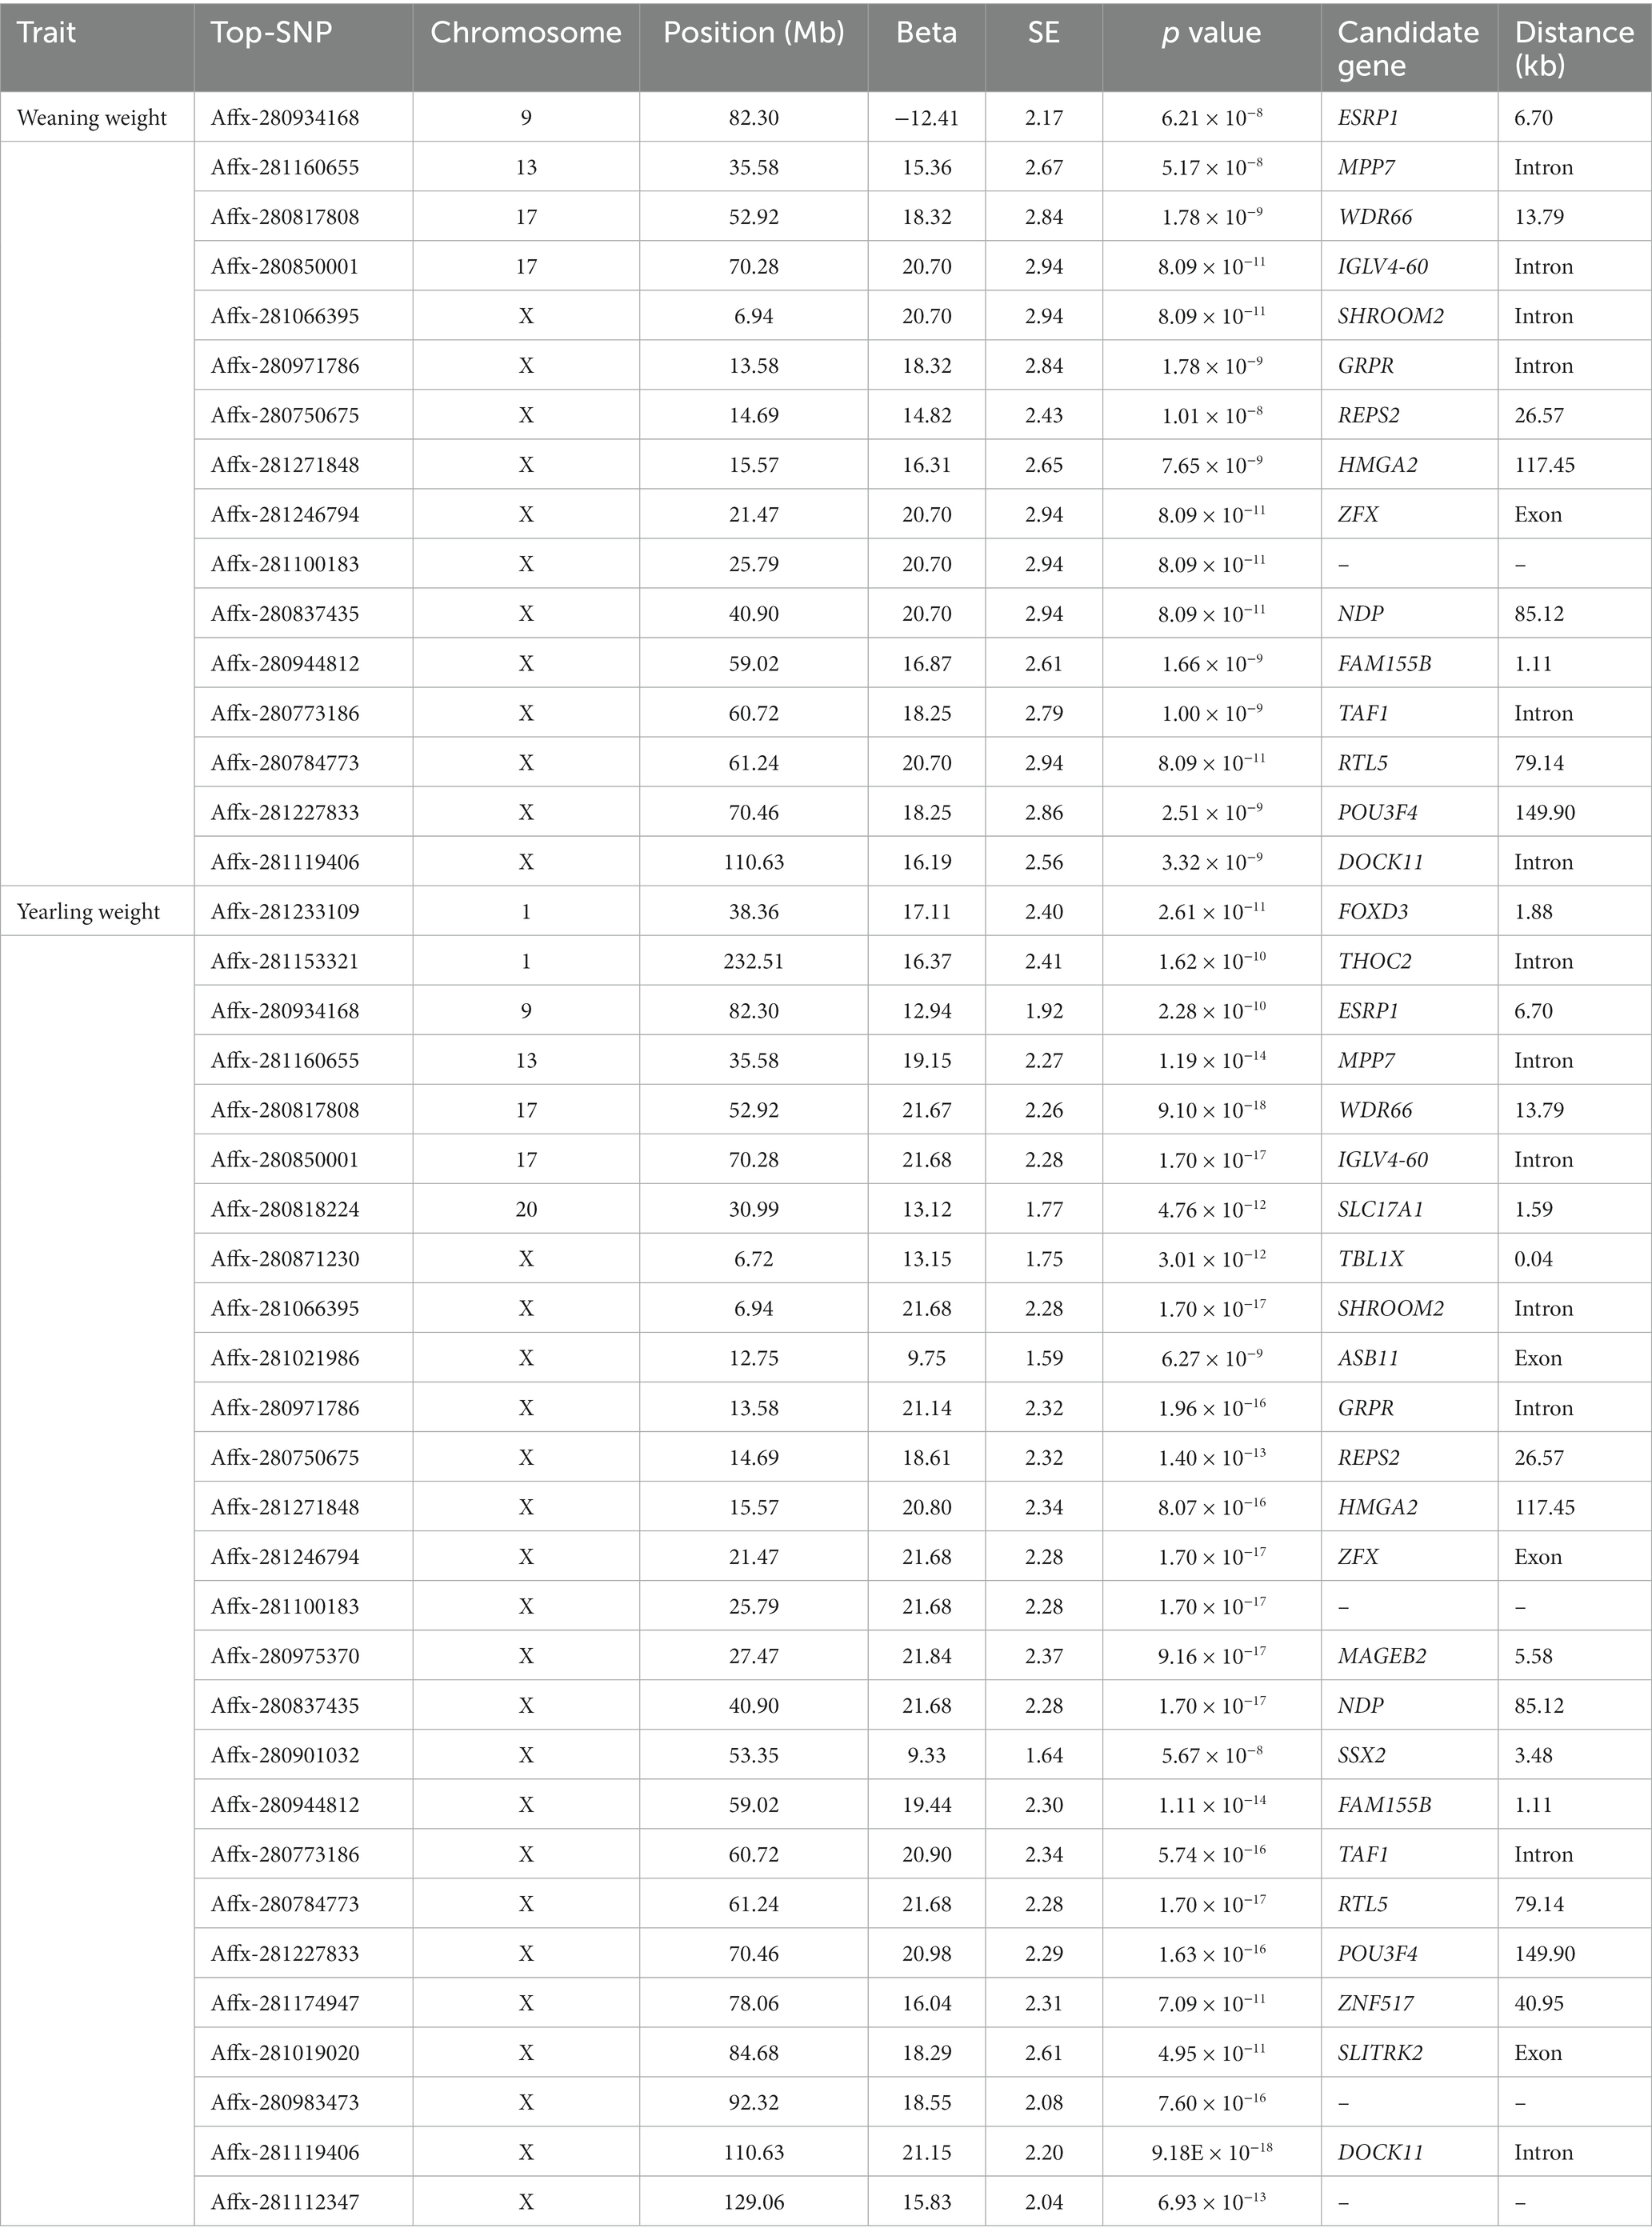
Table 2. Significant loci and genes identified using single-trait GWAS.
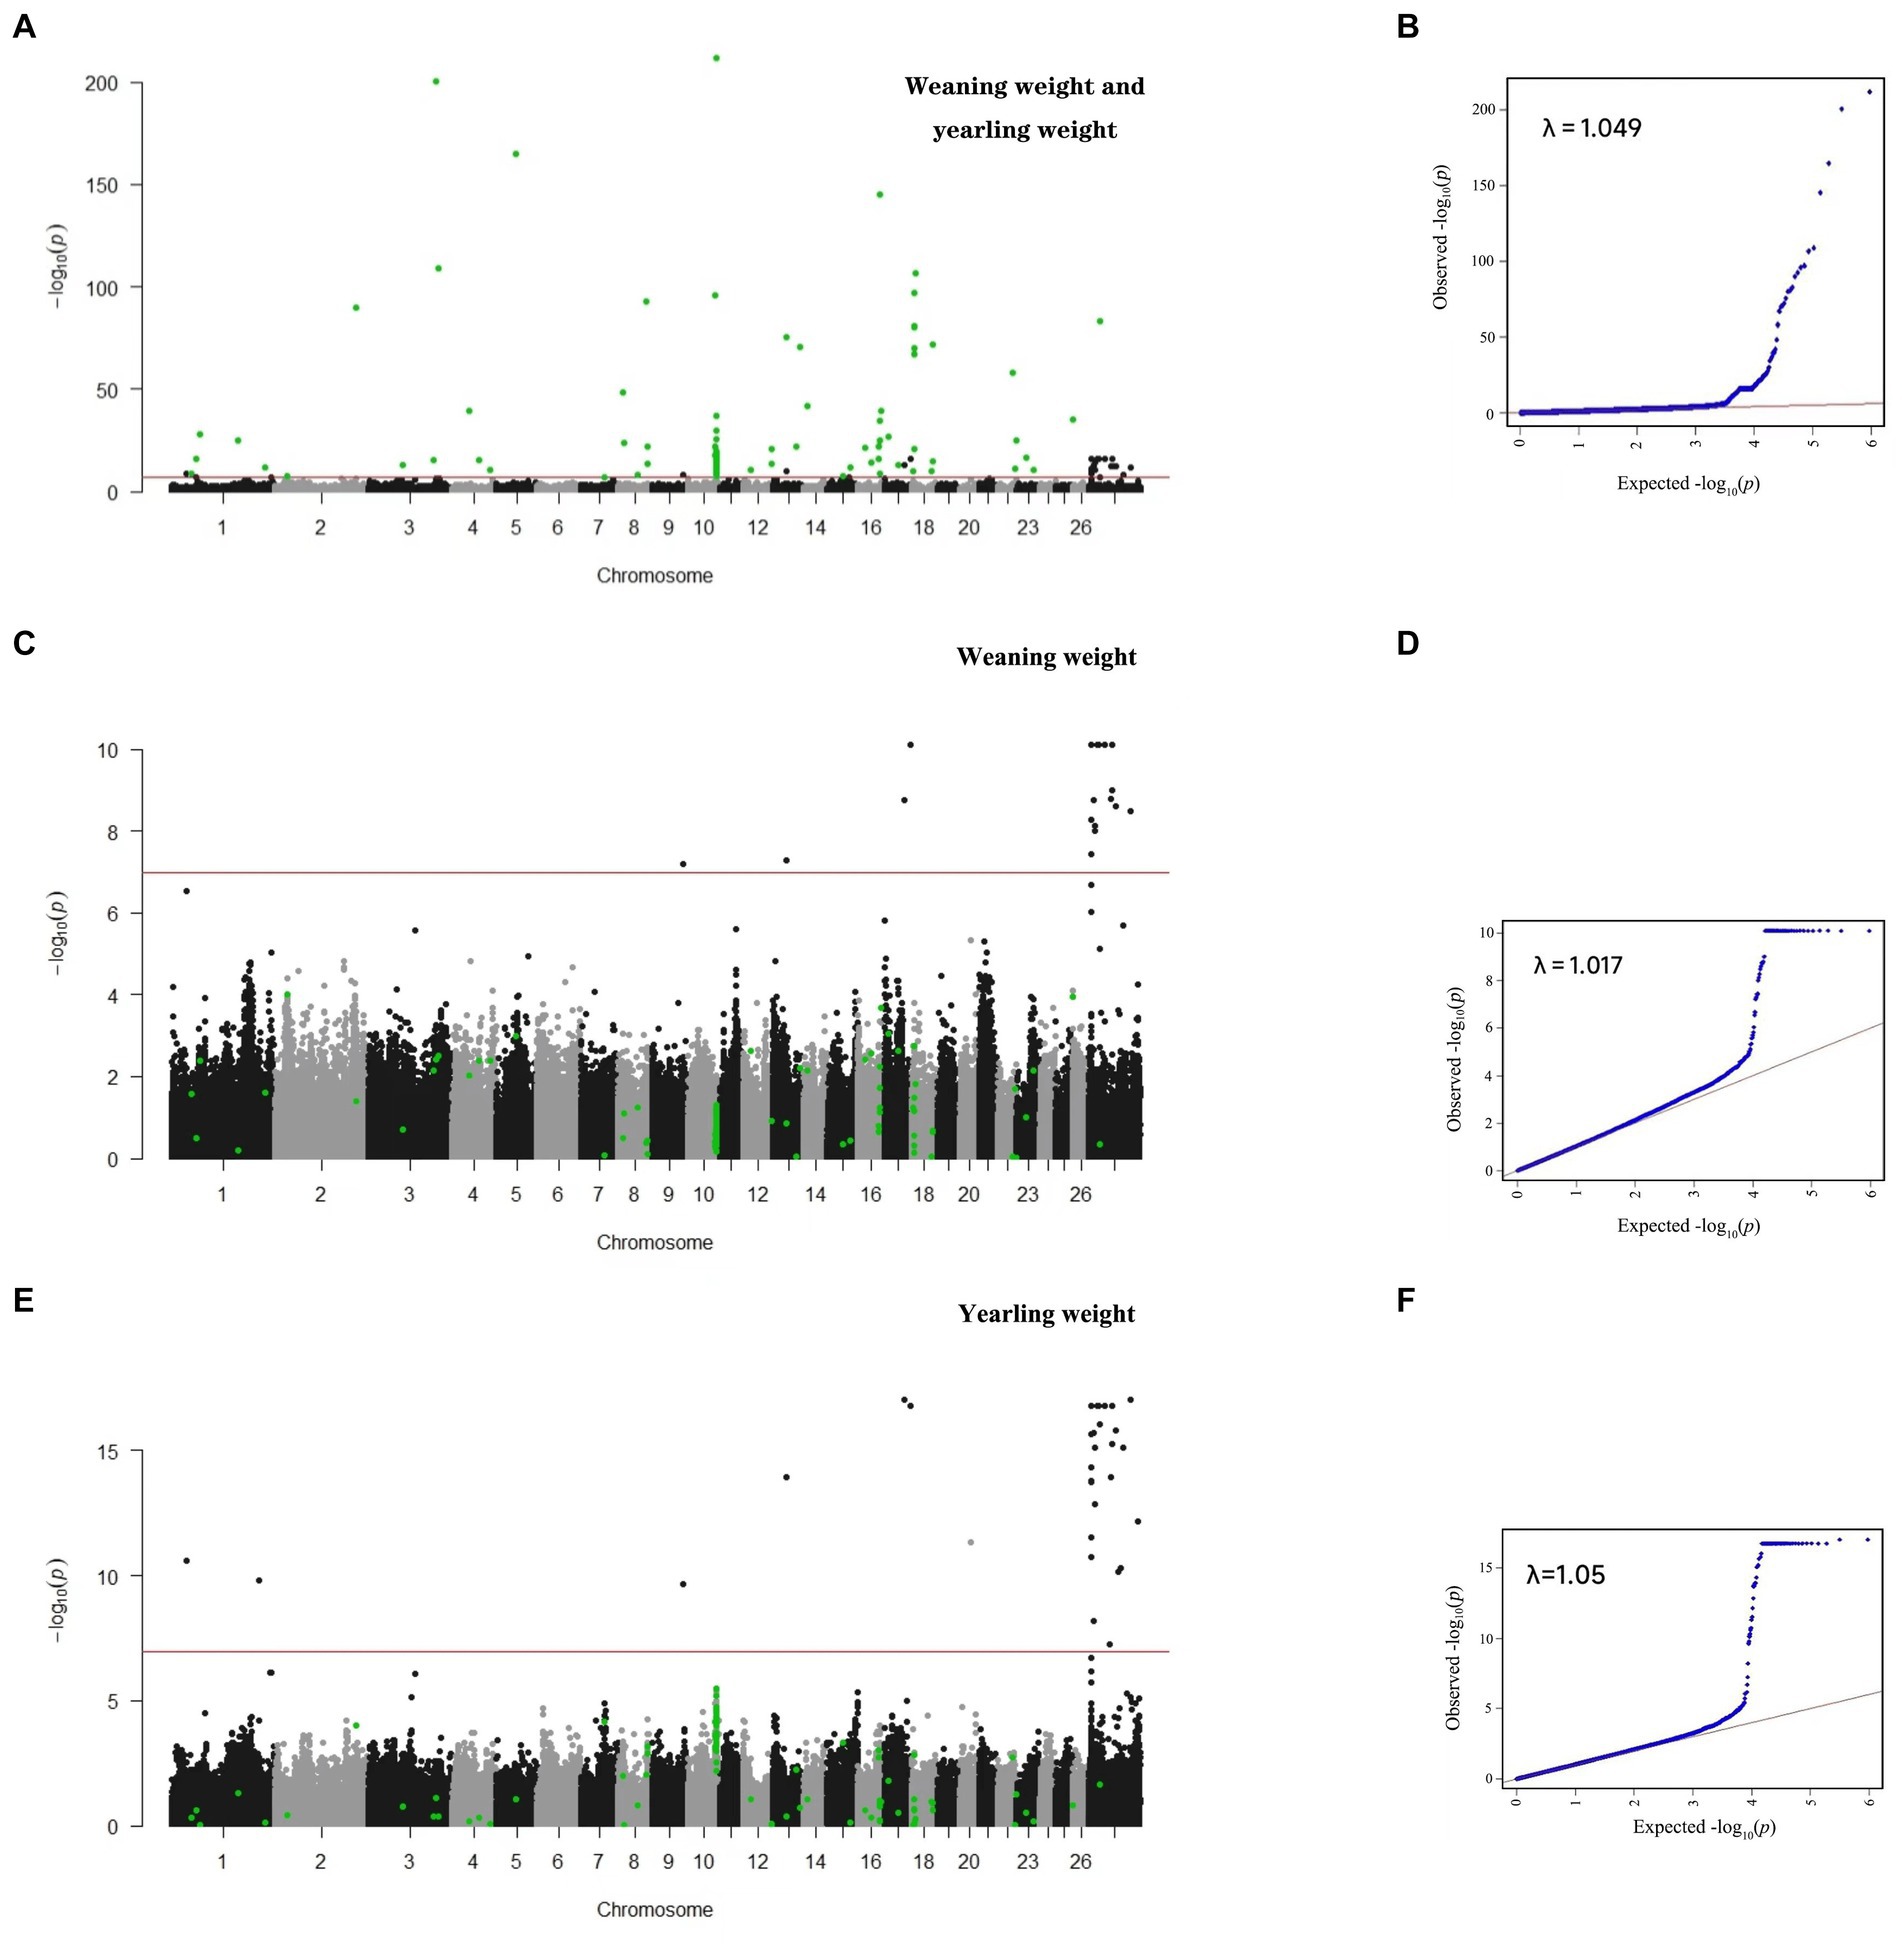
Figure 1. Manhattan and QQ plots for single- and multi-trait GWAS. Multi-trait (A,B); weaning weight (C,D); and yearling weight (E,F).
In this study, 43 SNPs significantly associated with both traits (weaning weight and yearling weight), such as Affx-2809971786 (OARX: 13.58 Mb), Affx-281271848 (OARX: 15.57 Mb), and Afffx-281246794 (OARX: 21.47 Mb), located within the GRPR (Gastrin-releasing peptide receptor), HMGA2 (High mobility group A 2), and ZFX (Zinc finger protein X-linked) genes, respectively. A 0.3-Mb region (6.74–7.04 Mb) on the X chromosome was the lagest region significantly associated with weaning weight and yearling weight (Figure 2). In this region, 27 and 30 SNPs were associated with weaning weight and yearling weight, respectively. These SNPs showed strong LD relationships with each other (r2 = 0.99). Moreover, this region contained the TBL1X (Transducing β-like 1 X-linked), GPR143 (G-protein coupled receptor143), and SHROOM2 genes. The most significant SNP was Affx-281066395, located at 6.94 Mb (Pweaning weight = 8.09 × 10⁻¹¹ and Pyearling weight = 1.70 × 10⁻¹⁷) on the SHROOM2 gene. These findings suggest that this genetic region may have pleiotropic effects.
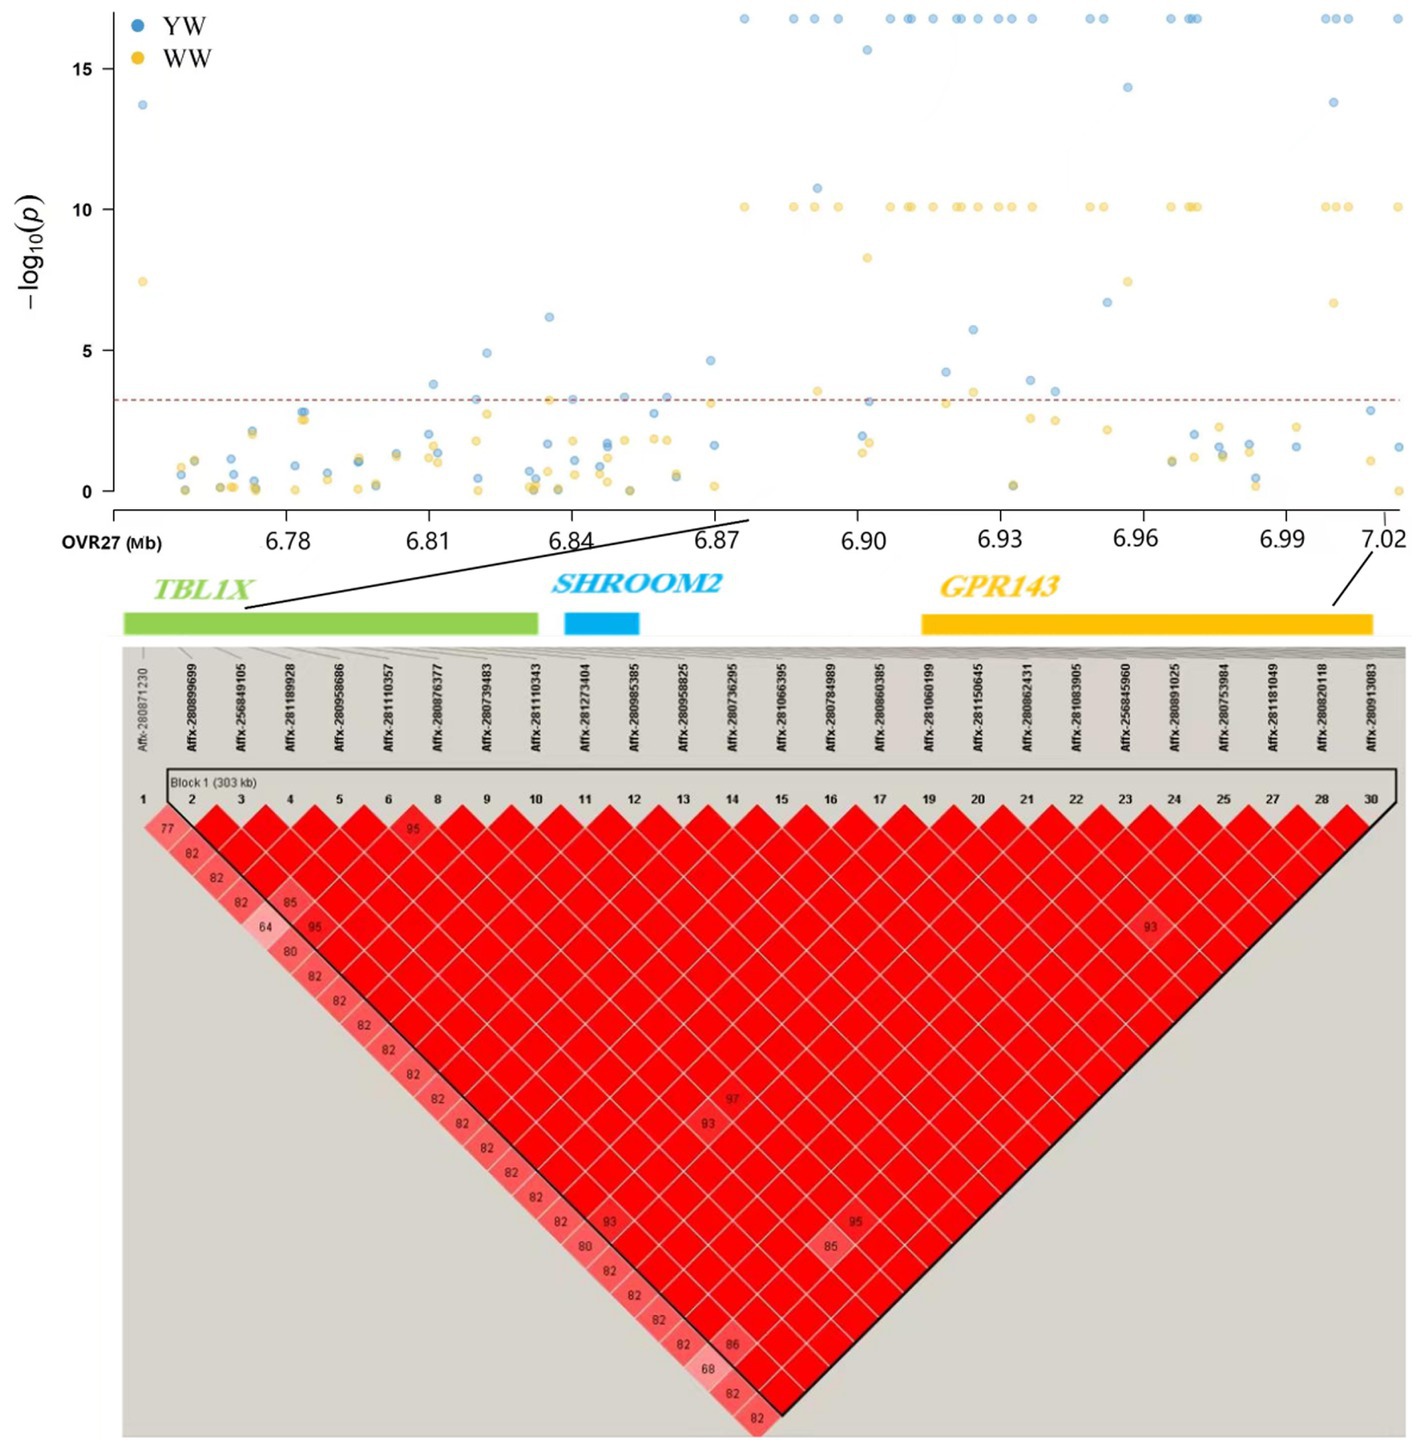
Figure 2. Association mapping results for SNPs significantly related to weaning weight and yearling weight located at 6.74–7.04 Mb on chromosome X. YW: yearling weight; WW: weaning weight.
In addition, we also found two SNPs that were only related to yearling weight, i.e., Affx-281233109 and Affx-28153321.
3.3. Multi-trait GWAS results
Since there are significant highly genetic correlation between weaning weight and yearling weight, the multuvariate model is more accurate. We used bi-traits GWAS to identify novel significant SNPs. In this study, 138 SNPs related to sheep weight were identified, and the Q-Q and Manhattan plots are displayed in Figure 1. In contrast to single-trait GWAS, multi-trait GWAS identified 93 novel SNPs (Table 3), which were mainly located on five chromosomes, including OAR3, 8, 10, 16, and 18.
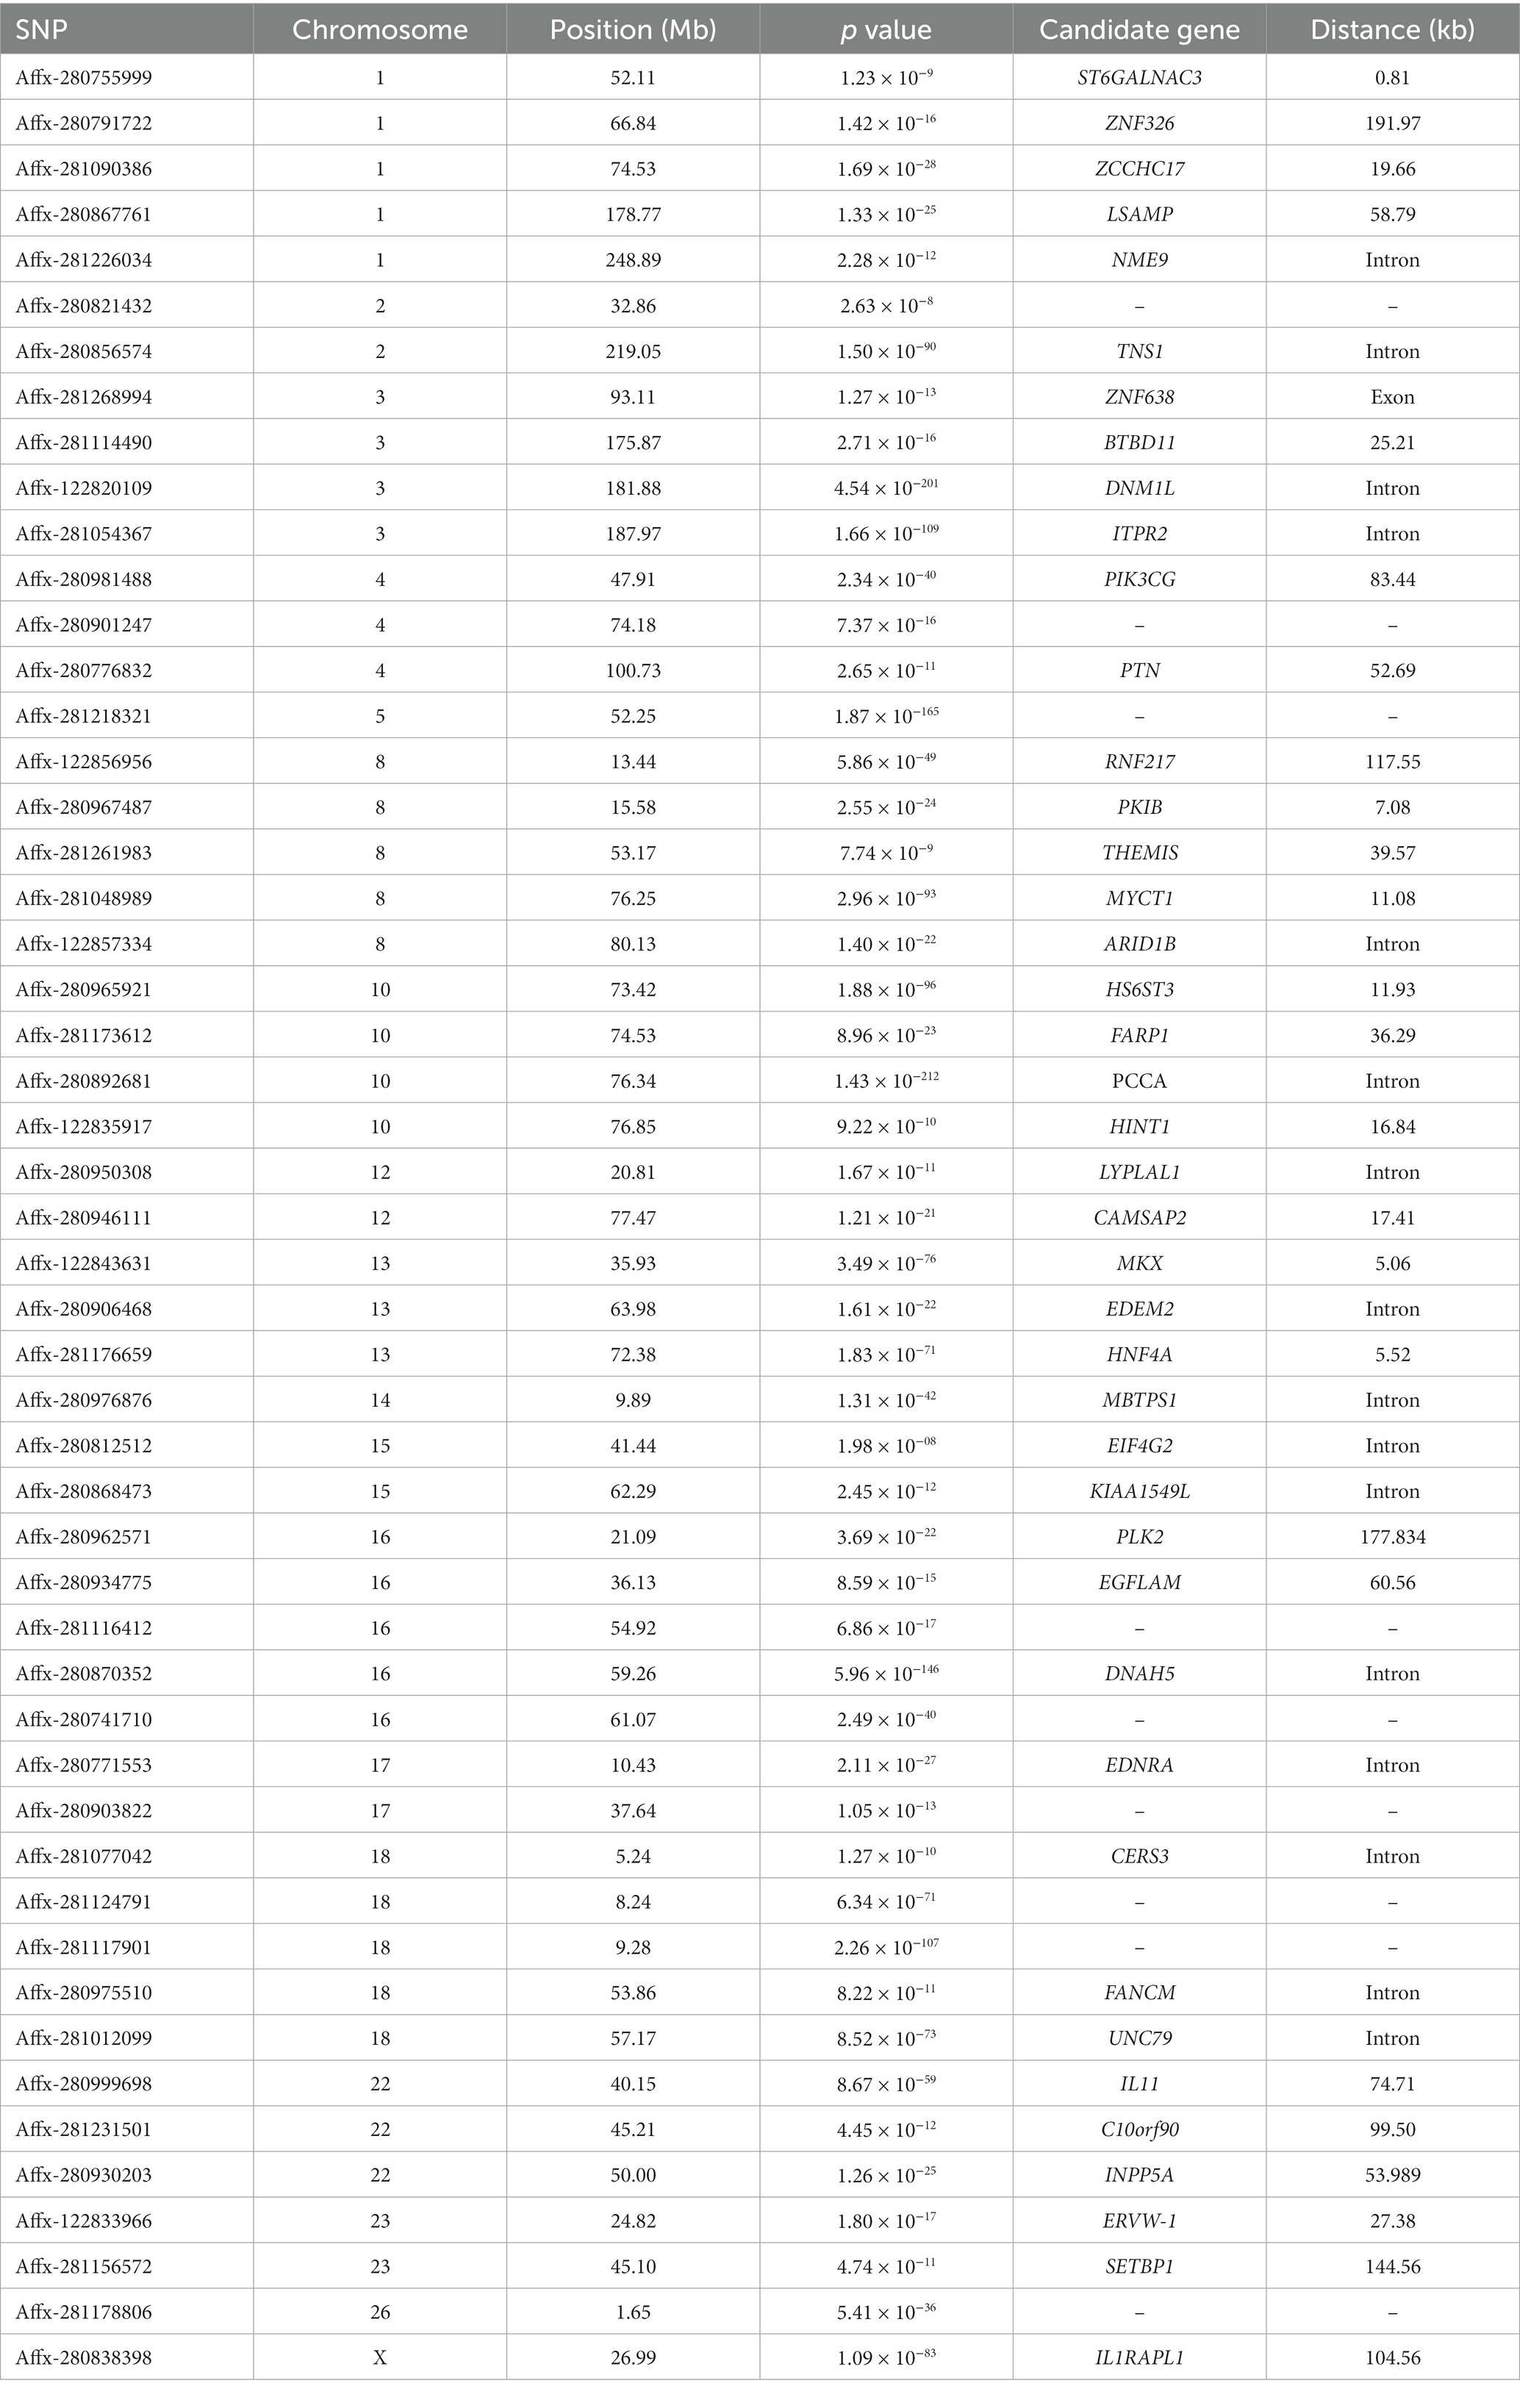
Table 3. Novel significant loci identified using multi-trait GWAS.
Using multi-trait GWAS, we identified a new genomic region at 76.04–77.23 Mb on chromosome 10 containing 22 significant SNP loci (Figure 3). These loci were missed in the single-trait GWAS analysis. However, the observed odds ratios of the two traits showed sufficient deviations, and the statistical significance could only be identified after considering the joint statistics of the two phenotypes (Figure 4). These results showed that multi-trait GWAS can increase statistical power and complement the results of single-trait GWAS. Of those significant SNPs, Affx-280892681, located at 76.34 Mb on the PCCA (Propionyl-CoA carboxylase subunit alpha) gene, was the most significant loci (p = 1.43 × 10−212). But all near loci with it is not significant, we speculate that it is a false positive loci related to body weight. In this region, there are 12 significant SNP loci at 76.40–76.90 Mb were strongly linkage disequilibrium (r2 = 0.89). The Affx-122835917 SNP, located near the HINT1 gene, was associated with BW (p = 9.22 × 10⁻¹⁰).
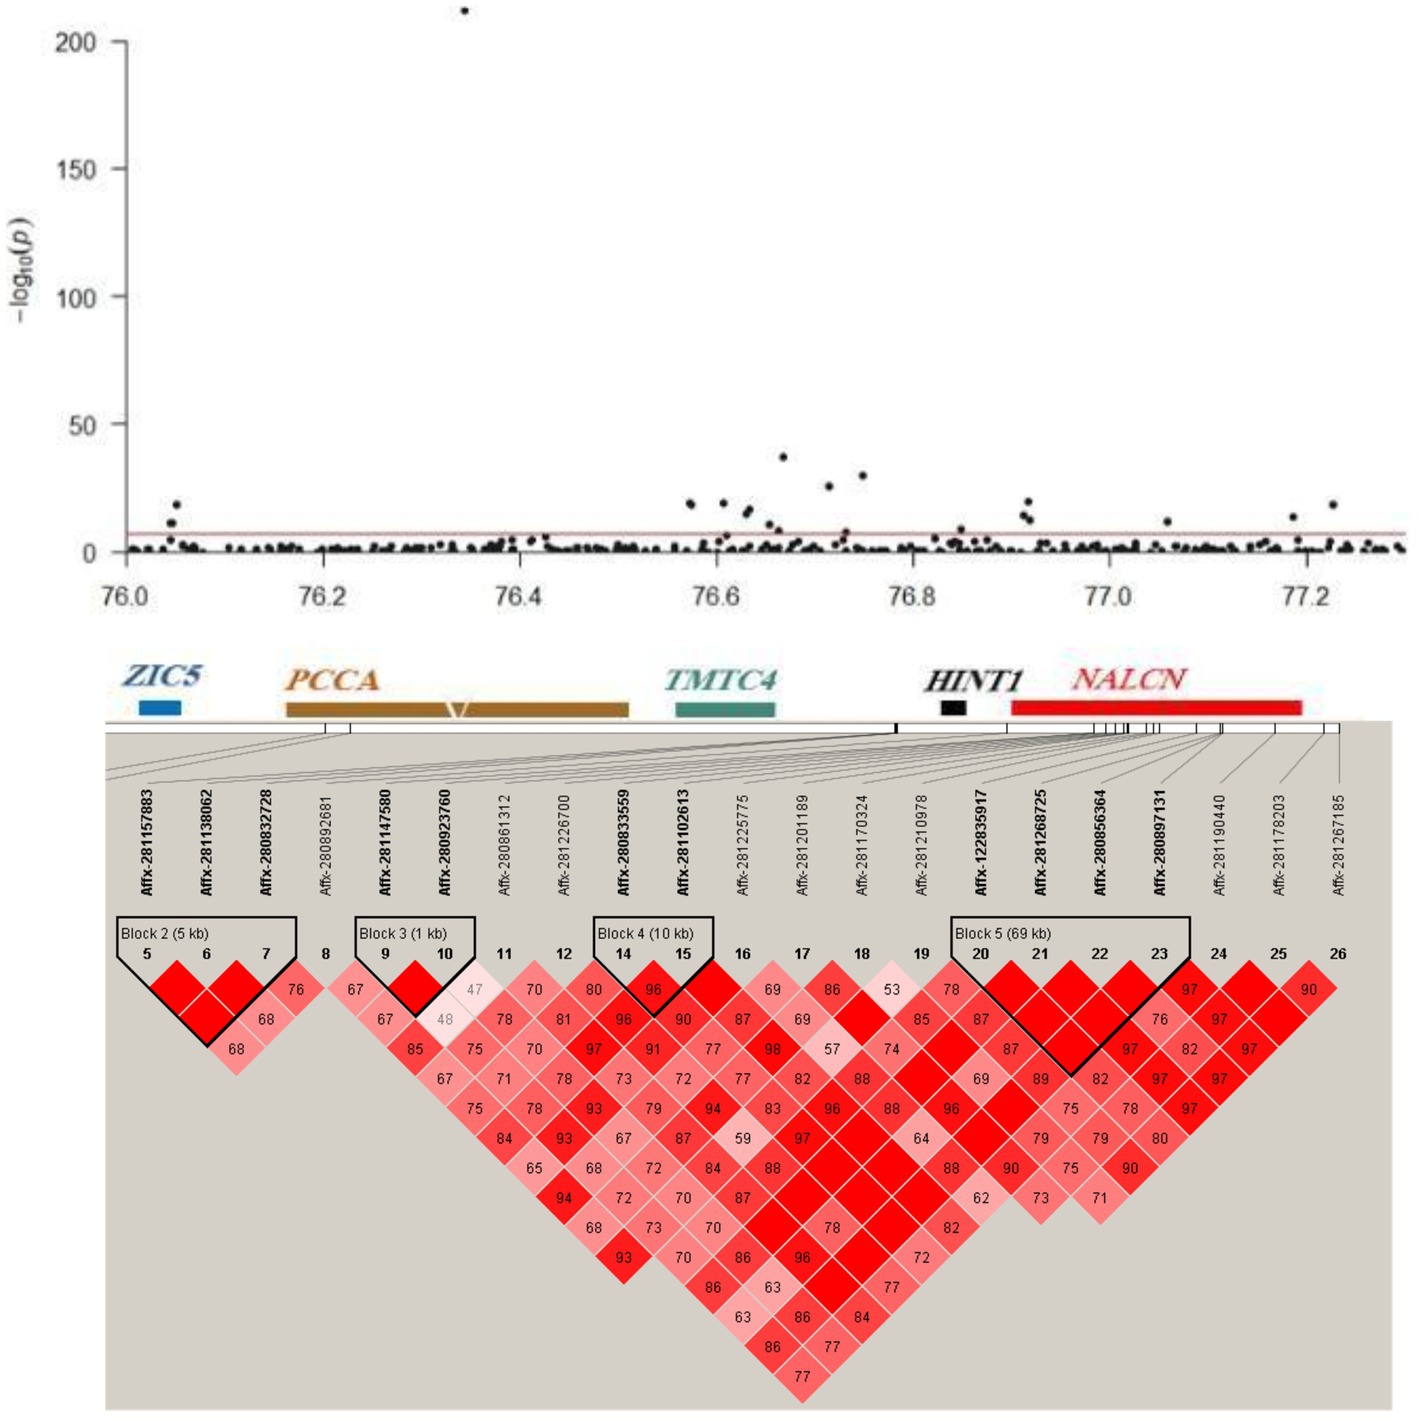
Figure 3. Linkage disequilibrium (LD) blocks of the novel loci detected using multi-trait GWAS. Manhattan plot (top) and LD plot (bottom) of the 76.04–77.23 Mb genomic region on chromosome 10.
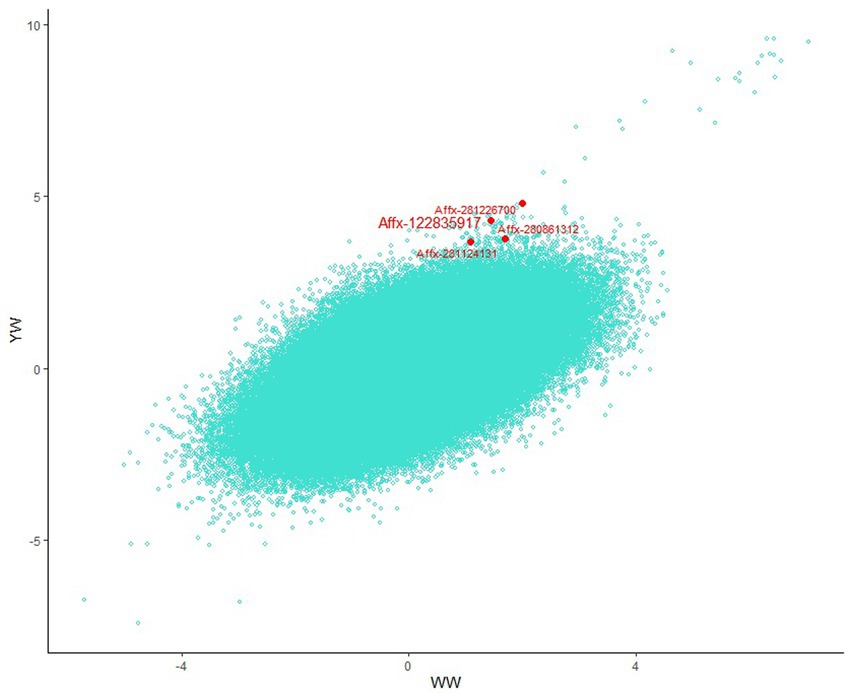
Figure 4. Scatter plot comparing all Beta/SE values for the two traits across the genome. Novel loci detected by muti-trait GWAS are marked at the edges of the plot.
3.4. Expression profiles of candidate genes across multiple tissues
To validate biological function of these candidate genes in this study, we explored RNA-Seq data of multi-tissues of juvenile and adult sheep. We found there were 13 and 6 genes expressed in all 17 tissues of juvenile and adult stages, respectively. Of these genes, ARID1B (AT-Rich Interaction Domain 1B), DNM1L (Dynamin 1 Like), FANCM (Fanconi anemia complementation group M), HINT1 (Histidine Triad Nucleotide Binding Protein 1), and ZCCHC17 (Zinc Finger CCHC-Type Containing 17) were expressed in all development stages, and the expression of HINT1 gene was highest. According STRING Interaction Network database, the fatty acid-binding protein family gene, including FABP3, FABP5, FABP7 proteins, were interacted with HINT1. So we deem the HINT1 gene might play important role involving in body weight.
The expression patterns each gene varied in different tissues of different development stages. We calculated index of tissue specificity each genes. The results shown ASB11 (Ankyrin Repeat And SOCS Box Containing 11), KIAA1549L (KIAA1549 Like), GPR143, UNC79 (Unc-79 Homolog, NALCN Channel Complex Subunit) were specifically expressed in muscle biceps, brain, hypothalamus, and pituitary tissues of juvenile and adult stages, respectively.
By difference expression analysis, we found ASB11 gene was significantly higher expressed in muscle biceps tissue of juvenile sheep (p = 6.69 × 10⁻⁴), and GPR143 gene was significantly higher expressed in hypothalamus tissue of adult sheep (p = 1.64 × 10⁻⁴).
4. Discussion
Multi-trait GWAS is usually used to detect QTLs associated with multiple traits, when there is a covariance between traits. The higher the genetic and phenotypic correlation between traits, the higher is the statistical power of multi-trait GWAS. In this study, our results showed that the genetic correlation between weaning weight and yearling weight was 0.73 and Singh et al. (29) found the genetic correlation between the two traits in marwari sheep was 0.56. These findings indicate that there is a positive genetic correlation between weaning weight and yearling weight in sheep. To improve the power of GWAS results, we conducted bi-trait GWAS for two correlated traits. In comparison single trait GWAS, we yielded 93 novel SNPs related to these traits. Using the same strategy, Zhou et al. (30) conducted multi-trait GWASs for chest, abdominal, and waist circumferences in Duroc Pig populations and detected four additional SNPs. Yan et al. (31) identified 16 novel loci associated with hematological traits in the White Duroc × Erhualian F2 resource population; Bolormaa et al. (32) discovered that multi-trait analysis improves the detection of polymorphic QTLs for 32 traits in beef cattle. Together with our findings, these results show that multi-trait GWAS can complement single-trait GWAS results and thus increase the statistical power of GWAS, when there is genetic correlation between different traits.
Very few studies have examined SNPs or QTLs related to weaning weight and yearling weight in sheep. According to the SheepQTLdb database (as of April 25, 2023), there are 11 QTLs and 4 QTLs related to weaning weight and yearling weight in sheep, respectively, based on QTL mapping or GWAS. These QTLs are distributed on OAR2–OAR4, OAR7, OAR9, OAR15, OAR19, and OAR24 (1, 9, 10, 33). Our study expanded this list considerably, identifying 148 SNPs that are significantly correlated with weaning weight and yearling weight through a combination of single- and multi-trait GWAS. However, we found that the candidate genetic markers of body weight identified in this study were less consistent than those reported from previous GWAS. This difference may be due to differences in the genetic background and breeds of sheep or their size and population structure. Differences in the detection platforms or algorithms used for analysis and random or technical errors in some analyses may have also contributed to these differences. Nevertheless, this suggests that many important genetic markers and candidate genes of weight traits in the sheep genome remain to be discovered.
In this study, we performed a genome-wide association study of body weights of 218 ewes. This is a small study. Although, many researchers insist on a large sample, and “the larger the sample, the more reliable is the result” is their dictum. Multiple problems have been cited with the studies on a small sample (34, 35). Whether based on a small sample or a large sample, no single study is considered conclusive. A large number of small studies can be done easily in different condition. Anderson and Vingrys (36) argued that small samples may be enough to show the presence of an effect but not for estimating the effect size. If most of small studies point toward the same direction, a possibly robust conclusion can be drawn through a meta-analysis. Animal experiments can be done in highly controlled conditions to nearly eliminate all the confounders, thus it may be used small sample to establish the cause-effect relationship (37). When more confounders were under control, sufficient power is achieved with a smaller sample. This study was only few confounders, such as birth year of ewes. So far, there are many examples exist of useful studies on small samples. For example, significant associations with body weight, growth-related and body conformation traits were identified by GWAS in 96 Baluchi sheep (38), 69 Egyptian Barki sheep (39), 150 Dazu Black goats (40), respectively. Furthermore, we also deem that estimated effects, confidence intervals and exact p values should be considered when interpreting a study’s results, but only sample size (41), and some exact methods of statistical analysis may help in reaching more valid conclusions for small sample size.
In contrast to long-held notions whereby single genes were believed to encode single functions, most genes are now recognized to have multiple qualitatively distinct functions. This phenomenon is termed pleiotropy (42). Pleiotropy is defined as a condition in which a single locus affects two or more distinct phenotypic traits (43, 44). It is very common phenomenon in nature for pleiotropism. The present study also found an interesting phenomenon where both the GPR143 and SHROOM2 genes were significantly associated with weaning weight and yearling weight. Hence, these two genes appear to be pleiotropic. Lu et al. (1) also revealed that GPR143 and SHROOM2 are associated with birth weight, weaning weight, yearling weight, and adult weight in sheep, which is consistent with the results of the present study. Zhang et al. and Jahejo et al. also found SHROOM2 gene is closely associated with tibial cartilage dysplasia (45, 46). It is of great significance to make a profound study of the pleiotropy so that it can reveal common genetic mechanisms between closely related phenotypes, as well as the molecular functions of genes. So, further functional data are required for the validation of these findings.
Due to high conservation across species, the identified genes related to body weight traits in humans and other animals may also be important for sheep growth and development. In this study, we found that some of these genes, including ARID1B, ASB11, DNM1L, HNF4A (Hepatocyte Nuclear Factor 4 Alpha), MKX (Mohawk Homeobox), PKIB (CAMP-Dependent Protein Kinase Inhibitor Beta), TBL1X and TMTC4 (Transmembrane O-Mannosyltransferase Targeting Cadherins 4) may be related to sheep body weight traits (Table 4). Liu et al. (47) found that ARID1B mutations are strongly associated with growth and weight traits in humans. ASB11 is a major regulator of human embryonic and adult regenerative myogenesis (48). Increased expression levels of the DNM1L proteins may correlate with the degree of weight gain, and is closely related to the development of obesity (49–52). HNF4A mutations are associated with a considerable increase in birth weight and macrosomia, and the gene acts in the intestine and kidney to promote white adipose tissue energy storage (53–56). MKX is a potential regulator of brown adipose tissue development associated with obesity-related metabolic dysfunction in children (57). PKIB plays a central role in human obesity and metabolism (58, 59). TBL1X mainly plays an important role in maintaining precursor adipocytes in an undifferentiated state by inhibiting adipogenesis (60). Ma et al. (61) showed that TMTC4 is significantly related to the formation of human skeletal muscle. From the above elementary description of the candidate genes, we find some of them are more or less associated with muscle development and body weight in different species, which allows us to predict the genes might take part in similar processes in sheep genome. Subsequent studies, such as functional verification, will be done in the candidate genes, which could ultimately reveal the causal mutations underlying body weigh traits in sheep.
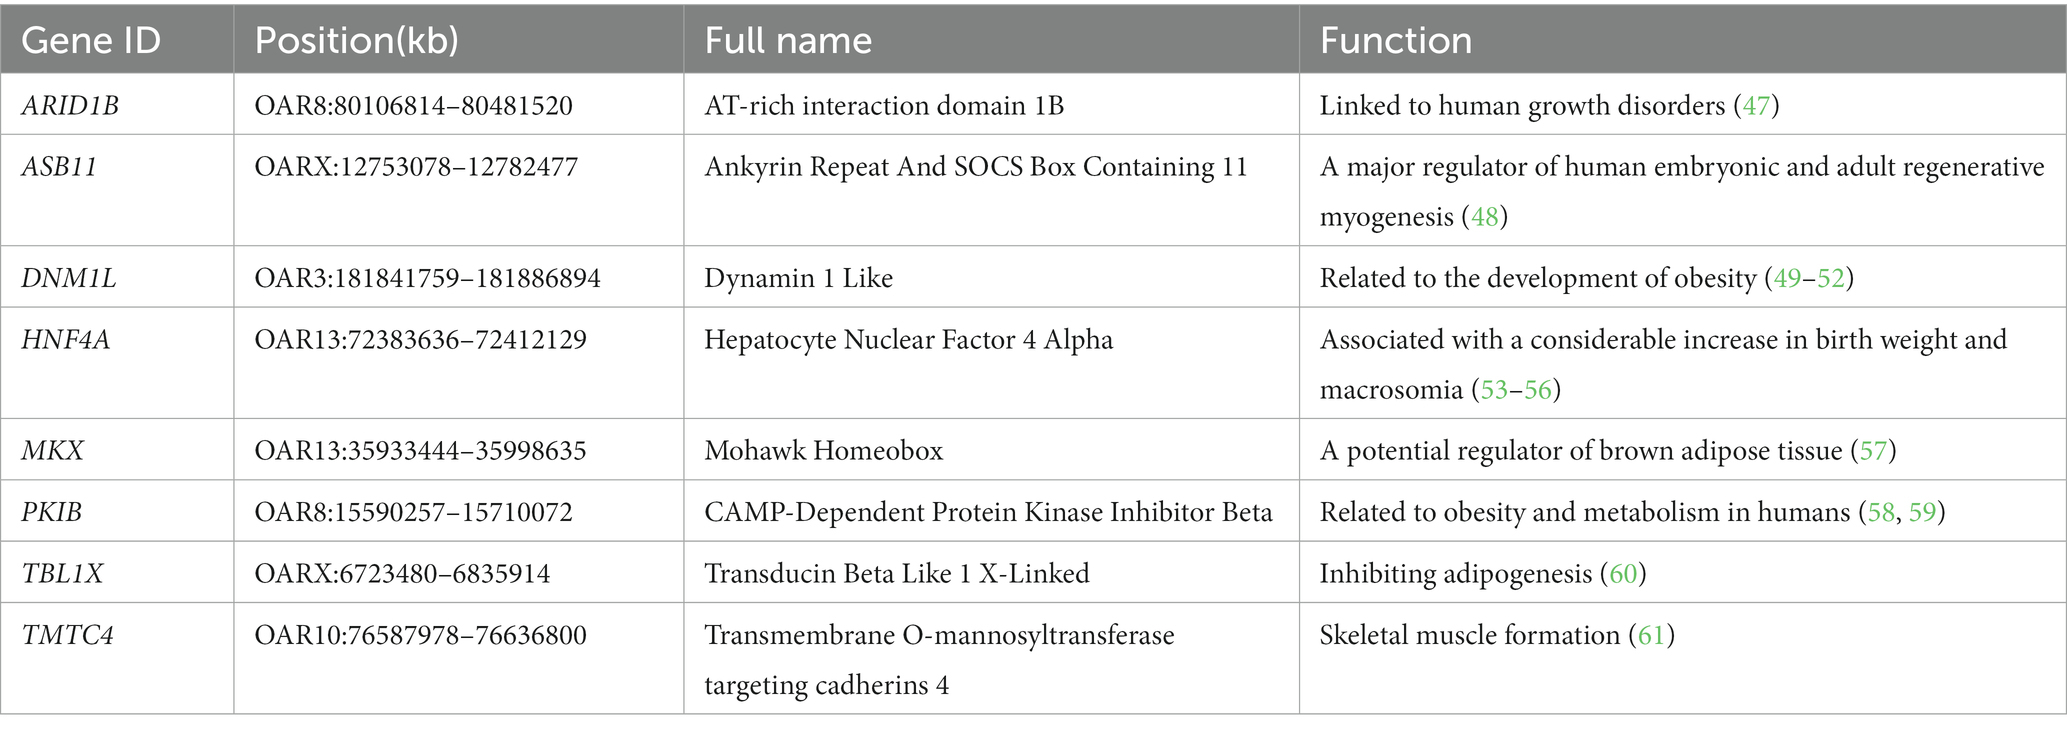
Table 4. Basic functions of the identified genes.
5. Conclusion
In this study, we identified 148 significant SNPs related to weaning weight or yearling weight based on single-trait and multi-trait GWAS. Two important chromosomal regions were discovered, including the 6.74–7.04 Mb interval on chromosome X and the 76.04–77.23 Mb interval on OAR10. Our results suggest that multi-trait GWAS is a powerful statistical tool for identifying novel loci missed by conventional single-trait GWAS. Incorporated transcript expression data of candidate genes, HINT1, ASB11 and GPR143 genes may involve in sheep body weight. This study show multi-omic anlaysis is a valuable strategy identifying candidate genes. Moreover, they provide key insights into the genetic determinants of weight traits in sheep.
Data availability statement
The datasets presented in this study can be found in online repositories. The names of the repository/repositories and accession number(s) can be found at: https://ngdc.cncb.ac.cn/; PRJCA002639, GVM000068.
Ethics statement
The animal study was reviewed and approved by the Experimental Animal Care and Use Committee of the Xinjiang Academy of Agricultural and Reclamation Sciences (Shihezi, China, approval number: XJNKKXY-AEP-039, January 22, 2012). The Northeast Agricultural University (Harbin, China) Animal Care and Treatment Committee (IACUCNEAU20150616). Written informed consent was obtained from the owners for the participation of their animals in this study.
Author contributions
HY, ZW, PZ, and YL conceived the study. YY and QY were involved in the acquisition of data. YL and JG performed all data analysis. ZW, YL, PZ, and HY drafted the manuscript. YG and CZ contributed to the writing and editing. All authors contributed to the article and approved the submitted version.
Funding
This work was supported by Young and middle-aged scientific and technological innovation leading talent plan of the Xinjiang Production and Construction Corps (2019CB019), the Open Project of State Key Laboratory of Sheep Genetic Improvement and Healthy Production (MYSKLKF202001), the National Key R&D Program of China (No. 2021YFD1300903-2), the State Key Laboratory of Sheep Genetic Improvement and Healthy Production (No. MYSKLKF201902), the National Natural Science Foundation of China (Nos. 32070571 and 32160770), Agricultural Science and Technology Innovation Project of the Xinjiang Production and Construction Corps (No. NCG202211) and Major Scientific and Technological Project of the Xinjiang Production and Construction Corps (No. 2017AA006-02).
Conflict of interest
The authors declare that the research was conducted in the absence of any commercial or financial relationships that could be construed as a potential conflict of interest.
Publisher’s note
All claims expressed in this article are solely those of the authors and do not necessarily represent those of their affiliated organizations, or those of the publisher, the editors and the reviewers. Any product that may be evaluated in this article, or claim that may be made by its manufacturer, is not guaranteed or endorsed by the publisher.
Footnotes
1. ^https://www.ensembl.org/Ovis_aries/Info/Index
2. ^http://www.animalgenome.org/cgi-bin/QTLdb/OA/browse
3. ^http://www.bioinformatics.babraham.ac.uk/projects/fastqc/
References
1. Lu, Z, Yue, Y, Yuan, C, Liu, J, Chen, Z, Niu, C, et al. Genome-wide association study of body weight traits in Chinese fine-wool sheep. Animals (Basel). (2020) 10:170. doi: 10.3390/ani10010170
2. Tsartsianidou, V, Pavlidis, A, Tosiou, E, Arsenos, G, Banos, G, and Triantafyllidis, A. Novel genomic markers and genes related to reproduction in prolific Chios dairy sheep: a genome-wide association study. Animal. (2023) 17:100723. doi: 10.1016/j.animal.2023.100723
3. Ren, X, Yang, GL, Peng, WF, Zhao, YX, Zhang, M, Chen, ZH, et al. A genome-wide association study identifies a genomic region for the polycerate phenotype in sheep (Ovis aries). Sci Rep. (2016) 6:21111. doi: 10.1038/srep21111
4. Mastrangelo, S, Ben Jemaa, S, Sottile, G, Casu, S, Portolano, B, Ciani, E, et al. Combined approaches to identify genomic regions involved in phenotypic differentiation between low divergent breeds: application in Sardinian sheep populations. J Anim Breed Genet. (2019) 136:526–34. doi: 10.1111/jbg.12422
5. Carta, S, Cesarani, A, Correddu, F, and Macciotta, NPP. Understanding the phenotypic and genetic background of the lactose content in Sarda dairy sheep. J Dairy Sci. (2023) 106:3312–20. doi: 10.3168/jds.2022-22579
6. Arzik, Y, Kizilaslan, M, White, SN, Piel, LMW, and Çınar, MU. Genomic analysis of gastrointestinal parasite resistance in Akkaraman sheep. Genes (Basel). (2022) 13:2177. doi: 10.3390/genes13122177
7. Johnston, SE, McEwan, JC, Pickering, NK, Kijas, JW, Beraldi, D, Pilkington, JG, et al. Genome-wide association mapping identifies the genetic basis of discrete and quantitative variation in sexual weaponry in a wild sheep population. Mol Ecol. (2011) 20:2555–66. doi: 10.1111/j.1365-294X.2011.05076.x
9. Gholizadeh, M, Rahimi-Mianji, G, and Nejati-Javaremi, A. Genomewide association study of body weight traits in Baluchi sheep. J Genet. (2015) 94:143–6. doi: 10.1007/s12041-015-0469-1
10. Al-Mamun, HA, Kwan, P, Clark, SA, Ferdosi, MH, Tellam, R, and Gondro, C. Genome-wide association study of body weight in Australian merino sheep reveals an orthologous region on OAR6 to human and bovine genomic regions affecting height and weight. Genet Sel Evol. (2015) 47:66. doi: 10.1186/s12711-015-0142-4
11. Ghasemi, M, Zamani, P, Vatankhah, M, and Abdoli, R. Genome-wide association study of birth weight in sheep. Animal. (2019) 13:1797–803. doi: 10.1017/S1751731118003610
12. Korte, A, Vilhjálmsson, BJ, Segura, V, Platt, A, Long, Q, and Nordborg, M. A mixed-model approach for genome-wide association studies of correlated traits in structured populations. Nat Genet. (2012) 44:1066–71. doi: 10.1038/ng.2376
13. Klei, L, Luca, D, Devlin, B, and Roeder, K. Pleiotropy and principal components of heritability combine to increase power for association analysis. Genet Epidemiol. (2008) 32:9–19. doi: 10.1002/gepi.20257
14. Stephens, M. A unified framework for association analysis with multiple related phenotypes. PLoS One. (2013) 8:e65245. doi: 10.1111/age.12761
15. Ning, C, Wang, D, Zhou, L, Wei, J, Liu, Y, Kang, H, et al. Efficient multivariate analysis algorithms for longitudinal genome-wide association studies. Bioinformatics. (2019) 35:4879–85. doi: 10.1093/bioinformatics/btz304
16. Zhou, X, and Stephens, M. Genome-wide efficient mixed-model analysis for association studies. Nat Genet. (2012) 44:821–4. doi: 10.1038/ng.2310
17. Purcell, S, Neale, B, Todd-Brown, K, Thomas, L, Ferreira, MA, Bender, D, et al. PLINK: a tool set for whole-genome association and population-based linkage analyses. Am J Hum Genet. (2007) 81:559–75. doi: 10.1086/519795
18. Barrett, JC, Fry, B, Maller, J, and Daly, MJ. Haploview: analysis and visualization of LD and haplotype maps. Bioinformatics. (2005) 21:263–5. doi: 10.1093/bioinformatics/bth457
19. Gabriel, SB, Schaffner, SF, Nguyen, H, Moore, JM, Roy, J, Blumenstiel, B, et al. The structure of haplotype blocks in the human genome. Science. (2002) 296:2225–9. doi: 10.1093/bioinformatics/bth457
20. Yang, J, Lee, SH, Goddard, ME, and Visscher, PM. GCTA: a tool for genome-wide complex trait analysis. Am J Hum Genet. (2011) 88:76–82. doi: 10.1016/j.ajhg.2010.11.011
22. Howe, KL, Achuthan, P, Allen, J, Allen, J, Alvarez-Jarreta, J, Amode, MR, et al. Ensembl 2021. Nucleic Acids Res. (2021) 49:D884–91. doi: 10.1093/nar/gkaa942
23. Quinlan, AR, and Hall, IM. BEDTools: a flexible suite of utilities for comparing genomic features. Bioinformatics. (2010) 26:841–2. doi: 10.1093/bioinformatics/btq033
24. Bolger, AM, Lohse, M, and Usadel, B. Trimmomatic: a flexible trimmer for Illumina sequence data. Bioinformatics. (2014) 30:2114–20. doi: 10.1093/bioinformatics/btu170
25. Dobin, A, Davis, CA, Schlesinger, F, Drenkow, J, Zaleski, C, Jha, S, et al. STAR: ultrafast universal RNA-seq aligner. Bioinformatics. (2013) 29:15–21. doi: 10.1093/bioinformatics/bts635
26. Li, B, and Dewey, CN. RSEM: accurate transcript quantification from RNA-Seq data with or without a reference genome. BMC Bioinformatics. (2011) 12:323. doi: 10.1186/1471-2105-12-323
27. Love, MI, Huber, W, and Anders, S. Moderated estimation of fold change and dispersion for RNA-seq data with DESeq2. Genome Biol. (2014) 15:550. doi: 10.1186/s13059-014-0550-8
28. Yanai, I, Benjamin, H, Shmoish, M, Chalifa-Caspi, V, Shklar, M, Ophir, R, et al. Genome-wide midrange transcription profiles reveal expression level relationships in human tissue specification. Bioinformatics. (2005) 21:650–9. doi: 10.1093/bioinformatics/bti042
29. Singh, H, Pannu, U, Narula, HK, Chopra, A, Naharwara, V, and Bhakar, SK. Estimates of (co)variance components and genetic parameters of growth traits in marwari sheep. J Appl Anim Res. (2016) 44:27–35. doi: 10.1186/s12864-016-2538-0
30. Zhou, S, Ding, R, Zhuang, Z, Zeng, H, Wen, S, Ruan, D, et al. Genome-wide association analysis reveals genetic loci and candidate genes for chest, abdominal, and waist circumferences in two Duroc pig populations. Front Vet Sci. (2022) 8:807003. doi: 10.3389/fvets.2021.807003
31. Yan, G, Guo, T, Xiao, S, Zhang, F, Xin, W, Huang, T, et al. Imputation-based whole-genome sequence association study reveals constant and novel loci for Hematological traits in a large-scale swine F2 resource population. Front Genet. (2018) 9:401. doi: 10.3389/fgene.2018.00401
32. Bolormaa, S, Pryce, JE, Reverter, A, Zhang, Y, Barendse, W, Kemper, K, et al. A multi-trait, meta-analysis for detecting pleiotropic polymorphisms for stature, fatness and reproduction in beef cattle. PLoS Genet. (2014) 10:e1004198. doi: 10.1371/journal.pgen.1004198
33. Zhang, L, Liu, J, Zhao, F, Ren, H, Xu, L, Lu, J, et al. Genome-wide association studies for growth and meat production traits in sheep. PLoS One. (2013) 8:e66569. doi: 10.1371/journal.pone.0066569
34. Button, KS, Ioannidis, JP, Mokrysz, C, Nosek, BA, Flint, J, Robinson, ES, et al. Power failure: why small sample size undermines the reliability of neuroscience. Nat Rev Neurosci. (2013) 14:365–76. doi: 10.1038/nrn3475
35. Ioannidis, JP. Why most published research findings are false. PLoS Med. (2005) 2:e124. doi: 10.1371/journal.pmed.0020124
36. Anderson, AJ, and Vingrys, AJ. Small samples: does size matter? Invest Ophthalmol Vis Sci. (2001) 42:1411–3.
37. Indrayan, A, and Mishra, A. The importance of small samples in medical research. J Postgrad Med. (2021) 67:219–23. doi: 10.4103/jpgm.JPGM_230_21
38. Pasandideh, M, Gholizadeh, M, and Rahimi-Mianji, G. A genome-wide association study revealed five SNPs affecting 8-month weight in sheep. Anim Genet. (2020) 51:973–6. doi: 10.1111/age.12996
39. Abousoliman, I, Reyer, H, Oster, M, Murani, E, Mohamed, I, and Wimmers, K. Genome-wide analysis for early growth-related traits of the locally adapted Egyptian Barki sheep. Genes (Basel). (2021) 12:1243. doi: 10.3390/genes12081243
40. Gu, B, Sun, R, Fang, X, Zhang, J, Zhao, Z, Huang, D, et al. Genome-wide association study of body conformation traits by whole genome sequencing in Dazu black goats. Animals (Basel). (2022) 12:548. doi: 10.3390/ani12050548
41. Bacchetti, P. Small sample size is not the real problem. Nat Rev Neurosci. (2013) 14:585. doi: 10.1038/nrn3475-c3
42. Williams, GC. Pleiotropy, natural selection, and the evolution of senescence. Sci Aging Knowledge Enviro. (1960) 6:332–7. doi: 10.1111/j.1558-5646.1957.tb02911.x
43. Carter, AJ, and Nguyen, AQ. Antagonistic pleiotropy as a widespread mechanism for the maintenance of polymorphic disease alleles. BMC Med Genet. (2011) 12:160. doi: 10.1186/1471-2350-12-160
44. Stearns, FW. One hundred years of pleiotropy: a retrospective. Genetics. (2010) 186:767–73. doi: 10.1534/genetics.110.122549
45. Zhang, L, Huang, Y, Si, J, Wu, Y, Wang, M, Jiang, Q, et al. Comprehensive inbred variation discovery in Bama pigs using de novo assemblies. Gene. (2018) 679:81–9. doi: 10.1016/j.gene.2018.08.051
46. Jahejo, AR, Zhang, D, Niu, S, Mangi, RA, Khan, A, Qadir, MF, et al. Transcriptome-based screening of intracellular pathways and angiogenesis related genes at different stages of thiram induced tibial lesions in broiler chickens. BMC Genomics. (2020) 21:50. doi: 10.1186/s12864-020-6456-9
47. Liu, X, Hu, G, Ye, J, Ye, B, Shen, N, Tao, Y, et al. De novo ARID1B mutations cause growth delay associated with aberrant Wnt/β-catenin signaling. Hum Mutat. (2020) 41:1012–24. doi: 10.1080/09712119.2014.987291
48. Tee, JM, Sartori da Silva, MA, Rygiel, AM, Muncan, V, Bink, R, van den Brink, GR, et al. asb11 is a regulator of embryonic and adult regenerative myogenesis. Stem Cells Dev. (2012) 21:3091–103. doi: 10.1089/scd.2012.0123
49. Jheng, HF, Tsai, PJ, Guo, SM, Kuo, LH, Chang, CS, Su, IJ, et al. Mitochondrial fission contributes to mitochondrial dysfunction and insulin resistance in skeletal muscle. Mol Cell Biol. (2012) 32:309–19. doi: 10.1128/MCB.05603-11
50. Patel, B, New, LE, Griffiths, JC, Deuchars, J, and Filippi, BM. Inhibition of mitochondrial fission and iNOS in the dorsal vagal complex protects from overeating and weight gain. Mol Metab. (2021) 43:101123. doi: 10.1016/j.molmet.2020.101123
51. López-Lluch, G. Mitochondrial activity and dynamics changes regarding metabolism in ageing and obesity. Mech Ageing Dev. (2017) 162:108–21. doi: 10.1016/j.mad.2016.12.005
52. Wang, L, Ishihara, T, Ibayashi, Y, Tatsushima, K, Setoyama, D, Hanada, Y, et al. Disruption of mitochondrial fission in the liver protects mice from diet-induced obesity and metabolic deterioration. Diabetologia. (2015) 58:2371–80. doi: 10.1007/s00125-015-3704-7
53. Pearson, ER, Boj, SF, Steele, AM, Barrett, T, Stals, K, Shield, JP, et al. Macrosomia and hyperinsulinaemic hypoglycaemia in patients with heterozygous mutations in the HNF4A gene. PLoS Med. (2007) 4:e118. doi: 10.1371/journal.pmed.0040118
54. Locke, JM, Dusatkova, P, Colclough, K, Hughes, AE, Dennis, JM, Shields, B, et al. Association of birthweight and penetrance of diabetes in individuals with HNF4A-MODY: a cohort study. Diabetologia. (2022) 65:246–9. doi: 10.1007/s00125-021-05581-6
55. Girard, R, Tremblay, S, Noll, C, St-Jean, S, Jones, C, Gélinas, Y, et al. The transcription factor hepatocyte nuclear factor 4A acts in the intestine to promote white adipose tissue energy storage. Nat Commun. (2022) 13:224. doi: 10.1038/s41467-021-27934-w
56. McGlacken-Byrne, SM, Mohammad, JK, Conlon, N, Gubaeva, D, Siersbæk, J, Schou, AJ, et al. Clinical and genetic heterogeneity of HNF4A/HNF1A mutations in a multicentre paediatric cohort with hyperinsulinaemic hypoglycaemia. Eur J Endocrinol. (2022) 186:417–27. doi: 10.1530/EJE-21-0897
57. Abdul Majeed, S, Dunzendorfer, H, Weiner, J, Heiker, JT, Kiess, W, Körner, A, et al. COBL, MKX and MYOC are potential regulators of Brown adipose tissue development associated with obesity-related metabolic dysfunction in children. Int J Mol Sci. (2023) 24:3085. doi: 10.3390/ijms24043085
58. London, E, and Stratakis, CA. The regulation of PKA signaling in obesity and in the maintenance of metabolic health. Pharmacol Ther. (2022) 237:108113. doi: 10.1016/j.pharmthera.2022.108113
59. London, E, Bloyd, M, and Stratakis, CA. PKA functions in metabolism and resistance to obesity: lessons from mouse and human studies. J Endocrinol. (2020) 246:R51–64. doi: 10.1530/JOE-20-0035
60. Pan, C, Wang, S, Yang, C, Hu, C, Sheng, H, Xue, X, et al. Genome-wide identification and expression profiling analysis of Wnt family genes affecting adipocyte differentiation in cattle. Sci Rep. (2022) 12:489. doi: 10.1038/s41598-021-04468-1
Keywords: sheep, body weight, genome-wide association analysis, multi-trait, single-trait
Citation: Li Y, Yang H, Guo J, Yang Y, Yu Q, Guo Y, Zhang C, Wang Z and Zuo P (2023) Uncovering the candidate genes related to sheep body weight using multi-trait genome-wide association analysis. Front. Vet. Sci. 10:1206383. doi: 10.3389/fvets.2023.1206383
Edited by:
Joanna Szyda, Wroclaw University of Environmental and Life Sciences, PolandReviewed by:
Yanfa Sun, Longyan University, ChinaFaiz-ul Hassan, Cholistan University of Veterinary and Animal Sciences, Pakistan
Copyright © 2023 Li, Yang, Guo, Yang, Yu, Guo, Zhang, Wang and Zuo. This is an open-access article distributed under the terms of the Creative Commons Attribution License (CC BY). The use, distribution or reproduction in other forums is permitted, provided the original author(s) and the copyright owner(s) are credited and that the original publication in this journal is cited, in accordance with accepted academic practice. No use, distribution or reproduction is permitted which does not comply with these terms.
*Correspondence: Zhipeng Wang, d2FuZ3poaXBlbmdAbmVhdS5lZHUuY24=; Peng Zuo, NDc1MzYxODE0QHFxLmNvbQ==
†These authors have contributed equally to this work and share first authorship