 Mao Ye
 Zhexia Fan1,2
 Lijin Guo
 Qingbin Luo
- 1Department of Animal Genetics, Breeding and Reproduction, College of Animal Science, South China Agricultural University, Guangzhou, China
- 2Guangdong Provincial Key Laboratory of Agro-Animal Genomics and Molecular Breeding, Key Laboratory of Chicken Genetics, Breeding and Reproduction, Ministry of Agriculture, Guangzhou, China
Introduction: Excessive fat deposition in chickens can lead to reduced feed utilization and meat quality, resulting in significant economic losses for the broiler industry. Therefore, reducing fat deposition has become an important breeding objective in addition to achieving high broiler weight, growth rate, and feed conversion efficiency. In our previous studies, we observed high expression of Regulators of G Protein Signaling 16 Gene (RGS16) in high-fat individuals. This led us to speculate that RGS16 might be involved in the process of fat deposition in chickens.
Methods: Thus, we conducted a polymorphism and functional analysis of the RGS16 gene to investigate its association with fat-related phenotypic traits in chickens. Using a mixed linear model (MLM), this study explored the relationship between RGS16 gene polymorphisms and fat-related traits for the first time. We identified 30 SNPs of RGS16 in a population of Wens Sanhuang chickens, among which 8 SNPs were significantly associated with fat-related traits, including sebum thickness (ST), abdominal fat weight (AFW), and abdominal fat weight (AFR). Furthermore, our findings demonstrated that AFW, AFR, and ST showed significant associations with at least two or more out of the eight identified SNPs of RGS16. We also validated the role of RGS16 in ICP-1 cells through various experimental methods, including RT-qPCR, CCK- 8, EdU assays, and oil red O staining.
Results: Our functional validation experiments showed that RGS16 was highly expressed in the abdominal adipose tissue of high-fat chickens and played a critical role in the regulation of fat deposition by promoting preadipocyte differentiation and inhibiting their proliferation. Taken together, our findings suggest that RGS16 polymorphisms are associated with fat-related traits in chickens. Moreover, the ectopic expression of RGS16 could inhibit preadipocyte proliferation but promote preadipocyte differentiation.
Discussion: Based on our current findings, we propose that the RGS16 gene could serve as a powerful genetic marker for marker-assisted breeding of chicken fat-related traits.
1. Introduction
Being overweight and obese is a risk factor for major noncommunicable diseases (NCDs), including cardiovascular disease, type 2 diabetes, and cancer (1, 2). China has made many efforts to combat obesity, including implementing national policies and programs to promote healthy life-styles and prevent the development of NCDs, however, these efforts have been insufficient in controlling the rapid increase in overweight and obesity rates in the country (3). As a model animal, chickens are helpful in our study of abdominal fat deposition and may have certain guiding significance for the treatment of obesity-related diseases.
In recent decades, high-density genetic selection has greatly improved the weight, growth rate, and feed conversion efficiency of broilers (4). However, this has also resulted in excessive fat deposition, particularly in the abdomen. This phenomenon can lead to reduced feed utilization efficiency and lower meat quality, thus resulting in wasted resources and environmental pollution, which greatly reduce the desire for consumption and the economic efficiency of producers. Therefore, reducing fat deposition is a key issue to be addressed in broiler production. At the same time, research on fat deposition in chickens has important scientific significance for treating obesity-related diseases, reducing feed waste, and improving economic efficiency (5).
The protein encoded by the Regulators of G Protein Signaling 16 Gene (RGS16) belongs to the “regulator of G protein signaling” family. G protein signaling is activated through the binding of extracellular ligands to G protein-coupled receptors (GPCRs) and inhibited inside cells by regulator of G protein signaling (RGS) proteins (6). The GPCR pathway has been shown to influence the metabolism of glucose and fatty acids and the onset of obesity and diabetes (7, 8). RGS proteins are GTPase-activating proteins (GAPs) of alpha subunits that control the intensity and duration of GPCR signaling. The results of studies in recent years have shown that the triglyceride content is significantly higher in the liver of transgenic RGS16 mice than of nontrans genic mice, indicating that RGS16 inhibits fatty acid oxidation in the liver (9). It was also found that RGS16 overexpression promotes lipid droplet formation in rat 832/13 cells and affects the expression of key genes for enzymes that mediate lipid droplet formation (10). Single nucleotide polymorphisms (SNPs) have begun to be used in animal breeding research as highly stable molecular markers that can provide a wealth of information (11, 12).
To date, RGS16 has been relatively little studied in chicken compared with the mammalian counterpart. In our previous work, to explore the differences in fat deposition by high and low-fat broilers (13), we sequenced the transcriptomes of the abdominal fat of Wens Sanhuang chickens and found that the expression of RGS16 in abdominal fat was higher in high-fat individuals. Therefore, we hypothesized that RGS16 might be involved in the process of fat deposition in chicken. We provide some theoretical basis and direction for the selection of low-fat broilers by verifying the role of RGS16 in ICP-1 cell and analyzing the relationship between polymorphisms and fat-related traits including abdominal fat weight, abdominal fat rate and sebum thickness.
2. Materials and methods
2.1. Experimental animals and fat-related traits data
The F2 population of 100-day-old Sanhuang chickens (n = 439) used for the slaughter experiments in this study were reared under the same environmental and management conditions by Wens Food Group Co., Ltd. (Yunfu, China). The animal experiments in this study were approved by the Animal Care Committee of South China Agricultural University (permit number: SCAU#2017015, 13 September 2017) (14). The fat-related traits including AFW, AFR and ST were measured and calculated according to the Performance terminology and measurements for poultry (NY/T823-2020).
2.2. DNA extraction, PCR, and DNA sequencing
Blood samples were collected from veins under the wings of all Sanhuang chickens (n = 439), and DNA extraction was performed according to the instructions included in the DNA extraction kit (OMEGA, Georgia, United States). All DNA samples were used to amplify the dsDNA of the RGS16 5′UTR, 3′UTR and CDS with 2× Taq MasterMix (CWBIO, Nanjing, China). The PCR reaction conditions were as follows: pre-denaturation at 94°C for 2 min, amplification at 94°C for 30 s, 60°C for 30 s, and 72°C for 1 min, repeated for 30 cycles, final amplification at 72°C for 2 min, and hold at 4°C indefinitely. Finally, the PCR products were purified and sequenced by Sangon Biotech (Shanghai, China).
2.3. Cell culture, treatment, and transfection
The immortalized chicken preadipocyte 1 (ICP-1) cells used in this study were provided by Li Hui’s research group from Northeast Agricultural University (Heilongjiang, China). The basal medium used was DMEM/F12 (Gibco, United States) supplemented with 15% fetal bovine serum (FBS) (Gibco, United States) and 1% streptomycin/penicillin solution (Gibco, United States), the cells were cultured at 37°C and 5% CO2 in a calculator (15).
2.4. Overexpression plasmid construction and siRNA synthesis
To construct a chicken RGS16 overexpression plasmid, the complete CDS region of RGS16 was cloned into the EcoRI and BamHI sites of pcDNA3.1 (Promega, New York, United States), and the plasmids were extracted according to the instructions included with the HiPure Plasmid/BAC EF Mini Kit (Magen, Guangzhou, China). The knockdown of RGS16 (5′-GGACCATTGATGGCCATAA-3′) was performed using specific siRNA designed and synthesized by RiboBio Co., Ltd. (Guangzhou, China).
2.5. RNA extraction, cDNA synthesis, and quantitative real-time PCR
Total RNA was extracted from tissues or cells using Magzol Reagent (Magen, Guangzhou, China) following the manufacturer’s instructions. PrimeScript RT Reagent Kit with gDNA Eraser (TaKaRa, Otsu, Japan) was used for cDNA preparation from total RNA. RT-qPCR was performed using a ChamQ Universal SYBR qPCR Master Mix (Vazyme, Nanjing, China) in a Bio-Rad CFX96 Real-Time Detection System. Data were analyzed using the 2−△△Ct method with chicken GAPDH as the reference gene (16). The RT-qPCR primers were designed in Primer-BLAST1 and their detail were listed in Supplementary Table 1.
2.6. Oil red O staining
For oil red O staining, the ICP-1 cells were washed with PBS (Gbico, New York, United States) and then fixed with 4% paraformaldehyde solution (Sangon Biotech, Shanghai, China) for 30 min at room temperature. After fixation, the cells were rinsed twice with PBS, and oil red O staining solution (Sangon Biotech, Shanghai, China) was added followed by the incubation of cells for 60 min at room temperature. Then, the staining solution was removed, and the cells were washed three times with PBS. Image analysis was carried out using a DMi8 microscope (Leica, Wetzlar, Germany). The oil red O dye in stained cells was extracted with isopropanol solution and the absorption value was measured at 510 nm using a microreader (Bio-Tek, Vermont, United States).
2.7. 5-ethynyl-2′-deoxyuridine assay
EdU staining was performed using a Cell-Light EdU Apollo 488 In Vitro Kit (RiboBio, Guangzhou, China). For the EdU assay, ICP-1 cells were treated with EdU medium (1:1,000; RiboBio, Guangzhou, China) for 2 h at 37°C and then fixed in 4% paraformaldehyde solution (Yike, Guangzhou, China) for 30 min. The cells were subsequently permeabilized using 0.1% Triton X-100 solution (Gbico, New York, United States). The cells were incubated with the staining solution for 30 min at room temperature in the dark. Finally, the stained cells were scraped off with a cell scraper, collected in a 1.5 mL centrifuge tube and resuspended in 1 mL PBS. A BD Accouri C6 flow cytometer (BD Biosciences, San Jose, CA, United States) was utilized for the analysis of stained cells (16).
2.8. Cell counting kit-8 assay
For the CCK-8 assay, ICP-1 cells were inoculated in 96-well plates and transfected with plasmids or siRNA. Cell proliferation and viability were then monitored at 12, 24, 36, and 48 h using the CCK-8 kit (TransGen Biotech, Beijing, China) following the manufacturer’s instructions. This analysis was performed using a microreader (Bio-Rad, Hercules, CA, United States) to measure the absorption value at 450 nm.
2.9. Statistical analysis
The MLM package in IBM SPSS software (version 26, IBM: International Business Machines Corporation) was used to analyze the association of gene polymorphisms and haplotypes with chicken fat-related traits. All results were represented as mean ± SEM. The MLM model is as follows:
Where Y represents the observed value, μ represents the mean, G represents the fixed effect of genotypes, S represents the fixed effect of sex, and e is the random error. In addition, we used Haploview v.4.2 software for linkage disequilibrium analysis (17, 18).
Statistical analysis and plots generation were conducted using GraphPad Prism v.9.4 (CA, United States) and R studio v.4.2.1 software (MA, United States). Correlation coefficients were calculated using Pearson correlation analysis. An unpaired t-test (two-tailed) was used to assess the statistical significance between two groups. In multiple comparisons, significant differences were assessed using the LDS method.
3. Results
3.1. Phenotypic data
The descriptive statistics of fat-related traits in the F2 population of Wens Sanhuang chickens (n = 439) was listed in Table 1. Among of them, average AFW was 98.43 g, the max value was 193.00 while the min value was 28.40 indicating a particularly evident inter-individual differences and a wide range of variation, with a coefficient of variation exceeding 30%. Average AFR was 7.72%, with a min value of 2.79% and a max value of 13.68%, and a CV value of 22.8%. Its CV value was much lower than that of AFW, indicating a potential positive correlation between AFW and body weight. For ST, the average value was 7.53 mm, with a min value of 1.16 mm and a max value of 12.83 mm. The CV of ST was 21.87%, which was closed to that of AFR. In general, the CV of fat-related traits in this population was large, which could be used to validate the association analysis between nucleotide polymorphism and fat traits.
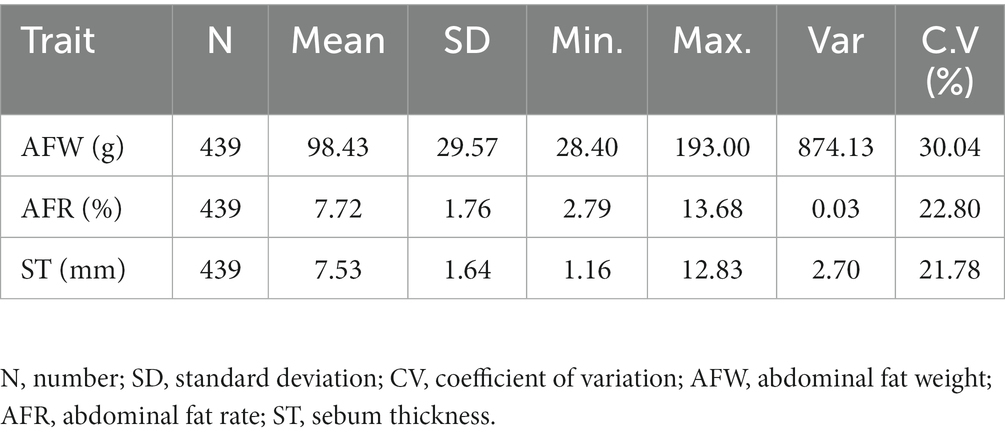
Table 1. Summary statistics of fat-related traits in the Wens Sanhuang chicken population.
3.2. SNPs discovery and genotypes
To screen for polymorphisms, the flanking and exon regions of RGS16, with a length of 3,053 bp, were, respectively, amplified (Figure 1A). A total of 30 SNPs were identified in this region from the F2 population of Wens Sanhuang chickens, and these were mapped to the genome sequence (Version: GRCg6a) in the Ensembl Database for identification (Table 2). The sequencing files of the 439 samples were analyzed using SnapGene v4.1.8 software to identify their genotypes for every individuals. Among of the 30 SNPs, the 6 SNPs were located in exon region but they were all synonymous variant. The statistics of genotype frequencies and allele frequencies are shown in Table 3. The 30 identified SNPs could all be divided into three genotypes. A chi-square test confirmed that all identified SNPs were in accordance with Hardy–Weinberg equilibrium (p > 0.05). Pearson correlation coefficients were used to analyze the correlations between fat-related traits, including AFW, AFR, and ST. As shown in Figure 1B, AFW was significantly and positively correlated with AFR (ρ = 0.934, p < 0.001), while ST is significantly and positively correlated with AFW and AFR (ρ = 0.290 for AFW, ρ = 0.234 for AFR, p < 0.001).
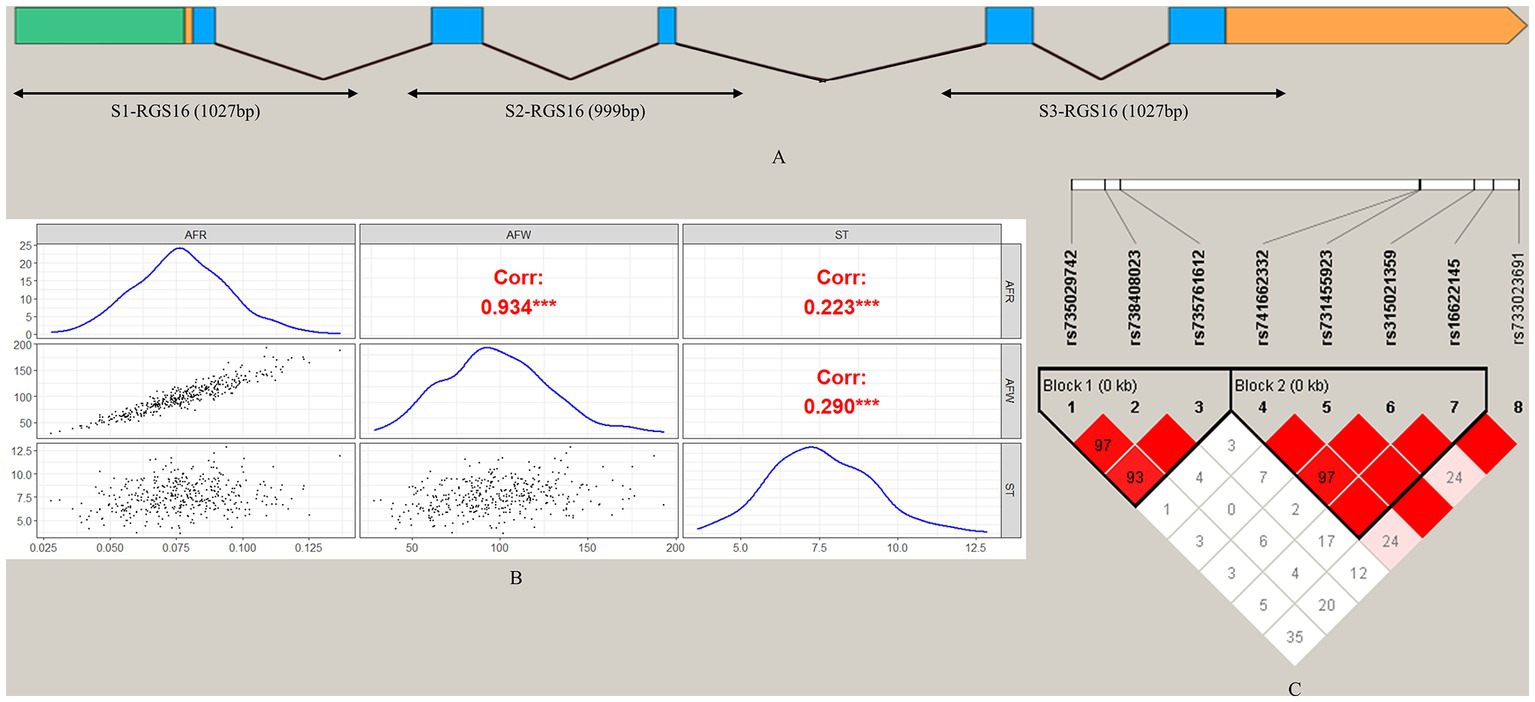
Figure 1. Analysis of 30 SNPs in the RGS16 in Wens Sanhuang chickens. (A) The locations of the three primers used for SNP screening in the RGS16. (B) Pearson correlation coefficients between fat-related traits in Wens Sanhuang chickens. (C) The paired linkage disequilibrium (LD) values (D′) of the SNPs are represented by the values in the boxes. When D′ = 1, the values are not displayed. The intensity of the red color in the box represents the strength of LD, with darker shades indicating stronger LD. The Haploview software was used to define haplotype blocks with the default settings. * Denotes statistical significance with * < 0.05; ** < 0.01; *** < 0.001; **** < 0.0001.
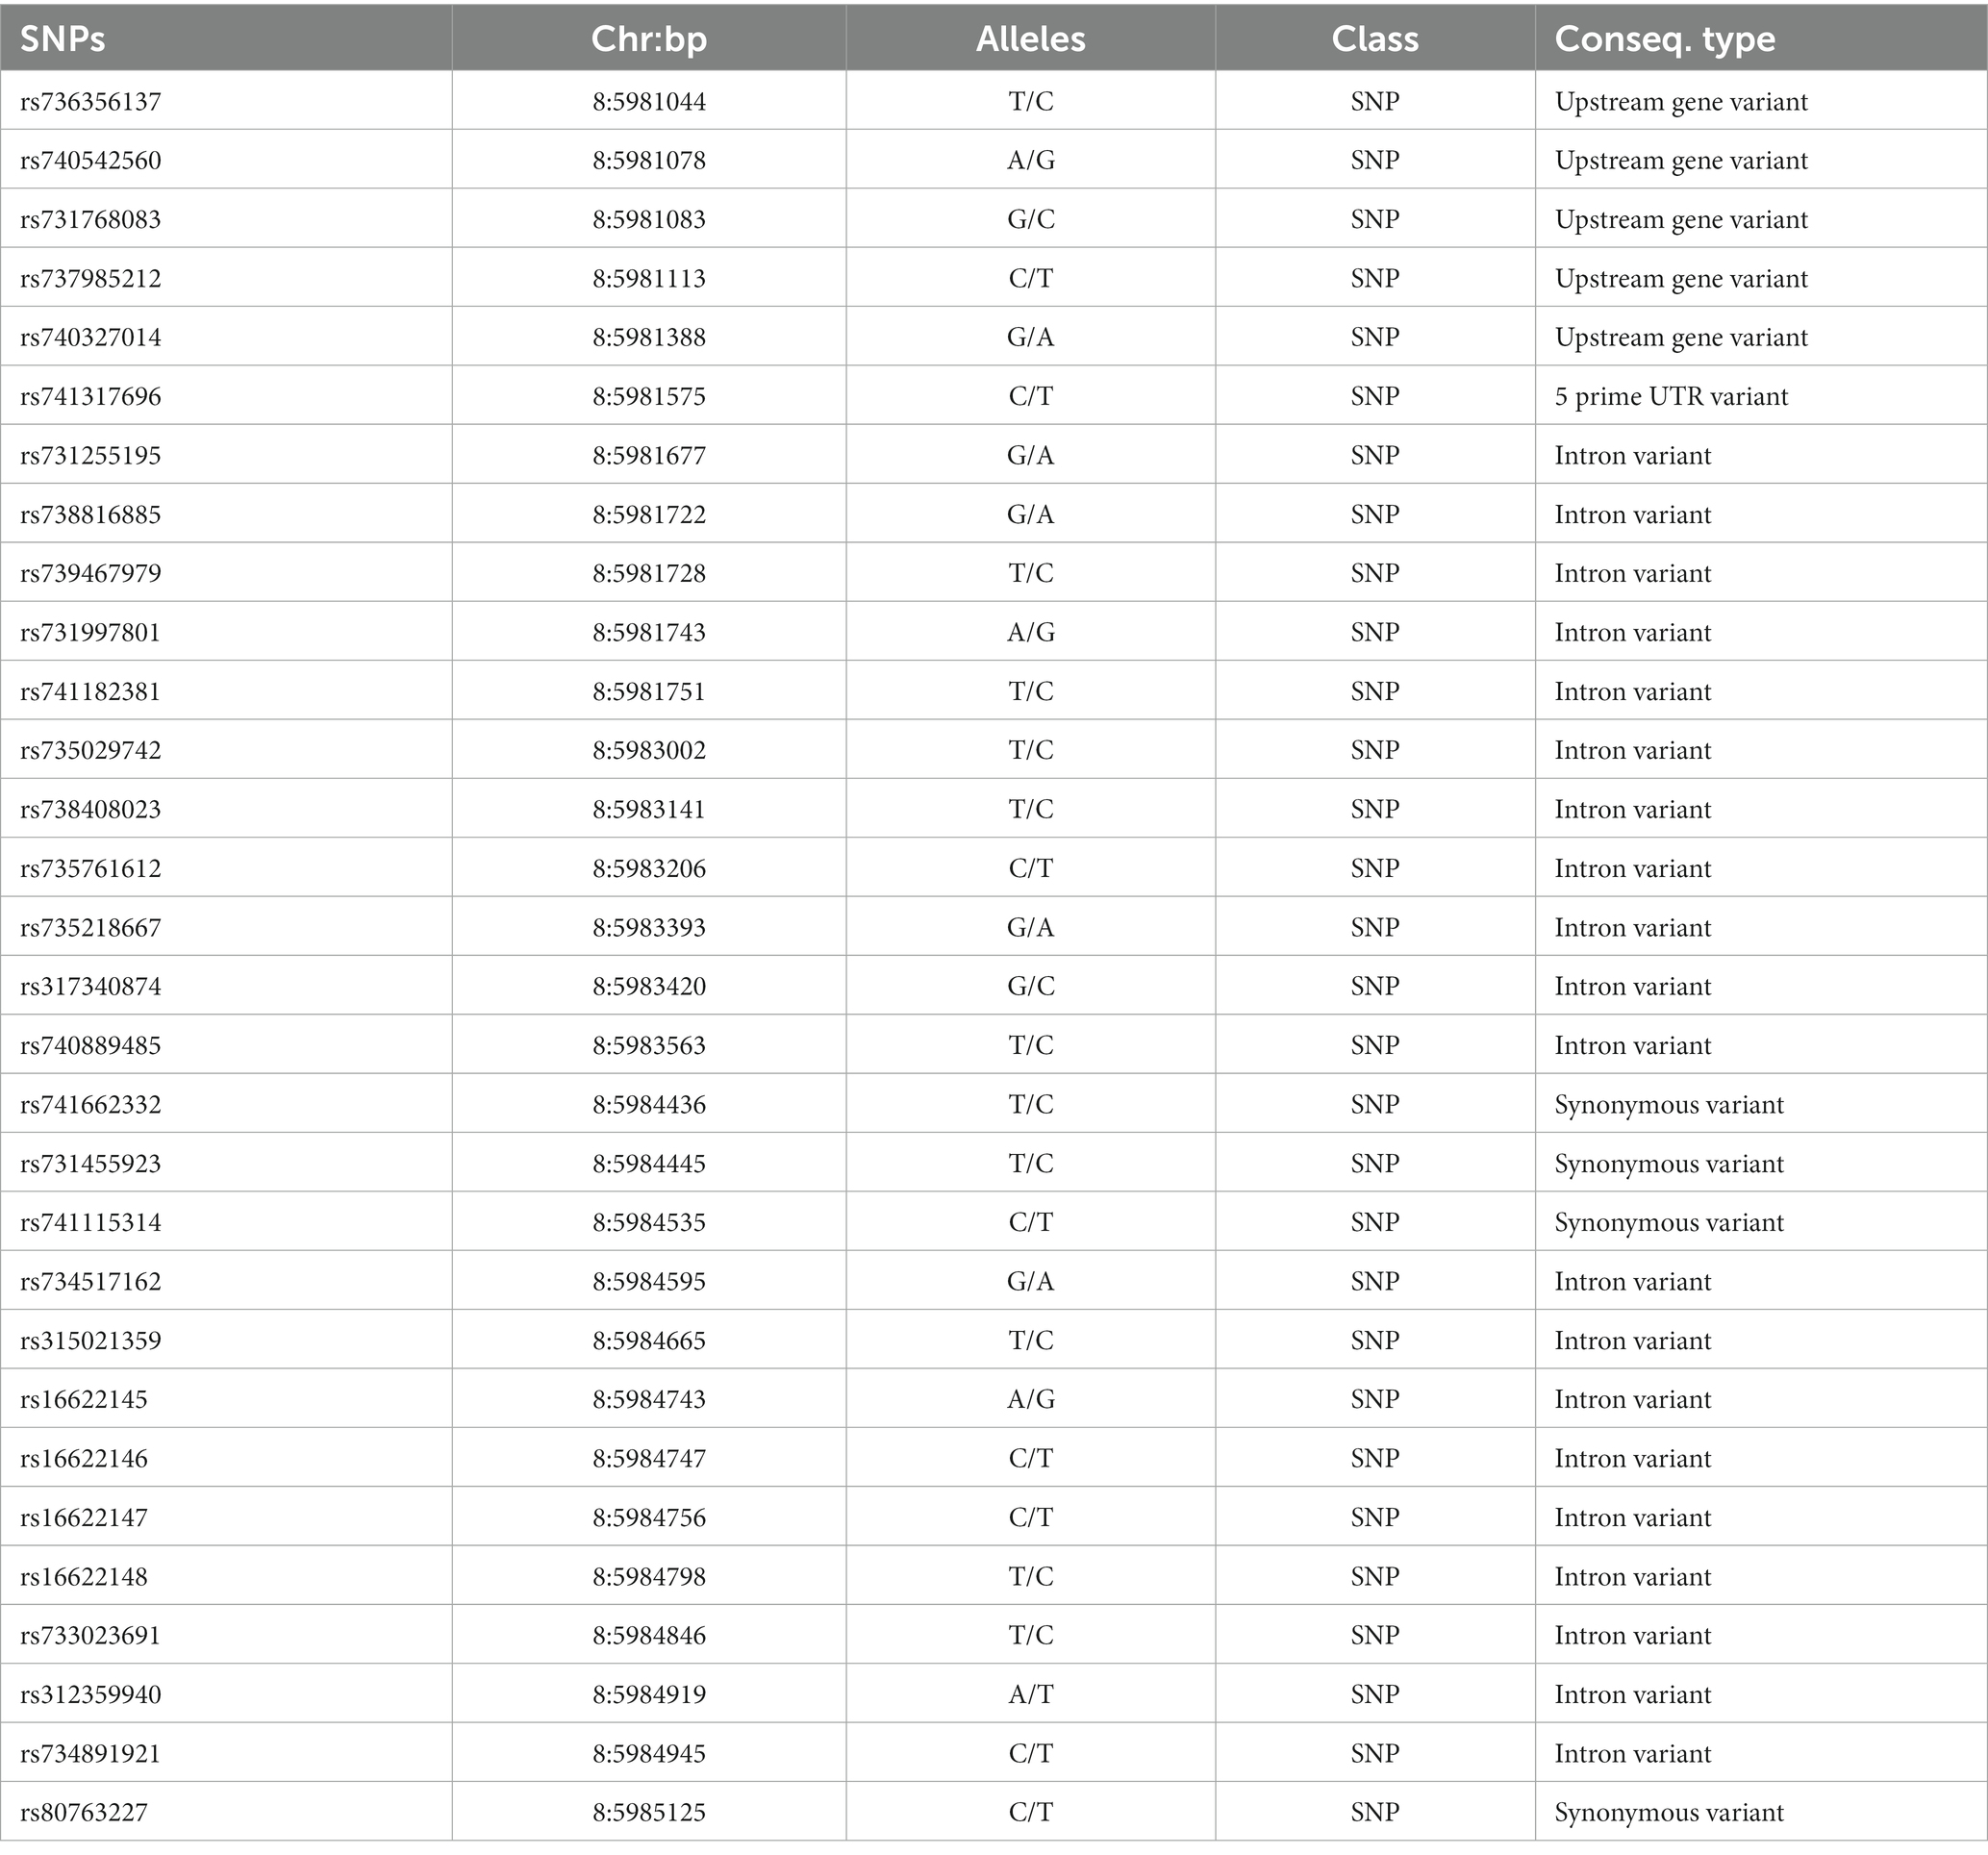
Table 2. Details of SNPs.
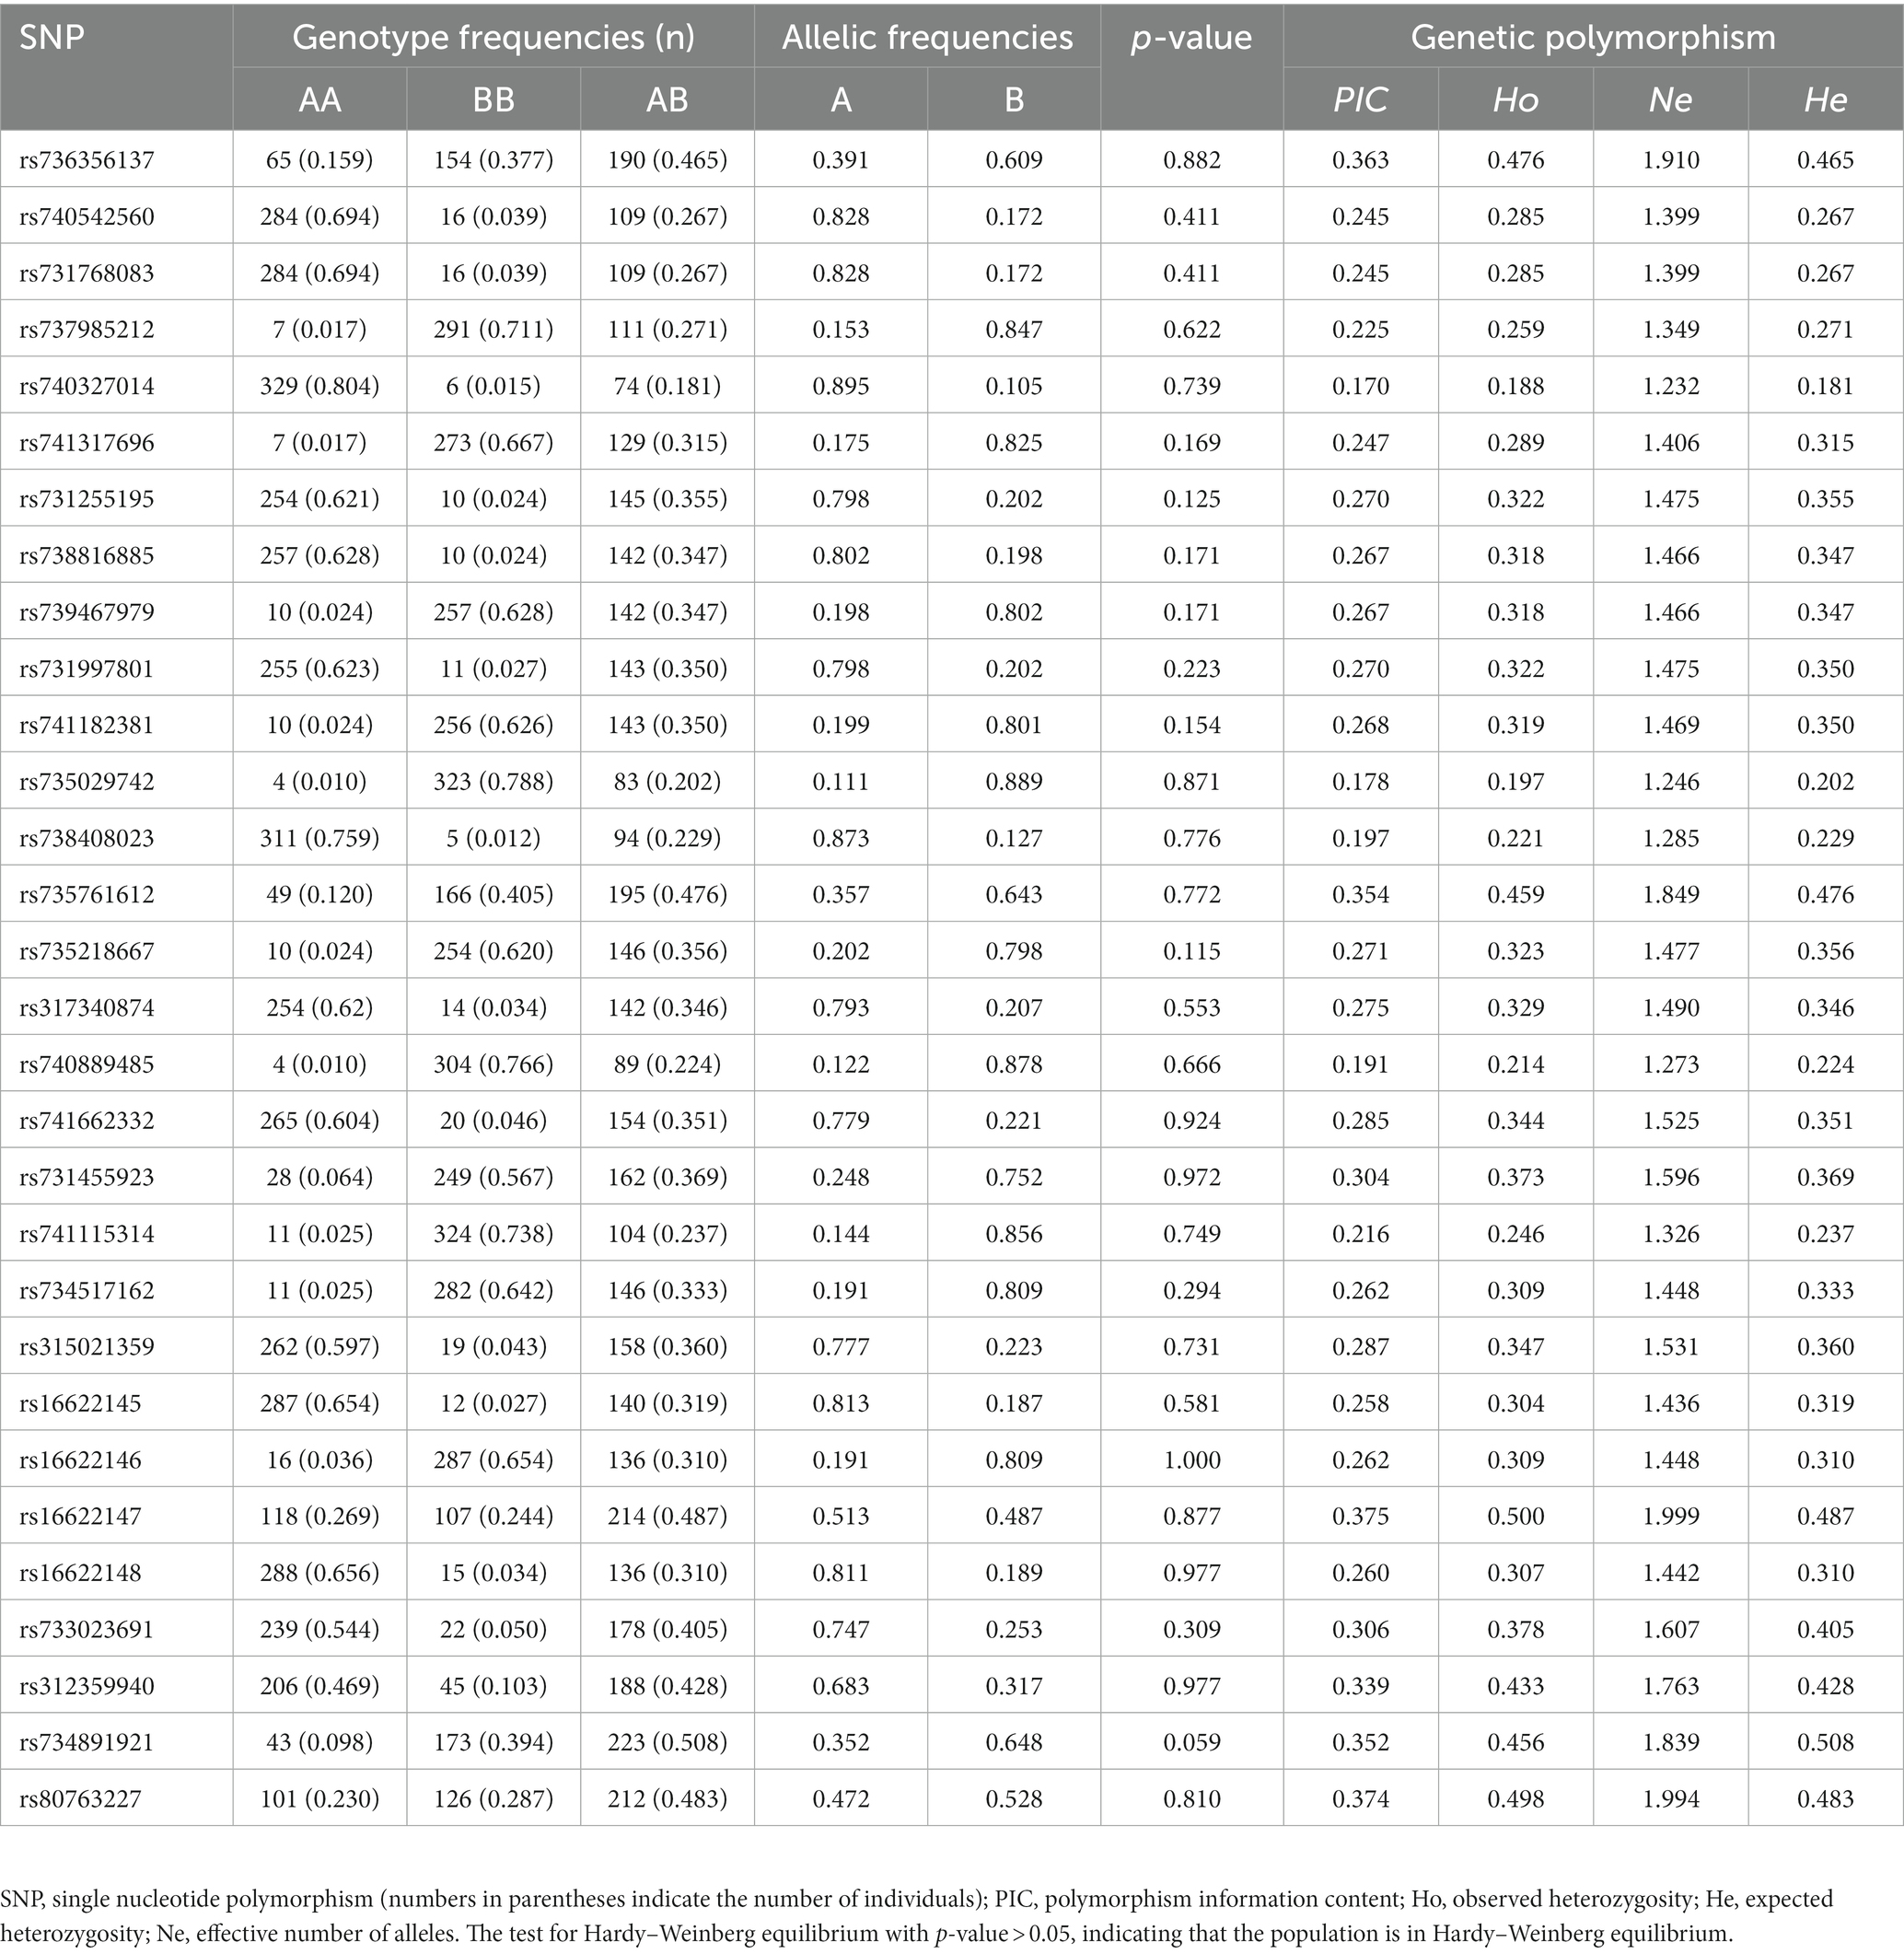
Table 3. Genotypes and allele frequencies and diversity parameters of SNPs in the RGS16.
3.3. Association between SNPs in RGS16 and chicken fat-related traits
To perform association analysis of genotypes with fat-related traits in chickens, the MLM package in IBM SPSS software was utilized. The full results of this analysis were listed in Supplementary Table 2. The SNPs significantly associated with one or more fat-related traits were shown in Table 4. In terms of ST, the CC and TC genotypes of both rs735029742 and rs731455923 were found to be significantly higher than the TT genotype (p < 0.05). Additionally, the TT genotype of rs738408023 was significantly higher than the TC genotype (p < 0.05). For AFW and AFR, the TT and TC genotypes were significantly higher than CC genotypes for rs741662332 and rs315021359, respectively, while the CC genotypes were significantly higher than TT and TC genotypes for rs733023691 (p < 0.05). The CC and TC genotypes of rs735761612 were found to have higher AFR than the TT genotype (p < 0.05), and the AA and AG genotypes of rs16622145 were found to have higher AFR than the GG genotype (p < 0.05).
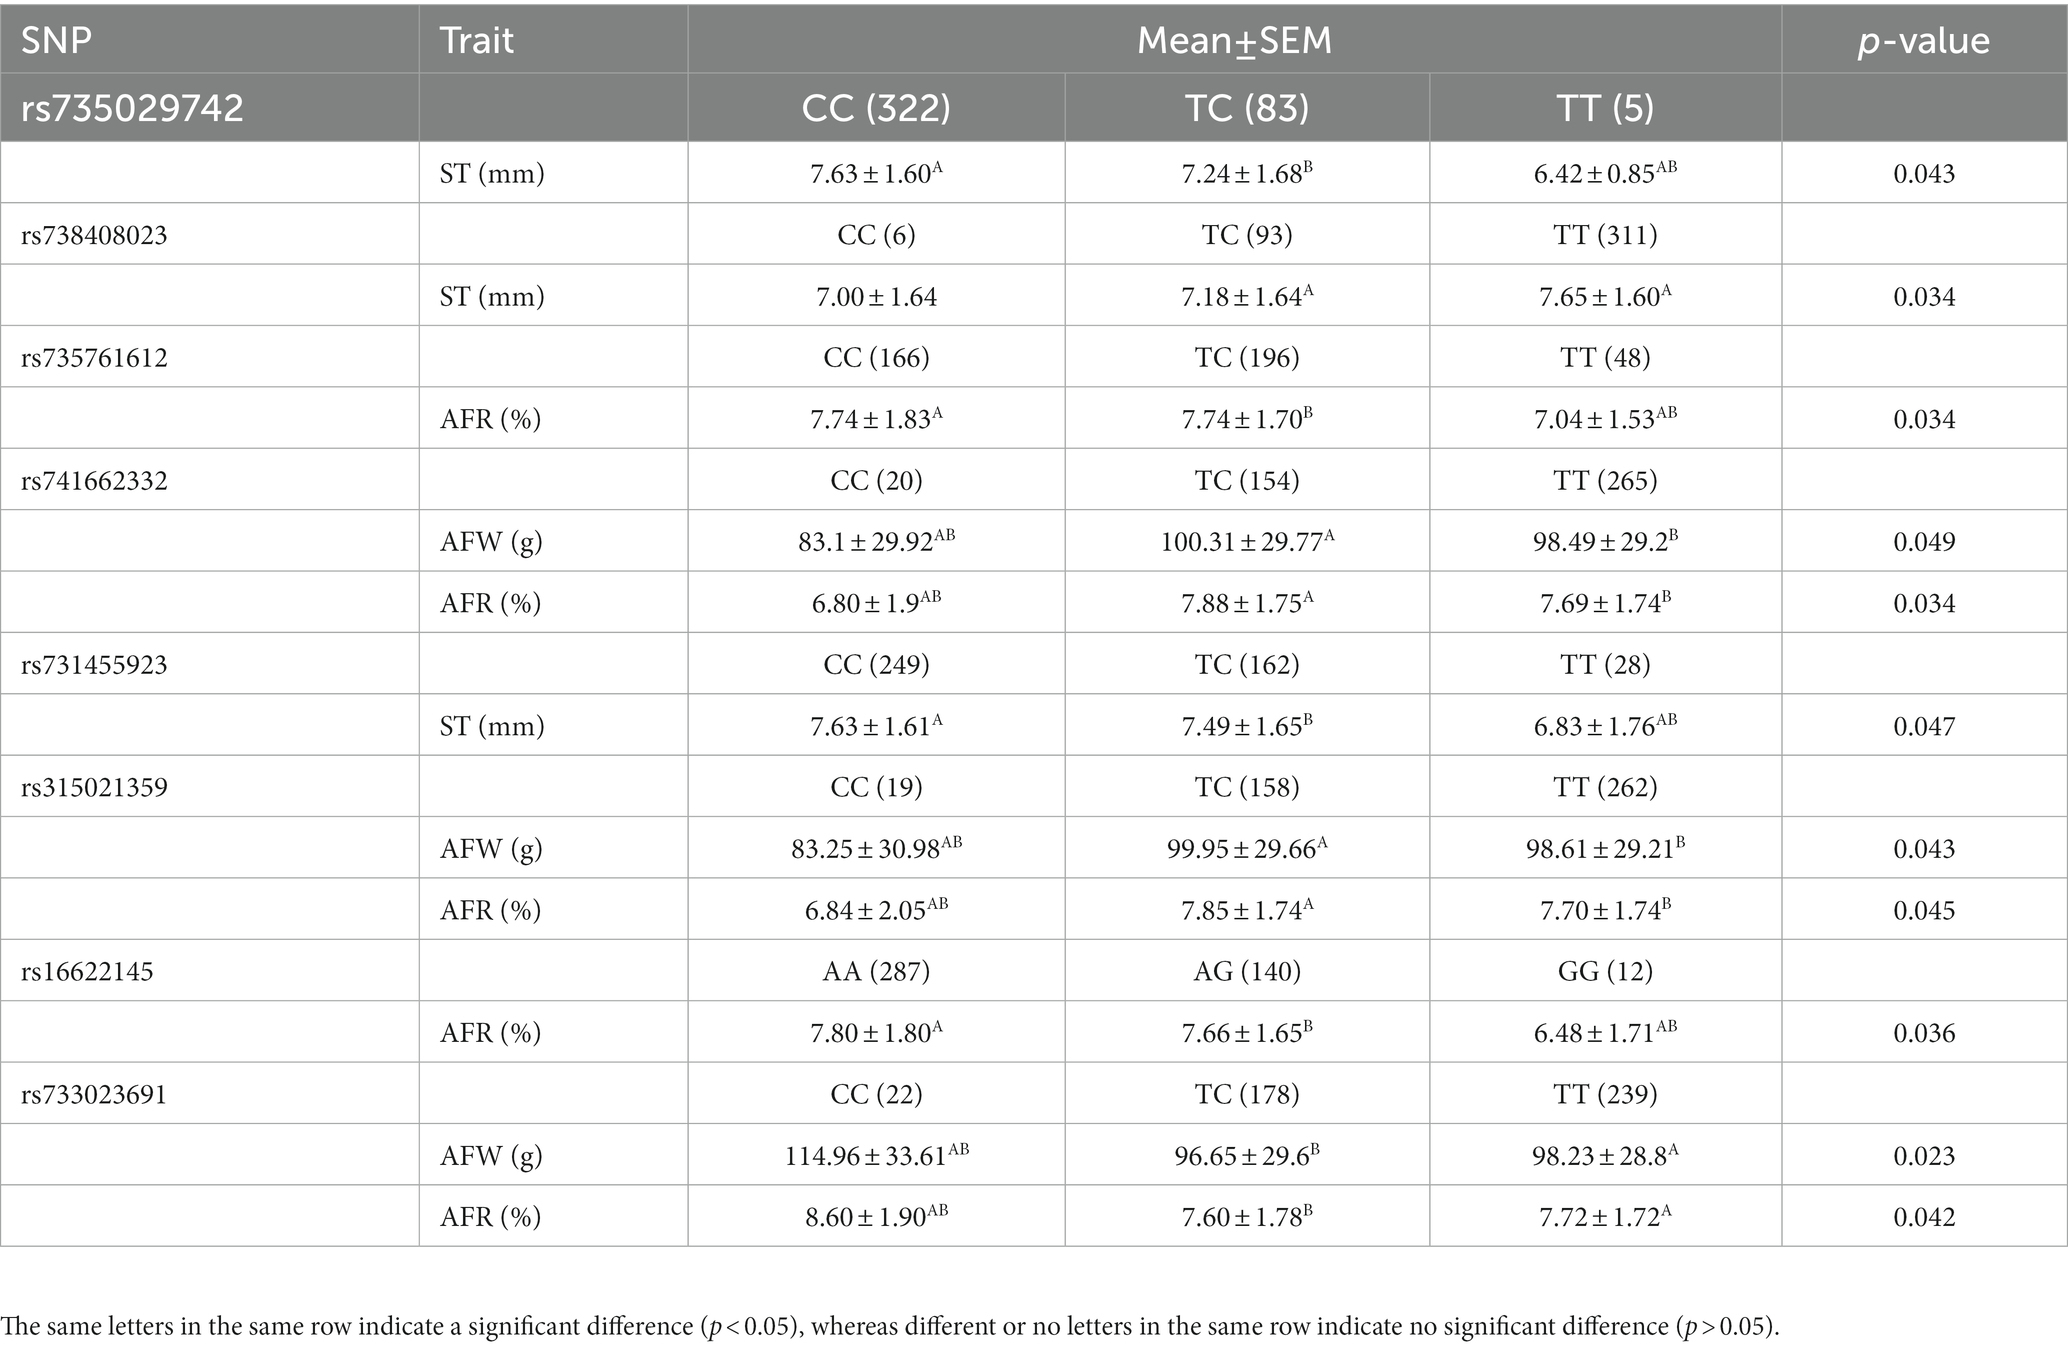
Table 4. Association of eight SNPs in RGS16 with fat-related traits in Wens Sanhuang chicken.
3.4. Linkage disequilibrium and haplotype analysis of the RGS16
To better understand the relationship between SNPs and fat-related traits, the eight SNPs significantly associated with fat-related traits were further analyzed for linkage disequilibrium (LD) using Haploview software (Figure 1C). The LD plot showed two haplotype blocks, with block 1 including rs735029742, rs738408023, and rs735761612, and block 2 including rs741662332, rs731455923, rs315021359, and rs16622145. All SNP pairs within each block had high LD values ranging from 0.93 to 1.00. Both blocks were analyzed using the MLM model in relation to three fat-related traits. Supplementary Table 3 showed that block 1 was not significantly associated with any traits, while block 2 was significantly associated with AFR and ST. Table 5 presented the traits and relevant data indicating a significant association with block 2 haplotypes. For AFR, both H3H3 and H4H4 genotypes were significantly lower than H1H1, H1H2, H1H3, H1H4, H2H3, and H4H3 (p < 0.05). As for ST, both H2H2 and H3H3 genotypes were significantly lower than H1H1, H1H4, and H4H2 (p < 0.05). In addition, the H2H2 genotype was significantly lower than H1H3 (p < 0.05). These associations demonstrated that RGS16 may have a potential role in regulating chicken fat deposition.
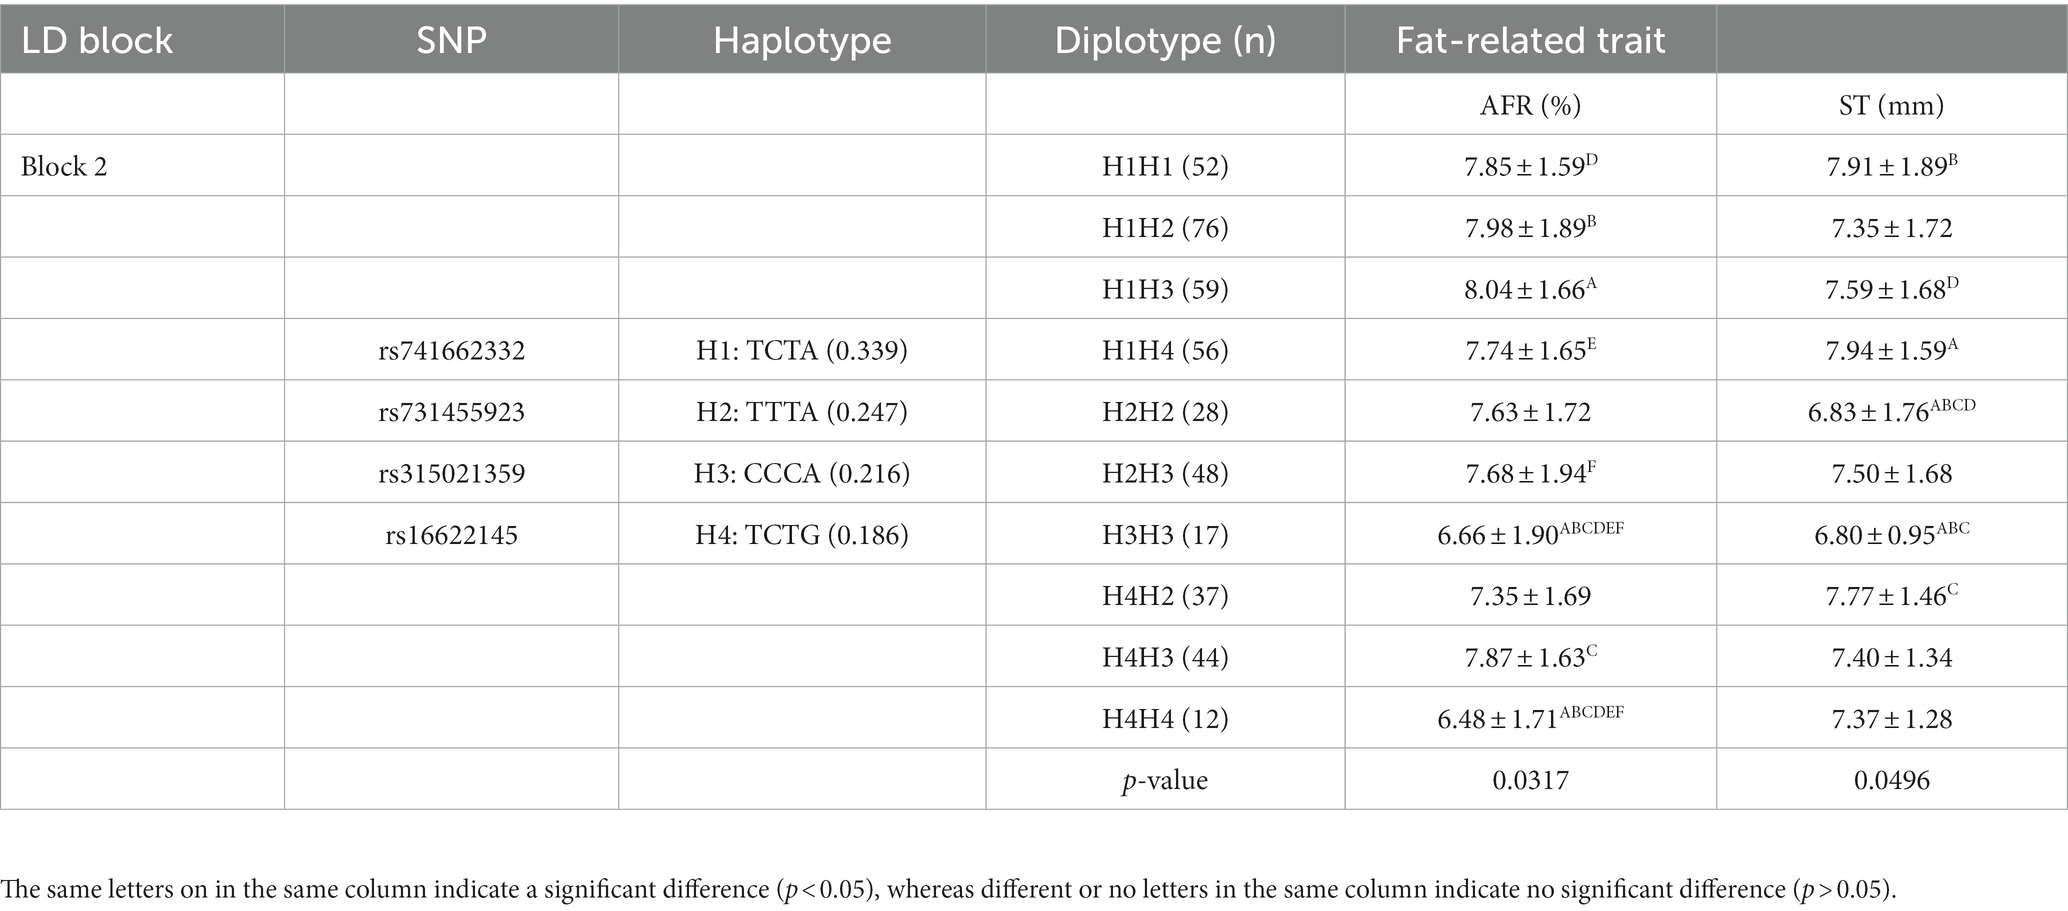
Table 5. Association analysis of blocks with fat-related traits in Wens Sanhuang chicken.
3.5. RGS16 inhibits preadipocyte proliferation
In our previous study, we found that RGS16 was highly expressed in individuals with high level of abdominal fat (accession ID: PRJNA656618). Here, the RGS16 mRNA level difference between high- and low-fat groups was verified using RT-qPCR (Figure 2A). To investigate the function of RGS16 in preadipocytes, ICP-1 cells were transfected with the RGS16 overexpression plasmid and siRNA. The RT-qPCR results showed that the expression of RGS16 mRNA could be upregulated by more than 400 times and knocked down by about 40%, respectively (Figures 2B,C). CCK-8 assay was performed to measure the proliferation viability of ICP-1 cells after 12-, 24-, 36-, and 48-h transfection. From these data, it is evident that RGS16 overexpression significantly inhibits cell proliferation at 24 and 48 h, whereas RGS16 knockdown significantly promotes cell proliferation at 36 h (Figures 2D,E). To further assess the function of RGS16, the cell cycle phase was detected using flow cytometry after 48-h transfection. The results showed that the overexpression of RGS16 prolongs the G1 phase, preventing cells from entering the S phase and inhibiting their proliferation (Figures 2F,G). Furthermore, we also detected the mRNA levels of several cell-cycle-associated genes, CCNE1, CCNA1, and CCND1 using RT-qPCR and found that the overexpression of RGS16 significantly inhibits the expression of CCNA1, CCNE1, and CCND1, while RGS16 knockdown had the opposite effect, revealing its inhibitory effect on cell proliferation (Figures 2H,I). We performed an EdU assay to verify this conclusion. Forty-eight h after transfection, EdU staining was detected using flow cytometry, and the results showed that the proportion of EdU-stained cells significantly decreases with RGS16 overexpression and increases with RGS16 knockdown (Figures 2J–M). All of the above experimental results indicated that RGS16 is able to inhibit preadipocyte proliferation.
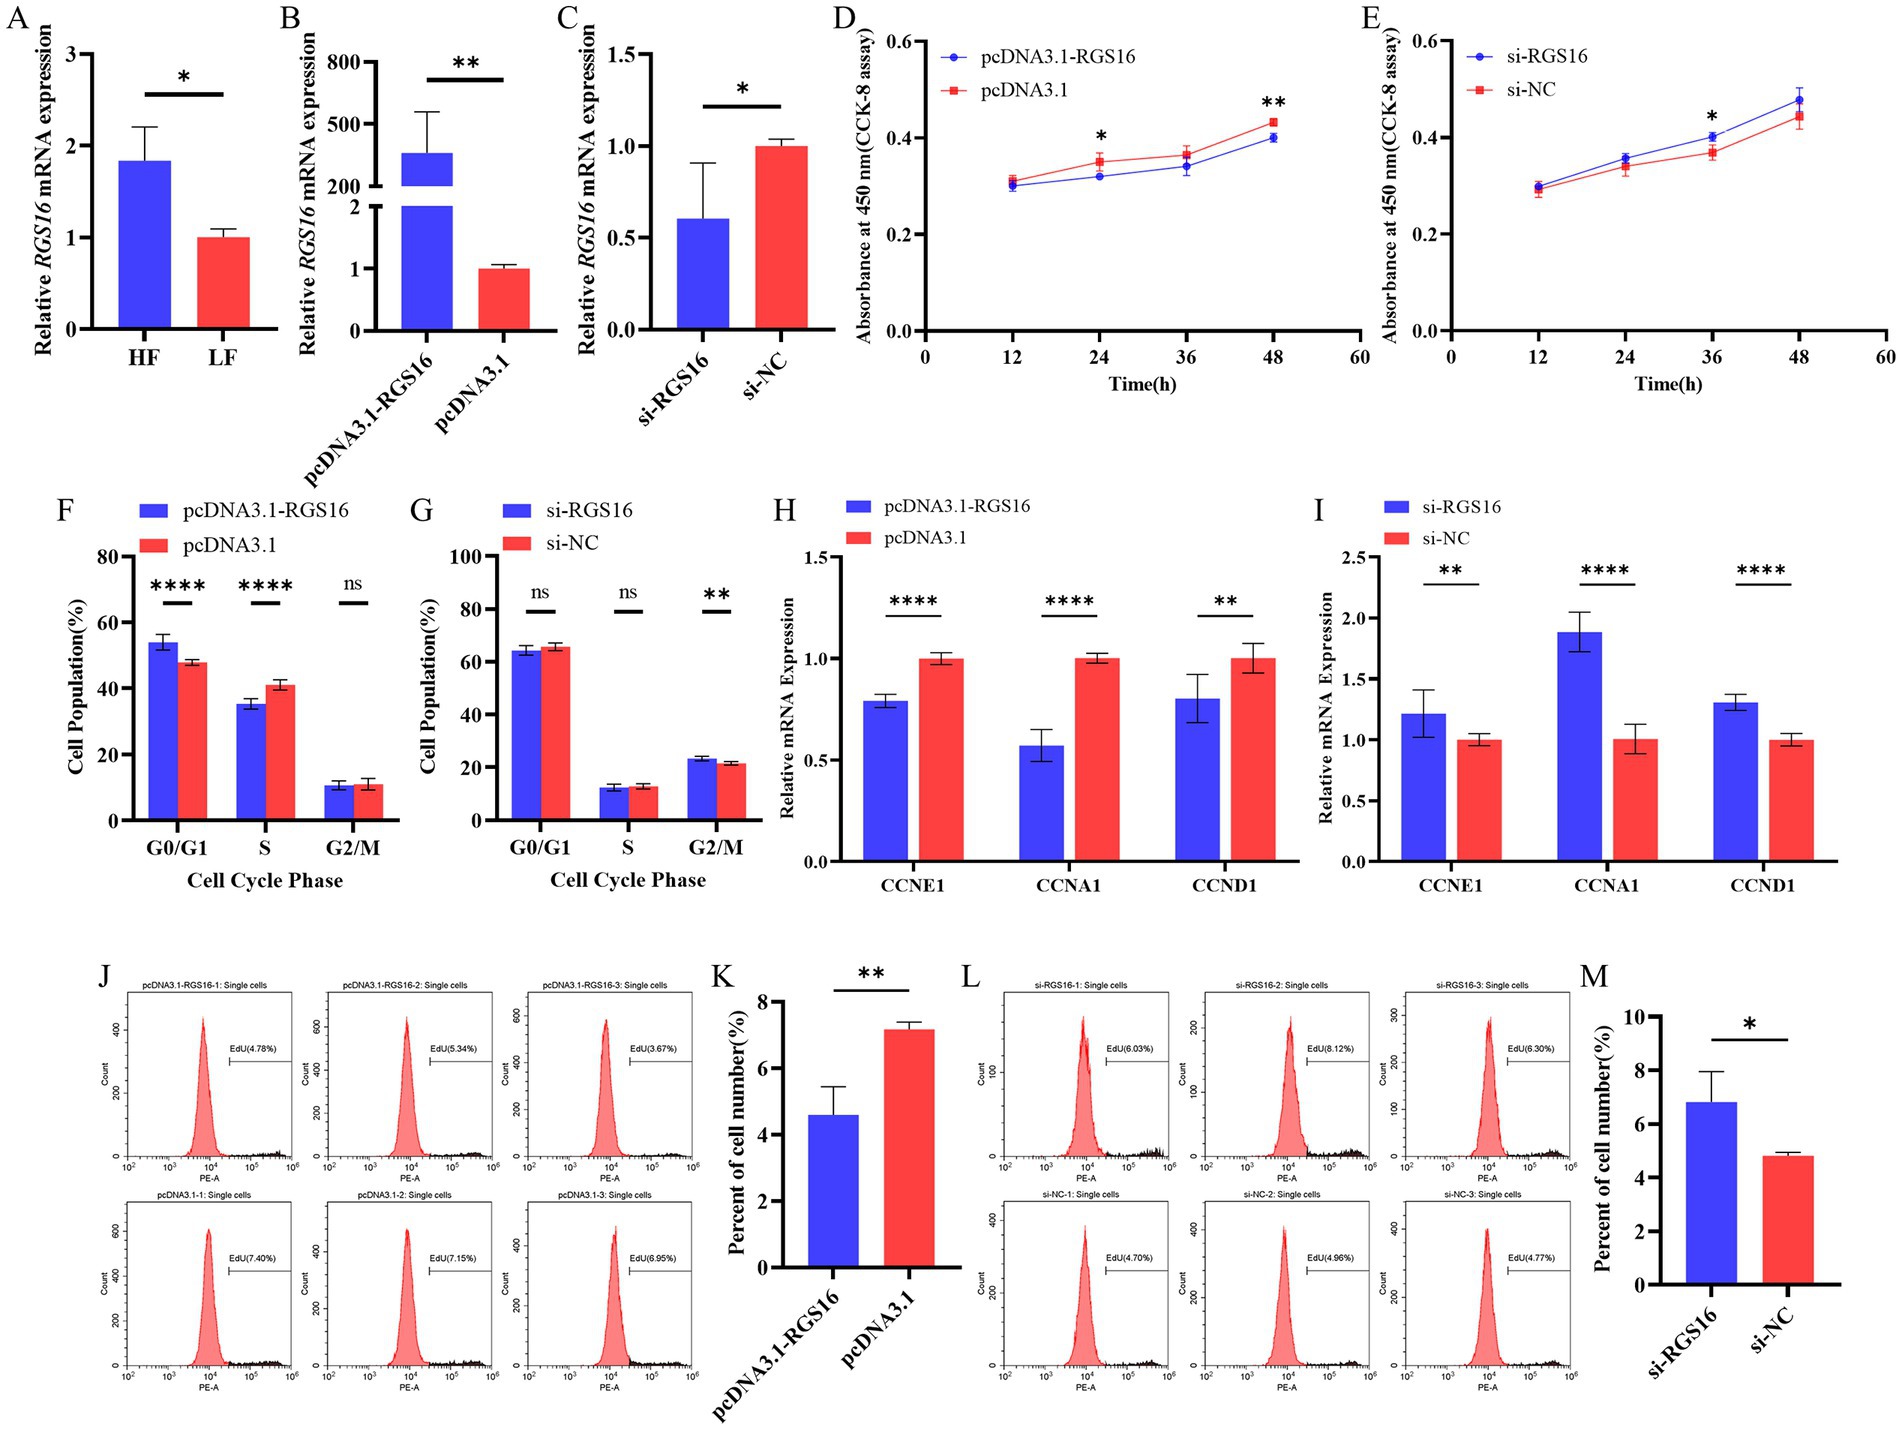
Figure 2. Regulation of preadipocyte proliferation by RGS16. (A) Differential expression of RGS16 mRNA in the abdominal fat of high-fat and low-fat chickens measured by RT-qPCR (n = 6 per group). (B,C) RGS16 mRNA expression levels in ICP-1 cells overexpressing or with knockdown of RGS16 (n = 6 per group). (D,E) CCK-8 assay to assess the effect of RGS16 overexpression or knockdown on ICP-1 cell viability (n = 4 per group). (F,G) Cell cycle analysis of ICP-1 cells 48 h after RGS16 overexpression or knockdown (n = 6 per group). (H,I) Expression of cell cycle genes in ICP-1 cells with RGS16 overexpression and knockdown detected by RT-qPCR (n = 6 per group). (J–M) ICP-1 cell cycle analysis using the flow cytometry EdU assay 48 h after transfection with the RGS16 overexpression vector or siRNA (n = 3 per group). * Denotes statistical significance with * < 0.05; ** < 0.01; *** < 0.001; **** < 0.0001.
3.6. RGS16 promotes preadipocyte differentiation
In addition, we hypothesized that RGS16 may be involved in regulating the process of chicken preadipocyte differentiation, based on its mRNA level difference between high- and low-fat individuals. ICP-1 differentiation was induced with 80 μM sodium oleate, and cells were collected at five different time points (12, 24, 36, 48, and 60 h) for RNA extraction. Interestingly, we found that RGS16 expression was significantly increased during ICP-1 cell differentiation (Figure 3A). The cells were collected for RNA extraction after 48-h RGS16 overexpression and RGS16 knock down, and RT-qPCR was performed to detect the expression level of genes associated with preadipocyte differentiation (including PPARγ, CEBPβ, and APOA1). The RT-qPCR results showed that RGS16 overexpression increases the expression of preadipocyte differentiation-related genes, whereas RGS16 knockdown decreases their expression (Figures 3B,C). After 12 h of transfection, the cells were induced in 80 μM sodium oleate medium for 48 h and stained with oil red O. The results show that RGS16 overexpression promotes lipid droplet formation, whereas RGS16 knockdown inhibits lipid droplet formation (Figures 3D–G). Our results demonstrated that RGS16 indeed is capable of driving preadipocyte differentiation and lipid droplet formation.
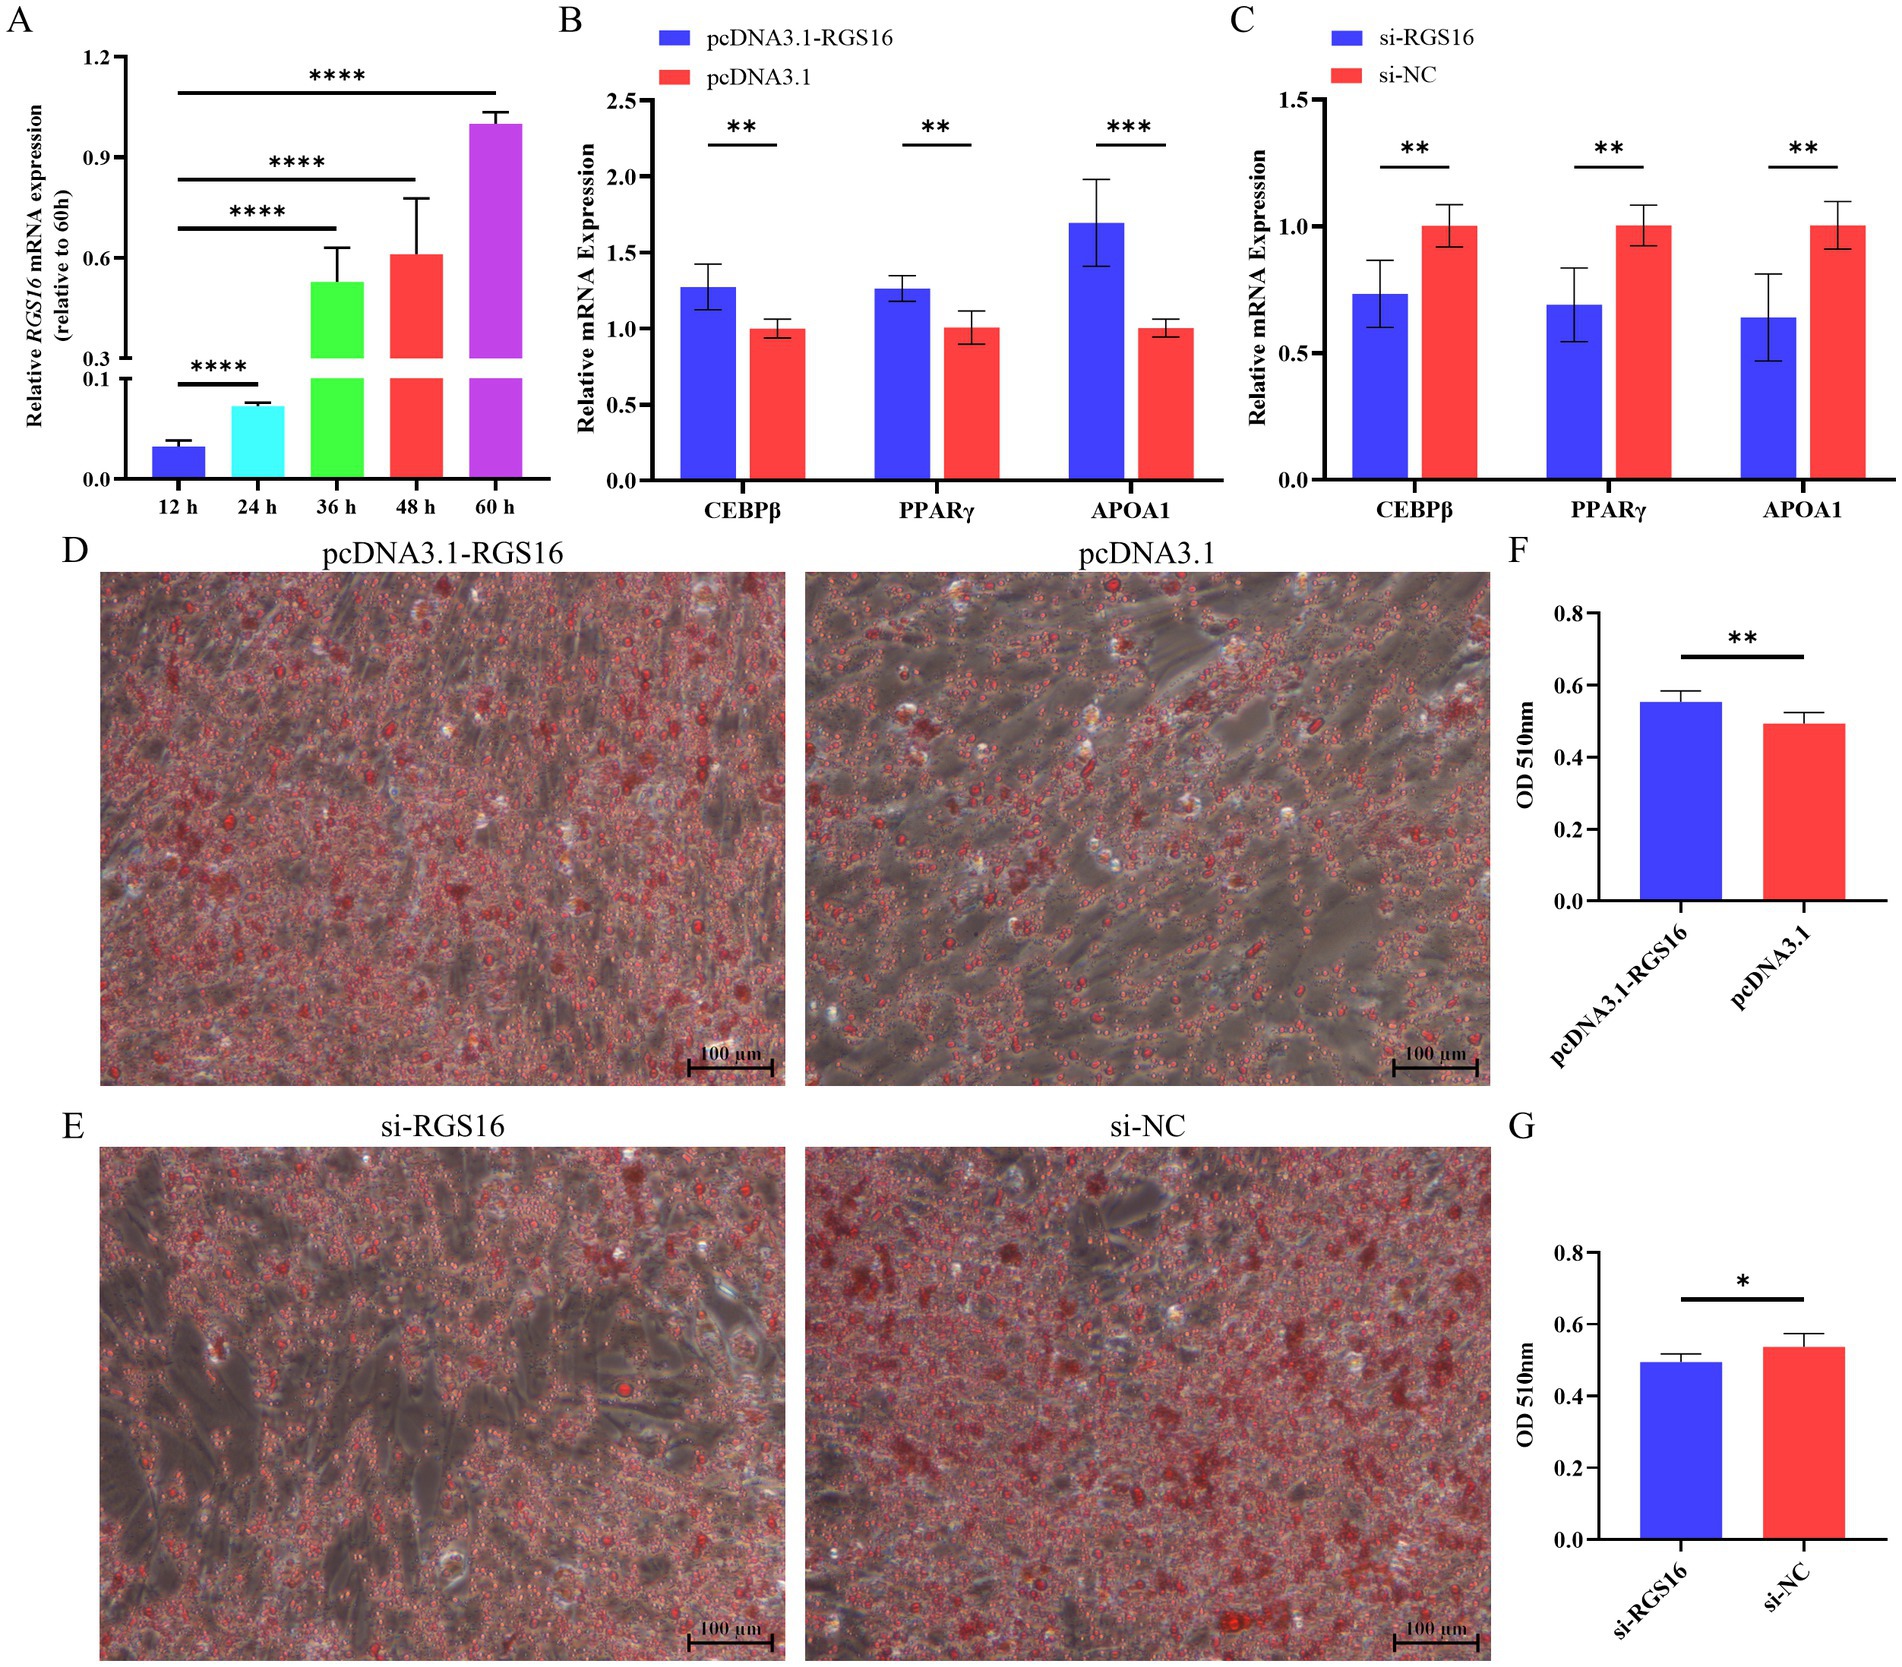
Figure 3. Regulation of preadipocyte differentiation by RGS16. (A) Expression of RGS16 mRNA at different time points during differentiation measured by RT-qPCR (n = 6 per group). (B,C) RT-qPCR analysis of preadipocyte differentiation-related gene expression in ICP-1 cells overexpressing or with knockdown of RGS16 (n = 6 per group). (D–G) Oil red O staining and quantification of cells on day 2 after transfection (n = 6 per group). * Denotes statistical significance with * < 0.05; ** < 0.01; *** < 0.001; **** < 0.0001.
4. Discussion
In this study, we conducted an association analysis between RGS16 polymorphisms and fat-related traits, and identified 8 SNPs that are significantly associated with fat-related traits. In addition, we also have concluded that RGS16 plays an important role in regulating abdominal fat deposition with the mechanism by promoting the differentiation of ICP-1 cells.
With the continuous advancement of technology, molecular marker-assisted breeding has become one of the technologies that has attracted attention and application in the field of poultry production. This technology utilizes molecular marker techniques and principles of genetics to quickly and accurately screen poultry breeds with excellent genetic characteristics, avoiding the tedious breeding process and long feeding cycles involved in traditional breeding methods (11, 19). In this study, according to the Pearson correlation coefficient, we found a significant correlation between ST and AFW and AFR. This suggests that ST may be related to fat deposition, which is consistent with previous research findings (20). We conducted an analysis of the associations between RGS16 gene polymorphisms and fat-related traits. A total of 30 SNPs were identified, out of which eight SNPs (rs735029742, rs738408023, rs735761612, rs741662332, rs731455923, rs315021359, rs16622145, and rs733023691) were found to be significantly associated with fat-related traits, such as AFW, AFR, and ST. Through association analysis, it was found that individuals carrying the RGS16 with the TT genotype of rs735029742, the CC genotype of rs738408023, and the TT genotype of rs731455923 exhibited lower ST. Individuals with the TT genotype of rs735761612 and the GG genotype of rs16622145 showed lower AFR. Individuals with the CC genotype of rs741662332, the CC genotype of rs3152021359, and the TC genotype of rs733023691 showed lower AFR and AFW. With broiler breeders now focusing on selecting individuals with low fat weight or low rates of fat, these SNP genotypes could serve as molecular markers for improving fat-related traits in the Wens Sanhuang Chicken.
Synonymous mutations are associated with specific diseases or traits in multiple cases. When a cluster of infrequently used codons shifts from frequent codons to rare ones, it can affect the timing of co-translational folding and lead to changes in protein function (21–23). In this study, we identified four SNPs in the coding region of the RGS16 gene, namely rs741662332, rs731455923, rs741115314, and rs80763227. However, these sites do not alter the amino acid sequence, which are also known as synonymous mutations. Although we could not directly observe the effects of synonymous mutations, we could infer that they may have an impact on these traits from the analysis of the effects of different genotypes of the synonymous SNP rs731455923 and rs315021359 on abdominal fat-related traits. In addition, we found that 6 SNPs in the intronic region of the RGS16 gene are significantly associated with adiposity-related traits. It should be noted that compared to SNPs in the coding region, the functional effects of SNPs in the intronic region were often more complex and difficult to predict. Specifically, intronic SNPs may affect the structure and function of RNA molecules, such as affecting splice site selection, regulating splicing efficiency, and influencing RNA stability and translation efficiency, which in turn affect protein expression and function (24–26). Haplotypes can often provide more information than a single SNP, as the phenotype of animals can be affected by multiple mutations (27). Subsequently, we used Haploview software to analyze the above eight SNPs for link-age disequilibrium. The finding that block 2 (rs741662332, rs731455923, rs315021359, and rs16622145) is related with AFR and ST offers strong evidence supporting the use of these SNPs as markers in breeding.
Adipogenesis and lipogenesis are regulated by a complex network of transcription factors that function at different stages of differentiation (28, 29). Peroxisome proliferator-activated receptor γ (PPARγ) and members of the CCAAT/enhancer-binding protein (C/EBP) family are key regulators of this process (13, 30, 31). As one of the three subtypes of the PPAR subfamily, PPARγ regulates the lipogenesis of all adipocytes and binds to thousands of loci during the differentiation of white adipocytes (32, 33). It has been reported that PPARγ is highly expressed in high-fat chickens and that its expression increases during preadipocyte differentiation (34, 35). It has also been demonstrated that C/EBPβ activates the expression of C/EBPα and PPARγ through synergy with C/EBPδ to complete the adipocyte differentiation process (30, 36, 37). The characteristics of fat deposition differ between birds and mammals, where the main site of lipid biosynthesis is the liver or adipose tissue, respectively (38–40). APOA1 is a component of high-density lipoprotein (HDL), a molecule that transports cholesterol and phospholipids from other parts of the body through the bloodstream to the liver (41, 42). In this study, we demonstrated that RGS16 overexpression in ICP-1 cells significantly increases the expression of PPARγ, APOA1, and C/EBPβ and promotes lipid droplet formation. At the same time, we found that the expression of RGS16 in ICP-1 cells in-creases with an increasing duration of differentiation. These results demonstrate that RGS16 may promote the differentiation of preadipocytes in influencing adipogenesis.
5. Conclusion
In summary, RGS16 regulates abdominal lipid deposition by promoting ICP-1 cell differentiation and inhibiting ICP-1 cell proliferation. Eight RGS16 SNPs were found to be significantly associated with fat-related traits, including AFW, AFR, and ST, in the Wens Sanhuang chicken population. Of the identified SNPs, rs73145592 and rs315021359 were situated within coding region, while the remaining six polymorphisms (rs735029742, rs738408023, rs735761612, rs741662332, rs16622145, and rs733023691) were located within the intronic region of RGS16. Furthermore, the haplotypes within the LD block were found to be significantly associated with AFR and ST. Finally, the findings our current study indicate that RGS16 may play a significant role in the mechanism of abdominal fat accumulation in chickens. Therefore, it could be considered as a potential molecular marker to aid in the selection of broilers during breeding to improve their traits related to fat deposition.
Data availability statement
The original contributions presented in the study are included in the article/Supplementary material, further inquiries can be directed to the corresponding author.
Author contributions
MY and ZF: conceptualization. MY, QL, and SZ: methodology. MY: software, formal analysis, resources, data curation, writing—original draft preparation, and visualization. MY, KL, and YX: validation. ZF: investigation. LG and QL: writing—review and editing. QL: supervision, project administration, and funding acquisition. All authors have read and agreed to the published version of the manuscript.
Funding
Funding for this project was provided by several sources, including the Key-Area Research and Development Program of Guangdong Province (2022B0202100002), the Guangdong Province Modern Agricultural Industry Technology System Project (2022KJ128, 2023KJ128), the Science and Technology Program of Chaozhou City (202101ZD07), and the National Key Research and Development Program of China (2022YFF1000201).
Acknowledgments
We are very grateful to Li Hui from Northeast Agricultural University for providing us with ICP-1 cells.
Conflict of interest
The authors declare that the research was conducted in the absence of any commercial or financial relationships that could be construed as a potential conflict of interest.
Publisher’s note
All claims expressed in this article are solely those of the authors and do not necessarily represent those of their affiliated organizations, or those of the publisher, the editors and the reviewers. Any product that may be evaluated in this article, or claim that may be made by its manufacturer, is not guaranteed or endorsed by the publisher.
Supplementary material
The Supplementary material for this article can be found online at: https://www.frontiersin.org/articles/10.3389/fvets.2023.1180797/full#supplementary-material
Footnotes
References
1. Renehan, AG, Tyson, M, Egger, M, Heller, RF, and Zwahlen, M. Body-mass index and incidence of cancer: a systematic review and meta-analysis of prospective observational studies. Lancet. (2008) 371:569–78. doi: 10.1016/S0140-6736(08)60269-X
2. Kivimäki, M, Kuosma, E, Ferrie, JE, Luukkonen, R, Nyberg, ST, Alfredsson, L, et al. Overweight, obesity, and risk of cardiometabolic multimorbidity: pooled analysis of individual-level data for 120 813 adults from 16 cohort studies from the USA and Europe. Lancet Public Health. (2017) 2:e277–85. doi: 10.1016/S2468-2667(17)30074-9
3. Collaborators, GBDO, Afshin, A, Forouzanfar, MH, Reitsma, MB, Sur, P, Estep, K, et al. Health effects of overweight and obesity in 195 countries over 25 years. N Engl J Med. (2017) 377:13–27. doi: 10.1056/NEJMoa1614362
4. Huang, HY, Liu, RR, Zhao, GP, Li, QH, Zheng, MQ, Zhang, JJ, et al. Integrated analysis of microRNA and mRNA expression profiles in abdominal adipose tissues in chickens. Sci Rep. (2015) 5:16132. doi: 10.1038/srep16132
5. Nematbakhsh, S, Pei Pei, C, Selamat, J, Nordin, N, Idris, LH, and Abdull Razis, AF. Molecular regulation of lipogenesis, adipogenesis and fat deposition in chicken. Genes. (2021) 12:414. doi: 10.3390/genes12030414
6. Huang, J, Pashkov, V, Kurrasch, DM, Yu, K, Gold, SJ, and Wilkie, TM. Feeding and fasting controls liver expression of a regulator of G protein signaling (Rgs16) in periportal hepatocytes. Comp Hepatol. (2006) 5:8. doi: 10.1186/1476-5926-5-8
7. Alhosaini, K, Azhar, A, Alonazi, A, and Al-Zoghaibi, F. Gpcrs: the Most promiscuous druggable receptor of the mankind. Saudi Pharm J. (2021) 29:539–51. doi: 10.1016/j.jsps.2021.04.015
8. Gendaszewska-Darmach, E, Drzazga, A, and Koziolkiewicz, M. Targeting GPCRs activated by fatty acid-derived lipids in type 2 diabetes. Trends Mol Med. (2019) 25:915–29. doi: 10.1016/j.molmed.2019.07.003
9. Pashkov, V, Huang, J, Parameswara, VK, Kedzierski, W, Kurrasch, DM, Tall, GG, et al. Regulator of G protein signaling (RGS16) inhibits hepatic fatty acid oxidation in a carbohydrate response element-binding protein (ChREBP)-dependent manner. J Biol Chem. (2011) 286:15116–25. doi: 10.1074/jbc.M110.216234
10. Sae-Lee, C, Moolsuwan, K, Chan, L, and Poungvarin, N. ChREBP regulates itself and metabolic genes implicated in lipid accumulation in beta-cell line. PLoS One. (2016) 11:e0147411. doi: 10.1371/journal.pone.0147411
11. Zhou, Z, Cai, D, Wei, G, Cai, B, Kong, S, Ma, M, et al. Polymorphisms of CRELD1 and DNAJC30 and their relationship with chicken carcass traits. Poult Sci. (2023) 102:102324. doi: 10.1016/j.psj.2022.102324
12. He, S, Ren, T, Lin, W, Yang, X, Hao, T, Zhao, G, et al. Identification of candidate genes associated with skin yellowness in yellow chickens. Poult Sci. (2023) 102:102469. doi: 10.1016/j.psj.2022.102469
13. Chao, X, Guo, L, Wang, Q, Huang, W, Liu, M, Luan, K, et al. miR-429-3p/LPIN1 Axis promotes chicken abdominal fat deposition via PPARγ pathway. Front Cell Dev Biol. (2020) 8:595637. doi: 10.3389/fcell.2020.595637
14. Guo, LJ, Huang, WL, Zhang, SY, Huang, YL, Xu, YB, Wu, RQ, et al. Chicken protein S gene regulates adipogenesis and affects abdominal fat deposition. Animals. (2022) 12:2046. doi: 10.3390/ani12162046
15. Li, ZH, Zheng, M, Mo, JW, Li, K, Yang, X, Guo, LJ, et al. Single-cell RNA sequencing of preadipocytes reveals the cell fate heterogeneity induced by melatonin. J Pineal Res. (2021) 70:e12725. doi: 10.1111/jpi.12725
16. Zhang, J, Cai, BL, Ma, MT, Kong, SF, Zhou, Z, Zhang, XQ, et al. LncRNA SMARCD3-OT1 promotes muscle hypertrophy and fast-twitch fiber transformation via enhancing SMARCD3X4 expression. Int J Mol Sci. (2022) 23:4510. doi: 10.3390/ijms23094510
17. Stephens, M, Smith, NJ, and Donnelly, P. A new statistical method for haplotype reconstruction from population data. Am J Hum Genet. (2001) 68:978–89. doi: 10.1086/319501
18. Stephens, M, and Scheet, P. Accounting for decay of linkage disequilibrium in haplotype inference and missing-data imputation. Am J Hum Genet. (2005) 76:449–62. doi: 10.1086/428594
19. Cui, HX, Shen, QC, Zheng, MQ, Su, YC, Cai, RC, Yu, Y, et al. A selection method of chickens with blue-eggshell and dwarf traits by molecular marker-assisted selection. Poult Sci. (2019) 98:3114–8. doi: 10.3382/ps/pez069
20. Yang, Z, Asare, E, Yang, Y, Yang, JJ, Yang, HM, and Wang, ZY. Dietary supplementation of betaine promotes lipolysis by regulating fatty acid metabolism in geese. Poult Sci. (2021) 100:101460. doi: 10.1016/j.psj.2021.101460
21. Kimchi-Sarfaty, C, Oh, JM, Kim, IW, Sauna, ZE, Calcagno, AM, Ambudkar, SV, et al. A “silent” polymorphism in the MDR1 gene changes substrate specificity. Science. (2007) 315:525–8. doi: 10.1126/science.1135308
22. Komar, AA. Silent SNPs: impact on gene function and phenotype. Pharmacogenomics. (2007) 8:1075–80. doi: 10.2217/14622416.8.8.1075
23. Sauna, ZE, and Kimchi-Sarfaty, C. Understanding the contribution of synonymous mutations to human disease. Nat Rev Genet. (2011) 12:683–91. doi: 10.1038/nrg3051
24. Jo, BS, and Choi, SS. Introns: the functional benefits of introns in genomes. Genomics Inform. (2015) 13:112–8. doi: 10.5808/GI.2015.13.4.112
25. Wang, D, Guo, Y, Wrighton, SA, Cooke, GE, and Sadee, W. Intronic polymorphism in CYP3A4 affects hepatic expression and response to statin drugs. Pharmacogenomics J. (2011) 11:274–86. doi: 10.1038/tpj.2010.28
26. Jacobsson, JA, Schioth, HB, and Fredriksson, R. The impact of Intronic single nucleotide polymorphisms and ethnic diversity for studies on the obesity gene FTO. Obes Rev. (2012) 13:1096–109. doi: 10.1111/j.1467-789X.2012.01025.x
27. Liu, NJ, Zhang, K, and Zhao, HY. Haplotype-association analysis. Adv Genet. (2008) 60:335–405. doi: 10.1016/S0065-2660(07)00414-2
28. Guo, L, Chao, X, Huang, W, Li, Z, Luan, K, Ye, M, et al. Whole transcriptome analysis reveals a potential regulatory mechanism of LncRNA-FNIP2/miR-24-3p/FNIP2 axis in chicken adipogenesis. Front Cell Dev Biol. (2021) 9:653798. doi: 10.3389/fcell.2021.653798
29. Lefterova, MI, Haakonsson, AK, Lazar, MA, and Mandrup, S. PPARγ and the global map of Adipogenesis and beyond. Trends Endocrinol Metab. (2014) 25:293–302. doi: 10.1016/j.tem.2014.04.001
30. Tanaka, T, Yoshida, N, Kishimoto, T, and Akira, S. Defective adipocyte differentiation in mice lacking the C/EBPbeta and/or C/EBPdelta gene. EMBO J. (1997) 16:7432–43. doi: 10.1093/emboj/16.24.7432
31. Nielsen, R, Pedersen, TA, Hagenbeek, D, Moulos, P, Siersbaek, R, Megens, E, et al. Genome-wide profiling of Ppargamma: RXR and RNA polymerase ii occupancy reveals temporal activation of distinct metabolic pathways and changes in RXR dimer composition during adipogenesis. Genes Dev. (2008) 22:2953–67. doi: 10.1101/gad.501108
32. Kawai, M, and Rosen, CJ. Ppargamma: a circadian transcription factor in adipogenesis and osteogenesis. Nat Rev Endocrinol. (2010) 6:629–36. doi: 10.1038/nrendo.2010.155
33. Lefterova, MI, Zhang, Y, Steger, DJ, Schupp, M, Schug, J, Cristancho, A, et al. Ppargamma and C/EBP factors orchestrate adipocyte biology via adjacent binding on a genome-wide scale. Genes Dev. (2008) 22:2941–52. doi: 10.1101/gad.1709008
34. Sun, YN, Gao, Y, Qiao, SP, Wang, SZ, Duan, K, Wang, YX, et al. Epigenetic DNA methylation in the promoters of peroxisome proliferator-activated receptor gamma in chicken lines divergently selected for fatness. J Anim Sci. (2014) 92:48–53. doi: 10.2527/jas.2013-6962
35. Zhang, M, Li, F, Ma, XF, Li, WT, Jiang, RR, Han, RL, et al. Identification of differentially expressed genes and pathways between intramuscular and abdominal fat-derived preadipocyte differentiation of chickens in vitro. BMC Genomics. (2019) 20:743. doi: 10.1186/s12864-019-6116-0
36. Tang, QQ, Grønborg, M, Huang, HY, Kim, JW, Otto, TC, Pandey, A, et al. Sequential phosphorylation of CCAAT enhancer-binding protein β by MAPK and glycogen synthase kinase 3β is required for adipogenesis. Proc Natl Acad Sci U S A. (2005) 102:9766–71. doi: 10.1073/pnas.0503891102
37. Tang, QQ, Otto, TC, and Lane, MD. Ccaat/enhancer-binding protein beta is required for mitotic clonal expansion during adipogenesis. Proc Natl Acad Sci U S A. (2003) 100:850–5. doi: 10.1073/pnas.0337434100
38. Agbu, P, and Carthew, RW. microRNA-mediated regulation of glucose and lipid metabolism. Nat Rev Mol Cell Biol. (2021) 22:425–38. doi: 10.1038/s41580-021-00354-w
39. Han, CC, Wang, JW, Li, L, Wang, L, and Zhang, ZX. The role of LXR alpha in goose primary hepatocyte lipogenesis. Mol Cell Biochem. (2009) 322:37–42. doi: 10.1007/s11010-008-9937-8
40. Leveille, GA, Romsos, DR, Yeh, Y, and O’Hea, EK. Lipid biosynthesis in the Chick. A consideration of site of synthesis, influence of diet and possible regulatory mechanisms. Poult Sci. (1975) 54:1075–93. doi: 10.3382/ps.0541075
41. Cochran, BJ, Ong, KL, Manandhar, B, and Rye, KA. APOA1: a protein with multiple therapeutic functions. Curr Atheroscler Rep. (2021) 23:11. doi: 10.1007/s11883-021-00906-7
Keywords: RGS16 , chicken, SNP, abdominal fat, association
Citation: Ye M, Fan Z, Xu Y, Luan K, Guo L, Zhang S and Luo Q (2023) Exploring the association between fat-related traits in chickens and the RGS16 gene: insights from polymorphism and functional validation analysis. Front. Vet. Sci. 10:1180797. doi: 10.3389/fvets.2023.1180797
Edited by:
Muhammad Zahoor Khan, University of Agriculture, Dera Ismail Khan, PakistanReviewed by:
Biao Chen, Jiangxi Agricultural University, ChinaKerong Shi, Shandong Agricultural University, China
Copyright © 2023 Ye, Fan, Xu, Luan, Guo, Zhang and Luo. This is an open-access article distributed under the terms of the Creative Commons Attribution License (CC BY). The use, distribution or reproduction in other forums is permitted, provided the original author(s) and the copyright owner(s) are credited and that the original publication in this journal is cited, in accordance with accepted academic practice. No use, distribution or reproduction is permitted which does not comply with these terms.
*Correspondence: Qingbin Luo, cWJsdW9Ac2NhdS5lZHUuY24=