 Junshi Shen
 Wenjin Zheng1,2
 Zhongtang Yu
94% of researchers rate our articles as excellent or good
Learn more about the work of our research integrity team to safeguard the quality of each article we publish.
Find out more
ORIGINAL RESEARCH article
Front. Vet. Sci. , 30 March 2023
Sec. Animal Nutrition and Metabolism
Volume 10 - 2023 | https://doi.org/10.3389/fvets.2023.1163021
This article is part of the Research Topic Gut Microbiota: Allied with Livestock Nutrition, Health, And Welfare View all 19 articles
Ammonia is an important rumen internal environment indicator. In livestock production, feeding a large amount of non-protein nitrogen to ruminants will create high ammonia stress to the animals, which increases the risk of ammonia toxicity. However, the effects of ammonia toxicity on rumen microbiota and fermentation are still unknown. In this study, an in vitro rumen fermentation technique was used to investigate the effects of different concentrations of ammonia on rumen microbiota and fermentation. To achieve the four final total ammonia nitrogen (TAN) concentrations of 0, 8, 32, and 128 mmol/L, ammonium chloride (NH4Cl) was added at 0, 42.8, 171.2, and 686.8 mg/100 mL, and urea was added at 0, 24, 96, and 384 mg/100 mL. Urea hydrolysis increased, while NH4Cl dissociation slightly reduced the pH. At similar concentrations of TAN, the increased pH of the rumen culture by urea addition resulted in a much higher free ammonia nitrogen (FAN) concentration compared to NH4Cl addition. Pearson correlation analysis revealed a strong negative correlation between FAN and microbial populations (total bacteria, protozoa, fungi, and methanogens) and in vitro rumen fermentation profiles (gas production, dry matter digestibility, total volatile fatty acid, acetate, propionate, etc.), and a much weaker correlation between TAN and the above indicators. Additionally, bacterial community structure changed differently in response to TAN concentrations. High TAN increased Gram-positive Firmicutes and Actinobacteria but reduced Gram-negative Fibrobacteres and Spirochaetes. The current study demonstrated that the inhibition of in vitro rumen fermentation by high ammonia was pH-dependent and was associated with variations of rumen microbial populations and communities.
Ruminants, which provide almost all of the milk and much of the meat consumed by humans globally, are of great importance in agricultural production (1, 2). The rumen is a unique digestive and metabolic organ of ruminants, and it contains a diverse microbiota consisting of bacteria, protozoa, fungi, archaea, and viruses (3). The rumen microbes can produce enzymes to digest crude fibers that cannot be digested by the host itself to short-chain fatty acids (primarily acetate, propionate, and butyrate), providing the main energy source and fat synthesis precursors for the host (4). Besides, these microbes also synthesize microbial proteins from ammonia, which is derived from deamination of amino acids and hydrolysis of non-protein nitrogen (NPN) such as urea, providing the primary protein synthesis precursors for the host (5, 6). A proper rumen internal environment (pH, ammonia concentration, etc.) is critical to ensure efficient degradation of crude fibers and microbial protein synthesis in the rumen (3).
Ammonia can be utilized by many rumen microbes to synthesize microbial protein. In order to lower production costs, NPN (primarily urea) is used to replace part of high-quality protein sources (such as soybean meal) fed to ruminants (6–8). However, if a high dose of NPN is added, rumen ammonia concentration can increase rapidly, leading to ammonia toxicity (8). Total ammonia nitrogen (TAN) in aqueous phase exists in two different molecular forms, NH3 as free ammonia nitrogen (FAN) or NH as ammonium ions. The equilibrium concentration between NH3 and NH follows the Henderson-Hasselbalch equation and depends on pH and temperature (9). One previous study has found that ammonia toxicity is positively correlated with rumen pH and blood ammonia, but not with rumen TAN (10). Generally, the rumen temperature is relatively stable. Therefore, rapid increase of FAN concentration in the rumen at high pH is probably the primary cause for the rapid increase of ammonia absorption through the rumen epithelium leading to ammonia toxicity (7, 8, 11).
High ammonia stress is a major problem frequently encountered in anaerobic digestion for biogas production, a technology commonly used to treat organic wastes (9). The performance of an anaerobic reactor is directly associated with the structure of the microbial community present therein (12). Free ammonia levels are considered the foremost cause of inhibition of methanogens due to its high permeability to cell membrane (9, 13). For anaerobic digestion in biogas production, the goal is to maximize methane yield while reducing volatile fatty acid (VFA) accumulation (14). In contrast, for rumen fermentation, the goal is to maximize feed digestion and VFA production while reducing methane emissions (15). Besides, the operation parameters of anaerobic digesters (microbial composition, pH, temperature, ammonia concentration, etc.) are considerably different from those of rumen fermentation. Therefore, the specific response mechanism of the microbiota to ammonia toxicity may be different between the two different anaerobic digestion systems. Previous studies in ruminants have focused on the effects of ammonia toxicity on animal health (10, 16, 17). To our knowledge, however, no studies had reported the effects of ammonia toxicity on rumen microbiota even though ammonia toxicity adversely affects the animals. It is hypothesized that high FAN may affect the structure of rumen microbiota, leading to the inhibition of rumen fermentation.
Different NPN has varied acidity or alkalinity. Free NH3 produced from urea hydrolysis mediated by microbial urease in the rumen is a weak base, and it can neutralize the acidity produced by rumen fermentation and buffer the rumen pH to some extent (7). In contrast, NH4Cl, which is also an NPN additive commonly used in ruminants, is a weak acid after it is dissolved in water (17, 18). In this study, a rumen pH and ammonia level model was implemented by changing the amount and type of NPN (NH4Cl vs. urea) in an in vitro rumen fermentation system, and this model was used to investigate the effects of NH4Cl and urea addition on rumen microbial composition and fermentation profiles. The results helped reveal the microbial mechanism by which high ammonia inhibit rumen fermentation and could inform the improvement of ammonia utilization by the rumen microbiota.
The experiment was designed in a 2 × 4 factorial arrangement: two nitrogen sources (NH4Cl and urea) and four TAN levels (0, 8, 32, and 128 mmol/L). The rumen temperature is maintained quite stable varying within the narrow range of 38–41°C, and rumen TAN concentration and pH fluctuated between 1–40 mM and 5.5–7.2, respectively (19). In the present study, the tested TAN levels covered the TAN concentrations found in the rumen. To achieve the four final TAN concentrations of 0, 8, 32, and 128 mmol/L, NH4Cl was added at 0, 42.8, 171.2, and 686.8 mg/100 mL (A-0, A-8, A-32, and A-128), and urea was added at 0, 24, 96, and 384 mg/100 mL (U-0, U-8, U-32, and U-128). Each treatment had four replicates.
All animal protocols were approved by the Animal Care and Use Committee of Nanjing Agricultural University (protocol number: SYXK2017-0007).
Three rumen cannulated male sheep (Body weight = 32 ± 2 kg) served as ruminal fluid donors for this in vitro study. The diet fed to these sheep contained (% DM basis) 45% forage (25% corn silage and 20% peanut vine) and 55% concentrate (42% ground corn, 4% soybean meal, 4% wheat bran, and 5% premix). The dietary nutrient composition (DM basis) of crude protein (CP), neutral detergent fiber (NDF), acid detergent fiber (ADF), and ether extract (EE) were 15.6, 32.7, 20.4, and 3.1% respectively, and digestible energy (DE) was 13.8 MJ/kg, which met the feeding standards of meat-producing sheep and goats (20). The sheep were fed twice daily at 08:00 and 18:00, and they had free access to feed and water. Ruminal contents were collected through rumen cannula from the three donor sheep before morning feeding, mixed with an equal volume, and then poured into a sterilized bottle (1,000 mL) leaving no headspace in the bottle, which was taken to the laboratory within 30 min. The mixed rumen sample was then squeezed through four layers of cheesecloth into a flask under a continuous flux of CO2 in a water bath kept at 39°C until use.
The in vitro batch fermentation was performed in 180 mL serum bottles. The fermentation substrate was the same feed fed to the three sheep that donated the rumen sample. The buffered medium for the in vitro fermentation was prepared anaerobically as described by Theodorou et al. (21) with minor modification: Ammonium bicarbonate was replaced with equivalent amounts of sodium bicarbonate to eliminate the background nitrogen content in the buffered medium. The anaerobic buffer medium and strained rumen fluid inoculum were combined in each bottle in a 9:1 (v/v) ratio under anaerobic conditions. A 100-mL mixture was immediately dispensed into each incubation bottle containing 1 g of ground feed substrate and respective additions of NH4Cl and urea. To prevent exposure to air, the headspace of the bottles was continuously flushed with CO2 before they were each sealed with a butyl rubber stopper and secured with an aluminum crimp seal. The in vitro cultures were incubated at 39°C for 24 h in a water bath with intermittent shaking by hand after gas measurement at each designed time point.
Gas production was measured at 0.5, 2, 4, 6, 8, 12, and 24 h using a pressure transducer (21). After gas measurement at each time point, 1 mL of each culture was collected for subsequent analysis for ammonia-N using a colorimetric method (22). At the end of the 24 h of incubation, the pH value of each in vitro culture was measured immediately using a portable pH meter. Then, 1 mL of culture each was preserved by adding 0.2 mL of 25% HPO3 for VFA analysis using gas chromatography (7890A, Agilent, UK) according to the method described by Mao et al. (23). Also, 1 mL of culture each was collected for DNA extraction and subsequent microbial analysis. All the samples were stored at −20°C until analyses. The remaining content of each culture was filtered through a filter bag (ANKOM Technology, USA) to analyze apparent dry matter (DM) digestibility gravimetrically (24).
The free ammonia concentrations at 24 h after incubation were calculated based on the following equation as described by Rajagopal et al. (9):
where FAN is the concentration of free ammonia (mmol/L); TAN is the concentration of total ammonia (mmol/L); T(K) is the rumen temperature (Klevin), which was fixed at 312.15 K (39°C) in the current study; and pH is the pH value of each culture measured after 24 h incubation.
Microbial genomic DNA of the rumen culture samples was extracted using the bead-beating and phenol-chloroform extraction method (25). The DNA integrity was examined using agarose (1.2%) gel electrophoresis, and the DNA quantity of each sample was determined using a Nanodrop 2000 (Thermo Fisher Scientific, Inc., Madison, USA).
The PCR primers used for real-time quantitative PCR (qPCR) of total bacteria (25), fungi (26), protozoa (27), and methanogens (28) are listed in Supplementary Table 1. Real-time qPCR was performed on a StepOnePlus system (Applied Biosystems, California, USA) using the SYBR Premix Ex Taq dye (Takara Bio Inc.). Copies of 16S rRNA gene (total bacteria), methyl coenzyme-M reductase alpha-subunit gene (mcrA, methanogens), and 18S rRNA gene (fungi and protozoa) in each sample were performed in triplicate. Standard curves were generated using 10-fold serial dilutions of purified plasmid DNA containing the target gene sequences of each microbial group. The absolute abundance of each microbial population was expressed as copies of the target gene/mL of each sample.
The V3-V4 region of the 16S rRNA gene was amplified using primers 341F (5′-CCTACGGGAGGCAGCAG-3′) and 806R (5′-GGACTACHVGGGTWTCTAAT-3′). Unique barcodes were added to the 5'end of both primers for multiplexing. PCR products were verified on agarose gel (2%, w/v), and the expected bands were each extracted and purified using the QIAquick PCR Purification Kit (Qiagen, CA, USA). The concentrations of the purified DNA amplicons were each quantified using a QuantiFluor® dsDNA kit (Promega, Madison, WI, USA). Amplicons from all the samples were mixed in equal ratio and sequenced on an Illumina MiSeq platform to produce 250-bp paired-end reads. The raw sequence reads were deposited into the NCBI Sequence Read Archive (SRA) database under the accession number PRJNA940661.
Raw FASTQ files were de-multiplexed, quality-filtered (minimum Q score = 25), and analyzed using QIIME 1.9.1 (29). Operational taxonomic units (OTUs) were de novo clustered using UPARSE with a 97% sequence similarity (30), and possible chimeras were identified and removed using UCHIME (31). The most abundant sequence within each OTU was selected as the representative sequence and was taxonomically classified based on the SILVA database (version 138) (32). Sequences identified as of chloroplasts or mitochondria were removed before further analysis. The representative sequence of each OTU for each sample was aligned using MUSCLE (33), and the alignment was used to create a phylogenetic tree using FASTTREE (34). Principal coordinates analysis (PCoA) was performed based on Bray-Curtis dissimilarity to reveal overall differences in the bacterial communities among the different treatments. Analysis of similarities (ANOSIM) was performed to determine group similarity, where 0 = indistinguishable and 1 = dissimilar (35).
The real-time qPCR data were log-transformed to improve normality. Residual analysis was used to determine if transformation of variables was needed. If needed, cubic root transformations were performed. All data (in vitro rumen fermentation parameters, microbial populations quantified by qPCR, relative abundances of bacteria at the phylum and genus levels) were analyzed using the MIXED procedure of SAS version 9.4 (SAS Institute Inc., Cary, NC) in a 2 (nitrogen source) × 4 (ammonia level) factorial design. The model included nitrogen source, ammonia level, and interaction of nitrogen source × ammonia level as fixed effects. Degrees of freedom were calculated using the Kenward-Roger option. Mean separation was performed using the Tukey multiple range test. Differences were considered statistically significant at P ≤ 0.05. Pearson correlation coefficients were calculated using SAS version 9.4 to examine the correlation between TAN or FAN and in vitro rumen fermentation parameters, microbial populations, relative abundance of rumen bacteria at the genus level (data of A0 and U0 were not included for correlation analysis because of the insufficient ammonia concentration). A significant correlation was declared at P ≤ 0.05.
The addition of the pre-set amounts of urea and NH4Cl resulted in final TAN levels similar to that of the design, but at different rates (Figure 1A). NH4Cl dissociation can reach the target TAN level instantly after inoculation, while urea hydrolysis, which is catalyzed by urease, needs time to release ammonia. In the U-8 group, urea was hydrolyzed completely within 0.5 h, but it took about 4 and 12 h to complete hydrolysis of urea in the U-32 and U-128 groups, respectively.
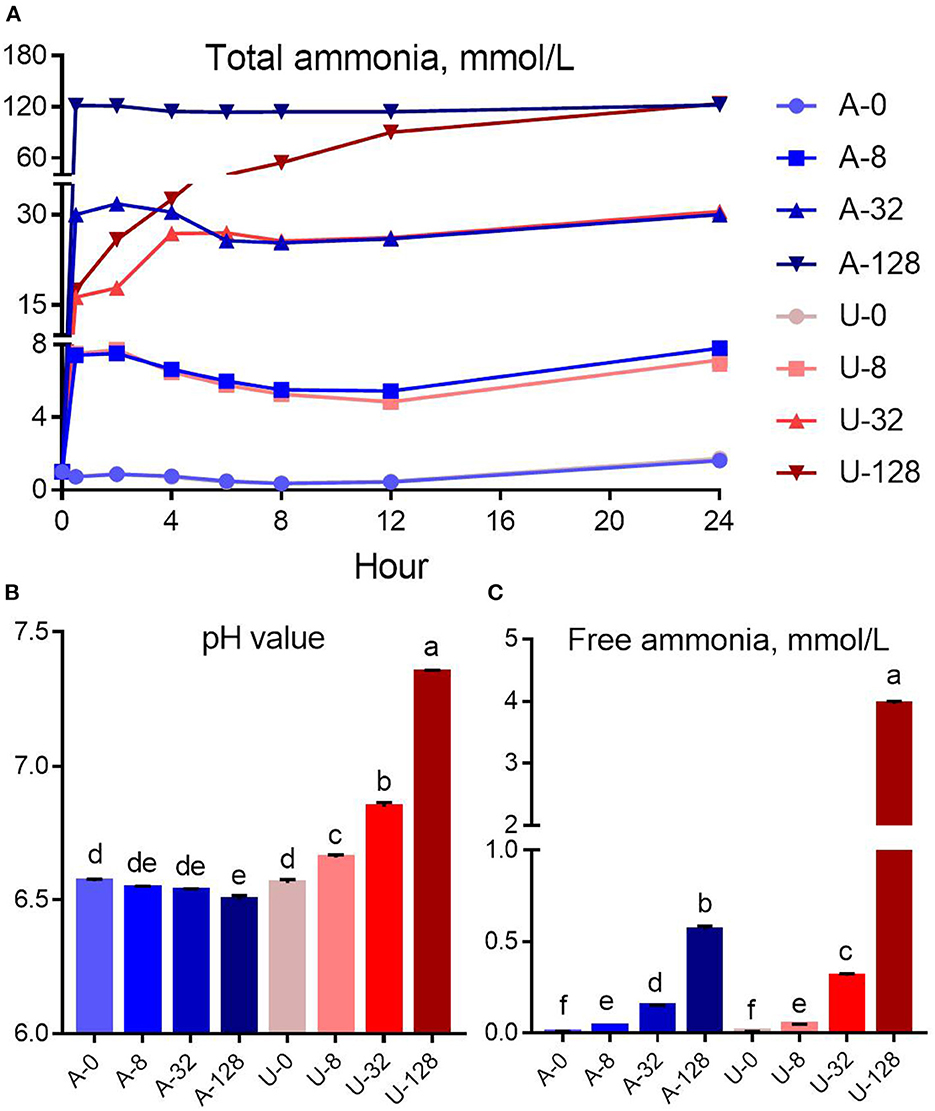
Figure 1. Effects of NH4Cl and urea addition on the dynamic change of total ammonia (A), pH value (B), and free ammonia concentration (C) at 24 h of in vitro incubation. There was significant interaction (P < 0.01) between nitrogen source and ammonia level with respect to pH value and free ammonia concentration. Different letters on the top of the bars in each figure panel denote significant differences (P < 0.05).
There was significant interaction (P < 0.01) between nitrogen source and ammonia level for pH value and FAN concentration. The addition of urea and NH4Cl had different effects on in vitro rumen pH (Figure 1B). With the increase of urea addition, the rumen pH increased from 6.56 to 7.35. In contrast, NH4Cl addition slightly reduced the pH of the in vitro rumen culture. But the reduction magnitude is not very small, < 0.07 pH units (from 6.57 to 6.50).
In the present study, the increased in vitro rumen pH in response to the urea addition resulted in a much higher FAN concentration (P < 0.05) compared to NH4Cl at a similar TAN level of 32 or 128 mmol/L (Figure 1C). For instance, the pH of the U-32 group (6.84) was 0.30 unit higher than that of the A-32 group (6.54), while the FAN of the U-32 group (0.31 mmol/L) was more than twice of that of the A-32 group (0.15 mmol/L). In contrast, the pH of the U-128 group (7.35) was 0.85 unit higher than that of the A-128 group (6.50), but the FAN of the U-128 group (3.96 mmol/L) was 7 times higher than that of the A-128 group (0.57 mmol/L). Therefore, pH value is the key factor to determine the concentration of FAN in the rumen.
There was significant interaction (P < 0.01) between nitrogen source and ammonia level to gas production, DM digestibility, and concentrations of volatile fatty acids. Total gas production, DM digestibility, and concentration of total VFA, acetate, propionate, and butyrate increased when the TAN level was raised from 0 to 8 mmol/L (A-8 and U-8), but these characteristics showed different responses to the urea and NH4Cl additions higher than 8 mmol/L (Figure 2). When TAN reached 32 mmol/L by adding NH4Cl (A-32), gas production, DM digestibility, total VFA, and propionate concentration were similar to those observed in A-8 and U-8 (P > 0.05), but the above parameters was decreased significantly in A-128 group (P < 0.05). In contrast, the in vitro rumen fermentation was inhibited by U-32 (P < 0.05) and further inhibited by U-128, and the inhibition was much stronger than that observed in the A-128 group (P < 0.05). These results indicate that urea is more inhibitory to rumen feed digestibility and fermentation than NH4Cl at high concentrations within the current pH range (6.54–7.35).
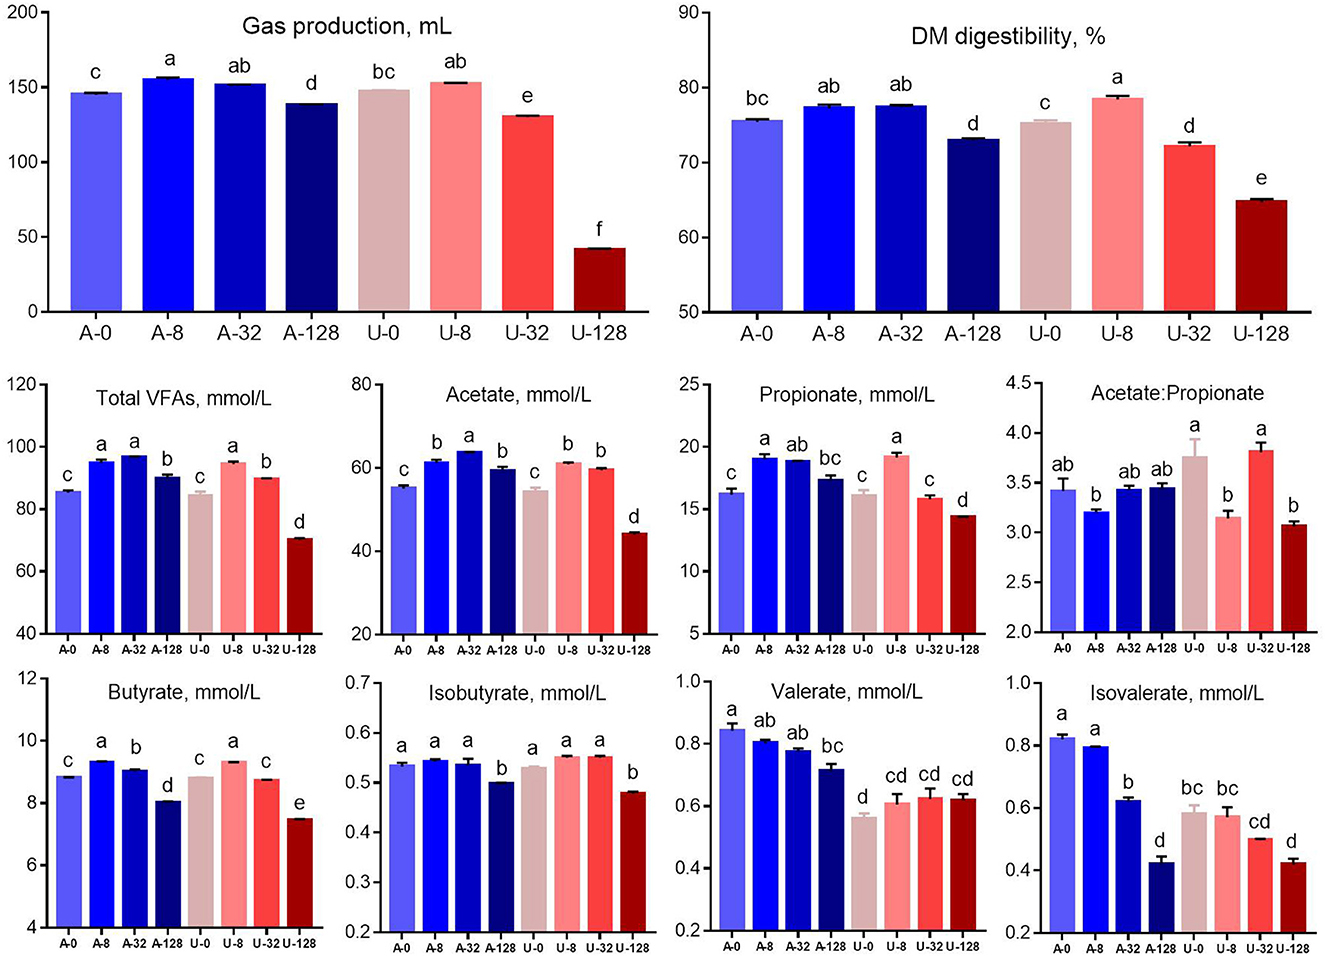
Figure 2. Effects of NH4Cl and urea addition on gas production, dry matter (DM) digestibility, and concentrations of volatile fatty acids. There was significant interaction (P < 0.01) between nitrogen source and ammonia level with respect to gas production, DM digestibility, and concentrations of volatile fatty acids. Different letters on the top of the bars in each figure panel denote significant differences (P < 0.05).
Significant interaction (P < 0.01) between nitrogen source and ammonia level was detected with respect to the absolute abundance of total bacteria, methanogens, protozoa, and fungi (Figure 3). In the present study, the abundance of total bacteria, fungi, and protozoa remained similar when TAN varied between 0 and 32 mmol/L (P > 0.05), but when TAN reached 128 mmol/L, the abundance of the above microbial groups decreased significantly (P < 0.05) irrespective of the ammonia-N source. However, U-128 had a greater inhibition than A-128 (P < 0.05). These results indicate that high TAN reduced the abundance of microbial populations, and increased FAN from urea hydrolysis might have aggravated the inhibitory effect.
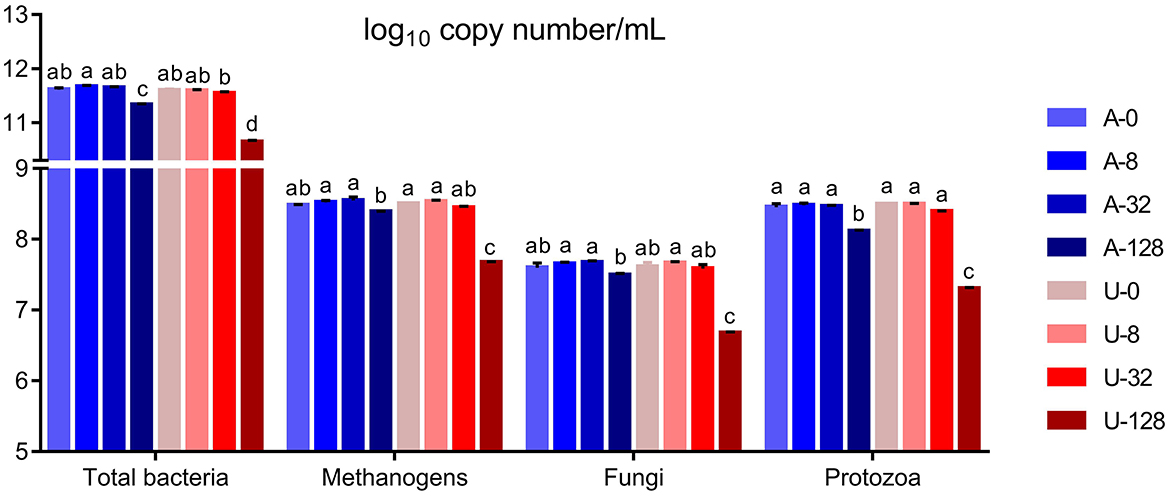
Figure 3. Effects of NH4Cl and urea addition on the absolute abundance of total bacteria, methanogens, protozoa, and fungi (log10 copy number of the target genes/mL) in the in vitro rumen mixed cultures. There was significant interaction (P < 0.01) between nitrogen source and ammonia level with respect to the abundance of total bacteria, methanogens, protozoa, and fungi. Different letters on the top of the bars in each figure panel denote significant differences (P < 0.05).
Principal coordinates analysis based on Bray-Curtis dissimilarity showed clear separations of the microbiota between the highest TAN level of 128 mmol/L (A-128 and U-128) and other TAN levels (Figure 4A). Besides, the difference between A-128 and U-128, U-32 and A-0 or U-0, and A-32 and U-0 was also significant as analyzed using ANOSIM (P < 0.05, Figure 4B). These results indicate that the rumen bacterial community structure changed in response to the two different nitrogen sources and ammonia levels.
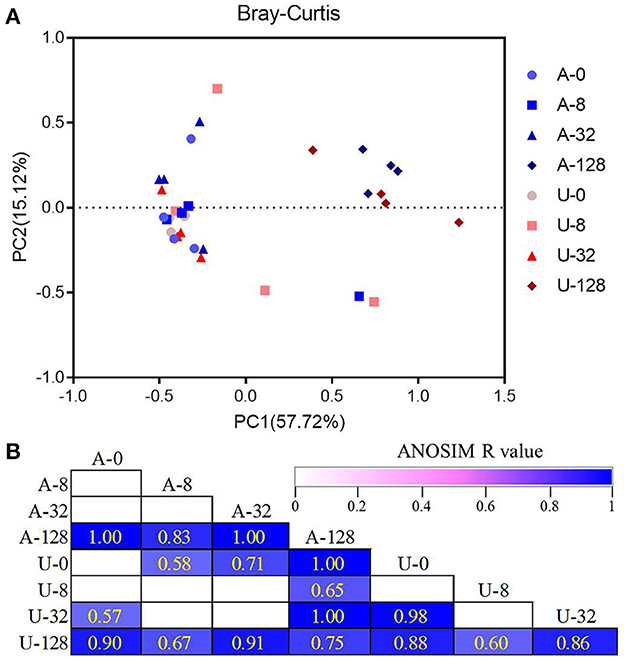
Figure 4. Principal coordinates analysis (PCoA) plots showing the overall differences in bacterial communities among the different treatments based on Bray-Curtis dissimilarity (A). The statistical significance of the PCoA analysis of the overall bacterial communities among the treatments was analyzed using analysis of similarity (ANOSIM) (B). ANOSIM R-values range from 0 (indistinguishable) to 1 (dissimilar), and ANOSIM R-values are showed only if P < 0.05, and cells are colored based on ANOSIM R-values.
A total of 19 bacterial phyla were identified across all the treatments, with Bacteroidetes (32.12–47.82%), followed by Firmicutes (16.13–40.84%), Proteobacteria (11.17–26.53%), Fibrobacteres (0.03–9.00%), Tenericutes (1.77–7.10%), Spirochaetes (0.70–7.00%), Actinobacteria (0.91–8.68%), and Fusobacteria (0.04–2.42%) being the eight most predominant phyla, each of which was represented by more than 1.0% of the total sequences in at least one treatment (Table 1).
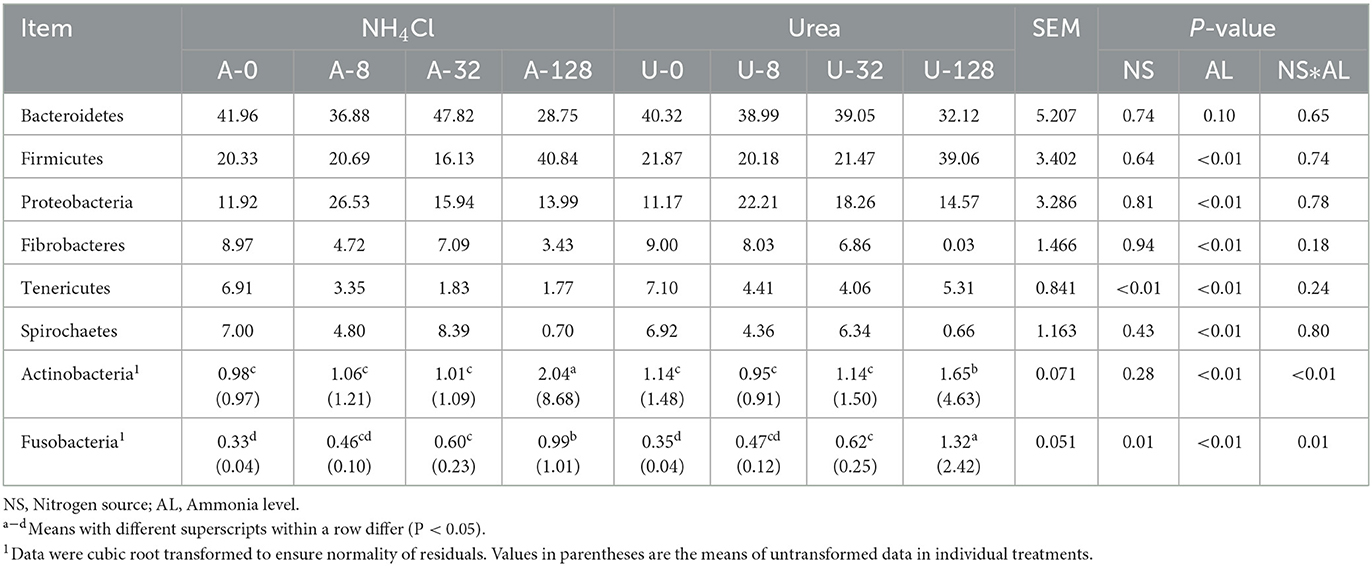
Table 1. Effects of NH4Cl and urea addition on the relative abundance of major ruminal bacterial phyla (each with a relative abundance ≥1.0% in at least one treatment).
No interaction (P ≥ 0.18) of ammonia-N source with ammonia level was detected with respect to any of the bacterial phyla except for Actinobacteria (P < 0.01) and Fusobacteria (P = 0.01). There were significant differences in the relative abundance of Firmicutes, Proteobacteria, Fibrobacteres, Tenericutes, and Spirochaetes among different ammonia levels (P < 0.01). Compared with other ammonia treatment levels, the high TAN treatments (128 mmol/L) significantly increased Gram-positive Firmicutes and Actinobacteria (P < 0.05), while decreasing Gram-negative Fibrobacteres and Spirochaetes significantly (P < 0.05) and Gram-negative Bacteroidetes numerically (P > 0.05). These results indicate that some Gram-negative bacteria were sensitive, while Gram-positive bacteria were tolerant to high TAN treatment.
Different responses of rumen bacterial genera to the incremental additions of urea and NH4Cl are shown in Table 2. There was significant interaction (P ≤ 0.01) between nitrogen source and ammonia level with respect to the relative abundance of Prevotellaceae YAB2003 group, Prevotella 7, Selenomonas, Eubacterium eligens group, Anaerovibrio, Sharpea, Escherichia-Shigella, Bifidobacterium, and Fusobacterium, but not for others.
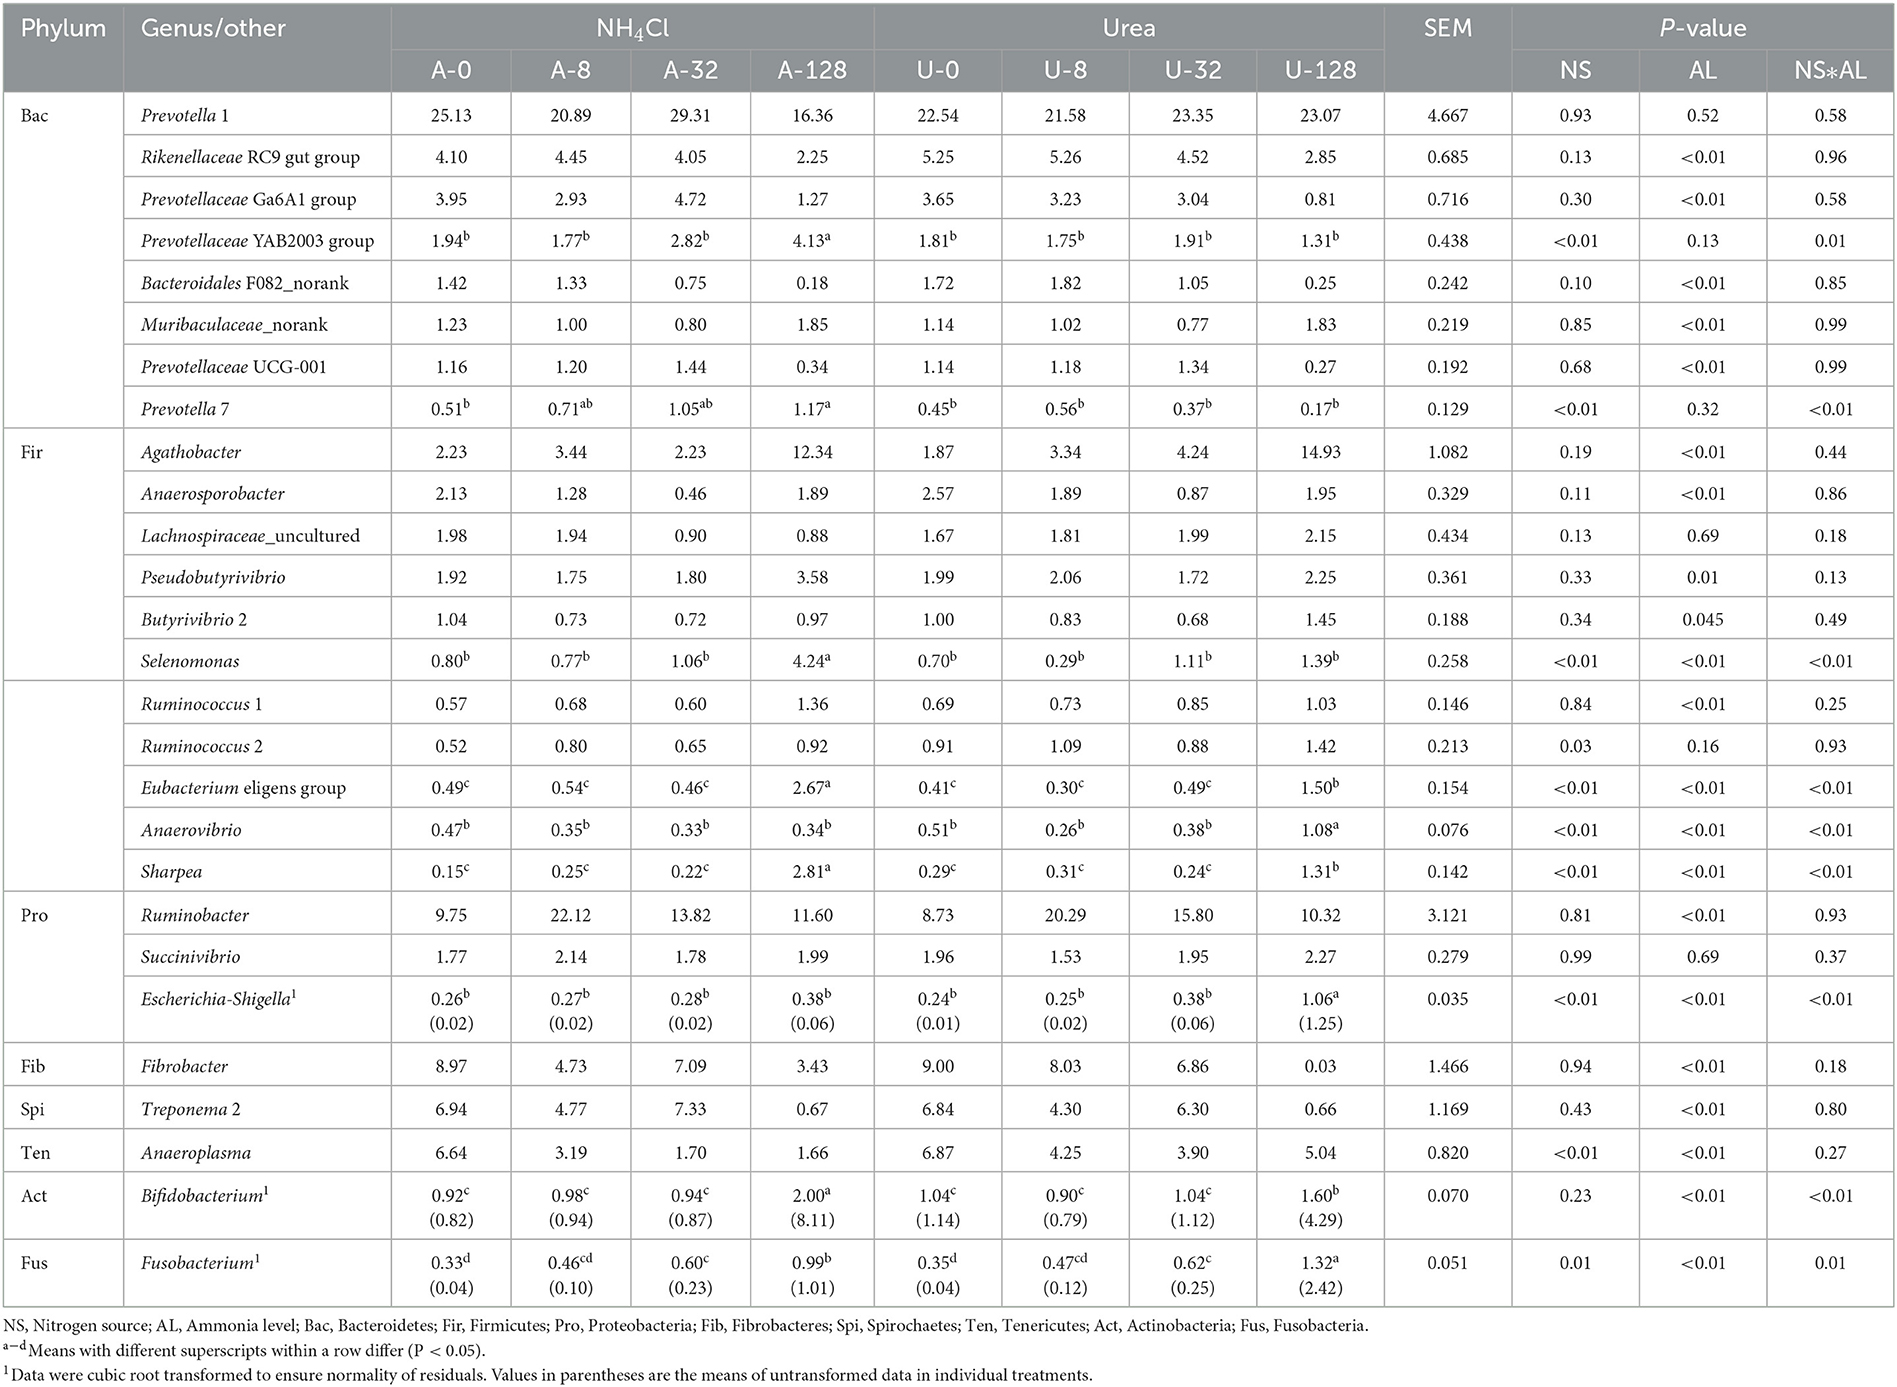
Table 2. Effects of NH4Cl and urea addition on the relative abundance of major ruminal bacterial genera (each with a relative abundance ≥1.0% in at least one treatment).
To explore the correlations between TAN or FAN and in vitro rumen fermentation parameters, absolute abundance of microbial populations, the relative abundance of rumen bacteria at the genus level, Pearson's correlation analysis was performed. Pearson correlation analysis revealed a strong negative correlation between FAN and microbial populations quantified (i.e., total bacteria, protozoa, fungi, and methanogens) and in vitro rumen fermentation profiles (gas production, DM digestibility, total VFA, acetate, propionate, etc.) and a much weaker negative correlation between TAN and the above indicators (Figure 5). The correlation analysis between the relative abundance of bacterial genera and ammonia concentration (FAN and TAN, Figure 5) revealed the difference in tolerance to high ammonia between Gram-positive and Gram-negative bacteria. Most of the Gram-positive bacterial genera including Agathobacter, Pseudobutyrivibrio, Butyrivibrio 2, Selenomonas, Ruminococcus 1, Ruminococcus 2, Eubacterium eligens group, Anaerobibrio, Sharpea, and Bifidobacterium were positively correlated with FAN or TAN concentration (P < 0.05). In contrast, most of the Gram-negative bacterial genera including Rikenellaceae RC9 gut group, Prevotellaceae Ga6A1 group, Bacteroidales F082_norank, Prevotellaceae UCG-001, Ruminobacter, Fibrobacter, and Treponema were negatively correlated with the concentration of FAN or TAN concentration (P < 0.05). However, there are also a few exceptions. For example, Gram-negative bacteria of Muribaculaceae_norank, Escherichia-Shigella, and Fusobacterium also showed a positive correlation with FAN or TAN concentration (P < 0.05).
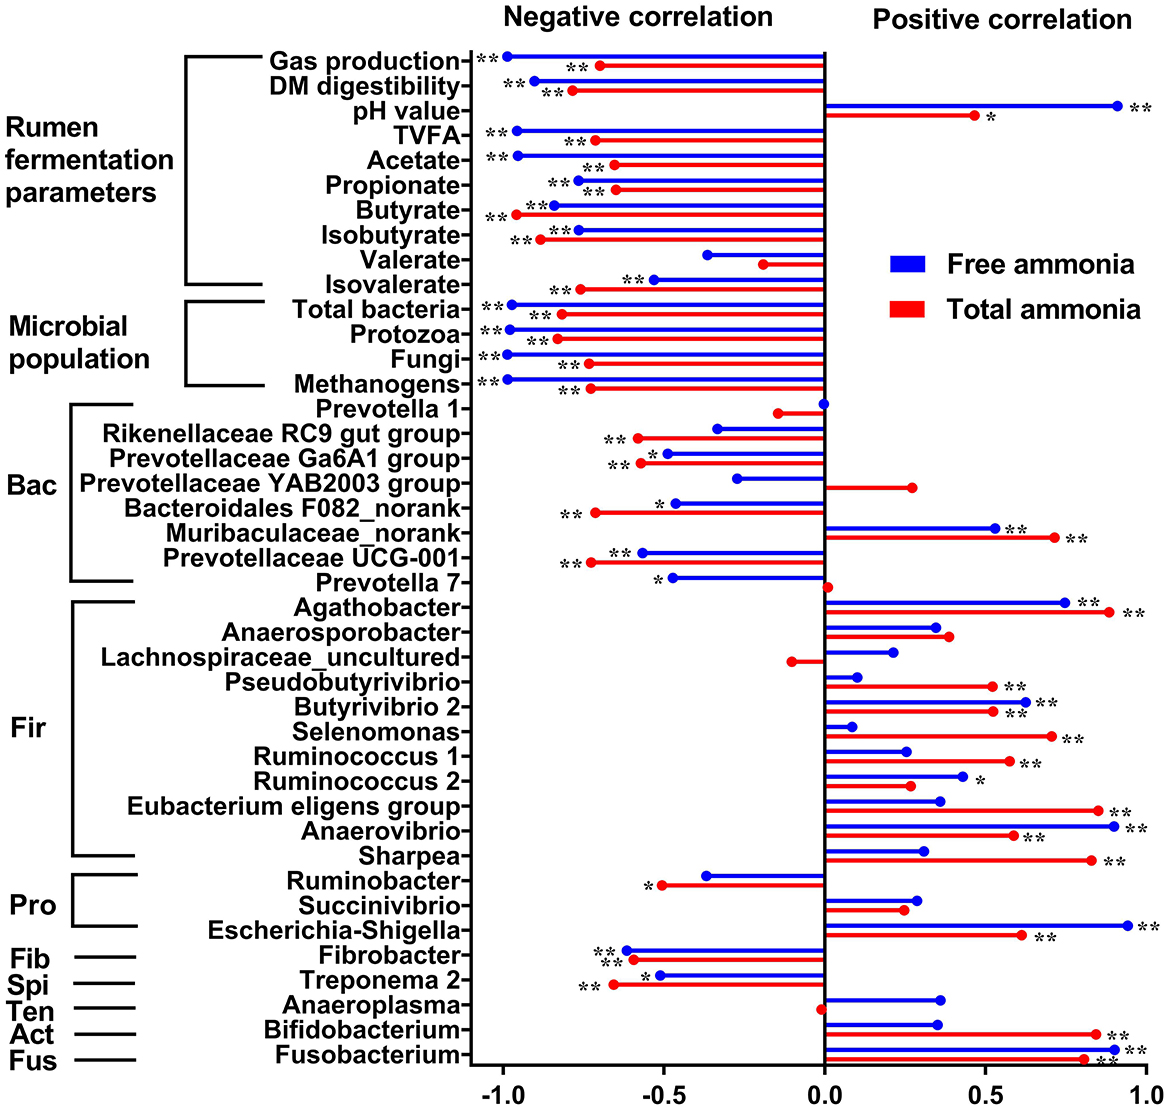
Figure 5. Pearson correlation coefficients (r) between total ammonia (red bars) or free ammonia (blue bars) and in vitro rumen fermentation parameters, absolute abundance of microbial populations (total bacteria, protozoa, fungi, and methanogens), the relative abundance of rumen bacteria at the genus level. *P < 0.05; **P < 0.01. Bac, Bacteroidetes; Fir, Firmicutes; Pro, Proteobacteria; Fib, Fibrobacteres; Spi, Spirochaetes; Ten, Tenericutes; Act, Actinobacteria; Fus, Fusobacteria.
Ammonia and VFA are continuously produced by the rumen microbiota and then absorbed through the rumen wall. On the other hand, urea is constantly diffused back to the rumen. Therefore, an in vitro system was used to avoid the interference of absorption and diffusion across the rumen epithelia. The use of an in vitro system also allowed us to precisely control and test different levels of NH4Cl and urea. Previous studies have demonstrated that high FAN induced rapid absorption of ammonia through the rumen epithelium leading to ammonia toxicity (10, 16), but no studies had reported the effects of high FAN on rumen microbiota and fermentation. Combining high-throughput sequencing and real-time qPCR using an in vitro fermentation system, this study for the first time evaluated the effects of high FAN on the rumen microbiota and fermentation. Moreover, this study also provided a practical guidance for the utilization of NPN to improve rumen fermentation.
In this study, it was found that the time required for complete hydrolysis of different doses of urea varied. Helmer and Bartley (36) reviewed previous literature and reported that 100 mL or g of rumen liquid/content could convert 80–100 mg of urea to ammonia per h, which is a rate much higher than that observed in the present study with a similar addition dose (U-32, 96 mg/100 mL). This could be explained by the small amount of rumen fluid inoculated [buffer medium: rumen fluid inoculum ratio = 9:1 (v/v)]. The initial microbial population was much lower than that of the rumen content, thus taking longer to hydrolyze the high doses of urea. In addition, high ammonia may inhibit urease activity (37), thus reducing the rate of urea hydrolysis. In order to increase the in vitro urea hydrolysis rate, large inoculum can be used in future research.
In the present study, the increase of rumen pH after urea hydrolysis is consistent with our recent in vitro study (38). Previous in vivo studies also found that infusion of urea into the rumen of Jersey cows caused an elevated rumen pH (39). In contrast, in line with our in vitro study with NH4Cl addition, a previous ruminal NH4Cl infusion study in Holstein cows also found reduced rumen pH (17). Moreover, in a study on anaerobic digestion for biogas production, similar changes of pH after urea and NH4Cl addition were also found (18). The above results indicate that a pH and ammonia level model was successfully implemented by adding different doses of urea and NH4Cl. This model can help examine the effect of varying FAN levels on the rumen microbiome (both individual taxa and functional guilds such as fibrolytic bacteria) and on in vitro rumen fermentation.
Under normal rumen environmental condition, the rumen pH is typically below the pKa (9.21) of ammonia, and thus virtually all ammonia is present in the rumen as NH (40). However, as calculated according to Henderson-Hasselbalch equation (9), the amount of TAN present as NH3 varies almost exponentially as a function of pH (41). Thus, in the present study, the increased in vitro rumen pH in response to the urea addition resulted in a much higher FAN concentration compared to NH4Cl at a similar TAN level. Therefore, pH value is the key factor to determine the concentration of FAN in the rumen. For ruminants, the rumen pH is greatly influenced by dietary forage to concentrate ratio and buffers such as bicarbonate, calcium carbonate, and magnesium oxide (3). Thus, the rumen FAN level can be controlled to some extent by controlling the pH through modifying the buffer and diet composition.
Ammonia-N is an essential nutrient for microbial growth. The rumen microbiota needs 5–11 mmol/L ammonia to maximize microbial protein (42). Apparently, the reduced in vitro rumen fermentation in the groups of A-0 and U-0 was due to ammonia-N deficiency. High ammonia stress is a main issue in anaerobic digestion for biogas production (9). In a previous review, Jiang et al. (13) reported that the inhibitory concentrations of TAN for anaerobic digestion varied greatly, but if converted to FAN the inhibitory concentrations were more consistent. In livestock production, feeding a large amount of NPN to ruminants will create high ammonia stress to the animals, which increases the risk of ammonia toxicity (8). However, the effects of high FAN on in vitro rumen fermentation are unknown. In the present study, the FAN concentration of 0.31 mmol/L in the U-32 group resulted in some inhibition of in vitro rumen fermentation (gas production, DM digestibility, total VFA concentration, etc.), and the increased FAN concentration of group A-128 (0.57 mmol/L) and U-128 (3.96 mmol/L) increased the inhibition magnitude significantly. Thus, to ensure efficient rumen fermentation, the rumen FAN level should be controlled. Moreover, based on the above results, it is speculated that rumen FAN level could serve as a potential biological marker to monitor rumen fermentation, but more studies are needed to confirm the inhibition threshold.
Rumen microorganisms are solely responsible for feed degradation and VFA production (43), and rumen bacteria are the predominant contributors (44). In addition, rumen protozoa, fungi, and methanogens also play important but different roles in rumen digestion and metabolism (45). In the present study, the stronger negative correlation between FAN and microbial populations quantified (i.e., total bacteria, protozoa, fungi, and methanogens) and in vitro rumen fermentation profiles (gas production, DM digestibility, total VFA, acetate, propionate, etc.) and a much weaker correlation between TAN and the above indicators indicate that high FAN inhibited in vitro rumen fermentation by reducing microbial populations. However, the mechanism(s) by which high FAN inhibited rumen microbes remain to be elucidated. Reviews of anaerobic digestion for biogas production reported that at least two possible mechanisms were underpinning the inhibition of anaerobic digestion by high ammonia (13): (1) direct inhibition of some enzymes in the cytoplasm of microorganisms, and (2) alteration of the intracellular environment upon absorption of free ammonia, resulting in ammonia toxicity to microorganisms. The operation environment of anaerobic digesters for biogas production (pH, temperature, microbial composition, etc.) is quite different from that of the rumen. Therefore, further research efforts are needed to elucidate the mechanism(s) of ammonia inhibition to rumen microorganisms.
The performance of rumen fermentation is not only related to the total bacteria population but also closely related to the rumen bacterial community structure. Generally, Ruminococcus albus, R. flavefaciens, Fibrobacter Succinogenes, Butyrivibrio fibrisolvens, and Eubacterium cellulosolvens are considered the major cellulolytic bacterial species cultured (46). Besides, a forage incubation study indicated that some unclassified bacteria assigned to the families Lachnospiraceae, Christensenellaceae, Ruminococcaceae, Rikenellaceae, Prevotellaceae, and Bacteroidales mightly also play an important role in fiber degradation in the rumen (47). In the present study, the reduced abundance of potential fibrolytic bacterial genera (e.g., Rikenellaceae RC9 gut group, Prevotellaceae Ga6A1 group, Bacteroidales F082_norank, Prevotellaceae UCG-001, and Fibrobacter) might have partially explained the decreased DM digestibility in the high ammonia treatments. However, some potential fibrolytic bacterial genera such as Pseudobutyrivibrio, Butyrivibrio 2, and Ruminococcus 1 were increased by the high ammonia treatments. This may be attributed to the different tolerance of fibrolytic bacteria to high ammonia stress. However, it should be noted that an increase or decrease of the relative abundance of a bacterial genus does not necessarily mean an increase or decrease of its absolute abundance. Quantitative analysis of absolute abundance using qPCR or other quantitative methods can determine how these genera respond to high ammonia stress.
In the present study, the correlation results between the relative abundance of bacterial genera and ammonia concentration indicate that some Gram-negative bacteria were sensitive, while Gram-positive bacteria were tolerant to high TAN treatment. However, to the best of the authors' knowledge, no literature to date has reported the tolerance response of Gram-positive vs. Gram-negative bacteria to high ammonia stress. Therefore, the difference in tolerance to high ammonia stress between Gram-positive and Gram-negative bacteria warrants future research.
In the present study, an in vitro rumen pH and ammonia difference model was implemented by adding urea and NH4Cl. Urea hydrolysis increased, while NH4Cl dissociation slightly reduced in vitro rumen pH. At the same TAN level, the increased rumen pH by urea addition resulted in much higher FAN concentrations compared to NH4Cl addition. High FAN inhibited in vitro rumen fermentation by reducing the absolute abundance of total bacteria, fungi, protozoa, and methanogens. Additionally, bacterial community structure changed differently in response to nitrogen source and ammonia level. This study demonstrated that the inhibition of high ammonia to in vitro rumen fermentation is pH dependent.
The datasets presented in this study can be found in online repositories. The names of the repository/repositories and accession number(s) can be found at: https://www.ncbi.nlm.nih.gov/, PRJNA940661.
The animal study was reviewed and approved by Animal Care and Use Committee of Nanjing Agricultural University (protocol number: SYXK2017-0007). Written informed consent was obtained from the owners for the participation of their animals in this study.
JS conceived and designed the experiments and wrote the paper. WZ and YX performed the experiments. JS, WZ, and YX analyzed the data. ZY revised the paper. All authors contributed to the article and approved the submitted version.
This work was financially supported by the National Natural Science Foundation of China (32272897) and the National Key Research and Development Program of China (2022YFD1301001).
The authors declare that the research was conducted in the absence of any commercial or financial relationships that could be construed as a potential conflict of interest.
All claims expressed in this article are solely those of the authors and do not necessarily represent those of their affiliated organizations, or those of the publisher, the editors and the reviewers. Any product that may be evaluated in this article, or claim that may be made by its manufacturer, is not guaranteed or endorsed by the publisher.
The Supplementary Material for this article can be found online at: https://www.frontiersin.org/articles/10.3389/fvets.2023.1163021/full#supplementary-material
1. Cholewinska P, Czyz K, Nowakowski P, Wyrostek A. The microbiome of the digestive system of ruminants—A review. Anim Health Res Rev. (2020) 21:3–14. doi: 10.1017/S1466252319000069
2. Eisler MC, Lee MR, Tarlton JF, Martin GB, Beddington J, Dungait JA, et al. Agriculture: Steps to sustainable livestock. Nature. (2014) 507:32–4. doi: 10.1038/507032a
3. Russell JB, Rychlik JL. Factors that alter rumen microbial ecology. Science. (2001) 292:1119–22. doi: 10.1126/science.1058830
4. Weimer PJ. Redundancy, resilience, and host specificity of the ruminal microbiota: Implications for engineering improved ruminal fermentations. Front Microbiol. (2015) 6:296. doi: 10.3389/fmicb.2015.00296
5. Bach A, Calsamiglia S, Stern MD. Nitrogen metabolism in the rumen. J Dairy Sci. (2005) 88(Suppl.1):E9–21. doi: 10.3168/jds.S0022-0302(05)73133-7
6. Schwab CG, Broderick GA. A 100-year review: Protein and amino acid nutrition in dairy cows. J Dairy Sci. (2017) 100:10094–112. doi: 10.3168/jds.2017-13320
7. Kertz AF. Review: Urea feeding to dairy cattle: A historical perspective and review. Prof Anim Scientis. (2010) 26:257–72. doi: 10.15232/S1080-7446(15)30593-3
8. Patra AK. Urea/ammonia metabolism in the rumen and toxicity in ruminants. In:AK Puniya, R Singh, DN Kamra, , editors, Rumen Microbiology: From Evolution to Revolution. New Delhi: Springer. (2015). p. 329–41. doi: 10.1007/978-81-322-2401-3_22
9. Rajagopal R, Massé DI, Singh G. A critical review on inhibition of anaerobic digestion process by excess ammonia. Bioresour Technol. (2013) 143:632–41. doi: 10.1016/j.biortech.2013.06.030
10. Bartley EE, Davidovich AD, Barr GW, Griffel GW, Dayton AD, Deyoe CW, et al. Ammonia toxicity in cattle. I. Rumen and blood changes associated with toxicity and treatment methods. J Anim Sci. (1976) 43:835–41. doi: 10.2527/jas1976.434835x
11. Abdoun K, Stumpff F, Martens H. Ammonia and urea transport across the rumen epithelium: A review. Anim Health Res Rev. (2006) 7:43–59. doi: 10.1017/S1466252307001156
12. Yenigun O, Demirel B. Ammonia inhibition in anaerobic digestion: A review. Process Biochem. (2013) 48:901–11. doi: 10.1016/j.procbio.2013.04.012
13. Jiang Y, McAdam E, Zhang Y, Heaven S, Banks C, Longhurst P. Ammonia inhibition and toxicity in anaerobic digestion: A critical review. J. Water Process Eng. (2019) 32:100899. doi: 10.1016/j.jwpe.2019.100899
14. Meng XS, Yu DW, Wei YS, Zhang YX, Zhang QF, Wang ZY, et al. Endogenous ternary pH buffer system with ammonia-carbonates-VFAs in high solid anaerobic digestion of swine manure: An alternative for alleviating ammonia inhibition? Process Biochem. (2018) 69:144–52. doi: 10.1016/j.procbio.2018.03.015
15. Morgavi DP, Forano E, Martin C, Newbold CJ. Microbial ecosystem and methanogenesis in ruminants. Animal. (2010) 4:1024–36. doi: 10.1017/S1751731110000546
16. Davidovich A, Bartley EE, Chapman TE, Bechtle RM, Dayton AD, Frey RA. Ammonia toxicity in cattle. II. Changes in carotid and jugular blood components associated with toxicity. J Anim Sci. (1977) 44:702–9. doi: 10.2527/jas1977.444702x
17. Kertz AF, Davidson LE, Cords BR, Puch HC. Ruminal infusion of ammonium chloride in lactating cows to determine effect of pH on ammonia trapping. J Dairy Sci. (1983) 66:2597–601. doi: 10.3168/jds.S0022-0302(83)82133-X
18. Tian H, Fotidis IA, Kissas K, Angelidaki I. Effect of different ammonia sources on aceticlastic and hydrogenotrophic methanogens. Bioresour Technol. (2018) 250:390–7. doi: 10.1016/j.biortech.2017.11.081
19. Wallace RJ, Onodera R, Cotta MA. Metabolism of nitrogen-containing compounds. In:PN Hobson, CS Stewart, , editors, The Rumen Microbial Ecosystem. New York, NY: Blackie Academic and Professional (1997). p. 283–328. doi: 10.1007/978-94-009-1453-7_7
20. Ministry of Agriculture of P. R. China. Feeding Standards of Meat-Producing Sheep and Goats (NY/T 816-2004). Beijing: China Agriculture Press (2004).
21. Theodorou MK, Williams BA, Dhanoa MS, Mcallan AB, France J. A simple gas-production method using a pressure transducer to determine the fermentation kinetics of ruminant feeds. Anim Feed Sci Technol. (1994) 48:185–97. doi: 10.1016/0377-8401(94)90171-6
22. Chaney AL, Marbach EP. Modified reagents for determination of urea and ammonia. Clin Chem. (1962) 8:130–2. doi: 10.1093/clinchem/8.2.130
23. Mao SY, Zhang G, Zhu WY. Effect of disodium fumarate on ruminal metabolism and rumen bacterial communities as revealed by denaturing gradient gel electrophoresis analysis of 16S ribosomal DNA. Anim Feed Sci Technol. (2008) 140:293–306. doi: 10.1016/j.anifeedsci.2007.04.001
24. Blummel M, Steingab H, Becker K. The relationship between in vitro gas production, in vitro microbial biomass yield and N-15 incorporation and its implications for the prediction of voluntary feed intake of roughages. Brit J Nutr. (1997) 77:911–21. doi: 10.1079/BJN19970089
25. Dai ZL, Zhang J, Wu GY, Zhu WY. Utilization of amino acids by bacteria from the pig small intestine. Amino Acids. (2010) 39:1201–15. doi: 10.1007/s00726-010-0556-9
26. Denman SE, McSweeney CS. Development of a real-time PCR assay for monitoring anaerobic fungal and cellulolytic bacterial populations within the rumen. FEMS Microbiol Ecol. (2006) 58:572–82. doi: 10.1111/j.1574-6941.2006.00190.x
27. Sylvester JT, Karnati SKR, Yu ZT, Morrison M, Firkins JL. Development of an assay to quantify rumen ciliate protozoal biomass in cows using real-time PCR. J Nutr. (2004) 134:3378–84. doi: 10.1093/jn/134.12.3378
28. Denman SE, Tomkins NW, McSweeney CS. Quantitation and diversity analysis of ruminal methanogenic populations in response to the antimethanogenic compound bromochloromethane. FEMS Microbiol Ecol. (2007) 62:313–22. doi: 10.1111/j.1574-6941.2007.00394.x
29. Caporaso JG, Kuczynski J, Stombaugh J, Bittinger K, Bushman FD, Costello EK, et al. QIIME allows analysis of high-throughput community sequencing data. Nat. Method. (2010) 7:335–6. doi: 10.1038/nmeth.f.303
30. Edgar RC. UPARSE highly accurate OTU sequences from microbial amplicon reads. Nat Methods. (2013) 10:996–8. doi: 10.1038/nmeth.2604
31. Edgar RC, Haas BJ, Clemente JC, Quince C, Knight R. UCHIME improves sensitivity and speed of chimera detection. Bioinformatics. (2011) 27:2194–200. doi: 10.1093/bioinformatics/btr381
32. Quast C, Pruesse E, Yilmaz P, Gerken J, Schweer T, Yarza P, et al. The SILVA ribosomal RNA gene database project: Improved data processing and web-based tools. Nucleic Acids Res. (2013) 41:D590–6. doi: 10.1093/nar/gks1219
33. Edgar RC. MUSCLE multiple sequence alignment with high accuracy and high throughput. Nucleic Acids Res. (2004) 32:1792–7. doi: 10.1093/nar/gkh340
34. Price MN, Dehal PS, Arkin AP. FastTree: Computing large minimum evolution trees with profiles instead of a distance matrix. Mol Biol Evol. (2009) 26:1641–50. doi: 10.1093/molbev/msp077
35. Fierer N, Lauber CL, Zhou N, McDonald D, Costello EK, Knight R. Forensic identification using skin bacterial communities. Proc Natl Acad Sci USA. (2010) 107:6477–81. doi: 10.1073/pnas.1000162107
36. Helmer LG, Bartley EE. Progress in the utilization of urea as a protein replacer for ruminants. A review. J Dairy Sci. (1971) 54:25–51. doi: 10.3168/jds.S0022-0302(71)85776-4
37. Greenwood JA, Mills J, Tyler PD, Jones CW. Physiological regulation, purification and properties of urease from Methylophilus methylotrophus. FEMS Microbiol Lett. (1998) 160:131–5. doi: 10.1111/j.1574-6968.1998.tb12902.x
38. Sun M, Xu Y, Cao Y, Du F, Shen J, Zhu W. Effects of different urea addition levels on in vitro rumen fermentation and functional microbial populations of steam-exploded corn stover. Chin J Anim Nutr. (2021) 33:3959–69. doi: 10.3969/j.issn.1006-267x.2021.07.037
39. Webb DW, Bartley EE, Meyer RM. A comparison of nitrogen metabolism and ammonia toxicity from ammonium acetate and urea in cattle. J Anim Sci. (1972) 35:1263–70. doi: 10.2527/jas1972.3561263x
40. Dijkstra J, Ellis JL, Kebreab E, Strathe AB, Lopez S, France J, et al. Ruminal pH regulation and nutritional consequences of low pH. Anim Feed Sci Technol. (2012) 172:22–33. doi: 10.1016/j.anifeedsci.2011.12.005
41. Weiner ID, Verlander JW. Ammonia transporters and their role in acid-base balance. Physiol Rev. (2017) 97:465–94. doi: 10.1152/physrev.00011.2016
42. Schwab CG, Huhtanen P, Hunt C, Hvelplund T. Nitrogen requirements of cattle. In E Pfeffer, A Hristov, editors, Nitrogen and Phosphorus Nutrition of Cattle. Wallingford: CABI Publishing (2005). p. 13–70. doi: 10.1079/9780851990132.0013
43. Patra AK, Yu Z. Essential oils affect populations of some rumen bacteria in vitro as revealed by microarray (RumenBactArray) analysis. Front Microbiol. (2015) 6:297. doi: 10.3389/fmicb.2015.00297
44. Zhou M, Chen Y, Guan LL. Rumen bacteria. In AK Puniya, R Singh, DN Kamra, editors, Rumen Microbiology: From Evolution to Revolution. New Delhi: Springer (2015). p. 79–96. doi: 10.1007/978-81-322-2401-3_6
45. Huws SA, Creevey CJ, Oyama LB, Mizrahi I, Denman SE, Popova M, et al. Addressing global ruminant agricultural challenges through understanding the rumen microbiome: Past, present, and future. Front Microbiol. (2018) 9:2161. doi: 10.3389/fmicb.2018.02161
46. Krause DO, Denman SE, Mackie RI, Morrison M, Rae AL, Attwood GT, et al. Opportunities to improve fiber degradation in the rumen: Microbiology, ecology, and genomics. FEMS Microbiol Rev. (2003) 27:663–93. doi: 10.1016/S0168-6445(03)00072-X
Keywords: ammonium chloride, free ammonia, microbiota, pH, rumen fermentation, urea
Citation: Shen J, Zheng W, Xu Y and Yu Z (2023) The inhibition of high ammonia to in vitro rumen fermentation is pH dependent. Front. Vet. Sci. 10:1163021. doi: 10.3389/fvets.2023.1163021
Received: 10 February 2023; Accepted: 14 March 2023;
Published: 30 March 2023.
Edited by:
Wen-Chao Liu, Guangdong Ocean University, ChinaReviewed by:
Yujia Tian, Tianjin Agricultural University, ChinaCopyright © 2023 Shen, Zheng, Xu and Yu. This is an open-access article distributed under the terms of the Creative Commons Attribution License (CC BY). The use, distribution or reproduction in other forums is permitted, provided the original author(s) and the copyright owner(s) are credited and that the original publication in this journal is cited, in accordance with accepted academic practice. No use, distribution or reproduction is permitted which does not comply with these terms.
*Correspondence: Junshi Shen, c2hlbmp1bnNoaUBuamF1LmVkdS5jbg==
Disclaimer: All claims expressed in this article are solely those of the authors and do not necessarily represent those of their affiliated organizations, or those of the publisher, the editors and the reviewers. Any product that may be evaluated in this article or claim that may be made by its manufacturer is not guaranteed or endorsed by the publisher.
Research integrity at Frontiers
Learn more about the work of our research integrity team to safeguard the quality of each article we publish.