 Fangyuan Yin1
 Chuanjiang Guo1Zhuojia Tian1Dong Li1Daoe Mu1Haoting Liu1
 Guiquan Guan2
 Hong Yin2*
 Facai Li1*
- 1College of Veterinary Medicine, Southwest University, Chongqing, China
- 2State Key Laboratory of Veterinary Etiological Biology, Lanzhou Veterinary Research Institute, Chinese Academy of Agricultural Sciences, Lanzhou, Gansu, China
Babesia gibsoni is a tick-borne apicomplexan protozoan causing canine babesiosis. This parasite has diploid sexual reproduction in ticks, during which genetic exchanges can occur leading to increased genetic diversity, which is an important factor in adapting to environmental changes. Exploring the genetic variation of B. gibsoni population can provide a foundation for understanding the patterns of disease transmission and developing babesiosis control strategies. Partial 18S rRNA fragment sequences were obtained from 11 B. gibsoni isolates collected from different regions in China and 117 publicly available sequences were from 12 geographical areas including China. The genetic variation, demographic expansion and population structure were examined. A total of 34 haplotypes were identified among B. gibsoni populations. Analysis of molecular variance, pairwise Fst and structure analysis showed that high genetic variation within populations, low genetic differentiation and obvious mixture haplotype were apparent in a single continent, but higher genetic differentiation was detected across different continents. Neutrality tests implied that B. gibsoni populations had experienced population extension. These findings will contribute to understand the genetics and evolution of B. gibsoni and will be useful for formulating effective management strategies to prevent and control this parasite.
Introduction
Vector-borne pathogens such as malaria, leishmaniasis and trypanosomosis affecting humans and babesiosis, theileriosis and hepatozoonosis in animals are globally important threat factors for health (1). Babesia gibsoni, one of tick-borne intracellular hemoprotozoan parasites, is considered to be an important pathogen responsible for wild and domestic canine babesiosis. This parasite is transmitted mainly by Haemaphysalis longicornis and Rhipicephalus sanguineus, but other sources of transmission to dogs have been demonstrated including dog fighting, blood transfusion and transplacental transmission (2–4). The clinical manifestations of B. gibsoni infection include acute hemolysis with lethargy, jaundice, anemia, thrombocytopenia, hemoglobinuria and splenomegaly (5). In chronic infections, the dogs are commonly asymptomatic and become pathogen carriers (6). B. gibsoni has a complex life cycle, undergoing gamogony in the midgut lumen of tick, sporogony in the salivary glands of tick and merogony in the blood cells of the vertebrate host (7, 8). This parasite was detected in India in 1910, then successively found in certain parts of Asia, including Bangladesh, China, Japan, Korea, Malaysia, Myanmar, and Thailand (9–18). With the increase in the number and international movement of dogs, B. gibsoni has gradually spread around the world to Africa, America, Australia and Europe (19–25).
Understanding the genetic differentiation and population structure of protozoan parasites will be helpful to evaluate their evolution, spatiotemporal dynamics and genetic exchange, as well as to formulate the effective strategies to prevent the transmission of pathogens (26). Molecular markers such as 18S rRNA, mitochondrial DNA, microsatellite loci and single nucleotide polymorphisms are often employed to explore the genetic variation and provide the information on reproductive modes and molecular sequences obtained from samples to explain the evolutionary history of populations (27). Several genetic diversity studies of tick-transmitted hemoprotozoan parasites have currently been described, including Babesia bovis, Babesia ovis, Hepatozoon canis, Theileria annulata, and Theileria parva (27–31). These studies demonstrated that high genetic diversity was detected in B. bovis, B. ovis, T. annulata, and T. parva populations (28–31). A high gene flow was found between H. canis populations originating from distant continents (27). The phylogenetic and population differentiation of Babesia spp., which can parasitize cattle, sheep and horses, were explained by previous studies (28, 29, 32). Molecular detection of B. gibsoni has been broadly described around the world (20, 22, 33–36), but the genetic diversity of B. gibsoni in dogs was scarce.
The present study aimed to explain the genetic differentiation, population dynamics and population structure of B. gibsoni populations from Asia, America and Europe using ribosomal RNA 18S (18S rRNA) gene. These findings will help to understand the distribution and dynamics of genetic difference among B. gibsoni populations, which is necessary for designing effective control strategies to manage and prevent this parasite.
Materials and methods
Sample collection and DNA extraction
A total of 197 blood samples were collected from dogs in pet clinics from five cities, including Chongqing, Linyi, Quanzhou, Wuhan and Xiangyang, as seen in Supplementary Table 1. Most of the samples were asymptomatic for babesiosis, but two dogs showed fever, lethargy, diarrhea and anemia. Approximately 300 μl blood samples were collected in EDTA vacutainers and transported in iceboxes to the College of Veterinary Medicine, Southwest University. Genomic DNA samples were extracted from 250 μl blood by the Blood DNA Mini Kit (Omega, USA), stored at −20°C.
DNA amplification and sequencing
The presence of DNA from Babesia spp. was detected by a nested polymerase chain reaction (PCR). A region of the 18S rRNA gene fragment 1,379 bp in length was amplified using Piro1-S: 5′-CTTGACGGTAGGGTATTGGC-3′, Piro3-AS: 5′-CCTTCCTTTAAGTGATAAGGTTCAC-3′ and then a small fragment 405 bp in length was amplified using Piro-A: 5′-ATTACCCAATMCBGACACVGKG-3′ and Piro-B: 5′-TTAAATACGAATGCCCCCAAC-3′ in the second round of PCR (37, 38). Briefly, PCR was performed in 25 μl containing 2.5 μl of 10 × PCR buffer, 2.0 μl of 2.5 mM dNTP, 0.3 μl of 5 U/μl Taq DNA polymerase (Takara, China), 0.1 μM of primer pair and 2 μl of DNA template. The PCR reaction conditions were initial denaturation at 95°C for 3 min, followed by 35 cycles of denaturation at 95°C for 30 s, annealing at 55°C for 30 s and extension at 72°C for 90 s, with a final extension of 72°C for 5 min. Positive products were cloned into pMD19-T vector (TaKaRa, China) and transformed into Escherichia coli Trans5α competent cells (TransGen, China). The positive clones were then sequenced by M13-F/M13-R primers (PRISM3730XL, ABI). DNA isolated from blood of a dog infected with B. gibsoni and distilled water were used as positive and negative control, respectively.
Sequences analysis and selection
The 18S rRNA sequences were analyzed using the NCBI BLASTn program (https://blast.ncbi.nlm.nih.gov) and deposited in GenBank under the accession numbers OM392053-OM392060 and ON810382-ON810384.
A total of 117 18S rRNA sequences of B. gibsoni were downloaded from GenBank database. Sequences without annotation such as host or location and truncated sequences were excluded from the analysis. All of the sequences were aligned with a consensus length of 409 bp and these sequences belonged to 12 areas from three continents. The details of all the sequences used in this study are shown in Supplementary Table 2.
Data analysis
Multiple sequences were aligned using the program Clustal W within MEGA11 (39). Genetic parameters including the number of haplotypes, haplotype diversity and nucleotide diversity were performed using DnaSP 5.1 (40). Pairwise Fst and Nst values were conducted by the DnaSP 5.1 to evaluate the genetic differentiation between pairs of populations. Fst values indicate the level of genetic differentiation (low is between zero and 0.05, moderate is between 0.05 and 0.15 and high is between 0.15 and 0.25). Tajima's D (41), Fu's Fs (42) and pairwise mismatch distribution analysis were performed to test neutrality using the same program (DnaSP 5.1). Tajima's D and Fu's Fs positive values indicate no deviation from neutrality, which is representative of stationary populations, whereas negative values indicate populations with recent expansion or purifying selection. Populations with only one sample were excluded in Asian countries for the above analyses. To evaluate relationships among haplotypes, a TCS network was drawn using PopArt 1.7 program (43, 44).
The hierarchical analysis of molecular variance (AMOVA) was analyzed to assess the genetic variation within and among B. gibsoni populations using Arlequin 3.5 (45). For this analysis, the populations from Asia or the three continents were treated as a single group and the populations from the three continents were divided into two groups, one from Asia and the other from America and Europe.
Population genetic structure was deduced by Structure v2.3.4 (46) using the admixture ancestry model. Each value of K (K = 1–10) was run with 10 iterations based on the Bayesian Markov Chain Monte Carlo approach. The optimal number of clusters (K) were inferred by ΔK using the online program Structure Harvester (47, 48). The clusters were shown using CLUMPP v1.1.2 (49) and DISTRUCT 1.1 programs (50). Discriminant analysis of principal components (DAPC) was applied to further identify the genetic clusters of B. gibsoni populations based on pre-defined groups using the adegenet package (51) implemented in the R software (52). For DAPC, the function “find. clusers” was employed to confirm the optimal number of clusters (53). The Mantel test was used to assess the relation between genetic distance and geographical distance by using zt software (54). Populations with only one haplotype were excluded in Asian countries for the above analyses.
Results
Molecular detection and identification of Babesia spp.
The results indicated that the positive rate of Babesia spp. was 5.6%, as seen in Supplementary Table 1. The positive rate of Babesia spp. infection was 3.6, 4.4, 14.7, and 10.0% in Chongqing, Quanzhou, Wuhan, and Xiangyang, respectively, as seen in Supplementary Table 1. The obtained sequences were 99.3–99.8% identical with B. gibsoni isolates from China (MN928826) by BLAST. The two sick dogs were identified as B. gibsoni positive. In total, 11 partial 18S rRNA sequences of B. gibsoni were used for the following analysis.
Genetic diversity analysis and haplotype network
Among the 409 aligned nucleotide sites, 32 variable sites were detected. Of 34 distinct haplotypes identified in 128 individuals, 31 were private haplotypes, as seen in Table 1. Haplotype Hap1 was most common and widespread, distributed in 93 B. gibsoni isolates from 12 areas, as seen in Table 1. Among different B. gibsoni populations from Asian countries, the haplotype diversity and nucleotide diversity ranged from 0.000 to 0.667 and from 0.0000 to 0.0035, respectively, as shown in Table 2. The highest haplotype diversity was found in Myanmar and the highest nucleotide diversity was found in China. The lowest haplotype and nucleotide diversity were found in Bangladesh, with only one haplotype (Hap1). Globally, the mean haplotype and nucleotide diversity were 0.473 and 0.0022, respectively, as shown in Table 2. The haplotype network showed that there was a low level of sequence differentiation and high frequency of unique mutations among populations, as seen in Figure 1 and Supplementary Figure 1.
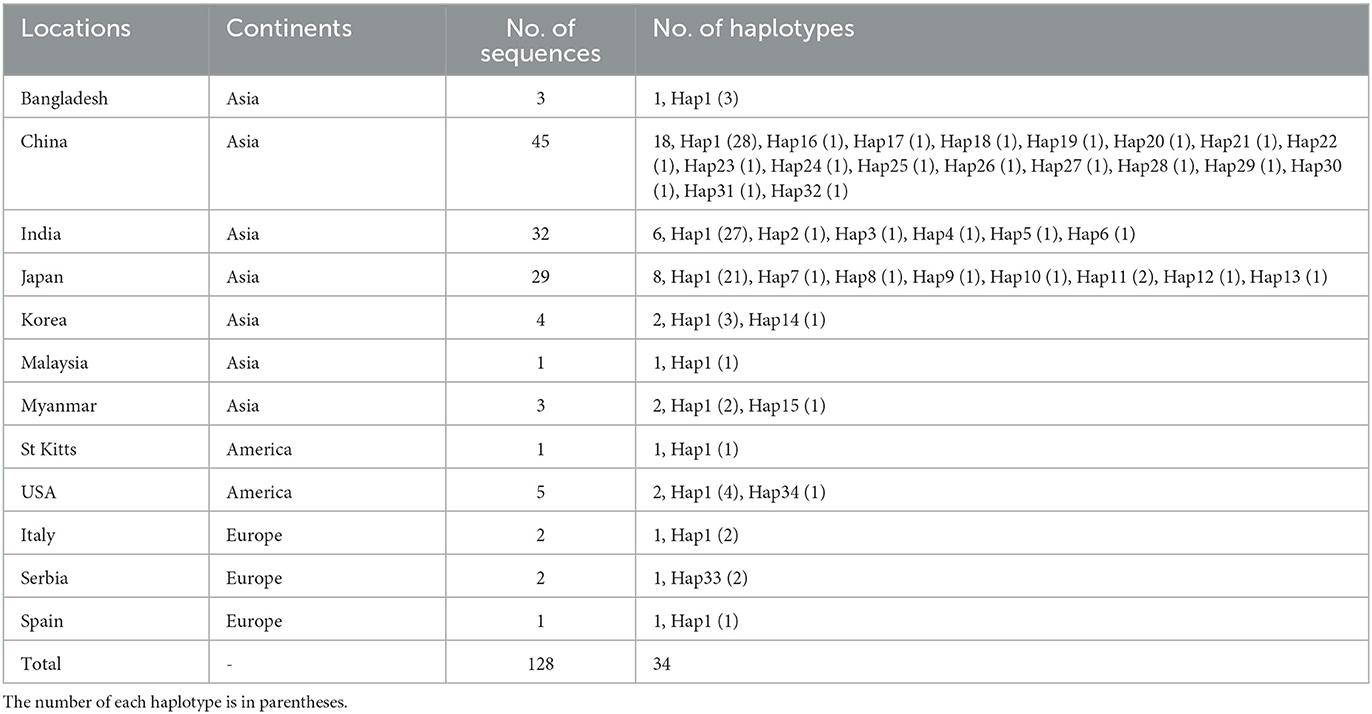
Table 1. Geographic origin of Babesia gibsoni isolates and the number of haplotypes.
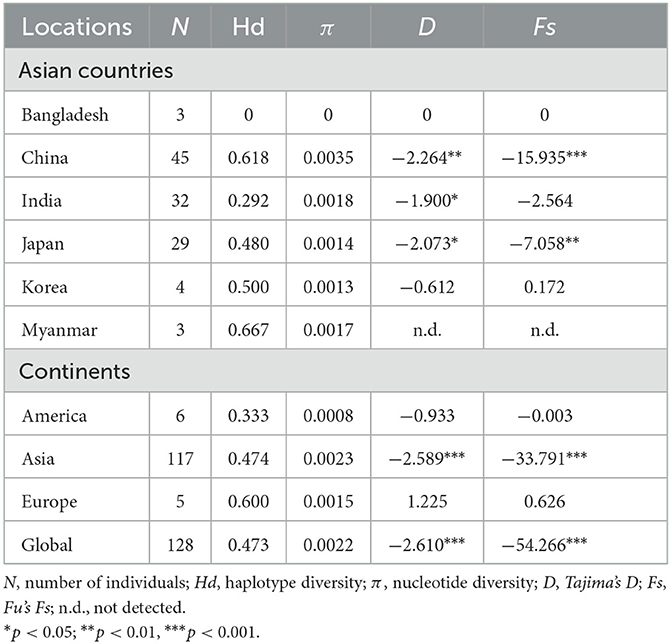
Table 2. Genetic parameters and neutrality tests of Babesia gibsoni populations.
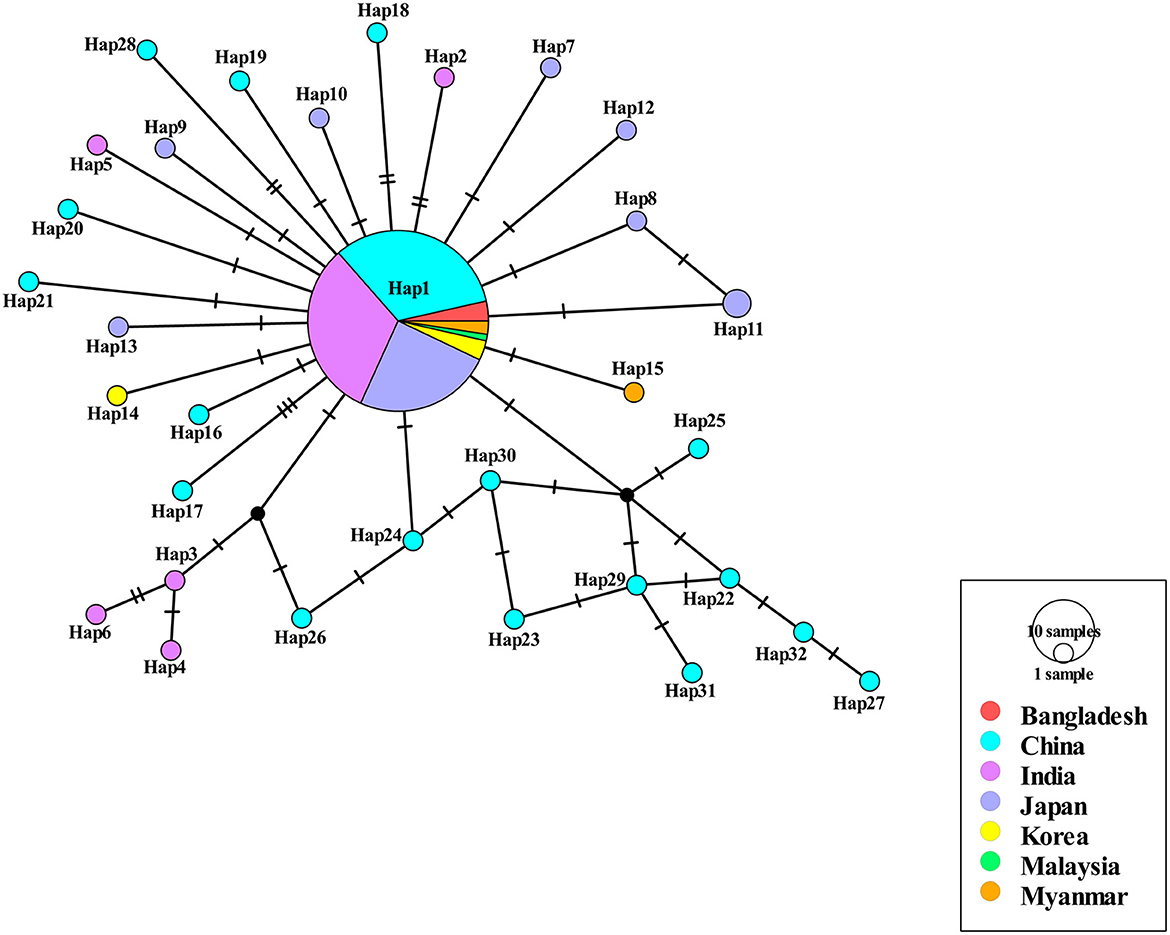
Figure 1. Haplotype network of Babesia gibsoni populations in Asia. Haplotype Hap1 containing 85 B. gibsoni isolates from seven countries including Bangladesh, China, India, Japan, Korea, Malaysia, and Myanmar. The size of the circle represents the frequency of each haplotype. The different colored dots represent haplotypes from the different populations.
Neutrality and demographic analysis
Tajima's D and Fu's Fs values were significantly negative for China and Japan, indicating a recent population expansion. When Asian populations were considered as a single group, the Tajima's D and Fu's Fs values were also significantly negative, revealing that the population had experienced recent expansion, as seen in Table 2. The demographic expansion was supported by the pairwise mismatch distribution analysis, as seen in Supplementary Figure 2. The populations from the three continents had also undergone recent expansion as determined by Tajima's D and Fu's Fs analyses with statistically significant negative values and a star-like haplotype network, as seen in Table 2 and Supplementary Figure 1.
Population genetic differentiation
The Asian population differentiation is described in Table 3. The results indicated that low genetic differentiation was observed between all pairs of populations, with Fst values ranging from 0.000 to 0.0585 and Nst values ranging from 0.000 to 0.0578, as shown in Table 3. Compared with other populations, the Chinese population showed the highest genetic differentiation with Fst values ranging from 0.0403 to 0.0585 and Nst values from 0.0405 to 0.0578, as seen in Table 3. The Fst and Nst values were also conducted between samples from Asia and those from America and Europe. The comparison results revealed that the highest differentiation was observed between America and Europe with an Fst value of 0.1765 and an Nst value of 0.1768, whereas the lowest differentiation was obtained between America and Asia with an Fst value of 0.0131 and an Nst value of 0.0130, as seen in Table 4.
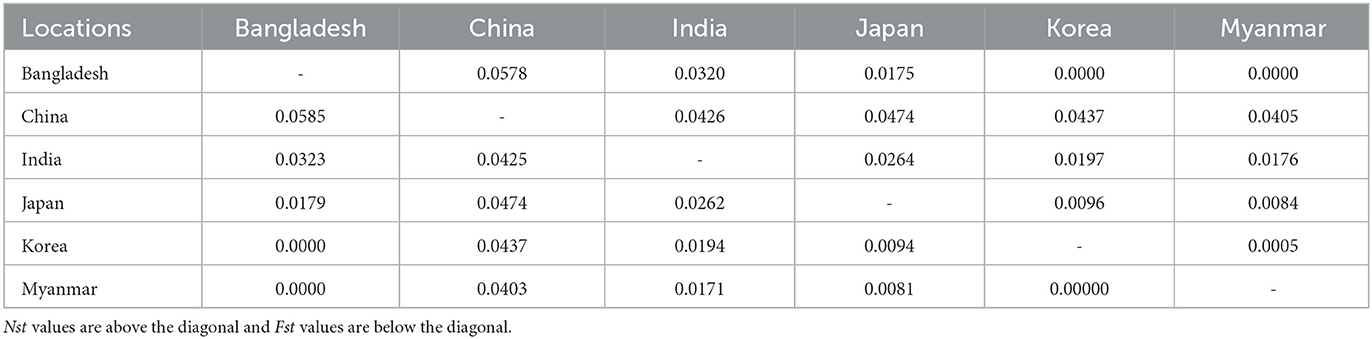
Table 3. Pairwise Fst and Nst values between Babesia gibsoni populations in Asia.
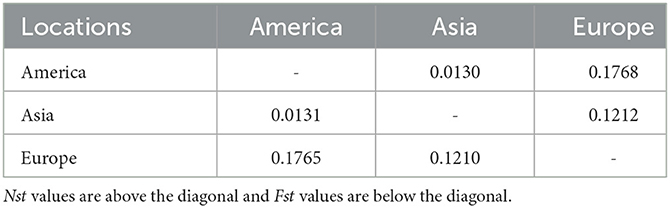
Table 4. Pairwise Fst and Nst values between Babesia gibsoni populations in three continents.
The AMOVA indicated that most genetic variation occurred within populations, when either Asian countries or the three continents were treated as a single group, as shown in Table 5. The hierarchical AMOVA showed that there was much less variation among groups and among populations within groups than within populations, which was supported by the low FCT and FSC values with no statistical significance, as shown in Table 5. These findings illustrated low genetic differentiation and high gene flow among populations.
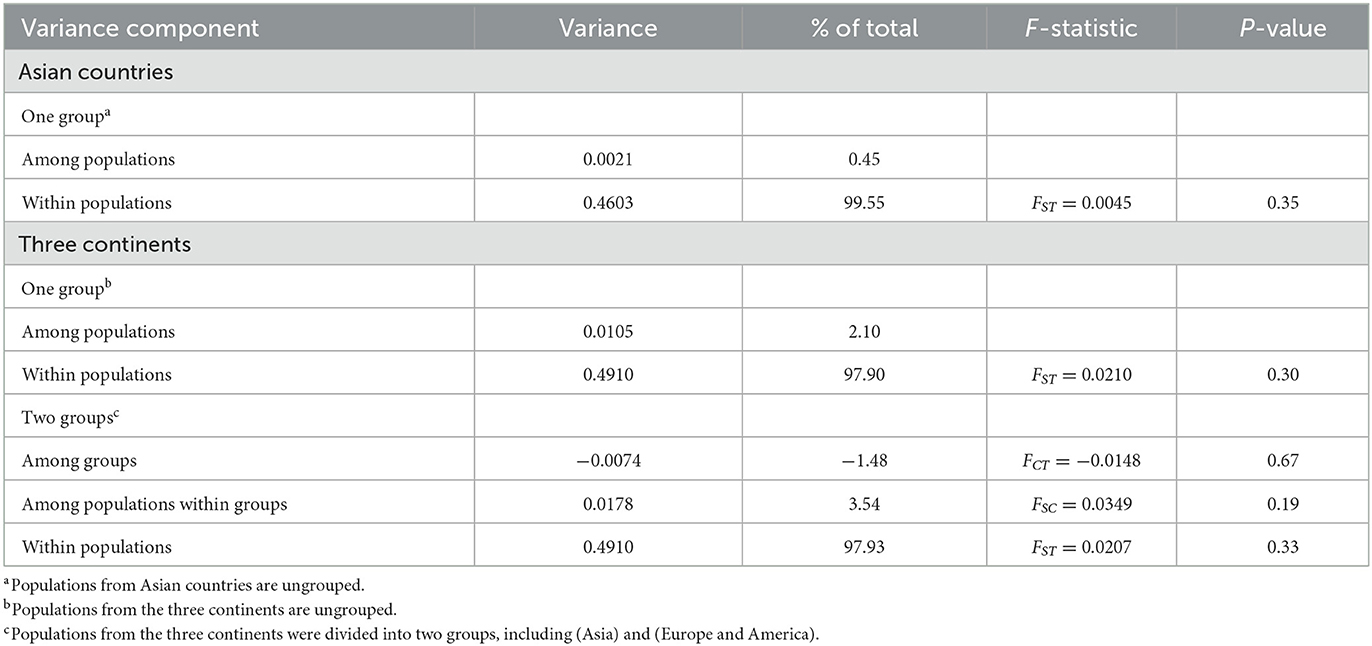
Table 5. Analysis of molecular variance (AMOVA) of Babesia gibsoni populations.
Population structure analysis
Structure analysis showed that obvious mixture haplotypes were observed, indicating a weak population structure among populations in Asia, as seen in Figure 2A. Similar results were also found in the genetic structure of B. gibsoni populations from Asia, America and Europe (data not shown). Bayesian clustering analysis indicated that there were three distinct clusters (K = 3, Figure 2B), suggesting that underlying subgroups were presented in Asia. The DAPC scatterplots analysis showed the geographical distribution characteristics of B. gibsoni populations in Asia (Figure 3). The Mantel test indicated no correlation between genetic distance and geographical distance between populations from Asia (P = 0.36). These findings suggested a low genetic sub-structuring among B. gibsoni populations. Overall, these results were supported by the pairwise Fst analysis and AMOVA, with low genetic differentiation among populations.
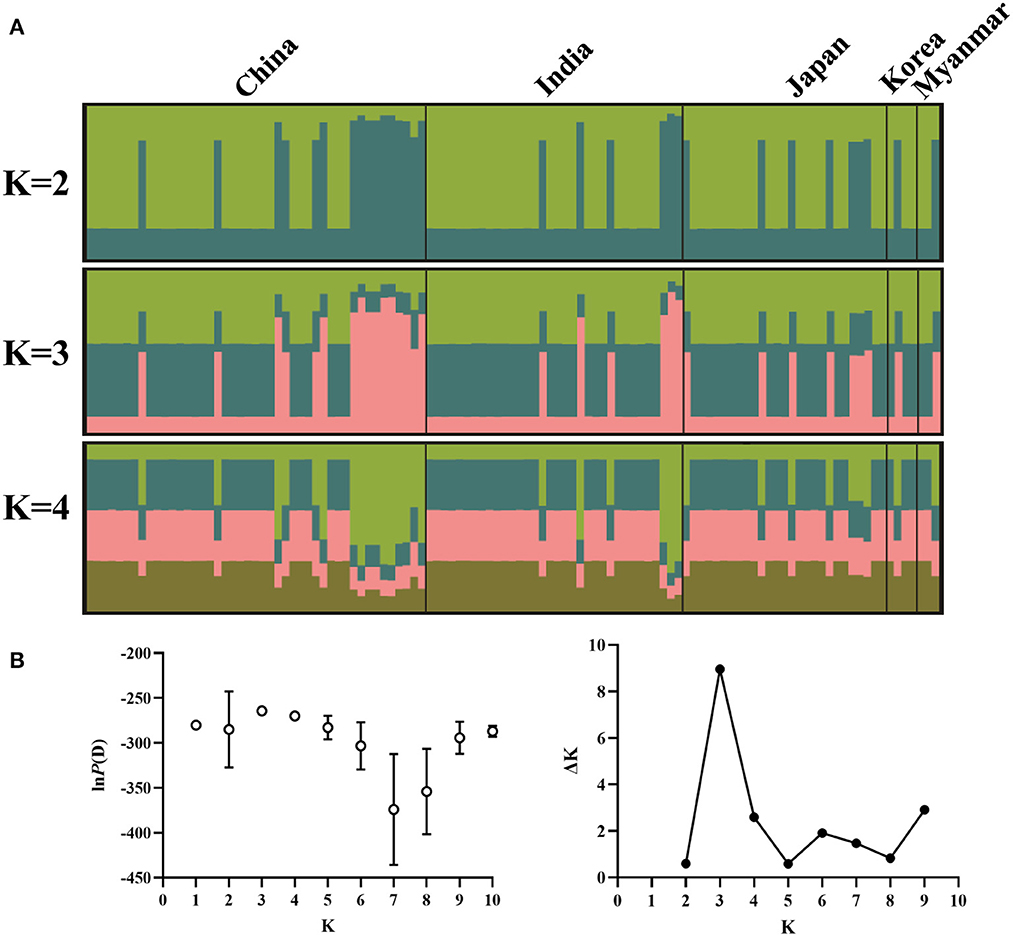
Figure 2. Genetic structure of Babesia gibsoni populations in Asia based on Bayesian cluster analysis. (A) The clusters are K = 2, K = 3, and K = 4. Different colors represent proportions of five populations in each inferred clusters and the sample name are given above. (B) Changes of the lnP(D) (mean ± SD) for K-values from 1 to 10 and the relationship between delta K and K values. When K = 3, delta K has the maximum value, indicating the true number of clusters is three.
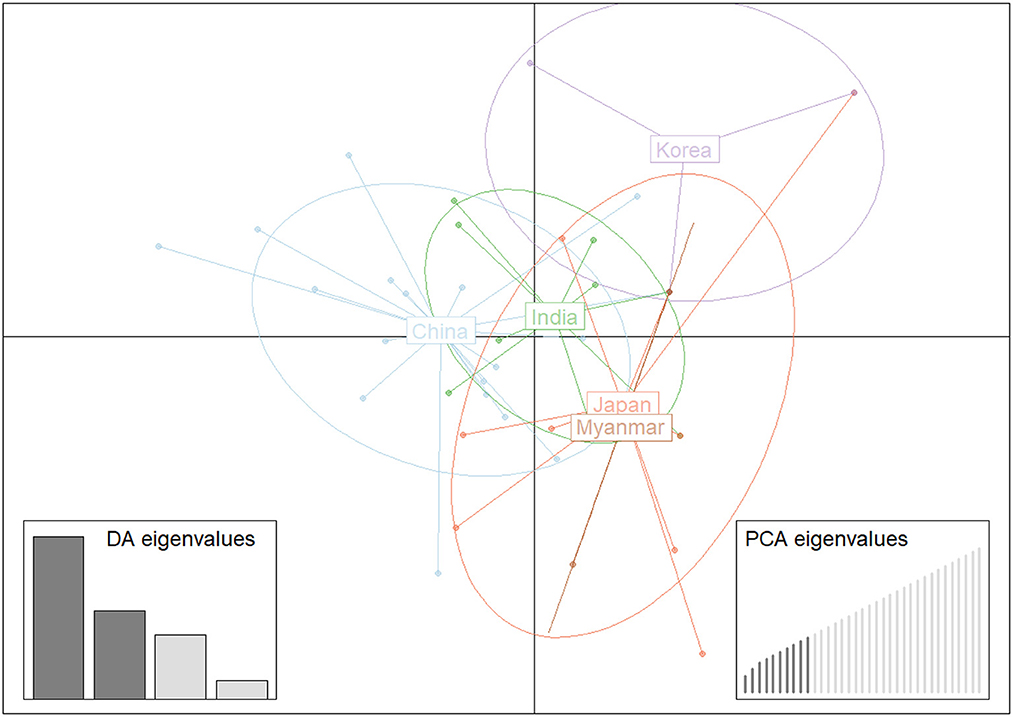
Figure 3. Discriminant analysis of principal components (DAPC) of Babesia gibsoni populations in Asia. Each population is pointed out by unique colors.
Discussion
This study found that the overall nucleotide diversity was 0.0023 and 0.0022 in populations from Asia and the three continents, respectively, revealing the low nucleotide variation among B. gibsoni populations. These results were much lower than that of H. canis (27), but similar to Plasmodium knowlesi (55) and Plasmodium vivax (56). Haplotype analysis indicated that the genetic diversity was observed with high haplotype diversity in Asian countries except for Bangladesh and India. Low haplotype diversity was found in Bangladesh and India, suggesting that the low degree of genetic variation of these two populations could be related to limited gene communication. The average haplotype diversity of 0.474 and 0.473 were in Asia and the three continents, respectively, which was lower in comparison with other protozoa such as H. canis (27) and P. knowlesi (55). Population size is an essential factor in affecting the genetic diversity, therefore, lower haplotype diversity seemed to correlate with a small effective population size in this study.
Demographic bottleneck is another important factor that can influence the genetic diversity of B. gibsoni populations. Neutrality tests showed that the Asian and three continent populations diverged from neutrality, indicating that the two populations probably have experienced recent expansion, which could be caused by bottlenecks or the founder effect (57). Rapid expansion of populations might cause an excess of rare haplotypes as observed in the Asian and three continent populations.
Gene flow is a driving force in the evolution of populations, which can increase the genetic diversity within populations but decrease the genetic difference between populations (58, 59). In this study, the majority of genetic variation in Asia (99.55%) and the three continents (97.90%) were partitioned within populations, implying a high gene flow among these populations as found in other species such as Cryptosporidium parvum, Giardia duodenalis, and H. canis (27, 60, 61). High gene flow was also supported by the low pairwise Fst values, revealing that low genetic differentiation was found between the populations. These results further demonstrated that genetic exchanges occurred among these populations, which could be related to the rapid geographical expansion of ticks and human migration with pets. However, a higher genetic difference was observed between the Chinese population and other populations, which could be correlated with the limited genetic exchanges within Asia. China is one of the largest land area countries with the suitable climate and environment for H. longicornis and R. sanguineus survival (62, 63), so it can be inferred that the unique ecological system of China prevented the spread of ticks and genetic recombination of B. gibsoni with other populations, which would explain why the Chinese population showed a higher genetic differentiation. On a large scale, the highest Fst value between the American and European populations indicated low gene flow between populations across continents. Low genetic differentiation was observed between the American and Asian populations, which might be related to the Asian genotype of B. gibsoni endemic in America (64). These results were consistent with a previous study in nematode where no or low genetic differentiation was observed between populations from neighboring countries in a single continent but significant genetic differentiation was detected in different continents due to the geographical isolation by distance patterns (65).
Although no correlation between genetic and geographical distances among B. gibsoni populations happened (Mantel test, P = 0.36), three subgroups were found in Asia that could be supported by Bayesian (K = 3) and DAPC analyses. The obvious mixture of haplotypes indicated that the separation among these populations was incomplete and similar findings have been reported in P. vivax and T. annulata (56, 66). In spite of the existence of ecological and geographical barriers, gene flow between these populations formed a complex population structure, which was probably related to frequent migration of humans carrying asymptomatic animals and the movement of hosts with ticks (27). Ticks and tick-borne diseases could be also carried by migratory birds during breeding and wintering areas as reported previously (67). Therefore, further studies to discover how B. gibsoni spread is influenced by human activities or the migration of birds will be essential. Collectively, there are many important factors such as transmission intensity, parasite-host coevolution, geographic and ecological segregation and selective pressure, which can promote the formation of the complex and unique of genetic structure and epidemic patterns among B. gibsoni populations.
Conclusion
In this study, the genetic diversity of B. gibsoni was systematically analyzed. These results revealed that low genetic differentiation, high gene flow and high genetic variation within populations were observed among B. gibsoni populations from a single continent, but higher genetic differentiation was detected among those across different continents. Neutrality tests indicated that these populations had experienced demographic expansion. These findings will contribute to a comprehensive understanding of genetic diversity of B. gibsoni and its complex population structure and provide a reference for developing better control strategies for the public health diseases.
Data availability statement
The data presented in the study are deposited in the GenBank repository, accession number OM392053-OM392060 and ON810382-ON810384.
Ethics statement
This study was approved by the Institutional Animal Care and Use Committee of Southwest University. All pet dogs were handled in accordance with the Animal Ethics Procedures and Guidelines of the People's Republic of China. Written informed consent was obtained from the owners for the participation of their animals in this study.
Author contributions
FY, HY, and FL conceived the project. DL collected blood samples. FY, CG, ZT, DM, and HL carried out laboratory work. FY performed the data analyses and prepared the manuscript with the support from GG and FL. All authors read and approved the final version of the manuscript.
Funding
This study was supported by the National Natural Science Foundation of China (Grant No. 32102695), the State Key Laboratory of Veterinary Etiological Biology, Lanzhou Veterinary Research Institute, Chinese Academy of Agricultural Sciences (Grant No. SKLVEB2021KFKT008), and Fundamental Research Funds for the Central Universities (Grant No. SWU-KT22014).
Acknowledgments
We would like to thank all the contributors who submitted sequences to GenBank and all the veterinary practitioners for assistance with sample collection.
Conflict of interest
The authors declare that the research was conducted in the absence of any commercial or financial relationships that could be construed as a potential conflict of interest.
Publisher's note
All claims expressed in this article are solely those of the authors and do not necessarily represent those of their affiliated organizations, or those of the publisher, the editors and the reviewers. Any product that may be evaluated in this article, or claim that may be made by its manufacturer, is not guaranteed or endorsed by the publisher.
Supplementary material
The Supplementary Material for this article can be found online at: https://www.frontiersin.org/articles/10.3389/fvets.2023.1147958/full#supplementary-material
Supplementary Figure 1. Haplotype network of Babesia gibsoni populations in three continents. Haplotype Hap1 containing 93 B. gibsoni isolates from Asia, America, and Europe, respectively. The size of the circle represents the frequency of each haplotype. The different colored dots represent haplotypes from the different populations.
Supplementary Figure 2. Pairwise mismatch distribution analysis of Babesia gibsoni populations in Asia. (A) Expansion pattern of China population. (B) Expansion pattern of Japan population. (C) Expansion pattern of Asian population. Red dotted lines represent the observed frequency and blue continuous lines represent the expected frequency.
Supplementary Table 1. Geographical distribution and prevalence of Babesia gibsoni in dogs in China.
Supplementary Table 2. The sequences of Babesia gibsoni used in this study.
References
1. Maggi RG, Kramer F. A review on the occurrence of companion vector-borne diseases in pet animals in Latin America. Parasit Vectors. (2019) 12:145. doi: 10.1186/s13071-019-3407-x
2. Fukumoto S, Suzuki H, Igarashi I, Xuan X. Fatal experimental transplacental Babesia gibsoni infections in dogs. Int J Parasitol. (2005) 35:1031–5. doi: 10.1016/j.ijpara.2005.03.018
3. Stegeman JR, Birkenheuer AJ, Kruger JM, Breitschwerdt EB. Transfusion-associated Babesia gibsoni infection in a dog. J Am Vet Med Assoc. (2003) 222:959–63. doi: 10.2460/javma.2003.222.959
4. Jefferies R, Ryan UM, Jardine J, Broughton DK, Robertson ID, Irwin PJ. Blood, Bull Terriers and Babesiosis: further evidence for direct transmission of Babesia gibsoni in dogs. Aust Vet J. (2007) 85:459–63. doi: 10.1111/j.1751-0813.2007.00220.x
5. Wozniak EJ, Barr BC, Thomford JW, Yamane I, McDonough SP, Moore PF, et al. Clinical, anatomic, and immunopathologic characterization of Babesia gibsoni infection in the domestic dog (Canis Familiaris). J Parasitol. (1997) 83:692–9. doi: 10.2307/3284248
6. Beck R, Vojta L, Mrljak V, Marinculic A, Beck A, Zivicnjak T, et al. Diversity of Babesia and Theileria species in symptomatic and asymptomatic dogs in Croatia. Int J Parasitol. (2009) 39:843–8. doi: 10.1016/j.ijpara.2008.12.005
7. Jalovecka M, Hajdusek O, Sojka D, Kopacek P, Malandrin L. The complexity of piroplasms life cycles. Front Cell Infect Microbiol. (2018) 8:248. doi: 10.3389/fcimb.2018.00248
8. Liu M, Igarashi I, Xuan X. Babesia gibsoni. Trends Parasitol. (2022) 38:815–6. doi: 10.1016/j.pt.2022.03.001
9. Terao M, Akter S, Yasin MG, Nakao R, Kato H, Alam MZ, et al. Molecular detection and genetic diversity of Babesia gibsoni in dogs in Bangladesh. Infect Genet Evol. (2015) 31:53–60. doi: 10.1016/j.meegid.2015.01.011
10. He L, Miao X, Hu J, Huang Y, He P, He J, et al. First molecular detection of Babesia gibsoni in dogs from Wuhan, China. Front Microbiol. (2017) 8:1577. doi: 10.3389/fmicb.2017.01577
11. Guo WP, Xie GC, Li D, Su M, Jian R, Du LY. Molecular detection and genetic characteristics of Babesia gibsoni in dogs in Shaanxi province, China. Parasit Vectors. (2020) 13:366. doi: 10.1186/s13071-020-04232-w
12. Ikadai H, Tanaka H, Shibahara N, Matsuu A, Uechi M, Itoh N, et al. Molecular evidence of infections with Babesia gibsoni parasites in Japan and evaluation of the diagnostic potential of a loop-mediated isothermal amplification method. J Clin Microbiol. (2004) 42:2465–9. doi: 10.1128/JCM.42.6.2465-2469.2004
13. Jia H, Aboge GO, Terkawi MA, Goo YK, Nishikawa Y, Kuriki K, et al. Genetic diversity of two selected antigen loci in Babesia gibsoni Asian genotype obtained from Japan and Jeju island of South Korea. Vet Parasitol. (2009) 162:142–6. doi: 10.1016/j.vetpar.2009.02.025
14. El-Dakhly KM, Goto M, Noishiki K, El-Nahass el S, Sakai H, Yanai T, et al. Distribution patterns of Babesia gibsoni infection in hunting dogs from nine Japanese islands. J Parasitol. (2015) 101:160–6. doi: 10.1645/14-564.1
15. Kubo S, Tateno M, Ichikawa Y, Endo Y. A molecular epidemiological survey of Babesia, Hepatozoon, Ehrlichia and Anaplasma infections of dogs in Japan. J Vet Med Sci. (2015) 77:1275–9. doi: 10.1292/jvms.15-0079
16. Zahler M, Rinder H, Zweygarth E, Fukata T, Maede Y, Schein E, et al. “Babesia gibsoni” of dogs from North America and Asia belong to different species. Parasitology. (2000) 120:365–9. doi: 10.1017/S0031182099005557
17. Bawm S, Myaing TT, Thu MJ, Akter S, Htun LL, Win MM, et al. PCR detection and genetic characterization of piroplasms from dogs in Myanmar, and a possible role of dogs as reservoirs for Theileria parasites infecting cattle, water Buffaloes, and goats. Ticks Tick Borne Dis. (2021) 12:101729. doi: 10.1016/j.ttbdis.2021.101729
18. Do T, Ngasaman R, Saechan V, Pitaksakulrat O, Liu M, Xuan X, et al. First molecular detection of Babesia gibsoni in stray dogs from Thailand. Pathogens. (2021) 10:60639. doi: 10.3390/pathogens10060639
19. Muhlnickel CJ, Jefferies R, Morgan-Ryan UM, Irwin PJ. Babesia gibsoni infection in three dogs in Victoria. Aust Vet J. (2002) 80:606–10. doi: 10.1111/j.1751-0813.2002.tb10961.x
20. Matjila PT, Penzhorn BL, Leisewitz AL, Bhoora R, Barker R. Molecular characterisation of Babesia gibsoni infection from a pit-bull terrier pup recently imported into South Africa. J S Afr Vet Assoc. (2007) 78:2–5. doi: 10.4102/jsava.v78i1.277
21. Kelly PJ, Koster L, Li J, Zhang J, Huang K, Branford GC, et al. Survey of vector-borne agents in feral cats and first report of Babesia gibsoni in cats on St Kitts, West Indies. BMC Vet Res. (2017) 13:331. doi: 10.1186/s12917-017-1230-1
22. Carli E, De Arcangeli S, Montelli S, Caldin M, Ligorio E, Furlanello T. Babesia gibsoni infection in Italy: A cross sectional study of 607 blood samples belonging to dogs that needed a molecular analysis investigation (2016-2019). Vet Parasitol Reg Stud Reports. (2021) 25:100596. doi: 10.1016/j.vprsr.2021.100596
23. Davitkov D, Vucicevic M, Stevanovic J, Krstic V, Tomanovic S, Glavinic U, et al. Clinical babesiosis and molecular identification of Babesia canis and Babesia gibsoni infections in dogs from Serbia. Acta Vet Hung. (2015) 63:199–208. doi: 10.1556/avet.2015.017
24. Criado-Fornelio A, Gonzalez-del-Rio MA, Buling-Sarana A, Barba-Carretero JC. Molecular characterization of a Babesia gibsoni isolate from a Spanish dog. Vet Parasitol. (2003) 117:123–9. doi: 10.1016/j.vetpar.2003.08.006
25. Bostrom B, Wolf C, Greene C, Peterson DS. Sequence conservation in the rRNA first internal transcribed spacer region of Babesia gibsoni genotype Asia isolates. Vet Parasitol. (2008) 152:152–7. doi: 10.1016/j.vetpar.2007.11.024
26. McDonald BA, Linde C. Pathogen population genetics, evolutionary potential, and durable resistance. Annu Rev Phytopathol. (2002) 40:349–79. doi: 10.1146/annurev.phyto.40.120501.101443
27. Vasquez-Aguilar AA, Barbachano-Guerrero A, Angulo DF, Jarquin-Diaz VH. Phylogeography and population differentiation in Hepatozoon Canis (Apicomplexa: Hepatozoidae) reveal expansion and gene flow in world populations. Parasit Vectors. (2021) 14:467. doi: 10.1186/s13071-021-04924-x
28. Flores DA, Minichiello Y, Araujo FR, Shkap V, Benitez D, Echaide I, et al. Evidence for extensive genetic diversity and substructuring of the Babesia bovis metapopulation. Transbound Emerg Dis. (2013) 60:131–6. doi: 10.1111/tbed.12121
29. Mira A, Unlu AH, Bilgic HB, Bakirci S, Hacilarlioglu S, Karagenc T, et al. High genetic diversity and differentiation of the Babesia ovis population in Turkey. Transbound Emerg Dis. (2020) 67:26–35. doi: 10.1111/tbed.13174
30. Yin F, Liu Z, Liu J, Liu A, Salih DA, Li Y, et al. Population genetic analysis of Theileria annulata from six geographical regions in China, determined on the basis of micro- and mini-satellite markers. Front Genet. (2018) 9:50. doi: 10.3389/fgene.2018.00050
31. Salih DA, Mwacharo JM, Pelle R, Njahira MN, Odongo DO, Mbole-Kariuki MN, et al. Genetic diversity and population structure of Theileria parva in South Sudan. Ticks Tick Borne Dis. (2018) 9:806–13. doi: 10.1016/j.ttbdis.2018.03.002
32. Nehra AK, Kumari A, Moudgil AD, Vohra S. Phylogenetic analysis, genetic diversity and geographical distribution of Babesia caballi based on 18s rRNA gene. Ticks Tick Borne Dis. (2021) 12:101776. doi: 10.1016/j.ttbdis.2021.101776
33. Mandal M, Banerjee PS, Garg R, Ram H, Kundu K, Kumar S, et al. Genetic characterization and phylogenetic relationships based on 18S rRNA and ITS1 region of small form of canine Babesia spp. from India. Infect Genet Evol. (2014) 27:325–31. doi: 10.1016/j.meegid.2014.07.033
34. Mandal M, Banerjee PS, Kumar S, Ram H, Garg R, Pawde AM. Development of loop-mediated isothermal amplification (LAMP) for detection of Babesia gibsoni infection in dogs. Vet Parasitol. (2015) 209:50–5. doi: 10.1016/j.vetpar.2015.02.008
35. Mittal M, Kundu K, Chakravarti S, Mohapatra JK, Singh VK, Raja Kumar B, et al. Canine babesiosis among working dogs of organised kennels in India: A comprehensive haematological, biochemical, clinicopathological and molecular epidemiological multiregional study. Prev Vet Med. (2019) 169:104696. doi: 10.1016/j.prevetmed.2019.104696
36. Yeagley TJ, Reichard MV, Hempstead JE, Allen KE, Parsons LM, White MA, et al. Detection of Babesia gibsoni and the canine small Babesia “Spanish isolate” in blood samples obtained from dogs confiscated from dogfighting operations. J Am Vet Med Assoc. (2009) 235:535–9. doi: 10.2460/javma.235.5.535
37. Wang J, Liu J, Yang J, Liu Z, Wang X, Li Y, et al. Molecular detection and genetic diversity of Babesia canis canis in pet dogs in Henan Province, China. Parasitol Int. (2019) 71:37–40. doi: 10.1016/j.parint.2019.03.011
38. Yang JF, Li YQ, Liu ZJ, Liu JL, Guan GQ, Chen Z, et al. Molecular evidence for piroplasms in wild Reeves' muntjac (Muntiacus Reevesi) in China. Parasitol Int. (2014) 63:713–6. doi: 10.1016/j.parint.2014.06.002
39. Tamura K, Stecher G, Kumar S. MEGA11: Molecular evolutionary genetics analysis version 11. Mol Biol Evol. (2021) 38:3022–7. doi: 10.1093/molbev/msab120
40. Librado P, Rozas J. DnaSP V5: A software for comprehensive analysis of DNA polymorphism data. Bioinformatics. (2009) 25:1451–2. doi: 10.1093/bioinformatics/btp187
41. Tajima F. Statistical method for testing the neutral mutation hypothesis by DNA polymorphism. Genetics. (1989) 123:585–95. doi: 10.1093/genetics/123.3.585
42. Fu YX. Statistical tests of neutrality of mutations against population growth, hitchhiking and background selection. Genetics. (1997) 147:915–25. doi: 10.1093/genetics/147.2.915
43. Clement M, Posada D, Crandall KA. TCS: A computer program to estimate gene genealogies. Mol Ecol. (2000) 9:1657–9. doi: 10.1046/j.1365-294x.2000.01020.x
44. Leigh JW, Bryant D. Popart: Full-feature software for haplotype network construction. Methods Ecol Evol. (2015) 6:1110–6. doi: 10.1111/2041-210X.12410
45. Excoffier L, Lischer HE. Arlequin suite ver 3.5: A new series of programs to perform population genetics analyses under Linux and Windows. Mol Ecol Resour. (2010) 10:564–7. doi: 10.1111/j.1755-0998.2010.02847.x
46. Pritchard JK, Stephens M, Donnelly P. Inference of population structure using multilocus genotype data. Genetics. (2000) 155:945–59. doi: 10.1093/genetics/155.2.945
47. Evanno G, Regnaut S, Goudet J. Detecting the number of clusters of individuals using the software structure: A simulation study. Mol Ecol. (2005) 14:2611–20. doi: 10.1111/j.1365-294X.2005.02553.x
48. Earl DA, VonHoldt BM. Structure Harvester: A website and program for visualizing structure output and implementing the evanno method. Conserv Genet Resour. (2012) 4:359–61. doi: 10.1007/s12686-011-9548-7
49. Jakobsson M, Rosenberg NA. CLUMPP: A cluster matching and permutation program for dealing with label switching and multimodality in analysis of population structure. Bioinformatics. (2007) 23:1801–6. doi: 10.1093/bioinformatics/btm233
50. Rosenberg NA. Distruct: A program for the graphical display of population structure. Mol Ecol Notes. (2004) 4:137–8. doi: 10.1046/j.1471-8286.2003.00566.x
51. Jombart T. Adegenet: A R package for the multivariate analysis of genetic markers. Bioinformatics. (2008) 24:1403–5. doi: 10.1093/bioinformatics/btn129
52. R Core Team. R: A Language and Environment for Statistical Computing. Vienna: R Foundation for Statistical Computing (2011).
53. Jombart T, Devillard S, Balloux F. Discriminant analysis of principal components: A new method for the analysis of genetically structured populations. BMC Genet. (2010) 11:94. doi: 10.1186/1471-2156-11-94
54. Bonnet E, de Peer YV. Zt: A sofware tool for simple and partial mantel tests. J Statist Softw. (2002) 7:1–12. doi: 10.18637/jss.v007.i10
55. Yusof R, Ahmed MA, Jelip J, Ngian HU, Mustakim S, Hussin HM, et al. Phylogeographic evidence for 2 genetically distinct zoonotic Plasmodium knowlesi parasites, Malaysia. Emerg Infect Dis. (2016) 22:1371–80. doi: 10.3201/eid2208.151885
56. Zhang X, Wei H, Zhang Y, Zhao Y, Wang L, Hu Y, et al. Genetic diversity of Plasmodium vivax reticulocyte binding protein 2b in global parasite populations. Parasit Vectors. (2022) 15:205. doi: 10.1186/s13071-022-05296-6
57. Mita T, Jombart T. Patterns and dynamics of genetic diversity in Plasmodium falciparum: What past human migrations tell us about Malaria. Parasitol Int. (2015) 64:238–43. doi: 10.1016/j.parint.2014.09.007
58. Endler JA. Gene flow and population differentiation. Science. (1973) 179:243–50. doi: 10.1126/science.179.4070.243
59. Gao F, Chen C, Li B, Weng Q, Chen Q. The gene flow direction of geographically distinct phytophthora infestans populations in China corresponds with the route of seed potato exchange. Front Microbiol. (2020) 11:1077. doi: 10.3389/fmicb.2020.01077
60. Corsi GI, Tichkule S, Sannella AR, Vatta P, Asnicar F, Segata N, et al. Recent genetic exchanges and admixture shape the genome and population structure of the zoonotic pathogen Cryptosporidium parvum. Mol Ecol. (2022). doi: 10.1111/mec.16556
61. Zhang X, Dan J, Wang L, Liu H, Zhou Z, Ma X, et al. High genetic diversity of Giardia duodenalis assemblage E in Chinese dairy cattle. Infect Genet Evol. (2021) 92:104912. doi: 10.1016/j.meegid.2021.104912
62. Chen Z, Yang X, Bu F, Yang X, Yang X, Liu J. Ticks (Acari: Ixodoidea: Argasidae, Ixodidae) of China. Exp Appl Acarol. (2010) 51:393–404. doi: 10.1007/s10493-010-9335-2
63. Zhang YK, Zhang XY, Liu JZ. Ticks (Acari: Ixodoidea) in China: Geographical distribution, host diversity, and specificity. Arch Insect Biochem Physiol. (2019) 102:e21544. doi: 10.1002/arch.21544
64. Birkenheuer AJ, Levy MG, Breitschwerdt EB. Efficacy of combined atovaquone and azithromycin for therapy of chronic Babesia gibsoni (Asian genotype) infections in dogs. J Vet Intern Med. (2004) 18:494–8. doi: 10.1111/j.1939-1676.2004.tb02573.x
65. Troell K, Engstrom A, Morrison DA, Mattsson JG, Hoglund J. Global patterns reveal strong population structure in Haemonchus contortus, a nematode parasite of domesticated ruminants. Int J Parasitol. (2006) 36:1305–16. doi: 10.1016/j.ijpara.2006.06.015
66. Weir W, Ben-Miled L, Karagenc T, Katzer F, Darghouth M, Shiels B, et al. Genetic exchange and sub-structuring in Theileria annulata populations. Mol Biochem Parasitol. (2007) 154:170–80. doi: 10.1016/j.molbiopara.2007.04.015
Keywords: Babesia gibsoni, genetic diversity, population structure, gene flow, 18S rRNA gene
Citation: Yin F, Guo C, Tian Z, Li D, Mu D, Liu H, Guan G, Yin H and Li F (2023) Analysis of genetic diversity and population structure of Babesia gibsoni. Front. Vet. Sci. 10:1147958. doi: 10.3389/fvets.2023.1147958
Received: 19 January 2023; Accepted: 02 March 2023;
Published: 23 March 2023.
Edited by:
Mingming Liu, Hubei University of Arts and Science, ChinaReviewed by:
Aaron Edmond Ringo, Obihiro University of Agriculture and Veterinary Medicine, JapanYongchang Li, Xinjiang Agricultural University, China
Copyright © 2023 Yin, Guo, Tian, Li, Mu, Liu, Guan, Yin and Li. This is an open-access article distributed under the terms of the Creative Commons Attribution License (CC BY). The use, distribution or reproduction in other forums is permitted, provided the original author(s) and the copyright owner(s) are credited and that the original publication in this journal is cited, in accordance with accepted academic practice. No use, distribution or reproduction is permitted which does not comply with these terms.
*Correspondence: Facai Li, bGlmYWNhaUBzd3UuZWR1LmNu; Hong Yin, eWluaG9uZ0BjYWFzLmNu