
94% of researchers rate our articles as excellent or good
Learn more about the work of our research integrity team to safeguard the quality of each article we publish.
Find out more
ORIGINAL RESEARCH article
Front. Vet. Sci. , 10 March 2023
Sec. Veterinary Infectious Diseases
Volume 10 - 2023 | https://doi.org/10.3389/fvets.2023.1092302
This article is part of the Research Topic Livestock and its role in the emergence, spread, and evolution of antimicrobial resistance: Animal-to-human or animal-to-environment transmission View all 10 articles
 Rianna Anwar Sani1
 Jaap A. Wagenaar1,2,3
 Tagrid E. H. A. Dinar1
 Sunandar Sunandar4Nofita Nurbiyanti4Imron Suandy5Gian Pertela6Elvina J. Jahja7Budi Purwanto8CORNERSTONE group
 Ingeborg M. van Geijlswijk9
 David C. Speksnijder1,3,10*
Introduction: Indonesia has a large broiler industry with extensive antimicrobial use (AMU) according to empirical evidence. However, there are no quantitative data of on-farm AMU. Quantification of AMU at farm level is crucial to guide interventions on antimicrobial stewardship (AMS). The objective of this study was to compare on-farm AMU monitoring methods, to assess which monitoring method is best suited to gain insight in the quantitative AMU at farm level in medium-scale Indonesian broiler farms.
Method: AMU was calculated using four different indicators—mg/PCU (mass-based), TFUDDindo (Treatment Frequency of Used Daily Dose, dose-based), TFDDDvet (Treatment Frequency of Defined Daily Dose, dose-based), and TFcount−based (count-based)—for the total AMU of 98 production cycles with an average length of 30 days.
Results: Broilers were exposed to an average of 10 days of antimicrobial treatments per production cycle, whereas 60.8% of the antimicrobials belonged to the Highest Priority Critically Important Antimicrobials (HPCIAs). For each pair of indicators, the Spearman rank correlation coefficient was calculated to assess if the production cycles were ranked consistently in increasing AMU across the different indicators. The correlation varied between 0.4 and 0.8.
Discussion: This study illustrates the considerable difference in the ranking of AMU between the different indicators. In a setting comparable to medium-scale broiler farms in Indonesia, where resources are scarce and there is no professional oversight, the TFcount−based method is best suitable. Before implementing an AMU monitoring method, careful consideration of the use-indicators is paramount to achieve fair benchmarking.
The increase of antimicrobial resistance (AMR) is seen as a major health threat for humans and animals worldwide. It is estimated that 1.27 million human deaths are attributable to bacterial AMR in 2019, and if no action is taken, AMR could become one of the biggest causes of human death by 2050 (1, 2). Multiple studies have illustrated that antimicrobial use (AMU) in livestock results in increased occurrence and dissemination of cross sectoral AMR. A reduction in AMU will reduce selection for AMR, which could eventually result in a decrease of AMR (3–7). A concern regarding AMR development in livestock is the frequent use of antimicrobials categorized by the World Health Organization (WHO) as Highest Priority Critically Important Antimicrobials (HPCIAs) for human medicine, such as 3rd and 4th generation cephalosporins, colistin and fluoroquinolones (8).
It is estimated that the majority of globally used antimicrobials (73%) are used in animals reared for food production, and the total amount used in animals is projected to increase by 11.5% by 2030, primarily in Asia (6, 9). This increase is most likely due to the intensification of the livestock industry to meet the growing demand for animal protein, particularly in Low- and Middle-Income Countries (LMICs) (5, 10). In many of these countries, professional veterinary oversight is lacking and antimicrobials can be purchased without a prescription, increasing the risk of the development of AMR due to indiscriminate use in livestock (11, 12).
With a population of 280 million people in 2022, Indonesia is the fourth highest populated country in the world. The Indonesian broiler sector accounts for 87% of the consumed meat, and empirical studies indicate that the broiler industry accounts for around 60% of the antimicrobial use in livestock (13, 14). Although a pilot surveillance study in 2019 has collected qualitative data on AMU, quantitative data on AMU at farm-level in the Indonesian broiler sector is lacking (15). There is no structural professional veterinary oversight over AMU (14). Availability of reliable AMU data at farm level is vital for antimicrobial stewardship (AMS) initiatives, targeting imprudent use, encouraging improvements in animal husbandry, biosecurity, and enabling detailed risk and trend analyses (16).
Setting up AMU monitoring systems involves various challenges, a major one being the choice of indicators for quantifying and reporting results. The indicator is a technical unit used to quantify an animal's exposure to antimicrobials. In the numerator, the indicator contains a unit of measurement (UM) that expresses the amount of antimicrobials used. Depending on the context and objective of the AMU monitoring system, a dose-based, mass-based or count-based UM can be used. A dose-based UM uses the number of standardized dosages (usually in mg/kg) in the numerator, a mass-based UM the total mass of the antimicrobials applied (usually in milligrams) in the numerator, and a count-based UM the number of administrations of an antimicrobial product. All UMs are applied during a defined period (e.g., production cycle, year). The denominator contains the animal population that is exposed to antimicrobials in a specific time period (16). By dividing the UM by the animal population that is exposed in the same time period, a treatment frequency (TF) can be calculated (quantity of AMU per time period). A major challenge is developing an AMU monitoring tool that is both easy to use in the local context and reliable in the collection, analysis and reporting of AMU data.
The objective of our study was to compare on-farm AMU monitoring methods for Indonesian broiler farms, to assess which monitoring method is best suited to gain insight in the quantitative AMU at farm level in medium-scale Indonesian broiler farms.
Usage data from the CORNERSTONE project was used (17). This project is a longitudinal study which was initiated and coordinated by researchers from the Faculty of Veterinary Medicine of Utrecht University, in cooperation with the Center for Indonesian Veterinary Analytical Studies (CIVAS), Medion (Indonesian veterinary pharmaceutical company with direct relationships with poultry farmers) and FAO Indonesia, taking place from 2018 to 2023. In this project, a sample of nineteen medium scale broiler farms located in the western part of Java Island, Indonesia was selected for baseline data collection and an intervention study with the objective of increasing prudent AMU. The study is performed on medium-scale farms as this group forms the largest number of commercial farms in Indonesia. The farms were selected using a convenience sampling method from the client database provided by Medion and have either open- or semi-open housing systems. All farms were independent medium-scale commercial broiler farms with 5,000–20,000 broilers, utilizing developed housing and equipment, applying low to moderate biosecurity measures and usually marketing the birds commercially. During the recruitment process, farmers were explained the objective of the CORNERSTONE project was to gain insights in on-farm AMU in order to develop recommendations to optimize AMU. The implementation of these recommendations is voluntary, and farmers can quit the study at any point in time. All farmers signed an informed consent form prior to data collection. All traceable data was anonymized.
Existing on-farm AMU monitoring systems were explored and the guideline “Quantification of veterinary antimicrobial usage at herd level and analysis, communication and benchmarking to improve responsible usage” (AACTING) was selected as the basis to develop an on-farm AMU monitoring system for medium-scale broiler farms in Indonesia (18). The different steps of the AACTING guideline were followed, which addresses the requirements for developing an AMU monitoring system regarding (1) data collection, (2) data analysis (including how to quantify AMU), (3) benchmarking, and (4) reporting (18).
In Step 2 (data analysis), the different options for unit of measurement (UM; the numerator of an indicator) to quantify AMU at farm level were considered. A UM of each of the three different categories—mass-based, dose-based, and count-based AMU metrics—was used for this study. Most farmers or farm managers on medium-scale poultry farms lack knowledge of prudent AMU and do not consult a veterinary professional when administering antimicrobials. This leads to a high variety of dosages. Using a standardized dose in the denominator on these farms could lead to an over- or underestimation of the actual AMU. The seriousness of this error was assessed by calculating the actual dose used. For each production cycle analyzed, we calculated two dose-based (Used Daily Dose (UDD) and Defined Daily Dose (DDDvet)), one mass-based (mg/kg) and one count-based (number of single-day treatments) UM. DDDvet as defined by the European Medicines Agency (EMA) uses a standardized dose derived from European data, whereas UDD is calculated using the measured use data from the studied farms (18). By calculating AMU both with UDD and DDDvet the applicability of the European standard DDDvet in the context of Indonesian medium-scale broiler farms is examined.
AMU data was collected from at least four successive production cycles of one broiler house per participating farm. During each production cycle, an extension worker from CIVAS visited the farms three times (at the start, in the middle and just before harvest) to assemble and check the quality of the collected data. These extension workers instructed the farmers at the start of the project on what data they needed to collect. AMU data was collected using daily treatment records filled in by the farmers along with drug collection bins. The records contained the date and age of the broilers at application, the (brand) name of the veterinary medicinal product (VMP), purpose of use, the amount of the products used and the route of application. The drug collection bins were provided during the first visit from extension workers and emptied at the end of each cycle. The farmers were requested to place all used packages of administered products (except for feed packets) into the drug bins. During a cycle, the farmers were requested to send a picture or copy of the daily records every week. The farmers recorded the number of chicks at the start of the cycle, daily mortality rate, number of broilers sent to slaughter, and harvest weight. For some production cycles mortality rates were missing; in these cases, the number of broilers at the start of the cycle was used to calculate the denominator.
As the farmers did not record the average daily bodyweight of the broilers, the “standard” Indonesian growth curve for the Cobb strain was used to estimate the bodyweight of the broilers on each day of the production cycle (19). A standardized mean bodyweight throughout the cycle of 1.0 kg (as used in EMA guideline) was used for the mass-based indicator (20).
All collected data were entered and analyzed in Microsoft Excel 365 (Microsoft Corp., Redmond, USA). Quality check of the data was performed manually by checking the input. The exact (antimicrobial) contents of the VMPs that the farmers had applied were obtained through the Index for Veterinary Medicines Indonesia and cross-checked (Index list with used products) by an Indonesian veterinarian from CIVAS (21).
The first indicator calculated is mass-based and expressed in milligrams (mg) of active substance per Population Correction Unit (PCU). This indicator is calculated as (20):
The second indicator is the dose-based Treatment Frequency of used daily dose (TFUDDindo). The UM for this indicator was calculated for broilers specifically on the included production cycles of the study farms and was therefore named UDDindo. UDDindo is defined as “the actual administered dose (as active substance in mg) per standardized bodyweight (kg) of an animal at treatment.” The UM UDDindo needed to be established per treatment before the indicator TFUDDindo can be calculated. UDDindo was calculated per treatment as:
When the UDDindo was calculated for each specific treatment during a cycle, the average UDDindo for each active substance in all studied production cycles was calculated by dividing the sum of UDDindo for a specific active substance by the number of treatments that contained the same antimicrobial active substance (Table 1).

Table 1. Overview of defined DDDvet and calculated UDDindo values used to calculate TFDDDvet and TFUDDindo respectively per production cycle.
Once the UDDindo for each active substance was determined, the TFUDDindo was calculated by:
The third indicator is comparable to TFUDDindo but uses defined daily dosages instead of used daily dosages. This indicator is TF Defined Daily Dose (TFDDDvet). The DDDvet values were obtained according to the calculations by the European Medicines Agency (20). As the bodyweight plays a significant role in calculating AMU in broilers, the same standardized bodyweight at day of treatment was used as in TFUDDindo.
The fourth indicator TFcount−based is count-based and expressed as the number of days under treatment per production cycle. If a VMP contained two antimicrobial active substances, it was counted as two separate treatments:
The treatment frequencies therefore portray the proportion of days the broilers were under antimicrobial treatment during a standardized production cycle of 30 days.
An arbitrary benchmark analogous to the Dutch system was placed on the upper quartile in the ranking of each of the four indicators (22). The cycles within the highest AMU quartile (n = 25) were defined as “high AMU.”
For each of the four aforementioned indicators the AMU per production cycle was ordered from the lowest to the highest value. To test if these rankings for each specific indicator were correlated Spearman rank correlation coefficients (ρ) were calculated for each pair of indicators. The Spearman rank correlation coefficient measures the agreement between ranking methods and ranges from −1 (perfect negative agreement) to 0 (no agreement) to +1 (perfect positive agreement). The statistical significance test for a Spearman correlation assumes independent observations. The production cycles that were observed in this study were clustered in nineteen participating farms (four to six production cycles per farm). In the statistical analysis the intraclass correlation (ICC) was therefore calculated to check this assumption of independent observations. The Bonferoni adjusted p-value was calculated to compensate for the family wise error. For each pair of indicators, the number of production cycles ranked in the upper quartile for only one of the indicators but not for the other indicators was calculated. Additionally it was calculated how many cycles were ranked in the upper quartile in all four indicators.
The checklist for each step provided by the AACTING guideline was filled out as part of collecting primary data for the context of the included medium scale broiler farms (Table 2).
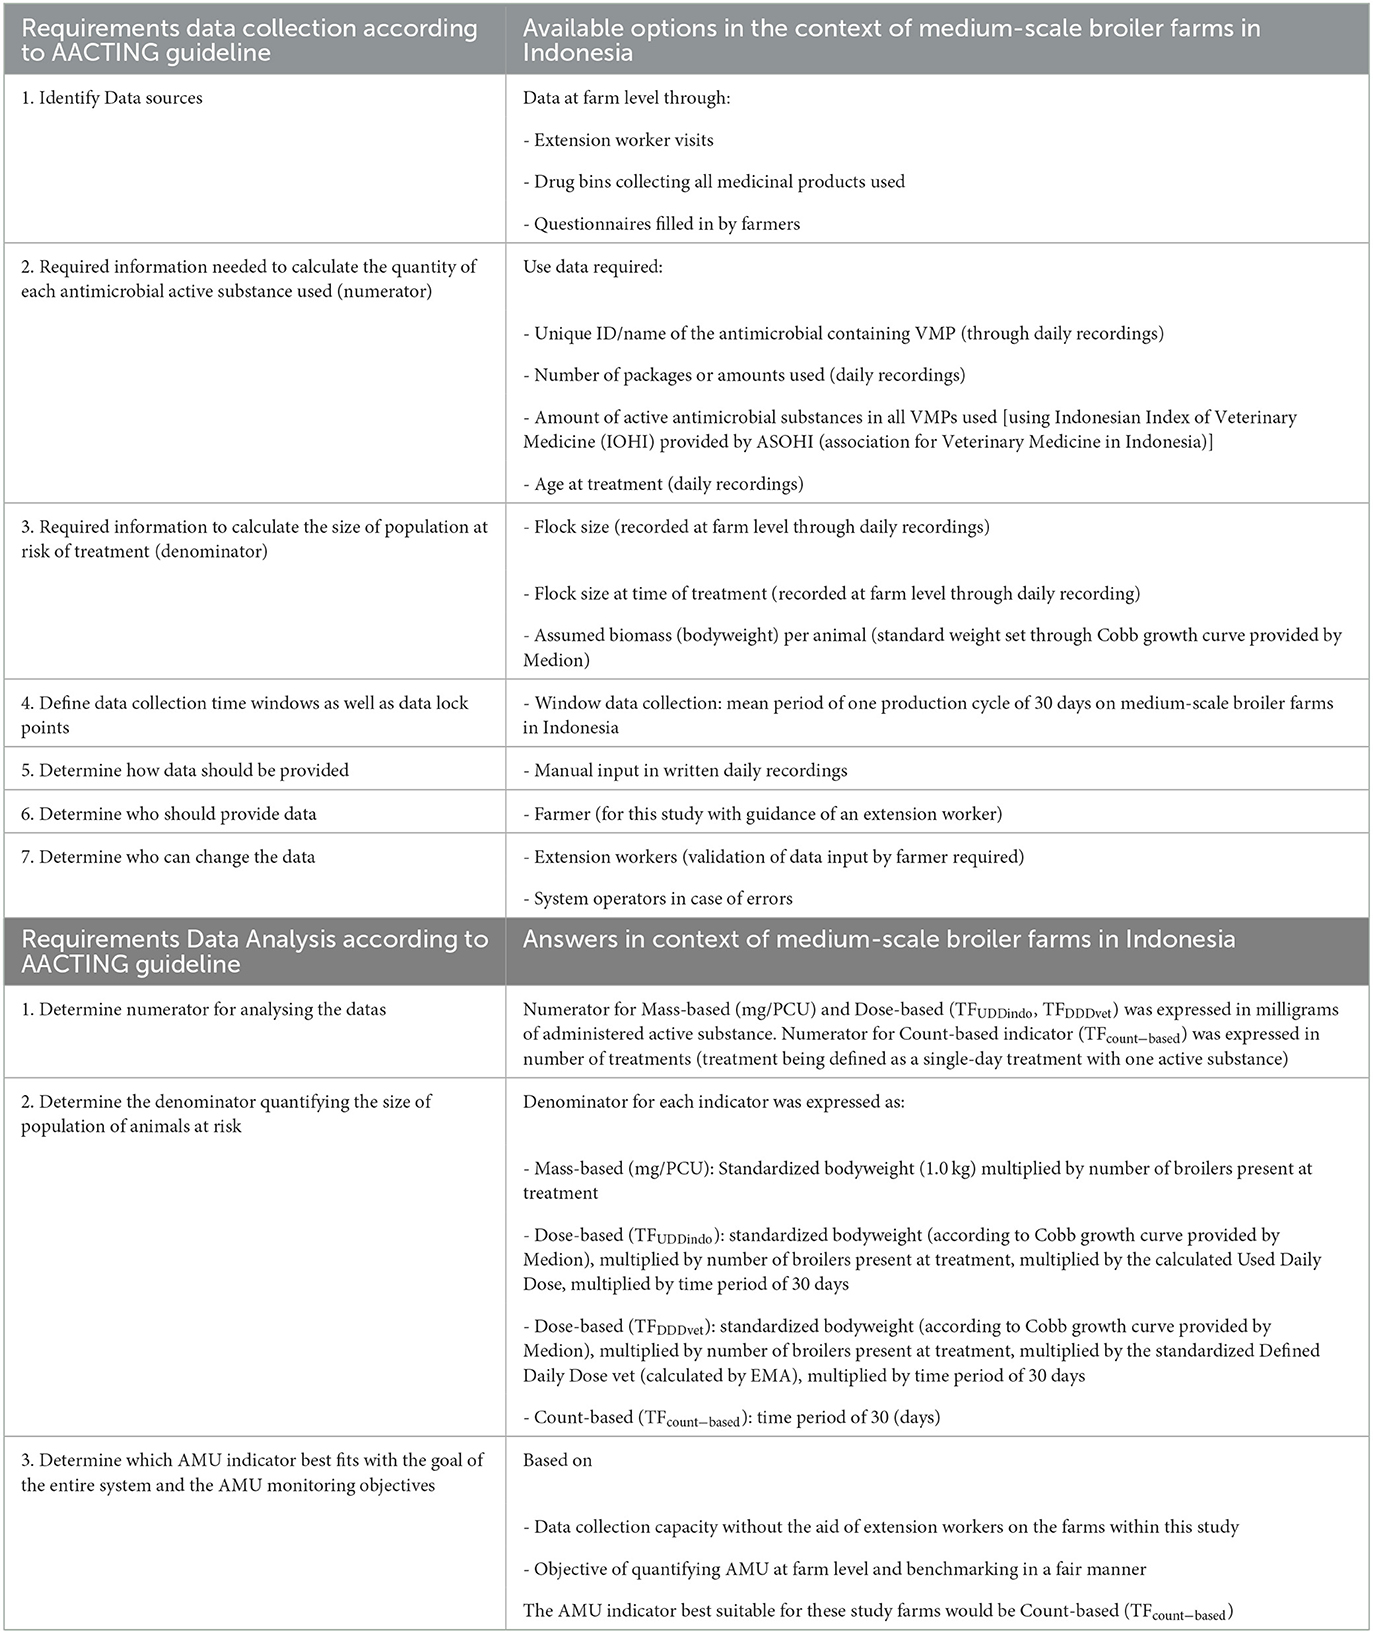
Table 2. Checklist for developing an AMU monitoring system in the context of Indonesian medium-scale broiler farms.
Per farm, four to six production cycles were monitored (in total 98 production cycles across 19 farms), on average 5.2 per farm (Annex 1). In 97 production cycles, the broilers belonged to the Cobb strain, 1 production cycle used broilers from the Ross strain. Antimicrobials were used in 97 of the 98 (99%) production cycles. In total, 150 different VMPs were used, 53 of which contained antimicrobials. The daily recording forms were primarily used to analyze AMU per production cycle. The packages collected in drug collection bins were counted to cross-check the daily recording forms. All daily recording forms corresponded with the collected packages. The antimicrobials used belong to nine different antimicrobial classes, three of which are classified by the WHO as HPCIAs, three as Critically Important Antimicrobials (CIAs) and three as Highly Important Antimicrobials (HIAs) (23). Twenty-three VMPs contained a combination of two different antimicrobial substances.
The mean number of broilers that were present in the included study houses during a production cycle was 9,442 (ranging from 1,715–27,500, SD: 6,905). All four indicators ranked Cycle 3 on Farm 1 to have the highest AMU per standardized cycle (of 30 days). Leaving out the single production cycle in which no antimicrobials were used, all four indicators also identified the same production cycle (Cycle 3 on Farm 2) as having the lowest AMU. The mean AMU per standardized production cycle (n = 98) expressed in a mass-based indicator was 46.9 mg/PCU (SD: 58.3 mg/PCU). For the dose-based indicators, the mean TFUDDindo was 0.3 (SD: 0.3) and TFDDDvet was 0.6 (SD: 0.6). The mean TFcount−based was 0.3 (SD 0.2).
Figure 1 shows the number of treatments per antimicrobial class per day of age. On average, there were 10.2 antimicrobial treatment days per cycle. During the first 6 days of age, there is a high treatment incidence of fluoroquinolones (HPCIA) (e.g., in 39% of the monitored cycles, broilers were under fluoroquinolone treatment on Day 4 of the cycle), and a second period of high fluoroquinolone and macrolide (both HPCIA) treatment incidence from Days 17 to 23. Other antimicrobial classes show different dynamics of use during the first 23 days of the production cycle. Figure 2 shows the proportion of antimicrobial classes used in all monitored cycles using the different indicators. The proportions calculated as TFcount−based, and TFUDDindo show similar patterns, whereas the proportions for antimicrobial classes used calculated as mass-based (mg/PCU) and the TFDDDvet indicator are different from the first two. Although overall TFcount−based and TFUDDindo show similar patterns when calculated over all cycles, the variation becomes clear when individual cycles are analyzed (Figures 3A–D). For example, in Cycle 2 on Farm 12 (12.2) or Cycle 5 on Farm 13 (13.5), the proportion HPCIAs versus CIAs that were used differ considerably depending on whether TFUDD−indo or TFcount−based was used.
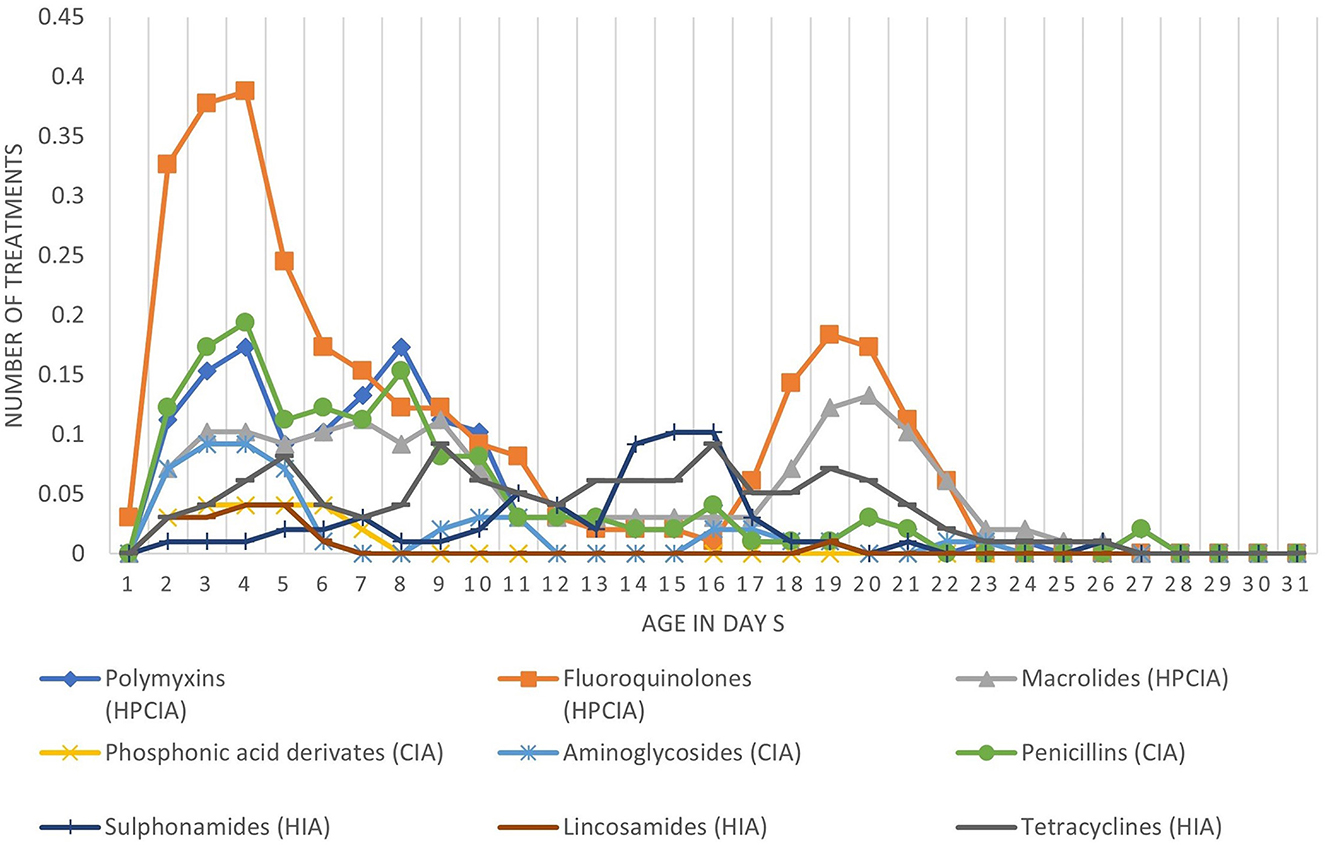
Figure 1. Average number of antimicrobial treatments per broiler per day of age divided in the different antimicrobial classes.
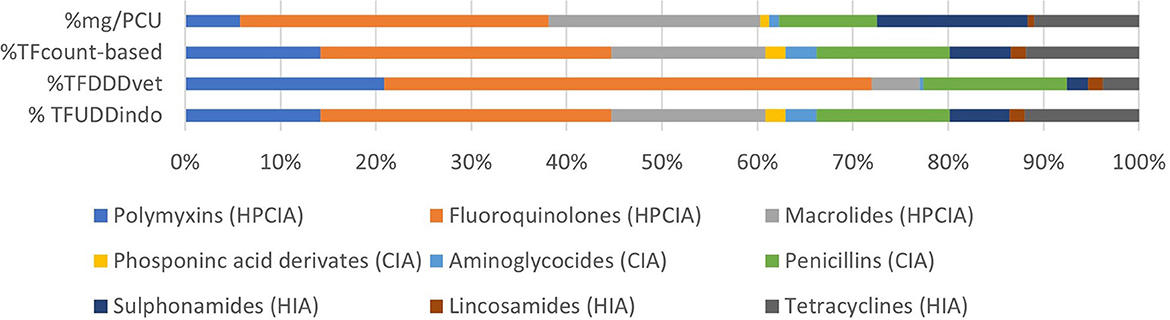
Figure 2. Proportion of antimicrobial classes used in all monitored cycles using the four different AMU indicators.
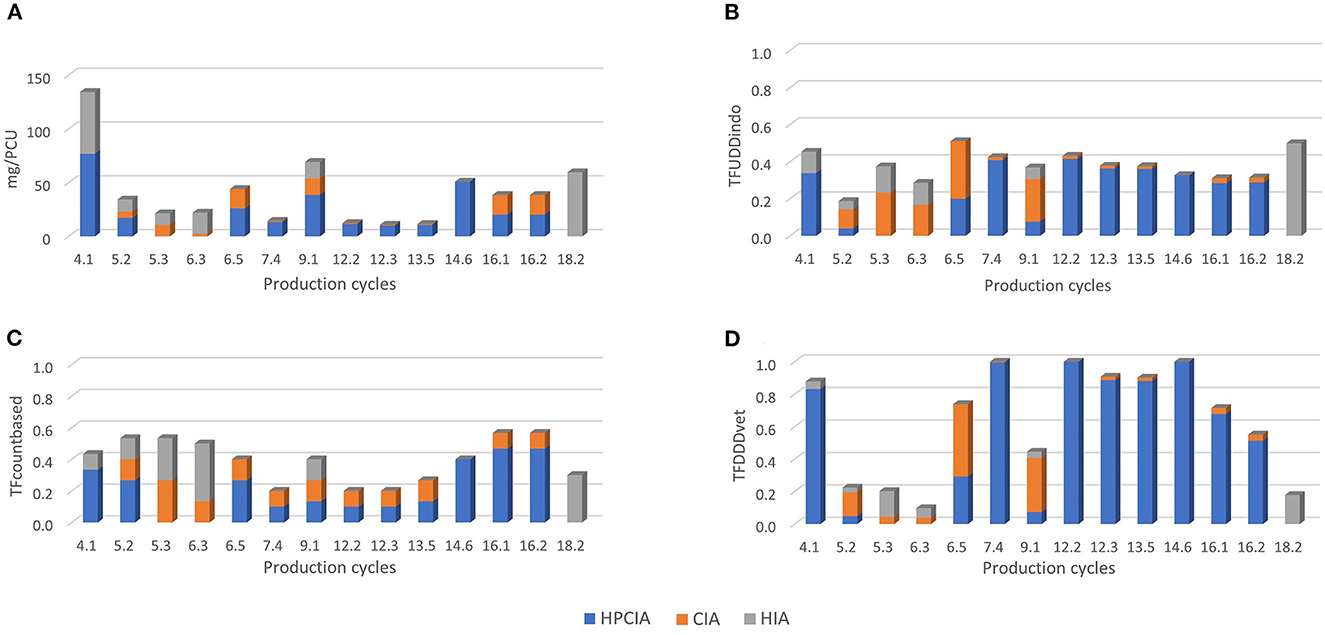
Figure 3. Distribution of AMU amongst the different priority antimicrobial classes as defined by WHO (HPCIA, CIA and HIA) of the 14 production cycles that were ranked as “high AMU” within only one indicator. Individual production cycles are labeled as [farm.cycle]; 4.1 means cycle 1 on farm 4. (A) Distribution of AMU defined as mg/PCU. (B) Distribution of AMU defined as TFUDDindo. (C) Distribution of AMU defined as TFcount−based. (D) Distribution of AMU defined as TFDDDvet.
Most AMU across all the monitored cycles belong to the HPCIAs, most of which were fluoroquinolones, irrespective of the indicator used (Figure 2). The percentage HPCIA use differs between indicators from 60.3 (mg/PCU) to 77.2% (TFDDDvet) (Figure 2). Depending on the indicator used, various production cycles were classified as “high AMU,” defined as having an AMU in the upper quartile within a specific indicator (Table 3).
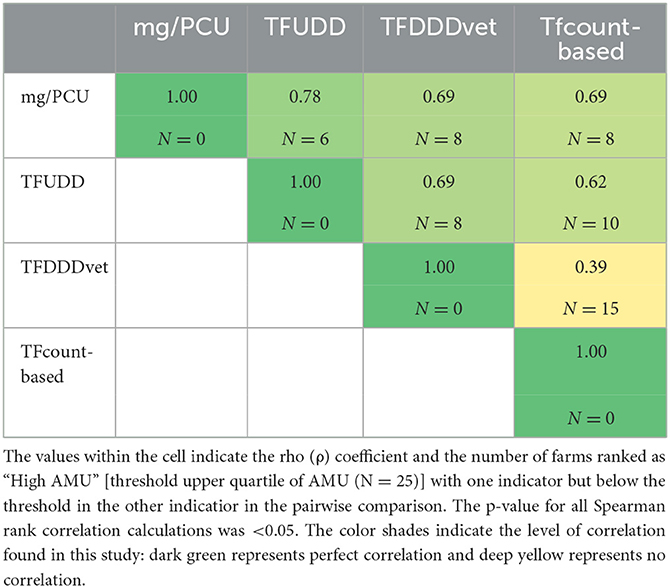
Table 3. Pairwise comparison of AMU indicators using spearman rank correlation.
The ICC was negligible (< 0.1) meaning that observations within each cluster were behaving as independent observations and the Spearman rank correlation test could be applied.
The lowest correlation found between two indicators was 0.4 (TFDDDvet and TFcount−based) and the highest correlation was 0.8 (mg/PCU and TFUDDindo) (Table 3, Figures 4A–F). The Bonferoni adjusted p-value for each of the six pairwise comparisons between indicators was < 0.05. Seven of the 25 production cycles in the upper quartile were classified as “High AMU” by all four indicators. Fourteen out of the 25 production cycles in the upper quartile were only marked as “High AMU” by just one indicator.
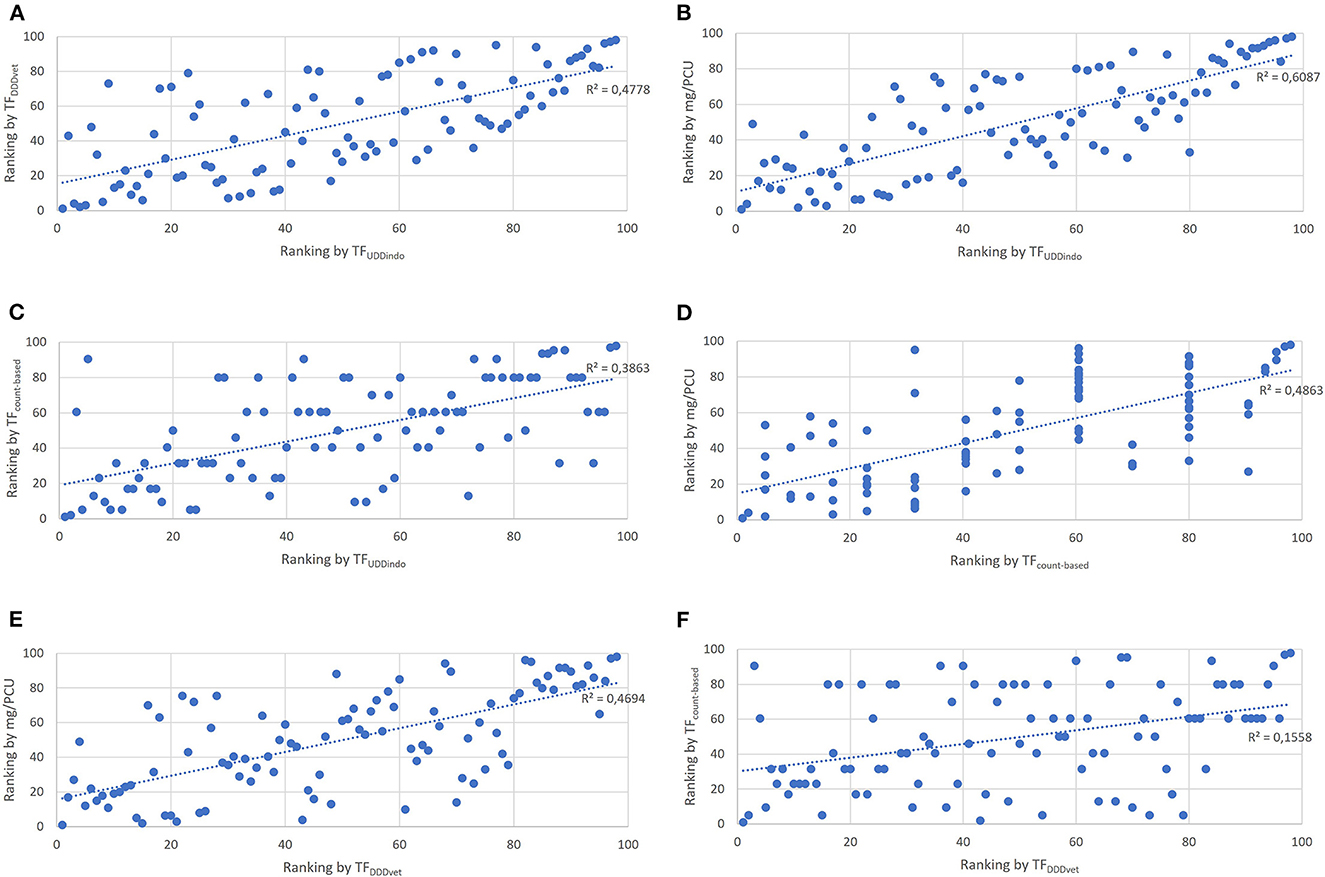
Figure 4. Scatter plots showing the correlation of individual production cycle AMU rankings between the 4 tested AMU indicators. (A) Correlation between TFDDDvet and TFUDDindo. (B) Correlation between mg/PCU and TFUDDindo. (C) Correlation between TFcount−based and TFUDDindo. (D) Correlation between mg/PCU and TFcount−based. (E) Correlation between mg/PCU and TFDDDvet. (F) Correlation between TFcount−based and TFDDDvet.
In this study, we applied existing AMU indicators following the AACTING guidelines to gain insight into AMU at farm level on medium-scale broiler farms in Indonesia (18). Quantitative AMU data as well as data on the number of broilers present throughout the production cycle was used. Antimicrobials were used in 99% of the production cycles, although large variations between production cycles could be observed. Regardless of the unit of measurement (UM) used, the majority of antimicrobials used belonged to the HPCIA category. All UMs identified the same cycles as the cycle with the highest and lowest AMU, respectively. The UMs differed in the ranking of production cycles with increasing AMU. Nineteen production cycles were categorized as “high AMU” (upper quartile of AMU) for both the dose-Based UM TFDDDvet and the mass-based UM TFcount−based together Only ten cycles were categorized as “high AMU” when calculated for both the mass-based UM mg/PCU and the dose-Based UM TFUDDindo together.
An effective monitoring system for AMU requires a measure of the amount of antimicrobials consumed and a measure of the population of animals at risk of treatment (16). Furthermore, ongoing systematic data should be collected to measure AMU change over time.
AMU data collection can be performed at different levels of aggregation or detail, and for different purposes. Indonesia reports national veterinary AMU at the level of species and administration route, and this is paralleled by collection of AMR data in poultry which is an ongoing surveillance system in Indonesia [personal communication Dr. Desmayanti; (24, 25)]. Data collection at the farm level, however, is important to understand why and how such large quantities of antimicrobials are used, identify high users, and provide the basis for developing AMS programs on farms (26). This study is the first that collected longitudinal and quantitative data on a sample of Indonesian broiler farms. This gave the opportunity to compare data-analysis systems for reporting and benchmarking, build experience in collecting data on broiler farms, and add quantitative data to the qualitative AMU studies that have been performed in the recent past in Indonesia. From our study, it is clear that an intensive follow-up is needed to collect reliable data from medium scale broiler farms in Indonesia. Even with the intensive follow-up there was no one guarantee that the AMU data was exact. Based on anecdotal reports from extension workers, farmers were not used to registering treatments precisely and appeared to find it difficult to make registration part of their daily routine. Intensive follow-up with frequent farm visits are a prerequisite for reliable data in situations where other data quality controls like intensive veterinary oversight are lacking. However, collecting on-farm data from a sample of farms as proxy for use, and extrapolate this to regional or even country level, will be a very time- and labor-consuming approach given the number of farms needed and the dispersed locations of farms (27). This is important to realize when deciding which AMU indicator will be used. A more detailed indicator (such as a dose-based indicator) where extensive data collection is required could be less suitable in this setting. Large-scale (>20,000 broilers) commercial farms, usually with developed housing and equipment, were not included in our study due to limited access to data (9). Due to a stricter farm management on large-scale farms, we can speculate that this might facilitate more thorough data collection. However, when data are collected to inform national policy, data from both large-scale and medium-scale farms should be included as there might be clear differences in usage. In the CORNERSTONE project, data collection is performed so that an intervention can be designed as part of an antimicrobial stewardship program.
Which UM is chosen often depends on the context (e.g., data availability, resources, objective of the monitoring system). A different choice of numerator (and thus indicator) can influence the interpretation of AMU at both national level (28, 29) and farm level (30, 31).
As antimicrobials classified as HPCIA are crucial in human medicine, it is paramount in AMU monitoring systems that the use of HPCIAs is not masked. When using a mass-based UM, the risk exists that the AMU can falsely appear to have decreased through switching to antimicrobial classes with a higher potency and so a lower required dose active substance, even though the duration of animal exposure to antimicrobials may not have changed. Remarkably, for the mass-based indicator mg/PCU in this study, the class of antimicrobials calculated to have been most used was the highly potent class of fluoroquinolones (HPCIA). This seemingly contradictory result can be explained by the three times higher dose of fluoroquinolones that was used on our study farms compared to the DDDvet, leading to a higher amount of milligrams being used than expected. This could also be the explanation for the (counter-intuitive) highest correlation between the UMs TFUDDindo and mg/PCU.
A dose-based UM can be used to correct for the dosage. The challenge for dose-based UMs in a setting often lacking professional veterinary oversight, is that the recommended dose according to the SPC may not always reflect drug use in practice, as farmers frequently deviate from the recommended dosage (22, 26, 32). These variations were clear in this study, where the dosage of enrofloxacin used in the different cycles varied from 0.0017 to 203 mg/kg (the standardized dose according to EMA is 10 mg/kg). For fluoroquinolones this is due to huge variation in applied doses per farm. As a result of this variation in dosage per individual farm, even the standardized UDDindo, derived from the collected farm-level data leads to a varying over- or underestimation for each individual production cycle. This, in turn, leads to an incorrect ranking. Furthermore, comparing UDDindo and DDDvet shows that in this dataset the actual used dose (UDDindo) for colistin and enrofloxacin, both HPCIAs, was a 3-fold higher than the standardized DDDvet as calculated by EMA (Table 1). In contrast, all other UDDindo values were much lower than the DDDvet values (Table 1). Considering the importance of HPCIA and the substantial difference in actual dose used and the DDDvet in this dataset, and varying under- and overestimation per individual farm by UDDindo, dose-based indicators have their restrictions in measuring AMU on medium-scale Indonesian broiler farms.
If a count-based UM is used, it is not necessary to have data available on the actual amount of antimicrobials used. Using a count-based UM thus requires less data, creating a lower burden for farmers to record data, but is less accurate compared to a dose-based UM if the goal is to examine the actual AMU at farm level. This is because it does not take into account the actual dosage applied, but counts every treatment with the same value (this value is “1”). However, the underestimation of use of potent antimicrobials, as would happen if a mass-based UM was used, is avoided when a count-based UM is used, because every treatment is weighted the same. However, it does not provide insight into under- or overdosing of a VMP, what appeared to happen frequently in our study population. It only counts the days that animals are under antimicrobial treatment in a predefined period, without weighing the quality of the AM treatment.
Besides choosing the numerator of the indicator for AMU, the AMU needs to be divided by a proxy for the targeted animal population to have comparable results (16). The weight of broilers increases by a factor of almost 40 (from 40 g to 1,500 g under Indonesian conditions) during their short life, which could imply a high risk of under- or overestimation of AMU when a single standardized animal weight is used (33). A mass-based UM for AMU usually uses slaughter weight, underestimating the effective exposure to antimicrobials per kilogram bodyweight, as most treatments often take place in the first week of production at low bodyweight. Due to varying management conditions of the farms in this study, there was also considerable variety in the actual bodyweight of the broilers at specific age on different farms, not always following the Cobb growth curve. A study by Kassabova in 2019 showed that using different weights to calculate dose-based AMU also significantly influences the outcome of the measurement (22). When available data on growth curves is limited, it could therefore be the best option to use a count-based UM, where the weight of the animals is not needed.
In summary, there are pros and cons for each UM for AMU. In the current setting of medium-scale broiler farms in Indonesia, the count-based UM seems most suitable (and realistic) to achieve a fair benchmarking of farms.
Benchmarking AMU refers to comparing a farm's AMU with the AMU of the reference population (18). A prerequisite is that AMU for all entities in this population is quantified in a comparable manner. Using a different indicator can lead to a change in the way farms are ranked, which was clearly visible in this study (26, 34). Although some studies performed in broilers (34) and pigs (26) showed a correlation between the mass- and dose-based indicator, the correlation in this study was considerably lower [~0.6 (this study) compared to 0.8 (26)]. An explanation for this could be that the other studies were performed using data from countries where the administered dosages were more according to the SPC than in this study. A consistent over- or underestimation of the dosage would still result in a similar ranking of antimicrobial users, even though the exact values differ. However, if the over- or underestimation varies strongly, like in this study, the correlation automatically decreases.
Due to the limited number of participating farms and variation in the use of antimicrobials between production cycles, it was decided to benchmark per cycle instead of per farm in this study. This method is feasible in studies such as this one, where extensive supervision is possible. For this study, there was no preliminary data and benchmarking was only performed after data for all production cycles had been collected. Since farms have varying empty periods (in which no production cycle is running), quite some time can elapse between data collection of different cycles. For future studies, a timely benchmark is advised. This way, as soon as data is collected from one production cycle, it can immediately be reported back to the farmer whether or not their farm ranks as “high AMU.” Considering the duration of data collection, data analysis and efforts required to draft a report, benchmarking per farm is probably more realistic than per production cycle. Regardless of whether benchmarking is done within a smaller study or at a national level, similar farms should be used as a reference population. In this context, medium-scale farms should be compared with medium-scale farms and Large-scale farms with Large-scale farms.
Reporting on the outcome of AMU quantifications is necessary for the improvement of AMS initiatives. Ongoing, systematic monitoring of on-farm AMU can guide targeted improvements of AMU as part of stewardship programs (16, 18). It is important to ensure the report is adjusted to the person it is addressed to (16). In our study, we reported back to farmers who mostly lack knowledge of prudent AMU and AMR. The report language should be understandable for this type of farmer and offer a clear overview of the AMU on their own farm compared to others within the reference population. In this study, practical suggestions on how to reduce AMU (particularly of HPCIAs) at farm level were added. If data is also reported to the government or at an international level, it is important to clearly define the reference population and add a time period to the AMU data (18). Anonymization of the participating farms is a prerequisite for each type of reporting and should be agreed upon when farms are included in studies.
Previous surveillance questionnaires concluded that AMU is widespread in the Indonesian broiler sector and that 80% is used preventively (15). Enrofloxacin is the most frequently used antimicrobial (15). With 10.2 average days under antimicrobial treatment per cycle and 82.6% of all treatments with the purpose of prevention or growth booster (2%) (data not shown), our results are comparable and there is an evident need to improve responsible antimicrobial use on medium scale broiler farms. An AMU monitoring system at farm level could be an effective tool to create insight for farmers in their use, which can in turn, assist in monitoring of the desired decreasing AMU.
Data were collected from only 19 farms, with close to 100 cycles. The cycles are not independent and might be clustered per farm for certain issues (e.g., dosing). The farms are selected by Medion based on their willingness to participate and are therefore not a representative sample of the AMU in medium-scale farms in their region. They might be more motivated to register treatments and open to advice. Due to the COVID-19 pandemic, data collection took longer than expected (it took place from 2019 to 2022). This might have influenced AMU habits, as during a 3-year time period, the antimicrobial treatment management could change.
Based on data from this study on 19 medium-scale broiler farms, the most feasible and fair method to benchmark medium scale farms is to use the UM TFcount−based. One reason is that farmers from this sector are not yet used to extensive AMU data collection, as would be needed for the other indicators. Another important factor is the highly variable dosing practice found in this sector, which contrasts with the rigid legislation and veterinary oversight in European countries, for example. Consequently, a dose-based UM will not represent actual use and result in unfair benchmarking.
This study was the first to create insight into quantitative and qualitative AMU data at farm level in medium-scale broiler farms in Indonesia. The next step would be to use these tools on a larger sample of farms, and to use the outcomes for implementing interventions. Collecting AMU data at farm level in a database can subsequently help in monitoring AMU trends and aid policy makers in designing targeted AMS interventions. The easier count-based indicator TFcount−based would be best suitable for the current state of medium scale broiler farms in Indonesia. With this indicator the level of HPCIA use is not underestimated. Depending on future resources and possibilities to steer dosing practices, a dose-based indicator could be used as the successor of the count-based indicator.
The original contributions presented in the study are included in the article/Supplementary material, further inquiries can be directed to the corresponding author.
We conducted an observational study on the amount and type of antimicrobials used by farmers on regular commercial broiler farms in Indonesia. As we did not apply any intervention on humans nor animals, but only observed current antimicrobial use practices in commercial broiler farms based on written records and disposed drug packages, ethical review and approval was not required for the study. For the use and analysis of farm data (including antimicrobial use), we obtained written consent from the participating farmers. Furthermore, we anonymized all personal data so that no information can be traced back to individual farms.
Tri S. Purwanto, Muhammad A. Bagaskara, Annisa Rachmawati, and Rangga Putra, Center for Indonesian Veterinary Analytical Studies (CIVAS), Bogor, Indonesia; Hannan Daradjat, Animal Health Department, PT Medion Farma Jaya, Bandung, Indonesia; Patricia Noreva, Ministry of Agriculture of the Republic of Indonesia, Jakarta, Indonesia; Riana A. Arief and Erianto Nugroho, Food and Agriculture Organization (FAO) Country Office of Indonesia, Jakarta, Indonesia.
RA and TD coordinated data collection. The Cornerstone group under supervision of SS was responsible for the data collection and validation. RA and IG performed data analysis. RA prepared the manuscript. All authors reviewed the written manuscript and were involved in designing and conducting the study.
This study was funded by two research grants from NWO (Dutch Research Council): “Containment of antimicrobial resistance, toward a sustainable poultry production chain in Indonesia” (grant number W 07.50.1827) and “Diagnostics for diseases in Indonesian poultry production to support antimicrobial stewardship interventions” (grant number VidW.1154.19.017).
The authors of this paper would like to express their appreciation for the efforts applied in data collection by CIVAS extension workers and Medion and the cooperation of the farmers that allowed us to collect data on their farms. Furthermore, the authors would like to thank Dr. Liys Desmayanti from the Indonesian Ministry of Agriculture of the Republic of Indonesia for her valuable advice.
The authors declare that the research was conducted in the absence of any commercial or financial relationships that could be construed as a potential conflict of interest.
All claims expressed in this article are solely those of the authors and do not necessarily represent those of their affiliated organizations, or those of the publisher, the editors and the reviewers. Any product that may be evaluated in this article, or claim that may be made by its manufacturer, is not guaranteed or endorsed by the publisher.
The Supplementary Material for this article can be found online at: https://www.frontiersin.org/articles/10.3389/fvets.2023.1092302/full#supplementary-material
AMR, antimicrobial resistance; AMS, antimicrobial stewardship; AMU, antimicrobial use; CIA, critically important antimicrobials; CIVAS, Indonesian center for veterinary analytical studies; DDDvet, defined daily dose for veterinary products; FAO, food and agriculture organization of the United Nations; HIA, highly important antimicrobials; HPCIA, highest priority critically important antimicrobials; LMIC, low- and middle income country; Mg/PCU, milligrams per population correction unit; TF, treatment frequency; UDD, used daily dose; UM, unit of measurement; VMP, veterinary medicinal product; WHO, World Health Organization; WOAH, World Organization for animal health.
1. O'Neill J. Antimicrobial Resistance: Tackling a Crisis for the Health and Wealth of Nations. Geneva: Review on Antimicrobial Resistance (2014).
2. Antimicrobial Resistance Collaborators. Global burden of bacterial antimicrobial resistance in 2019: a systematic analysis. Lancet. (2022) 399:629–55.
3. Chantziaras I, Boyen F, Callens B, Dewulf J. Correlation between veterinary antimicrobial use and antimicrobial resistance in food-producing animals: a report on seven countries. J Antimicrob Chemother. (2014) 69:827–34. doi: 10.1093/jac/dkt443
4. Woolhouse M, Ward M, van Bunnik B, Farrar J. Antimicrobial resistance in humans, livestock and the wider environment. Philos Trans R Soc Lond B Biol Sci. (2015) 370:20140083. doi: 10.1098/rstb.2014.0083
5. Van Boeckel TP, Brower C, Gilbert M, Grenfell BT, Levin SA, Robinson TP, et al. Global trends in antimicrobial use in food animals. Proc Natl Acad Sci U S A. (2015) 112:5649–54. doi: 10.1073/pnas.1503141112
6. Magnusson U, Moodley A, Osbjer K. Antimicrobial resistance at the livestock-human interface: implications for Veterinary Services. Rev Sci Tech. (2021) 40:511–21. doi: 10.20506/rst.40.2.3241
7. Hesp A, Veldman K, van der Goot J, Mevius D, van Schaik G. Monitoring antimicrobial resistance trends in commensal Escherichia coli from livestock, the Netherlands, 1998 to 2016. Euro Surveill. (2019) 24:1800438. doi: 10.2807/1560-7917.ES.2019.24.25.1800438
8. McEwen SA, Collignon PJ. Antimicrobial resistance: a one health perspective. Microbiol Spectr. (2018) 6:17. doi: 10.1128/microbiolspec.ARBA-0009-2017
9. Tiseo K, Huber L, Gilbert M, Robinson TP, Van Boeckel TP. Global trends in antimicrobial use in food animals from 2017 to 2030. Antibiotics. (2020) 9:918. doi: 10.3390/antibiotics9120918
10. Wahyono ND, Utami MMD. A review of the poultry meat production industry for food safety in Indonesia. J Phys Conf Ser. (2018) 953:012125. doi: 10.1088/1742-6596/953/1/012125
11. Collignon PJ, McEwen SA. One health-its importance in helping to better control antimicrobial resistance. Trop Med Infect Dis. (2019) 4:22. doi: 10.3390/tropicalmed4010022
12. Aidara-Kane A, Angulo FJ, Conly J, Minato Y, Silbergeld EK, McEwen SA, et al. World Health Organization (WHO) guidelines on use of medically important anti-microbials in food-producing animals. Antimicrob Resist Infect Control. (2018) 7:294. doi: 10.1186/s13756-017-0294-9
13. Wright T, Darmawan B. Voluntary Poultry Report Indonesia. USDA For Agric Serv. (2017) 1701:1–4. Available online at: https://www.fas.usda.gov/data/indonesia-voluntary-poultry-report
14. Coyne L, Patrick I, Arief R, Benigno C, Kalpravidh W, McGrane J, et al. The costs, benefits and human behaviours for antimicrobial use in small commercial broiler chicken systems in Indonesia. Antibiotics. (2020) 9:154. doi: 10.3390/antibiotics9040154
15. Suandy I. AMU-AMR surveillance system in Indonesia on livestock and animal health sector: approach and findings. In: OIE Sub-Regional Conference on Antimicrobial Resistance (AMR) Related Research and Information. Bangkok, Thailand (2022). Available online at: https://rr-asia.woah.org/wp-content/uploads/2020/01/11-amu-amr-surveillance-indonesia_saundy.pdf
16. Sanders P, Vanderhaeghen W, Fertner M, Fuchs K, Obritzhauser W, Agunos A, et al. Monitoring of farm-level antimicrobial use to guide stewardship: overview of existing systems and analysis of key components and processes. Front Vet Sci. (2020) 7:540. doi: 10.3389/fvets.2020.00540
17. NWO. Containment of Antimicrobial Resistance: Towards a Sustainable Poultry Production Chain in Indonesia. NWO (2022). Available online at: https://www.nwo.nl/projecten/w-07501827-0 (accessed October 24, 2022).
18. The AACTING-Network. Guidelines for Collection, Analysis and Reporting of Farm-Level Antimicrobial Use, in the Scope of Antimicrobial Stewardship. New York, NY: The AACTING-Network (2019). Available online at: https://aacting.org/0.2019;version~1.2_2019 (accessed October 20, 2022).
19. Cobb-Vantress. Broiler performance and Nutrition Supplement Cobb 500 Males. (2022). Available online at: https://www.cobb-vantress.com/assets/Cobb-Files/product-guides/5502e86566/2022-Cobb500-Broiler-Performance-Nutrition-Supplement.pdf (accessed October 25, 2022).
20. EMA. Principles on assignment of defined daily dose for animals (DDDA) and defined course dose for animals (DCDA) table of contents. Eur Med Agency. (2015) 44:1–64.
21. Direktorat Jenderal Produksi Peternakan Departemen Pertanian Dengan Asosiasi Obat Hewan Indonesia. Indeks Obat Hewan Indonesia. J Chem Inform Model. (2014) 11:864.
22. Kasabova S, Hartmann M, Werner N, Käsbohrer A, Kreienbrock L. Used daily dose vs. defined daily dose-contrasting two different methods to measure antibiotic consumption at the farm level. Front Vet Sci. (2019) 6:116. doi: 10.3389/fvets.2019.00116
23. World Health Organization (WHO). Critically Important Antimicrobials for Human Medicine 6th Revision 2018 Ranking of Medically Important Antimicrobials for Risk Management of Antimicrobial Resistance Due to Non-Human Use. Geneva: WHO (2018). Available online at: https://www.who.int/publications-detail-redirect/9789241515528 (accessed October 25, 2022).
24. World Organisation for Animal Health (WOAH). Annual Report on Antimicrobial Agents Intended for Use in Animals. 6th edn. Paris: WOAH (2022). Available online at: https://www.woah.org/app/uploads/2022/06/a-sixth-annual-report-amu-final.pdf (accessed October 25, 2022).
25. World Organisation for Animal Health (WOAH). OIE Template: World Organisation for Animal Health. Paris: WOAH (2022). Available online at: https://www.oie.int/app/uploads/2021/08/eng-amuse-template-final.xls (accessed October 25, 2022).
26. O'Neill L, Rodrigues da Costa M, Leonard F, Gibbons J, Calderón Díaz JA, McCutcheon G, et al. Does the use of different indicators to benchmark antimicrobial use affect farm ranking? Front Vet Sci. (2020) 7:558793. doi: 10.3389/fvets.2020.558793
27. National Antimicrobial Resistance Coordination Committee of Indonesia NARCC (NARCC) G. National Action Plan on Antimicrobial Resistance Indonesia 2017–2019. Indonesia: NARCC (2017). Available online at: https://www.who.int/publications/m/item/indonesia-national-action-plan-on-antimicrobial-resistance-indonesia-2017-2019
28. Dupont N, Fertner M, Kristensen CS, Toft N, Stege H. Reporting the national antimicrobial consumption in Danish pigs: influence of assigned daily dosage values and population measurement. Acta Vet Scand. (2016) 58:27. doi: 10.1186/s13028-016-0208-5
29. Taverne FJ, Jacobs JH, Heederik D, Mouton JW, Wagenaar JA, van Geijlswijk IM. Netherlands Veterinary Medicines Authority (SDa). Influence of applying different units of measurement on reporting antimicrobial consumption data for pig farms. BMC Vet Res. (2015) 11:250. doi: 10.1186/s12917-015-0566-7
30. Echtermann T, Muentener C, Sidler X, Kümmerlen D. Antimicrobial drug consumption on Swiss pig farms: a comparison of Swiss and European defined daily and course doses in the field. Front Vet Sci. (2019) 6:240. doi: 10.3389/fvets.2019.00240
31. Waret-Szkuta A, Coelho V, Collineau L, Hémonic A, Buy C, Treff M, et al. how input parameters and calculation rules influence on-farm antimicrobial use indicators in animals. Front Vet Sci. (2019) 6:438. doi: 10.3389/fvets.2019.00438
32. Postma M, Sjölund M, Collineau L, Lösken S, Stärk KD, Dewulf J, et al. Assigning defined daily doses animal: a European multi-country experience for antimicrobial products authorized for usage in pigs. J Antimicrob Chemother. (2015) 70:294–302. doi: 10.1093/jac/dku347
33. Food Agriculture Organization of the United Nations (FAO). The FAO Action Plan on Antimicrobial Resistance 2021–2025. Rome: FAO. Available online at: https://www.fao.org/3/cb5545en/cb5545en.pdf (accessed October 25, 2022).
34. Chauvin C, Querrec M, Perot A, Guillemot D, Sanders P. Impact of antimicrobial drug usage measures on the identification of heavy users, patterns of usage of the different antimicrobial classes and time-trends evolution. J Vet Pharmacol Therap. (2008) 31:960. doi: 10.1111/j.1365-2885.2008.00960.x
Keywords: antimicrobial resistance, antimicrobial stewardship, veterinary antimicrobial use monitoring, poultry, Indonesia
Citation: Anwar Sani R, Wagenaar JA, Dinar TEHA, Sunandar S, Nurbiyanti N, Suandy I, Pertela G, Jahja EJ, Purwanto B, CORNERSTONE group, Geijlswijk IMv and Speksnijder DC (2023) The comparison and use of tools for quantification of antimicrobial use in Indonesian broiler farms. Front. Vet. Sci. 10:1092302. doi: 10.3389/fvets.2023.1092302
Received: 07 November 2022; Accepted: 02 February 2023;
Published: 10 March 2023.
Edited by:
Faham Khamesipour, Shahid Beheshti University of Medical Sciences, IranReviewed by:
Lucy Brunton, Royal Veterinary College (RVC), United KingdomCopyright © 2023 Anwar Sani, Wagenaar, Dinar, Sunandar, Nurbiyanti, Suandy, Pertela, Jahja, Purwanto, CORNERSTONE group, Geijlswijk and Speksnijder. This is an open-access article distributed under the terms of the Creative Commons Attribution License (CC BY). The use, distribution or reproduction in other forums is permitted, provided the original author(s) and the copyright owner(s) are credited and that the original publication in this journal is cited, in accordance with accepted academic practice. No use, distribution or reproduction is permitted which does not comply with these terms.
*Correspondence: David C. Speksnijder, ZC5jLnNwZWtzbmlqZGVyQHV1Lm5s
Disclaimer: All claims expressed in this article are solely those of the authors and do not necessarily represent those of their affiliated organizations, or those of the publisher, the editors and the reviewers. Any product that may be evaluated in this article or claim that may be made by its manufacturer is not guaranteed or endorsed by the publisher.
Research integrity at Frontiers
Learn more about the work of our research integrity team to safeguard the quality of each article we publish.