 Emma Heyman1*†
 Marguerite Meeremans1†
 Bert Devriendt2
 Maria Olenic1,3
 Koen Chiers4
 Catharina De Schauwer1
- 1Veterinary Stem Cell Research Unit, Department of Translational Physiology, Infectiology and Public Health, Faculty of Veterinary Medicine, Ghent University, Merelbeke, Belgium
- 2Laboratory of Immunology, Department of Translational Physiology, Infectiology and Public Health, Faculty of Veterinary Medicine, Ghent University, Merelbeke, Belgium
- 3Tissue Engineering Lab, Muscles and Movement Group, Faculty of Medicine, Catholic University of Leuven, Kortrijk, Belgium
- 4Laboratory of Veterinary Pathology, Department of Pathobiology, Pharmacology and Zoological Medicine, Faculty of Veterinary Medicine, Ghent University, Merelbeke, Belgium
Mesenchymal stem cells (MSCs) are a promising candidate for both human and veterinary regenerative medicine applications because of their abundance and ability to differentiate into several lineages. Mesenchymal stem cells are however a heterogeneous cell population and as such, it is imperative that they are unequivocally characterized to acquire reproducible results in clinical trials. Although the tri-lineage differentiation potential of MSCs is reported in most veterinary studies, a qualitative evaluation of representative histological images does not always unambiguously confirm tri-lineage differentiation. Moreover, potential differences in differentiation capacity are not identified. Therefore, quantification of tri-lineage differentiation would greatly enhance proper characterization of MSCs. In this study, a method to quantify the tri-lineage differentiation potential of MSCs is described using digital image analysis, based on the color deconvolution plug-in (ImageJ). Mesenchymal stem cells from three species, i.e., bovine, equine, and porcine, were differentiated toward adipocytes, chondrocytes, and osteocytes. Subsequently, differentiated MSCs were stained with Oil Red O, Alcian Blue, and Alizarin Red S, respectively. Next, a differentiation ratio (DR) was obtained by dividing the area % of the differentiation signal by the area % of the nuclear signal. Although MSCs isolated from all donors in all species were capable of tri-lineage differentiation, differences were demonstrated between donors using this quantitative DR. Our straightforward, simple but robust method represents an elegant approach to determine the degree of MSC tri-lineage differentiation across species. As such, differences in differentiation potential within the heterogeneous MSC population and between different MSC sources can easily be identified, which will support further optimization of regenerative therapies.
Introduction
The therapeutic potential of mesenchymal stem cells (MSCs) has received much attention in regenerative medicine based on their ability to proliferate, differentiate toward various lineages and modulate immune responses (1, 2). This is illustrated by the numerous clinical trials which are currently performed to evaluate MSC-based therapies for the treatment of both musculoskeletal and non-musculoskeletal diseases, ranging from tendon lesions and osteoarthritis to neurological and cardiac abnormalities (3).
As stated by the International Society for Cellular Therapy (ISCT), human MSCs are characterized using following criteria: (i) morphological features (plastic-adherency), (ii) presence of MSC markers (CD73, CD90, and CD105) and lack of hematopoietic markers (CD11b or CD14, CD34, CD45, CD79α or CD19 and MHC class II), and (iii) tri-lineage differentiation toward adipo-, chondro- and osteocytes (4). However, a proper characterization of MSCs is hampered by the heterogeneity within the MSC population and the presence of species-specific differences in veterinary medicine, with variations in proliferation potential, differentiation capacity, and protein expression profile (2, 3, 5). Therefore, additional guidelines were suggested in a recent position statement by Guest et al. to be incorporated in the minimal definition criteria of MSCs, including in vitro immune suppression assays and quantitative assessment of tri-lineage differentiation (3). Indeed, MSCs should be unequivocally characterized to ensure that reproducible MSC-products are used in veterinary clinical trials which will yield useful and clinically relevant outputs (3).
Tri-lineage differentiation ability of MSCs is commonly assessed based on qualitative analysis of histological stainings, such as Oil Red O staining for adipogenic differentiation, Alcian Blue or Safranin O staining for chondrogenic differentiation and Alizarin Red S or Von Kossa staining for osteogenic differentiation (6–11). Visual identification and histological scoring of tri-lineage differentiation remains however subjective (Table 1). Furthermore, a qualitative evaluation of representative histological images does not always unambiguously confirm tri-lineage differentiation. Moreover, potential differences in differentiation capacity between different donors or sources are not identified. Therefore, quantitative assays for tri-lineage differentiation should be optimized and implemented.
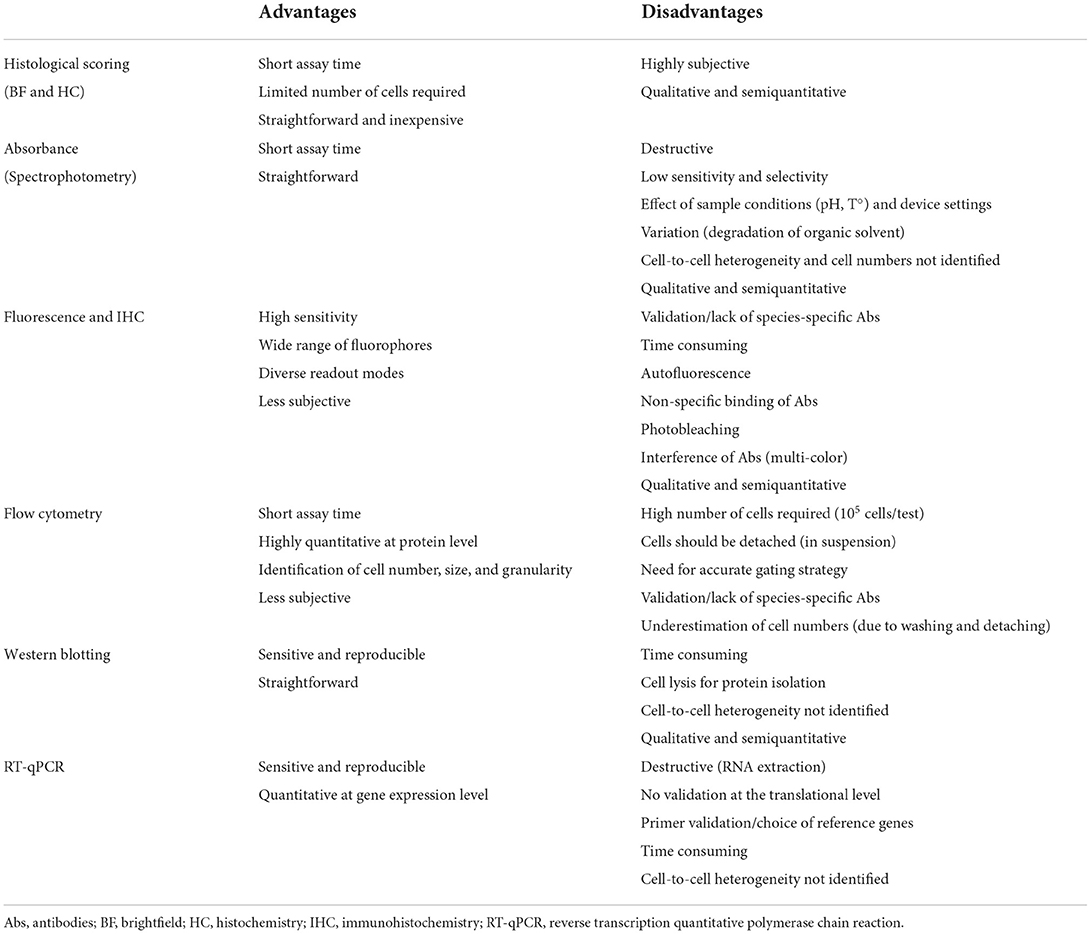
Table 1. An overview of the advantages and disadvantages of techniques mostly used for quantification of MSC tri-lineage differentiation.
A first method to quantify tri-lineage differentiation includes spectrophotometric measurements based on the elution of different histological staining solutions using volatile organic solvents such as isopropanol (12–15). After staining, the dye is eluted and the amount of light absorbed by the eluate is measured, hence the short assay time for absorbance assays. Absorbance assays, however, are less appropriate for samples with low signal as UV-Vis spectrophotometry has a low sensitivity. Moreover, the selectivity of these assays might be limited as contaminants like nucleic acids might absorb at the same wavelength. Results might be affected as well by different sample conditions such as pH and temperature, and device settings are of major importance (e.g. calibration) (16). Additionally, the absorbance of samples is subjected to variation caused by the degradation of isopropanol over time and information on MSC heterogeneity and cell numbers is lacking (Table 1) (17).
Besides histological stainings, fluorescence-based techniques are used to quantify tri-lineage differentiation, which are known for their high sensitivity, wide range of fluorophores and various readout modes such as fluorometry, fluorescent image analysis and flow cytometry (18). The expression and concentration of certain proteins can be measured based on total intensity of a fluorescent label. To quantify adipogenic differentiation, the expression of following proteins can be evaluated: CAAT/enhancer binding protein a (C/EBPa), fatty acid binding protein (FABP) 4, insulin-like growth factor binding protein 2 (IGFBP2), resistin, adiponectin and lipoprotein lipase. Expression of osteoblast-related transcription factors and proteins include osteocalcin, osteopontin, Runt-related transcription factor 2 (Runx2), alkaline phosphatase and collagen type 1 (19), while SRY-Box Transcription Factor 9 (SOX9) and aggrecan (ACAN) are expressed during chondrogenic differentiation (20). Although fluorometry is superior to spectrophotometry in terms of sensitivity and specificity, limitations related to the elution of specific components remain (21). Alternatively, fluorescent stainings using antibodies can be performed, although their use in veterinary medicine is hampered by the lack of species-specific or validated cross-reactive antibodies (13, 22). Fluorescence assays are also more time-consuming and more complicated to perform due to potential autofluorescence, non-specific binding of antibodies, photobleaching and interference due to spectral overlap when multiple antibodies are used (Table 1) (23). To evaluate adipogenic differentiation of MSCs, specific lipophilic fluorescent stainings which do not require antibodies, such as Nile Red or AdipoRed, are being used as well. The intensity of the staining can be measured and compared against 4′,6-diamidino-2-phenylindoline (DAPI) nuclear staining (17, 24). However, similar stainings are not available for chondrogenic and osteogenic differentiation.
Other protein expression analysis techniques such as flow cytometry and western blotting can be used to quantify tri-lineage differentiation. So far, relatively few studies used flow cytometry to confirm MSC tri-lineage differentiation, although a lot of information would be provided, such as intensity of staining, size of the cells, granularity, as well as cell number and MSC heterogeneity (25). However, a high number of cells is required (105 cells/test), when compared with other methods and the cells should be detached prior to analysis. Additional technical challenges include the validation of antibodies and underestimation of the number of differentiated cells due to cell loss after the washing steps or trypsinization prior to analysis (Table 1) (22). Western blotting is a semiquantitative method based on the immunochromatography principle. Although it is commonly used because of its high sensitivity and reproducibility, it is time consuming, additionally requires cell lysis for protein isolation and does not give information about MSC heterogeneity (Table 1) (26).
As species-specific and validated cross-reacting antibodies are often lacking, a third method for quantification is based on gene expression analysis techniques, such as reverse transcription quantitative PCR (RT-qPCR). This sensitive and reproducible tool is based on the amplification of specific differentiation-related genes compared to the expression of reference genes (12, 27). However, RT-qPCR only reflects changes at the gene expression level without any confirmation on the translation level, taking into account that mRNA levels are not always directly correlated with protein levels (28). Furthermore, attention should be paid to the correct selection of reference gene(s) and primer validation of the genes of interest when designing RT-qPCR protocols (17, 29). Other disadvantages of this technique are the long assay time and the fact that MSC heterogeneity cannot be identified using RT-qPCR (Table 1).
In human research, quantification of MSC differentiation is frequently reported, however, techniques are inconsistent between research groups and often specialized equipment is needed such as imaging and absorbance readers (15, 17, 30–32). Furthermore, the used methodology or programs, for example ImageJ macro's, are not always clearly described nor available for future research (31). In veterinary studies, only few studies describe quantification of MSC differentiation and even then a complete quantification of each of the three lineages, accompanied by a clearly described method, is often lacking (13, 27, 33, 34). For example, Jurek et al. quantitatively assessed adipogenic differentiation capacity of bovine MSCs by spectrophotometric analysis of Nile red/DAPI staining, while osteogenic and chondrogenic differentiation were not quantified (27). The latter was also not reported in the study of Zimmermann et al. in which porcine MSCs were characterized (34). Usually, a proper negative control for chondrogenic differentiation is not included as well (35). Hillmann et al. clearly described the quantification of the three lineages, although different techniques were used in this study to quantify MSC differentiation, namely histological scoring to evaluate adipogenic and chondrogenic differentiation, while optical density measurements were used to evaluate osteogenic differentiation (13). The use of color deconvolution for quantification of one or two MSC differentiation lineages was described in some recent papers. For example, Hagen et al. used color deconvolution for quantification of chondrogenic differentiation (36) and Brandt et al. reported color deconvolution in Mathematica in combination with area determination for adipogenic and chondrogenic differentiation (37).
As far as we know, no universal quantification technique is available which can be used for all lineages. To enhance the implementation of tri-lineage differentiation quantification when characterizing MSCs, it is recommended to develop a single quantification technique that does not require additional handlings on top of the qualitative assessment which is currently routinely performed. To this end, a straightforward, simple but robust method for image-based quantification of tri-lineage differentiation using standard histological stainings was evaluated in this study in three different species i.e. bovine, equine and porcine.
Materials and methods
Media
Culture medium for undifferentiated MSCs consisted of low glucose Dulbecco's Modified Eagle Medium (DMEM-LG) (Invitrogen, 11880-036) supplemented with 30% Fetal Bovine Serum (FBS) (Sigma, F7524), 10−11 M dexamethasone (Sigma, D2915), 1% antibiotic-antimycotic solution (Sigma, A5955) and 1% L-glutamine (Invitrogen, 25030-024). Expansion medium was identical to the culture medium but without dexamethasone.
Following media were used to induce differentiation: (i) adipogenic induction medium consisting of DMEM-LG supplemented with 10−6 M dexamethasone, 0.5 mM 3-isobutyl-1-methylxanthine (Sigma, I7018), 10 μg/ml rh-insuline (Sigma, I9278), 0.2 mM indomethacin (Sigma, I7378), 15% rabbit serum (Sigma, R4505), 50 μg/ml gentamycin (Gibco, 15710-049) and 1% antibiotic-antimycotic solution; (ii) adipogenic maintenance medium, identical to the adipogenic induction medium except for the omission of dexamethasone, indomethacin and 3-isobutyl-1-methylxanthine; (iii) chondrogenic medium, based on the basal differentiation medium (Lonza, PT-3003), supplemented with 10 ng/ml Transforming Growth Factor-β3 (Lonza, PT-4124); and (iv) osteogenic medium, consisting of DMEM-LG supplemented with 10% FBS, 0.05 mM L-ascorbic acid-2-phosphate (Sigma, 49752), 10−7 M dexamethasone, 10 mM β-glycerophosphate (Sigma, G9422), 50 μg/ml gentamycin and 1% antibiotic-antimycotic solution (11).
Cell isolation methods
Bovine and porcine MSCs were isolated from adipose tissue (eight and four donors, respectively), collected in the local abattoir, using enzymatic digestion. Briefly, adipose tissue was transported within 1–2 h to the lab in PBS containing 50 μg/ml gentamycin. After extensive washing with PBS to remove blood, tissue samples were cut in small pieces of approximately 1 mm3, transferred into a four-well plate, minced with a sterile pipet tip for 1–2 min in an enzymatic solution containing 1 mg/ml liberase (Sigma, LIBTM-RO), and incubated for 6 h at 38.5°C in a humidified atmosphere containing 5% CO2. Subsequently, the enzymatic reaction was neutralized with an equal amount of culture medium. The mixture was allowed to separate at room temperature (RT) and the non-buoyant fraction was collected over a 70 μm cell strainer. After adding an equal amount of pre-warmed culture medium, cells were centrifuged for 5 min at 400 g at RT. Finally, after two washing steps, all cells isolated from the 1 mm3 adipose tissue were suspended into culture medium, seeded in a 25 cm2 culture flask and cultured at 38.5°C in a humidified atmosphere containing 5% CO2. Non-adherent cells were removed the following day by completely replacing the culture medium.
To isolate equine MSCs from peripheral blood, 8 ml venous blood of four donors was collected from the vena jugularis using EDTA as anti-coagulans. After centrifugation at 1,000 g for 20 min at RT, the buffy coat fraction was collected and diluted 1:1 (v:v) with PBS. Subsequently, the cell suspension was gently layered on an equal volume of Percoll (density 1.080 g/ml, Sigma-Aldrich, P1644) and centrifuged for 15 min at 600 g at RT, as previously described (38). After collecting the interphase and three wash steps with PBS, cells were resuspended in 5 ml culture medium, seeded in a 25 cm2 culture flask and cultured at 38.5°C in a humidified atmosphere containing 5% CO2. Non-adherent cells were removed the following day by completely replacing the culture medium.
Culture of MSCs
For all species, culture medium was replaced twice weekly and cells were passaged as soon as five or more well-developed colonies were observed. To this end, adherent cells were washed with PBS and incubated with 0.25% trypsin (Sigma, T4799)-−0.02% EDTA (Sigma, EDS) solution for 5 min at 38.5°C. Cold culture medium was used to block the trypsin after which the cell suspension was centrifuged for 10 min at 300 g at RT. Finally, the cell pellet was resuspended in expansion medium. Cell viability and cell numbers were assessed after staining with trypan blue (Sigma) using a Neubauer cell counter. Cells were seeded at a density of 5,000 cells/cm2, cultured in expansion medium and designated as passage one (P1) cells.
Tri-lineage differentiation
After three passages, undifferentiated MSCs were induced toward the adipogenic, chondrogenic and osteogenic differentiation, respectively. Appropriate negative controls were included, being non-induced cells cultured in expansion medium. Briefly, cells for adipogenic differentiation were cultured in triplicate in 24-well plates at a density of 21,000 cells/cm2 in expansion medium until 90–100% confluency. Adipogenic differentiation was induced by subsequent cycles of 72 h culturing in adipogenic induction medium followed by 24 h in adipogenic maintenance medium. Adipogenic differentiation was assessed using Oil Red O (Sigma, O0625) histological staining, a lysochrome, fat-soluble dye used to stain triglycerides and lipoproteins intracellularly, with a Mayer's modified hematoxylin (Abcam, ab220365) counterstaining. Briefly, after cells were fixed using 4% paraformaldehyde (Carl Roth, 964.1, PFA), they were incubated in 60% isopropanol for 5 min and stained for 15 min with diluted Oil Red O solution (3 parts Oil Red O stock solution/2 parts dH2O). After two washings with dH2O, Mayer's modified hematoxylin was added and incubated for 2 min. Brightfield images were taken after two more wash steps.
To induce chondrogenic differentiation, 250,000 cells were centrifuged in 15 ml conical Falcon tubes for 5 min at 150 g at RT. Subsequently, 0.5 ml chondrogenic medium was added to each tube without disturbing the cell pellet. After differentiation, micromass cultures were fixed overnight with 4% PFA, pellets were embedded in 2% agarose and further processed for paraffin sectioning (slices of 5 μm). Subsequently, sections were dried at 56°C for 35 min, rehydrated using decreasing alcohol series in the Varistain Gemini slide stainer (ThermoFisher Scientific), dried for 10 min and incubated in 3% acetic acid for 3 min. Next, slides were stained for 30 min using a 1% Alcian blue (Sigma, A3157) histological staining solution (pH 2.5) to stain glycosaminoglycans (GAGs) such as hyaluronic acid in the extracellular matrix. After rinsing the slides under running tap water for 10 min, they were flushed three times with dH2O and placed into a 0.1% Nuclear Fast Red solution (Sigma, N3020) for 5 min. After rinsing with tap water for 1 min and one washing step with dH2O, slides were dehydrated using increasing alcohol series, and sections were covered with a toluene-based mounting medium (Thermo Scientific, Clearvue) and a cover glass and subsequently imaged.
Osteogenic differentiation was performed in triplicate in 24-well culture dishes with 10,000 cells/cm2 cultured in expansion medium until 90–100% confluency, after which osteogenic differentiation was induced. Osteogenic differentiation was evaluated after fixing the cells with 4% PFA and Alizarin Red S (Sigma, A5533) histological staining of 45 min, used to evaluate calcium deposits in the extracellular matrix, according to the manufacturer's instructions.
Image acquisition and analysis
Images of adipogenic and osteogenic differentiation were captured using an inverted microscope (DMi1, Leica Biosystems, Nussloch, Germany) at a magnification of 100x and 200x, respectively. Images of chondrogenic differentiation were captured at 200x using a brightfield microscope (DM LB2, Leica Biosystems, Nussloch, Germany).
First, an image acquisition protocol was established to ensure consistent image acquisition and data generation. A macro was written in ImageJ macro language to analyze images in batch mode. All relevant parameters such as focus, illumination, exposure, exposure-time and white-balance were determined per image series using visual confirmation and subsequently fixed during image acquisitions. The workflow of the method for all three differentiation lineages is presented in Figure 1. ImageJ macro's were written to analyze images in batch mode and are openly available (39). With well-defined and fixed settings, a darkfield image (called “Dark”) was obtained with a closed illumination path to correct for any fixed pattern noise (hot-pixels). Subsequently, an image of an empty well was captured as “brightfield” (called “Light”) to correct for varying background illumination. As such, images were corrected prior to image analysis for background illumination and transmittance through the well, using “ImageCalculator” and “Calculator_Plus” in ImageJ to compare images between different donors and/or microscopes using following formula:
Next, three different wells per donor and four images per well were analyzed for the adipogenic and osteogenic differentiation, while three paraffin sections per donor were analyzed for the chondrogenic differentiation.
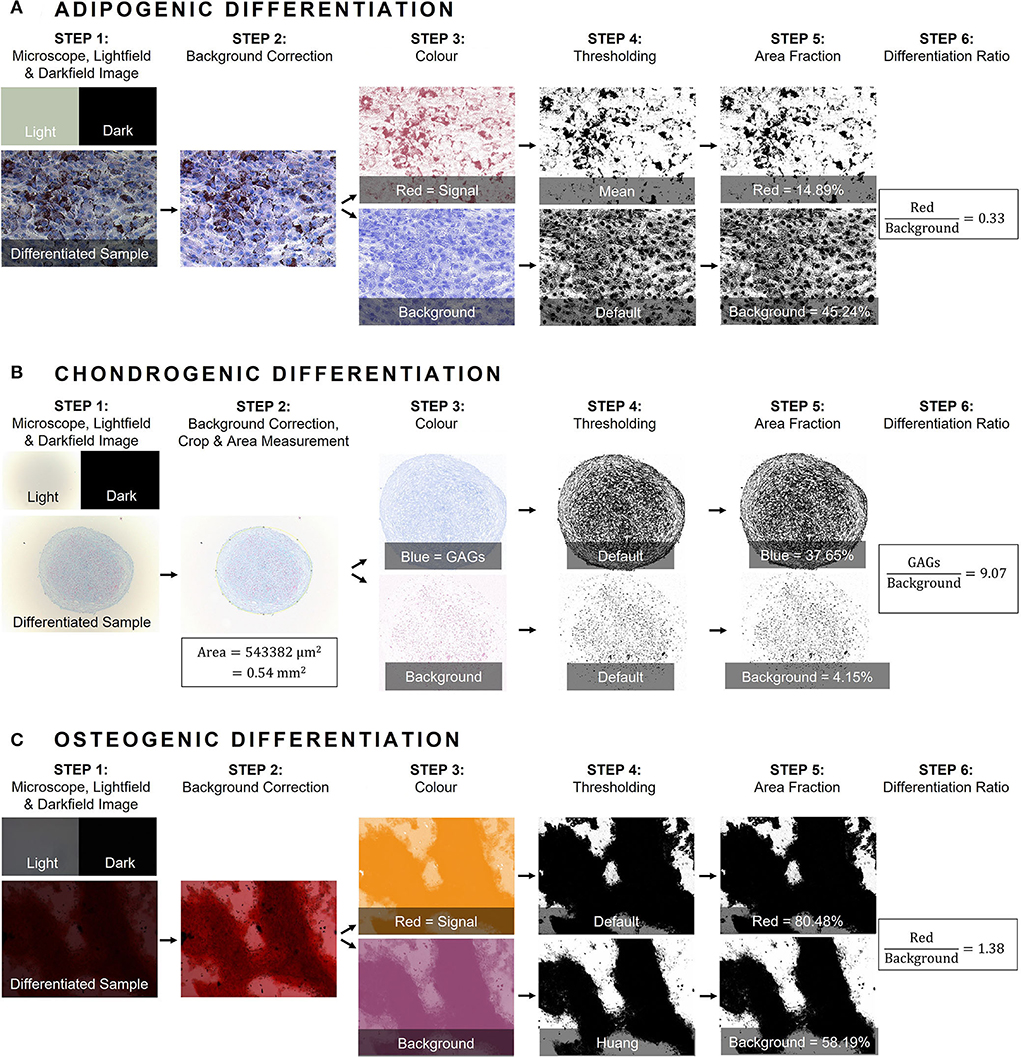
Figure 1. General workflow of image analysis using color deconvolution in ImageJ. (A) Adipogenic differentiation was confirmed with Oil Red O histological staining and Mayer's modified hematoxylin counterstaining, (B) Chondrogenic differentiation with Alcian Blue histological staining and Nuclear Fast Red counterstaining. Additionally, in step 2 chondrogenic pellet size (area in mm2) was measured, and (C) Osteogenic differentiation was confirmed with Alizarin Red staining. In general, a darkfield image (called “Dark”) was obtained with a closed illumination path to correct for any fixed pattern noise (step 1). Subsequently, an image of an empty well was captured as “brightfield” (called “Light”) to correct for varying background illumination (step 1). As such, images were corrected prior to image analysis for background illumination and transmittance through the well (step 2). Next, a threshold for differentiation was determined for each histological staining and separated from the second component either nuclear signal or cell culture area (step 3). Per sample, two channels were established and quantified using “Thresholding” (step 4). Finally, the area fraction of the differentiation channel was measured in the binarized image and divided by the area fraction of the counterpart (step 5 and 6). GAGs, glycosaminoglycans.
For image analysis, the method suggested by Landini et al. was applied, implementing the color deconvolution plug-in for ImageJ with user-defined values (40, 41). Per histological staining, a mixture of two different colors, related to the different stainings, are unmixed using the “Colour Deconvolution 2” plug-in. Each image is separated into two channels representing respective concentrations of each dye. The threshold per dye was determined by assembling an image collage of both differentiated and negative control wells of the same donor, as suggested by Landini et al. (42). Next, the obtained color-vectors were inspected visually by applying the workflow on randomly selected images of different species. If needed, the vectors were adjusted until satisfactory results were obtained. The red signal from the Oil Red O staining, identifying lipid droplets in the cytoplasm after adipogenic differentiation, is separated from the purple hematoxylin nuclear counterstaining. To evaluate chondrogenic differentiation, a blue threshold for staining GAGs in the matrix is separated from the red Nuclear Fast Red signal, used to identify the nuclei. As the chondrogenic differentiation is performed in a micromass culture system, the difference in pellet size between differentiated MSCs vs. non-induced controls was evaluated. Pellet size (area in mm2) was determined by fitting manually an ellipse around the pellet, after which the image was processed. Osteogenic differentiation is confirmed by identifying the calcium deposits of the osteogenic matrix using Alizarin Red S. As non-induced cells stain purple in the absence of osteogenic matrix, a threshold for the red signal is defined to identify osteogenic differentiation and is separated from the purple signal of the non-induced controls.
After determining the color vectors, channels were separated using the “Colour Deconvolution 2” plug-in. Per sample, two channels were established and, for mathematical operation during the analysis steps, converted into an eight-bit format. Binarization was performed using “Thresholding” available in ImageJ. The most appropriate auto-threshold algorithm was determined on sample images and was repeatedly visually inspected during image analyses (43). Subsequently, the area of the signal in the binarized image of each channel was measured. To calculate the differentiation ratio (DR), the area fraction of the differentiation color (being red, blue, and red for adipogenic, chondrogenic and osteogenic, respectively, channel 1) was divided by the area fraction of the second component either nuclear signal or cell culture area (channel 2) (Figure 1). In order to compare differentiation between different donors within one species, a normalized DR was obtained per donor by dividing the mean DR of differentiated wells by the mean DR of the non-induced controls.
Statistical analysis
Data analysis was performed using R Studio (Version 1.3.1093, RStudio, PBC, Boston, MA, USA), using the package “nlme.” Normality was evaluated by visual examination of Q–Q plots and equality of variances was assessed by plotting the residuals against the fitted values. The effect of the condition, i.e., differentiated vs. non-induced cells, was evaluated within one species using repeated measures ANOVA (a univariate approach, condition = fixed factor and donor = random factor).
Results
Bovine MSCs were isolated from eight calves and differentiated toward adipocytes, chondrocytes and osteocytes, respectively. Based on qualitative evaluation of the histological stainings, all donors were able to differentiate toward adipocytes, chondrocytes and osteocytes (Figure 2A). Clear differences in osteogenic differentiation potential were observed by qualitatively assessing the Alizarin Red S staining (Figure 2A). Quantitative evaluation indeed showed significant differences between differentiated and non-induced cells for adipogenic (p < 0.0001), chondrogenic (p = 0.0035) and osteogenic DR (p = 0.0065) (Figure 3A). For one donor, the chondrogenic differentiation potential was however limited when compared to non-induced controls (Figure 3A). Regarding the difference in pellet size a significant difference between chondrogenically differentiated and the non-induced pellet area was detected for bovine donors (p = 0.0034) (Figure 4A). Differences in differentiation potential within one donor were observed as indicated by a high standard deviation. For example, the chondrogenic DR of donor 1 and osteogenic DR of donor 2 showed a large variation (Figure 3A). Additionally, using the normalized DR, differences in differentiation potential were observed from donor-to-donor as well (Figures 2A, 5A). When the normalized DR is less than 1, less differentiation is observed in the differentiated MSCs when compared to non-induced controls; when the normalized DR is above 1, more differentiation is observed. Based on the high normalized DR, for example, donors 4 and 5 showed a superior adipogenic differentiation potential when compared to the other donors (Figures 2A, 5A). Donors 1, 5, 6, and 7, on the other hand, showed a high osteogenic potential as indicated by the high normalized DR. In contrast, donor 8 showed a very low chondrogenic and osteogenic potential, as indicated by a normalized DR of 0.86 and 1.46, respectively (Figures 2A, 5A). It is challenging to identify these differences by qualitative assessment only (Figure 2A). When taking the normalized DR into account for the chondrogenically differentiated bovine MSCs, chondrogenic differentiation of donor 8 was not confirmed as differentiated MSCs gave less differentiation signal than their non-induced counterparts, resulting in a normalized DR less than 1 (Figures 2A, 5A).
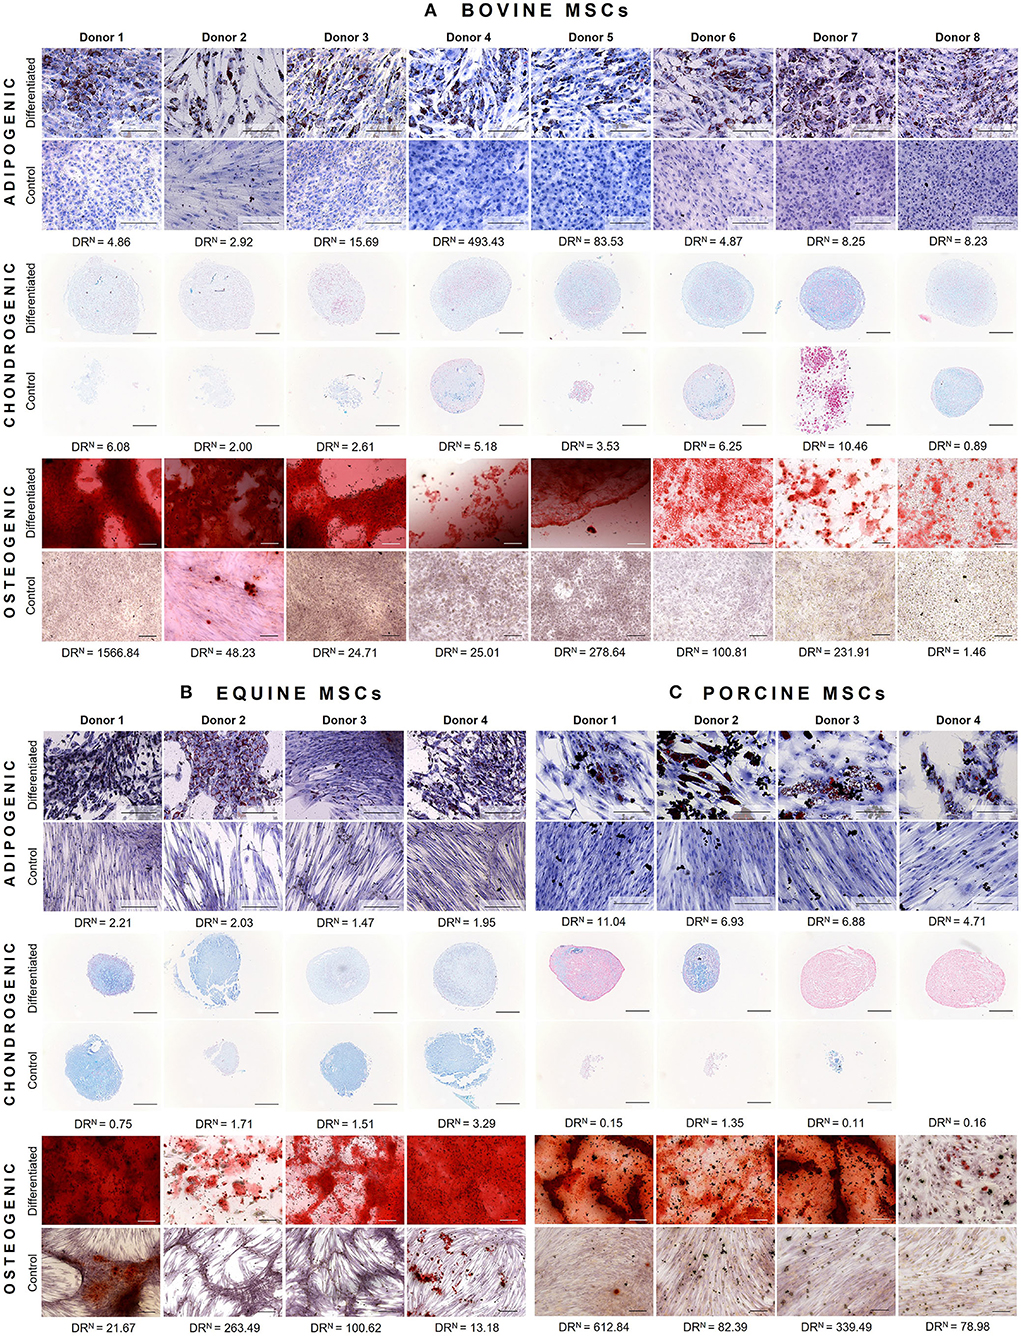
Figure 2. Representative images of tri-lineage differentiation potential of (A) bovine MSCs (n = 8), (B) equine MSCs (n = 4), and (C) porcine MSCs (n = 4). For each donor, both differentiated MSCs and non-induced controls are shown, as well as the normalized differentiation ratio (DRN). The latter is calculated by dividing the mean differentiation ratio of differentiated wells by the mean value of the non-induced controls. When this ratio is less than 1, less differentiation is observed when compared to non-induced controls; when the DRN is above 1, a higher differentiation is observed. Scalebar = 200 μm.
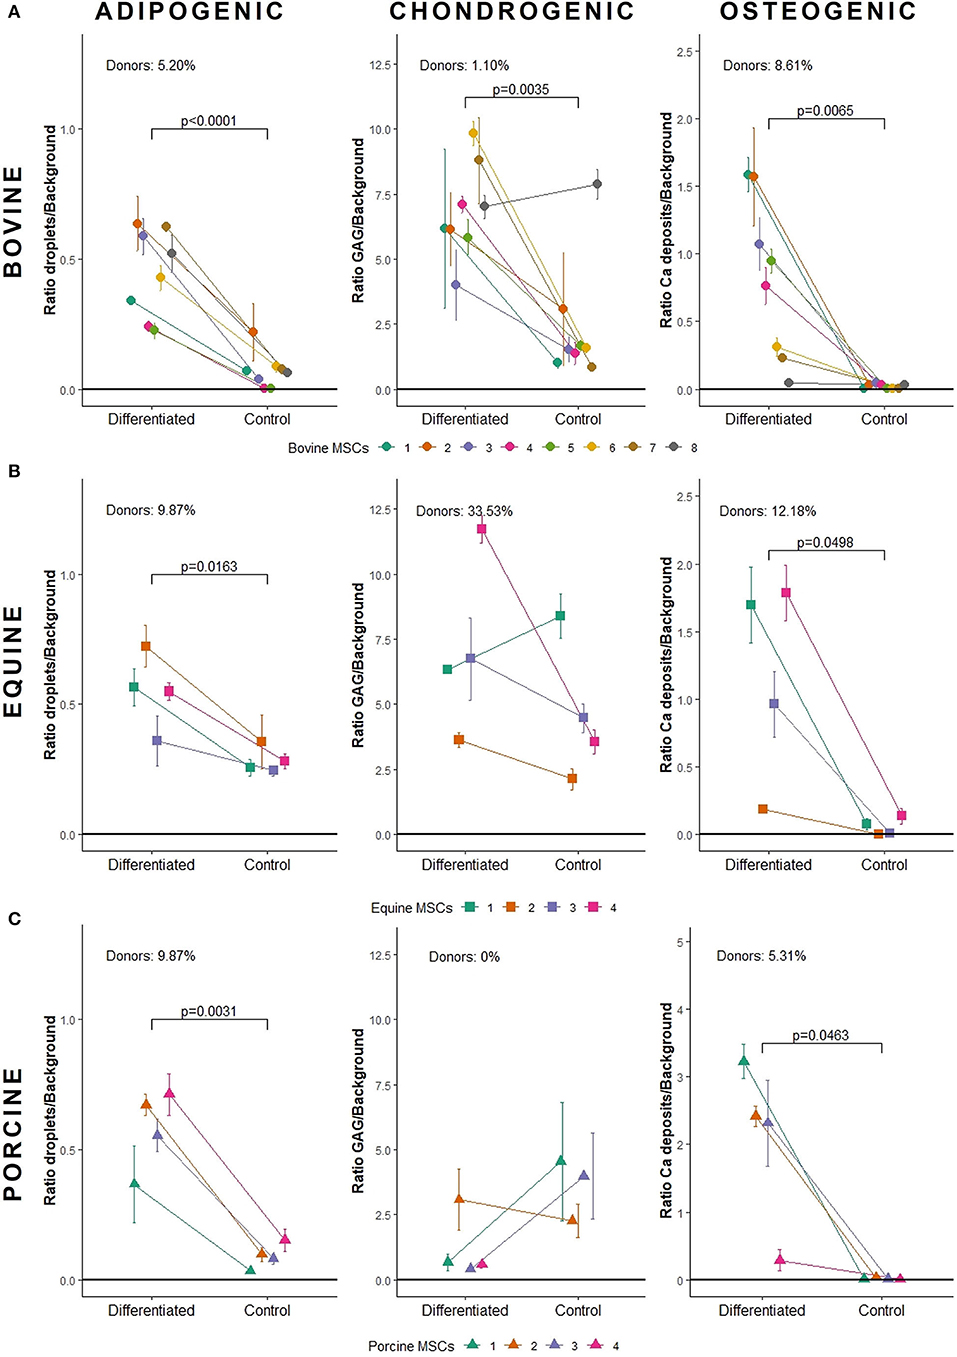
Figure 3. Quantification of tri-lineage differentiation potential of (A) bovine MSCs (n = 8), (B) equine MSCs (n = 4), and (C) porcine MSCs (n = 4). Donors are linked in an interaction plot and the mean differentiation ratio with standard deviation is shown per lineage. GAG, glycosaminoglycans.
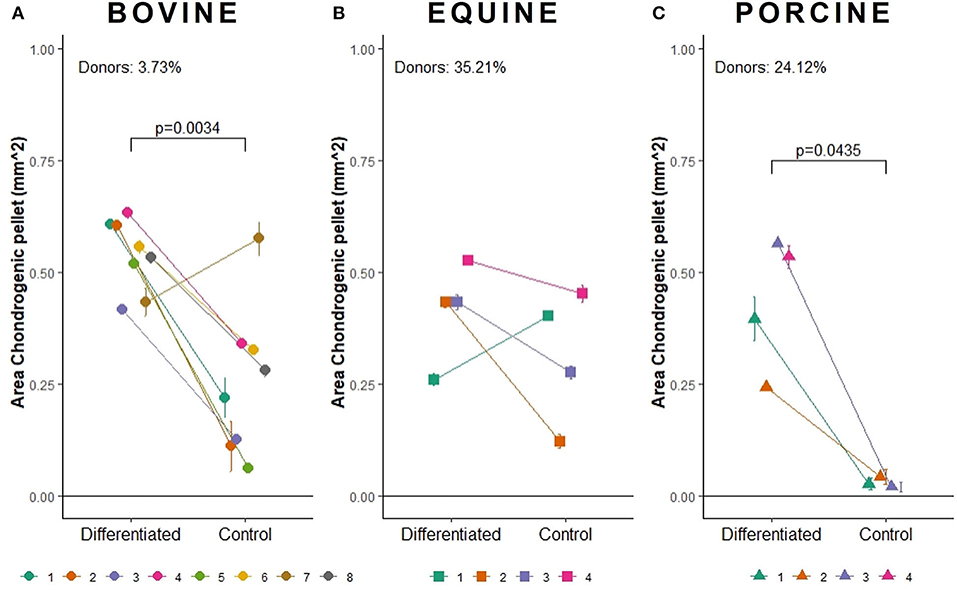
Figure 4. Area measurement (in mm2) to determine the pellet size of chondrogenically induced (A) bovine MSCs (n = 8), (B) equine MSCs (n = 4), and (C) porcine MSCs (n = 4). The mean of chondrogenic pellet area with standard deviation is shown.
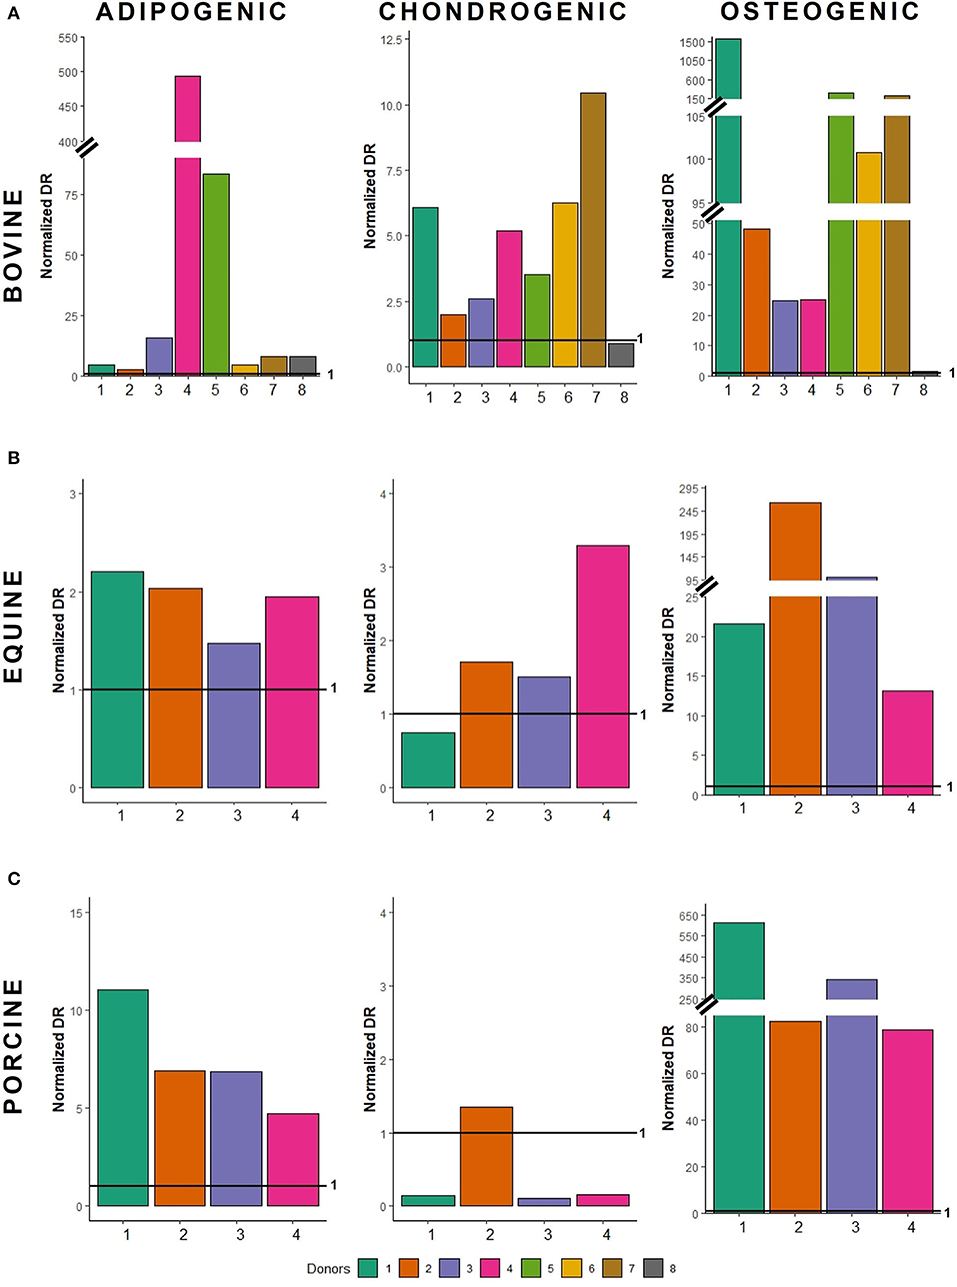
Figure 5. Normalized differentiation ratios of (A) bovine MSCs, (B) equine MSCs, and (C) porcine MSCs. For each donor, the normalized differentiation ratio (DR) is shown. The latter is calculated by dividing the mean DR of differentiated wells by the mean value of the non-induced controls. When this ratio is less than 1, less differentiation is observed when compared to non-induced controls; when the normalized DR is above 1, a higher differentiation is observed.
To verify whether our quantification method could be applied across species, equine and porcine MSCs were evaluated as well. Equine MSCs were isolated from four donors and all donors were able to differentiate toward adipocytes, chondrocytes and osteocytes upon qualitative assessment (Figure 2B). Again, variation in osteogenic differentiation potential was observed (Figure 2B). A higher adipogenic and osteogenic DR was observed when compared to non-induced controls (p = 0.0163 and p = 0.0498, respectively) (Figure 3B). As shown in Figure 3B, a high variation in osteogenic differentiation potential within one donor was observed as illustrated by the high standard deviation in three out of four donors. For equine donors, chondrogenic differentiation potential was limited, when comparing differentiated to non-induced samples (Figure 3B). In addition, no significant differences in pellet size were observed (Figure 4B). Regarding donor-to-donor variation, the normalized DR indicated that donors 2 and 3 were superior for osteogenic differentiation (Figures 2B, 5B). Since the non-induced controls of donors 1 and 4 showed spontaneous osteogenic differentiation, their respective normalized DR's were lower than those of donors 2 and 3 (Figures 2B, 5B), although they showed clearly osteogenic differentiation, both qualitatively in Figure 2B and quantitatively in Figure 3B. Similarly, non-induced controls of donor 1 showed spontaneous chondrogenic differentiation and the normalized chondrogenic DR of this donor is therefore less than 1 (DRN = 0.75).
Porcine MSCs were isolated from four donors. Using a qualitative assessment, all donors were able to differentiate toward the three lineages (Figure 2C). Using our quantification method, a significantly increased adipogenic and osteogenic DR was observed when compared to their respective non-induced controls (p = 0.0031 and p = 0.0463, respectively). No significant difference in chondrogenic DR was observed between differentiated and non-induced controls (Figure 3C), since the normalized DR, which is calculated per donor individually, was less than 1 for all but one donors (Figures 2C, 5C). It must be mentioned that the non-induced cells of donor 4 did not form a cell pellet. Therefore, the mean DR of the non-induced controls of donors 1–3 was used to calculate the normalized DR of donor 4. Similar to our results in bovine MSCs, a significant difference in pellet size was observed between chondrogenically differentiated cells and their non-induced controls (p = 0.0435) (Figure 4C). Regarding variation in differentiation potential within one donor, adipogenic differentiation of donor 1 varied extensively, while chondrogenic differentiation within donor 2 varied, as well as osteogenic differentiation within donor 3 (Figure 3C). Regarding variation in differentiation potential from donor-to-donor, donor 1 showed a superior osteogenic and chondrogenic differentiation potential, when compared to the other donors. Furthermore, donor 3 showed a high osteogenic differentiation potential (Figures 2C, 5C).
Discussion
In this study, a straightforward, simple but robust method was developed to objectively quantify tri-lineage differentiation potential of MSCs based on histological stainings routinely used to assess differentiation qualitatively. To evaluate our quantification method across species, the tri-lineage differentiation potential of bovine, equine, and porcine MSCs was assessed. Using this method, the degree of tri-lineage differentiation can be determined, regardless of microscope settings, species, histological staining, MSC source and/or isolation technique.
A major hurdle when developing MSC-based therapies is the inability to consistently produce homogeneous MSC populations. Indeed, a MSC population consists of a mixture of different stem and lineage-committed progenitor cells, also referred to as MSC heterogeneity (44). Using our quantification method, variability within one donor was observed in all species, illustrating this heterogeneity (Figure 3). Regarding donor-to-donor variation, the outcome of MSC-based therapies might improve when allogeneic MSCs of donors with, for example, known superior osteogenic differentiation potential are used to induce bone regeneration (45), such as bovine donor 1. Bovine donor 7, on the other hand, showed a superior chondrogenic differentiation potential, as illustrated by the high normalized DR (Figure 5A), and thus might be the most appropriate donor for cartilage damage repair (46). Furthermore, it should be mentioned that even subtle changes in differentiation potential can be identified using the normalized DR, such as the difference in osteogenic differentiation potential between bovine donor 4 and 5 (Figures 2A, 5A). As such, it would become possible to select the most appropriate MSC donor for each specific clinical application.
Concerning the chondrogenic differentiation potential of bovine, equine and porcine MSCs, all donors were considered to differentiate into chondrocytes using a qualitative assessment of the Alcian Blue staining. However, our quantification method showed only a limited differentiation capacity, as no significant differences between differentiated and non-induced cells were detected for equine and porcine MSCs (Figure 5). Since the chondrogenic differentiation potential was evaluated in a 3D micromass culture system, the difference in pellet size between differentiated and non-induced cells could additionally be used as parameter. When evaluating pellet size, bovine and porcine chondrogenically differentiated MSCs formed a larger pellet compared to non-induced cells. In contrast, no differences were observed between differentiated and non-induced cells for the equine MSCs. As high-density culture conditions and hypoxia in a 3D cell culture system may enable chondrogenic differentiation, the similar results of the differentiated and non-induced cells for the Alcian Blue staining of equine MSCs might be explained by spontaneous expression of GAGs (47, 48). The latter is illustrated by the large pellets formed in the non-induced equine MSCs which stained positive for Alcian Blue (Figure 2B). Similar results were observed for equine synovial membrane-derived MSCs (49). Regarding the porcine differentiated MSCs, one must keep in mind that the DR is calculated by dividing the area fraction of Alcian Blue by the nuclear signal. In the chondrogenically differentiated MSCs, the presence of glycosaminoglycans, as indicated by the Alcian blue signal, is limited while many nuclei are present. In the undifferentiated control group, no cell pellet was formed and many cells were lost during differentiation and subsequent processing of the samples, which resulted in smaller areas. As such, the DRs of chondrogenically differentiated porcine MSCs, showing some blue signal and many nuclei, are similar to those of the non-induced controls, showing little blue signal and few nuclei. These findings result in normalized DRs close to 1. Furthermore, porcine chondrogenic differentiation in a 3D system is not reported as far as we know, and chondrogenic differentiation of porcine MSCs in general is frequently lacking (34, 50). Further optimizing the chondrogenic differentiation medium per species might be indicated to achieve optimal chrondrogenic differentiation. Further improvement might be achieved by changing the composition and/or concentration of growth factors, such as TGF-β and insulin-like growth factor, supplemented to the medium (51–53).
Prior to bringing new MSC therapies to the market, authorities such as the European Medicines Agency and the U.S. Food and Drug Administration require that they are tested in both a small and large animal model. Based on the similarities of porcine physiology with human, the pig is considered as a very relevant animal model for myocardial infarction, osteochondral defects, wound healing, etc. (54). Our method can support the selection of the most appropriate porcine MSC donor in pre-clinical studies in which the pig is used as model for human. The horse, on the other hand, represents an interesting animal model for preclinical orthopedic research (55). In equine regenerative medicine, MSCs are frequently used to treat osteoarthritis and tendon lesions (56). Identifying specific donors with improved chondrogenic or tenogenic capacities may therefore improve the outcome of clinical studies by providing more consistent results. Both equine and human regenerative medicine would benefit from this approach.
In addition to regenerative applications, undifferentiated MSCs are often used for their anti-inflammatory and immune-modulating capacities (57). Some studies, however, reported that the immune-modulating capacities of MSCs might be impacted by differentiation (58, 59). For instance, chondrogenically differentiated MSCs lost their immune-suppressive capacities and became immunogenic (59). In that context, it is important to verify the absence of spontaneous MSC differentiation, especially when undifferentiated MSCs are used as an immune-suppressive therapy. In addition, adipose tissue-derived MSCs might be contaminated with pre-adipocytes and mature adipocytes, which are potentially immunogenic (17). Both examples illustrate another application of the quantification method reported in this study, namely, to verify whether undesirable cell phenotypes are present when using undifferentiated MSCs therapeutically.
Finally, this quantification method is not limited to evaluate the tri-lineage differentiation potential of MSCs, but it can be applied to other cell types, tissues or staining dyes. With minor modifications, for example, neurogenic differentiation of MSCs can be quantified by detecting neuronal Nissl bodies using a cresyl violet staining (60). Our method is based on color deconvolution (61), in which a brightfield image is decomposed into two separate channels, one for the staining of interest (per differentiation) and one for the counterpart (42, 62). This color deconvolution-based approach can easily be extended to a third staining component.
Nevertheless, there are some limitations to consider when using this method. Color deconvolution is based on eight-bit images and requires a preliminary definition of the color deconvolution components, which can be challenging and as such, is prone to errors (15, 42). It is essential to perform a background correction to provide a neutral color background and a uniformly illuminated field. Furthermore, it must be mentioned that some dyes scatter rather than absorb light or are neutral (gray), and thus cannot be unmixed by color deconvolution. Additionally, when using color deconvolution on fluorometric or immunohistochemical images, precise protein concentrations cannot be determined as these are non-stoichiometric reactions (15, 61, 63). As for all image analysis methods, results depend on the quality of the stained tissue section, as well as on the properties of the images which are affected by many factors, such as tissue fixation method, histological tissue processing, sectioning, staining procedures and image acquisition (62, 64). Finally, it might be interesting to compare the (normalized) DR with other established quantification techniques, such as absorbance assays, in future research.
In conclusion, an efficient method based on color deconvolution was developed in this study to quantify tri-lineage differentiation potential of MSCs across species. We were able to demonstrate differences in differentiation potential within one donor and between donors. Using our well-defined and open access method, the degree of tri-lineage differentiation can be determined in future MSC research. The knowledge gained using this method represents an important asset for regenerative medicine applications as it will support the development of new, more targeted MSC-therapies and improve the consistency and quality of commercially available MSC products.
Data availability statement
Data presented in this study are available upon request from the corresponding author. Image J macro's are available via https://github.com/MeeremansMarguerite/MSC-Differentiation-Quantification.git.
Author contributions
EH was involved in conception and design, sample collection, differentiation experiments, and manuscript writing. MM was involved in creating the ImageJ macro's, data analysis, conception and design, and manuscript writing. BD was involved in data analysis and manuscript writing. MO was involved in manuscript writing. KC was involved in histological staining and data acquisition. CDS was involved in conception and design, data analysis, and manuscript writing. All authors contributed to the article and approved the submitted version.
Funding
This research was partly funded by the Flanders Research Foundation (FWO), SBO grant number S002821N (CustoMeat). MM is funded by the FWO, SB grant number 1S02822N.
Acknowledgments
We gratefully acknowledge Joachim Christiaens and Delphine Ameye (Department of Pathobiology, Pharmacology and Zoological Medicine, Faculty of Veterinary Medicine, Ghent University) for their excellent technical assistance.
Conflict of interest
The authors declare that the research was conducted in the absence of any commercial or financial relationships that could be construed as a potential conflict of interest.
Publisher's note
All claims expressed in this article are solely those of the authors and do not necessarily represent those of their affiliated organizations, or those of the publisher, the editors and the reviewers. Any product that may be evaluated in this article, or claim that may be made by its manufacturer, is not guaranteed or endorsed by the publisher.
References
1. Hosseini S, Taghiyar L, Safari F, Baghaban Eslaminejad M. Regenerative medicine applications of mesenchymal stem cells. In:Turksen K, , editor. Cell Biology and Translational Medicine. Cham: Springer (2018). p. 115–41.
2. Merimi M, El-Majzoub R, Lagneaux L, Moussa Agha D, Bouhtit F, Meuleman N, et al. The therapeutic potential of mesenchymal stromal cells for regenerative medicine: current knowledge and future understandings. Front Cell Dev Biol. (2021) 9:661532. doi: 10.3389/fcell.2021.661532
3. Guest DJ, Dudhia J, Smith RKW, Roberts SJ, Conzemius M, Innes JF, et al. Position statement: minimal criteria for reporting veterinary and animal medicine research for mesenchymal stromal/stem cells in orthopedic applications. Front Vet Sci. (2022) 9:817041. doi: 10.3389/fvets.2022.817041
4. Viswanathan S, Shi Y, Galipeau J, Krampera M, Leblanc K, Martin I, et al. Mesenchymal stem versus stromal cells: international Society for Cell & Gene Therapy (ISCT®) Mesenchymal Stromal Cell committee position statement on nomenclature. Cytotherapy. (2019) 21:1019–24. doi: 10.1016/j.jcyt.2019.08.002
5. Wright A, Arthaud-Day ML, Weiss ML. Therapeutic use of mesenchymal stromal cells: the need for inclusive characterization guidelines to accommodate all tissue sources and species. Front Cell Dev Biol. (2021) 9:632717. doi: 10.3389/fcell.2021.632717
6. Cardoso TC, Okamura LH, Baptistella JC, Gameiro R, Ferreira HL, Marinho M, et al. Isolation, characterization and immunomodulatory-associated gene transcription of Wharton's jelly-derived multipotent mesenchymal stromal cells at different trimesters of cow pregnancy. Cell Tissue Res. (2017) 367:243–56. doi: 10.1007/s00441-016-2504-9
7. Devireddy LR, Myers M, Screven R, Liu Z, Boxer L. A serum-free medium formulation efficiently supports isolation and propagation of canine adipose-derived mesenchymal stem/stromal cells. PLoS ONE. (2019) 14:e0210250. doi: 10.1371/journal.pone.0210250
8. Esteves CL, Sheldrake TA, Mesquita SP, Pesántez JJ, Menghini T, Dawson L, et al. Isolation and characterization of equine native MSC populations. Stem Cell Res Ther. (2019) 8:80. doi: 10.1186/s13287-017-0525-2
9. Merlo B, Teti G, Lanci A, Burk J, Mazzotti E, Falconi M, et al. Comparison between adult and foetal adnexa derived equine post-natal mesenchymal stem cells. BMC Vet Res. (2019) 15:277. doi: 10.1186/s12917-019-2023-5
10. Burk J, Holland H, Lauermann AF, May T, Siedlaczek P, Charwat V, et al. Generation and characterization of a functional human adipose-derived multipotent mesenchymal stromal cell line. Biotechnol Bioeng. (2019) 116:1417–26. doi: 10.1002/bit.26950
11. De Schauwer C, Piepers S, Hoogewijs MK, Govaere JLJ, Rijsselaere T, Demeyere K, et al. Optimization of the isolation, culture, and characterization of equine umbilical cord blood mesenchymal stromal cells. Tissue Eng C Methods. (2011) 17:220. doi: 10.1089/ten.tec.2011.0052
12. Lara E, Rivera N, Rojas D, Rodríguez-Alvarez LL, Castro FO. Characterization of mesenchymal stem cells in bovine endometrium during follicular phase of oestrous cycle. Reprod Domest Anim. (2017) 52:707–14. doi: 10.1111/rda.12969
13. Hillmann A, Ahrberg AB, Brehm W, Heller S, Josten C, Paebst F, et al. Comparative characterization of human and equine mesenchymal stromal cells: a basis for translational studies in the equine model. Cell Transplant. (2016) 25:109–24. doi: 10.3727/096368915X687822
14. Ruhl T, Beier JP. Quantification of chondrogenic differentiation in monolayer cultures of mesenchymal stromal cells. Anal Biochem. (2019) 582:113356. doi: 10.1016/j.ab.2019.113356
15. Eggerschwiler B, Canepa DD, Pape HC, Casanova EA, Cinelli P. Automated digital image quantification of histological staining for the analysis of the trilineage differentiation potential of mesenchymal stem cells. Stem Cell Res Ther. (2019) 10:69. doi: 10.1186/s13287-019-1170-8
16. Frazier SB, Roodhouse KA, Hourcade DE, Zhang L. The quantification of glycosaminoglycans: a comparison of HPLC, carbazole, and Alcian Blue methods. Open Glycosci. (2008) 1:31–9. doi: 10.2174/1875398100801010031
17. Aldridge A, Kouroupis D, Churchman S, English A, Ingham E, Jones E. Assay validation for the assessment of adipogenesis of multipotential stromal cells-a direct comparison of four different methods. Cytotherapy. (2013) 15:89–101. doi: 10.1016/j.jcyt.2012.07.001
18. Frank WA, Tolliday NJ. Introduction: cell-based assays for high-throughput screening. In: Clemons P Tolliday N Wagner B, editors. Cell-Based Assays for High-Throughput Screening. Methods in Molecular Biology. Vol 486. Totowa, NJ: Humana Press (2009) p. 1–12. doi: 10.1007/978-1-60327-545-3_1
19. Zhou P, Shi JM, Song JE, Han Y, Li HJ, Song YM, et al. Establishing a deeper understanding of the osteogenic differentiation of monolayer cultured human pluripotent stem cells using novel and detailed analyses. Stem Cell Res Ther. (2021) 12:41. doi: 10.1186/s13287-020-02085-9
20. Campbell DD, Pei M. Surface markers for chondrogenic determination: a highlight of synovium-derived stem cells. Cells. (2012) 1:1107–20. doi: 10.3390/cells1041107
21. Christopoulus TK, Diamandis EP. Chapter 14: fluorescence immunoassays. In:Christopoulus TK, Diamandis EP, , editors, Immunoassays. London: Elsevier (1996). p. 309–35. doi: 10.1016/B978-012214730-2/50015-7
22. De Schauwer C, Piepers S, van de Walle GR, Demeyere K, Hoogewijs MK, Govaere JLJ, et al. In search for cross-reactivity to immunophenotype equine mesenchymal stromal cells by multicolor flow cytometry. Cytometry A. (2012) 81A:312–23. doi: 10.1002/cyto.a.22026
23. Jensen EC. Types of imaging, part 2: an overview of fluorescence microscopy. Anat Rec. (2012) 295:1621–7. doi: 10.1002/ar.22548
24. Greenspan P, Mayer EP, Fowler SD. Nile red: a selective fluorescent stain for intracellular lipid droplets. Int J Cell Biol. (1985) 100:965–73. doi: 10.0021-9525/85/03/0965/09
25. McKinnon KM. Flow cytometry: an overview. Curr Protoc Immunol. (2019) 120:5.1.1–11. doi: 10.1002/cpim.40
26. Mahmood T, Yang PC. Western blot: technique, theory, trouble shooting. N Am J Med Sci. (2012) 4:429–34. doi: 10.4103/1947-2714.100998
27. Jurek S, Sandhu MA, Trappe S, Bermúdez-Peña MC, Kolisek M, Sponder G, et al. Optimizing adipogenic transdifferentiation of bovine mesenchymal stem cells: a prominent role of ascorbic acid in FABP4 induction. Adipocyte. (2020) 9:35–50. doi: 10.1080/21623945.2020.1720480
28. Greenbaum D, Colangelo C, Williams K, Gerstein M. Comparing protein abundance and mRNA expression levels on a genomic scale. Genome Biol. (2003) 4:117. doi: 10.1186/gb-2003-4-9-117
29. Goossens K, Van Poucke M, Van Soom A, Vandesompele J, Van Zeveren A, Peelman LJ. Selection of reference genes for quantitative real-time PCR in bovine preimplantation embryos. BMC Dev Biol. (2005) 5:27. doi: 10.1186/1471-213X-5-27
30. Solchaga LA, Penick KJ, Welter JF. Chondrogenic differentiation of bone marrow-derived mesenchymal stem cells: tips and tricks. Methods Mol Biol. (2011) 698:253–78. doi: 10.1007/978-1-60761-999-4_20
31. Brennan MÁ, Barilani M, Rusconi F, de Lima J, Vidal L, Lavazza C, et al. Chondrogenic and BMP-4 primings confer osteogenesis potential to human cord blood mesenchymal stromal cells delivered with biphasic calcium phosphate ceramics. Sci Rep. (2021) 11:6751. doi: 10.1038/s41598-021-86147-9
32. Gutiérrez ML, Guevara J, Barrera LA. Semi-automatic grading system in histologic and immunohistochemistry analysis to evaluate in vitro chondrogenesis. Univ Scient. (2012) 17:167–78. doi: 10.2027-1352(201205/08)17:22.0.TS;2-K
33. Bhavsar MB, Cato G, Hauschild A, Leppik L, Costa Oliveira KM, Eischen-Loges MJ, et al. Membrane potential (Vmem) measurements during mesenchymal stem cell (MSC) proliferation and osteogenic differentiation. PeerJ. (2019) 7:e6341. doi: 10.7717/peerj.6341
34. Zimmermann CE, Mackens-Kiani L, Acil Y, Terheyden H. Characterization of porcine mesenchymal stromal cells and their proliferative and osteogenic potential in long-term culture. J Stem Cells Regen Med. (2021) 17:49–55. doi: 10.46582/jsrm.1702008
35. Campos LL, Landim-Alvarenga FC, Ikeda TL, Monteiro BA, Maia L, Freitas-Dell'Aqua CP, et al. Isolation, culture, characterization and cryopreservation of stem cells derived from amniotic mesenchymal layer and umbilical cord tissue of bovine fetuses. Pesq Vet Bras. (2017) 37:278–86. doi: 10.1590/S0100-736X2017000300012
36. Hagen A, Lehmann H, Aurich S, Bauer N, Melzer M, Moellerberndt J, et al. Scalable Production of equine platelet lysate for multipotent mesenchymal stromal cell culture. Front Bioeng Biotechnol. (2021) 8:613621. doi: 10.3389/fbioe.2020.613621
37. Brandt L, Schubert S, Scheibe P, Brehm W, Franzen J, Gross C, et al. Tenogenic properties of mesenchymal progenitor cells are compromised in an inflammatory environment. Int. J. Mol. Sci. (2018) 19:2549. doi: 10.3390/ijms19092549
38. De Schauwer C, Goossens K, Piepers S, Hoogewijs MK, Govaere JLJ, Smits K, et al. Characterization and profiling of immunomodulatory genes of equine mesenchymal stromal cells from non-invasive sources. Stem Cell Res Ther. (2014) 5:6. doi: 10.1186/scrt395
39. Schneider CA, Rasband WS, Eliceiri KW. NIH image to ImageJ: 25 years of image analysis. Nat Methods. (2012) 9:671–5. doi: 10.1038/nmeth.2089
40. Landini G,. Background Illumination Correction (2006–2020). Available online at: https://blog.bham.ac.uk/intellimic/background-illumination-correction (accessed June 24, 2022).
41. Meeremans, M,. Color Deconvolution for the Quantification of MSC Tri-Lineage Differentiation. Available online at: https://github.com/MeeremansMarguerite/MSC-Differentiation-Quantification (accessed July 28, 2022).
42. Liu X, Rui T, Zhang S, Ding Z. Heterogeneity of MSC: origin, molecular identities, and functionality. Stem Cells Int. (2019) 19:9281520. doi: 10.1155/2019/9281520
43. Image J Plugin: Auto Threshold. Available online at: https://imagej.net/plugins/auto-threshold (accessed August 1, 2022).
44. Kim BS, Yang SS, You HK, Shin HI, Lee J. Fucoidan-induced osteogenic differentiation promotes angiogenesis by inducing vascular endothelial growth factor secretion and accelerates bone repair. J Tissue Eng Regen Med. (2017) 12:e1311–24. doi: 10.1002/term.2509
45. Zha K, Li X, Yang Z, Tian G, Sun Z, Sui X, et al. Heterogeneity of mesenchymal stem cells in cartilage regeneration: from characterization to application. Npj Regen Med. (2021) 6:14. doi: 10.1038/s41536-021-00122-6
46. Rakic R, Bourdon B, Demoor M, Maddens S, Saulnier N, Galéra P. Differences in the intrinsic chondrogenic potential of equine umbilical cord matrix and cord blood mesenchymal stromal/stem cells for cartilage regeneration. Sci Rep. (2018) 8:13799. doi: 10.1038/s41598-018-28164-9
47. Mahboudi H, Kazemi B, Soleimani M, Hanaee-Ahvaz H, Ardeshirylajimi A, Eftekhary M, et al. Comparison between high cell-density culture systems for chondrogenic differentiation and articular cartilage reconstruction of human mesenchymal stem cells: a literature review. Regen Reconstr Restor. (2017) 2:7–15. doi: 10.22037/rrr.v2i1.14381
48. Gale AL, Linardi RL, McClung G, Mammone RM, Ortved KF. Comparison of the chondrogenic differentiation potential of equine synovial membrane-derived and bone marrow-derived mesenchymal stem cells. Front Vet Sci. (2019) 6:178. doi: 10.3389/fvets.2019.00178
49. Im GI, Shin YW, Lee KB. Do adipose tissue-derived mesenchymal stem cells have the same osteogenic and chondrogenic potential as bone marrow-derived cells? Osteoarthr Cartil. (2005) 13:845–53. doi: 10.1016/j.joca.2005.05.005
50. Huang L, Niu C, Willard B, Zhao W, Liu L, He W, et al. Proteomic analysis of porcine mesenchymal stem cells derived from bone marrow and umbilical cord: implication of the proteins involved in the higher migration capability of bone marrow mesenchymal stem cells. Stem Cell Res Ther. (2015) 6:77. doi: 10.1186/s13287-015-0061-x
51. Afizah H, Yang Z, Hui JHP, Ouyang HW, Lee EH. A comparison between the chondrogenic potential of human bone marrow stem cells (BMSCs) and adipose-derived stem cells (ADSCs) taken from the same donors. Tissue Eng. (2007) 13:659–66. doi: 10.1089/ten.2006.0118
52. Weissenberger M, Weissenberger MH, Gilbert F, Groll J, Evans CH, Steinert AF. Reduced hypertrophy in vitro after chondrogenic differentiation of adult human mesenchymal stem cells following adenoviral SOX9 gene delivery. BMC Musculoskelet Disord. (2020) 21:109. doi: 10.1186/s12891-020-3137-4
53. Lunney JK, Van Goor A, Walker KE, Hailstock T, Franklin J, Dai C. Importance of the pig as a human biomedical model. Sci Transl Med. (2021) 13:eabd5758. doi: 10.1126/scitranslmed.abd5758
54. Patterson-Kane JC, Rich T. Achilles tendon injuries in elite athletes: lessons in pathophysiology from their equine counterparts. ILAR J. (2014) 55:86–99. doi: 10.1093/ilar/ilu004
55. Mahmoud EE, Hassaneen ASA, Noby MA, Mawas AS, Abdel-Hady ANA. Equine osteoarthritis: an overview of different treatment strategies. SVU Int J Vet Sci. (2021) 4:85–96. doi: 10.21608/svu.2021.57242.1099
56. Cequier A, Sanz C, Rodellar C, Barrachina L. The usefulness of mesenchymal stem cells beyond the musculoskeletal system in horses. Animals. (2021) 11:931. doi: 10.3390/ani11040931
57. Le Blanc K, Tammik C, Rosendahl K, Zetterberg E, Ringdén O. HLA expression and immunologic properties of differentiated and undifferentiated mesenchymal stem cells. Exp Hematol. (2003) 31:890–6. doi: 10.1016/S0301-472X(03)00110-3
58. Ryan AE, Lohan P, O'Flynn L, Treacy O, Chen X, Coleman C, et al. Chondrogenic differentiation increases antidonor immune response to allogeneic mesenchymal stem cell transplantation. Mol Ther. (2014) 22:655–67. doi: 10.1038/mt.2013.261
59. Fathi E, Farahzadi R. Zinc sulphate mediates the stimulation of cell proliferation of rat adipose tissue-derived mesenchymal stem cells under high intensity of EMF exposure. Biol Trace Elem Res. (2018) 184:529–35. doi: 10.1007/s12011-017-1199-4
60. Tuominen VJ, Ruotoistenmäki S, Viitanen A, Jumppanen M, Isola J. ImmunoRatio: a publicly available web application for quantitative image analysis of estrogen receptor (ER), progesterone receptor (PR), and Ki-67. Breast Cancer Res. (2010) 12:R56. doi: 10.1186/bcr2615
61. Landini G, Martinelli G, Piccinini F. Colour deconvolution: stain unmixing in histological imaging. Bioinformatics. (2021) 37:1485–7. doi: 10.1093/bioinformatics/btaa847
62. Bianconi F, Kather JN, Reyes-Aldasoro CC. Experimental assessment of color deconvolution and color normalization for automated classification of histology images stained with hematoxylin and eosin. Cancers. (2020) 12:1–20. doi: 10.3390/cancers12113337
63. Van der Loos CM. Multiple immunoenzyme staining: methods and visualizations for the observation with spectral imaging. J Histochem Cytochem. (2008) 56:313–28. doi: 10.1369/jhc.2007.950170
Keywords: tri-lineage differentiation, quantification, regenerative medicine, donor variability, MSC
Citation: Heyman E, Meeremans M, Devriendt B, Olenic M, Chiers K and De Schauwer C (2022) Validation of a color deconvolution method to quantify MSC tri-lineage differentiation across species. Front. Vet. Sci. 9:987045. doi: 10.3389/fvets.2022.987045
Received: 05 July 2022; Accepted: 20 September 2022;
Published: 13 October 2022.
Edited by:
Cristina Esteves, University of Edinburgh, United KingdomReviewed by:
Janina Burk, Justus-Liebig-University Giessen, GermanyEleonora Iacono, University of Bologna, Italy
Copyright © 2022 Heyman, Meeremans, Devriendt, Olenic, Chiers and De Schauwer. This is an open-access article distributed under the terms of the Creative Commons Attribution License (CC BY). The use, distribution or reproduction in other forums is permitted, provided the original author(s) and the copyright owner(s) are credited and that the original publication in this journal is cited, in accordance with accepted academic practice. No use, distribution or reproduction is permitted which does not comply with these terms.
*Correspondence: Emma Heyman, RW1tYS5IZXltYW5AVUdlbnQuYmU=
†These authors have contributed equally to this work and share first authorship