
95% of researchers rate our articles as excellent or good
Learn more about the work of our research integrity team to safeguard the quality of each article we publish.
Find out more
ORIGINAL RESEARCH article
Front. Vet. Sci. , 23 September 2022
Sec. Animal Nutrition and Metabolism
Volume 9 - 2022 | https://doi.org/10.3389/fvets.2022.958751
This article is part of the Research Topic Greenhouse Gases Mitigation Strategies in Grazing Ruminants View all 6 articles
 Patrícia Perondi Anchão Oliveira1*
 Alexandre Berndt1
 André de Faria Pedroso1Teresa Cristina Alves1
 Amanda Prudêncio Lemes2
 Bia Anchão Oliveira3
 José Ricardo Macedo Pezzopane1Paulo Henrique Mazza Rodrigues4
Brazilian cattle production is mostly carried out in pastures, and the need to mitigate the livestock's greenhouse gas (GHG) emissions and its environmental footprint has become an important requirement. The adoption of well-suited breeds and the intensification of pasture-based livestock production systems are alternatives to optimize the sector's land use. However, further research on tropical systems is necessary. The objective of this research was to evaluate the effect of Holstein (HO) and Jersey–Holstein (JE x HO) crossbred cows in different levels of pasture intensification (continuous grazing system with low stocking rate–CLS; irrigated rotational grazing system with high stocking rate–RHS), and the interaction between these two factors on GHG mitigation. Twenty-four HO and 24 JE x HO crossbred dairy cows were used to evaluate the effect of two grazing systems on milk production and composition, soil GHG emissions, methane (CH4) emission, and soil carbon accumulation (0–100 cm). These variables were used to calculate carbon balance (CB), GHG emission intensity, the number of trees required to mitigate GHG emission, and the land-saving effect. The number of trees necessary to mitigate GHG emission was calculated, considering the C balance within the farm gate. The mitigation of GHG emissions comes from the annual growth rate and accumulation of C in eucalyptus trees' trunks. The CB of all systems and genotypes presented a deficit in carbon (C); there was no difference for genotypes, but RHS was more deficient than CLS (-4.99 to CLS and −28.72 to RHS ton CO2e..ha−1.year−1). The deficit of C on GHG emission intensity was similar between genotypes and higher for RHS (−0.480 to RHS and −0.299 to CLS kg CO2e..kg FCPCmilk−1). Lower GHG removals (0.14 to CLS higher than 0.02 to RHS kg CO2e..kg FCPCmilk−1) had the greatest influence on the GHG emission intensity of milk production. The deficit number of trees to abatement emissions was higher to HO (−46.06 to HO and −38.37 trees/cow to JE x HO) and to RHS (−51.9 to RHS and −33.05 trees/cow to CLS). However, when the results are expressed per ton of FCPCmilk, there was a difference only between pasture management, requiring −6.34 tree. ton FCPCmilk−1 for the RHS and −3.99 tree. ton FCPCmilk−1 for the CLS system. The intensification of pastures resulted in higher milk production and land-saving effect of 2.7 ha. Due to the reservation of the pasture-based dairy systems in increasing soil C sequestration to offset the GHG emissions, especially enteric CH4, planting trees can be used as a mitigation strategy. Also, the land-save effect of intensification can contribute to the issue, since the area spared through the intensification in pasture management becomes available for reforestation with commercial trees.
Currently, Brazil occupies the third place in the world ranking of milk production, with more than 35 billion liters per year with dairy properties distributed in 98% of Brazilian municipalities (1). The majority of these farms are small and medium-sized; nevertheless, the sector employs close to four million people (2). More than 60% of the Brazilian milk production is concentrated in the Atlantic Forest Biome in the South and Southeast regions, with a herd of 8.05 million dairy animals and 24 billion liters per year. Brazil has 159.5 million ha of pastures, and of these, 42.2 million ha are in the Atlantic Forest Biome (1). Despite its scale of production, the trade balance of the national dairy sector had a deficit of US$ 378,840,000 in 2021 according to the Brazilian Foreign Trade Secretary (SECEX) (3). This discrepant scenario of systematic low efficiency can be explained by the production model adopted in the farms. Grasses are the main source of feed for dairy cattle, within pasture-based systems, which are often managed below their potential stocking rate, with a national average stocking rate of 1 cow.ha−1. In addition, the individual animal production is also low, 2,192 L. year−1 per cow. In the Southeast, for instance, the average milk production per cow is 2,580 L. year−1, and in the South, it is 3,618 L. year−1 (1).
While being challenged to meet the domestic demand for milk, within the past two decades the dairy sector has also been asked to satisfy the consumer demands for quality. Overall, consumers are more aware of issues related to value-added milk, product certifications (4), CB and the environmental footprint of milk and derivates (5, 6), and animal welfare regulations (7).
Among these requirements, the concern with climate changes stands out, considering that the agricultural sector is responsible for 33.6% of Brazilian GHG emissions, of which 19% are originated from enteric fermentation (8). The bovine herd contributes with 97% of enteric fermentation emissions, with 86% coming from the beef herd and 11% from dairy cattle (8). Subsequently to the ratification of several international agreements to combat the climate crisis by the Brazilian government, a strategic national plan was established in 2009, the ABC Plan, specifically “Mitigation and Adaptation to Climate Change for the Consolidation of a Low-Carbon Economy in Agriculture,” in accordance with the National Climate Change Policy as part of Brazil's action to mitigate GHG emissions and prevent global warming (9), currently called ABC+ Plan (Plan for adaptation and low C emission in agriculture 2020-2030) (10). Furthermore, Brazil joined the Global Methane Pledge, (11), which has as its main objective “to take voluntary actions to contribute to a collective effort to reduce global CH4 emissions by at least 30% of 2020s levels by 2030, which could eliminate over 0.2°C of global warming by 2050.”
Strategies to reduce greenhouse gas emissions, such as changes in the management of pasture-based dairy systems through the intensification of the forage utilization, and use of more specialized animal breeds and crossbreeds, have been reported also as effective CH4 mitigation strategies (12–16). Contrary to what was first believed, none of these approaches compromised animal performance, but presented an advantage when compared to the traditional Brazilian dairy systems; they became C sinks, by increasing the C sequestration of pasture-based systems (17–20). These actions (improve soil fertility and pasture management, animal breeding, dietary, and rumen manipulation) can positively contribute to the CB of dairy farms and diminish the necessity of outside actions (compensatory actions such as planting trees and purchasing C credits) to compensate and possibly offset their emissions.
Sustainable intensification of livestock production systems might become a key technology for the mitigation of climate changes. It is possible to infer that combining suitable animal genetics with functional pastoral systems is fundamental to improve dairy production and to guarantee the sustainability of the dairy sector. The results of long-term experiments in this area are scarce for tropical and sub-tropical regions.
Aiming to contribute to the improvement and sustainability of dairy production systems, this study evaluated the influence of two dairy cow genotypes and two levels of intensification in tropical pasture-based systems on milk yield, composition, soil GHG emissions, CH4 emission, and soil C accumulation rate in the depth of 0–100 cm (CAR), CB, GHG emission intensity, the numbers of trees necessary to compensate the GHG emissions, and land-saving effect of different dairy production systems.
The hypothesis of this study was that the use of crossbreed cows and intensified pastures contribute to the mitigation of GHG emissions and result in the land-saving effect.
The experiment was carried out at Embrapa's Southeast Livestock Research Center, São Carlos, São Paulo, Brazil (22°1' S, 47°53' W; 853 m above sea level), during two periods: May 2012 to April 2013 and May 2013 to January 2014. The local climate is Cwa, according to Köppen's climate classification, with yearly average rainfall and temperature of 1,360 mm and 20 °C, respectively (21). The experimental location is characterized as Brazilian Atlantic Forest Biome (22). The soil profile is classified as dystrophic Red-yellow Latosol—Oxisol, according to the Food and Agriculture Organization of the United Nations (FAO) classification (Hapludox, after United States—US Soil taxonomy) with a sandy loam texture (23).
The experiment used a randomized complete block design, with a 2 x 2 factorial arrangement of the treatments, defined as two cattle genotypes: Holstein (HO) and Jersey–Holstein (JE x HO), and two grazing management systems: extensive (CLS)—continuous grazing system with low stocking rate; intensive (RHS)—rotational grazing system, irrigated pasture with high stocking rate. The Native Forest (FOR)—Atlantic Forest (seasonal semi-deciduous forest), was used as a reference area to calculate C stocks. Each treatment had two area replications and two periods.
The original forest biome (Atlantic Forest) was converted into Brachiaria spp. and Cynodon nlemfuensis Vanderyst pastures in 1984. The ranges were continuously grazed within seasons and throughout the years with adjustments in the animal stocking rate.
This original grazing system was adopted as the CLS pasture treatment and comprised of two paddocks of 3.0 ha each (area replication). Through the course of the experiment, the average levels of phosphorus (P) and potassium (K) in soil were 26.5 mg P dm−3 and 3.1 % K in soil CEC (cation exchange capacity), with no lime and fertilizer application.
After 10 years of continuous management (1984–1994), part of the grazing system area was converted into the intensively managed system. The RHS pasture was cultivated with Panicum maximum Jacq cv. Tanzânia and overseeded annually with Avena byzantina cv. São Carlos and Lolium multiflorum Lam. cv. BRS Ponteio in the autumn and irrigated. The irrigation criteria were according to Rassini (24), using the climatological water balance method. The RHS system consisted of two experimental units of 1.6 ha (replication area) that were divided into 27 paddocks (500 m2), subjected to rotational grazing, with 1 day of occupation and 26 days of resting.
The lime application in RHS systems consisted of 2.2 ton ha−1 of dolomitic limestone in the first year and one fertilizer application of 175 kg ha−1 year−1superphosphate in the second year to achieve 20 mg P dm−3. Fertilization with nitrogen (N) and K was made at the rate of 456 kg ha−1 year−1 and fertilization with sulfur (S) was made at the rate of 136.8 kg ha−1 year−1 (six applications of 40 kg N and K ha−1 in the rainy season and six applications of 36 kg N and K ha−1 in the dry season, using the 20-05-20 + 6% S formula). The N, K, and S fertilizer was made in each paddock at the first day after grazing.
Both grazing systems had their stocking rate adjusted according to Mott et al. (25). The “put and take” method adjusts the stocking rate periodically due to changes in the forage supply, aiming to keep the grazing pressure as close to the carrying capacity as possible throughout the experiment (26, 27). The forage availability was assessed as the grasses' stubble height (35 cm for pastures in RHS and 15 cm for pastures in CLS), according to Costa and Queiroz (28).
Cows were kept on pasture and received a concentrate supplement at a rate of 1:3 (kg of concentrate: kg of milk produced) and offered individually twice a day before milking. The concentrate was composed of 84.36% corn grain, 10% soybean meal, 3% vitamins and minerals mixture, 1% urea, 1.6% sodium bicarbonate, and 0.04% Rumensin (100 g kg−1 of sodium monensin). The concentrate was formulated according to the NRC (29) to have 16.3% crude protein (CP), 11.6% neutral detergent fiber (NDF), 5.5% acid detergent fiber (ADF), 3.9% ether extract, 62.8% starch, 67.8% non-fibrous carbohydrate, 6.1% ash, 0.48% Ca, 0.72% P, 82.3% total digestible nutrients (TDN), and 1.92 Mcal kg−1 of net energy for lactation. For the nutritive value composition, the forage samples were composed by season of the year, calculating the proportion of forage production in each season in relation to the annual forage production. Nutrient composition of forage (Table 1) was performed according to AOAC (30).
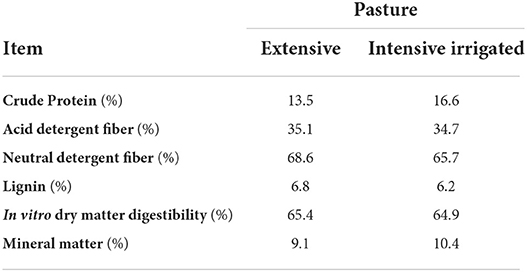
Table 1. Bromatological composition of the pastures (DM basis).
The cows were managed according to the Institutional Animal Care and Use Committee Guidelines of Brazilian Agricultural Research Corporation—EMBRAPA, Brazil (PRT n. 5/2016). Twenty-four cows were used in each evaluation period (2012–2013 and 2013–2014), totaling 48 cows in the total experimental period (24 HO and 24 JE x HO crossbreed).
Cows were selected from an experimental herd, previously prepared for the experiment. All cows, inside of each genotype group, were uniform in age, live weight, stage of lactation, and milk yield, with cows in both groups initially at approximately 90 days of lactation. In the beginning of the experiment, the initial body weights (BW) were 609 (SEM = 10.3) and 548 (SEM = 13.6) kg, lactation numbers were 2.9 and 2.4, and days in milk were 60 and 100 days, for HO and JE x HO crossbreed, respectively. The cows were part of a breeding program, where JE x HO crossbreeds were produced from insemination of purebred HO cows (all belonging to the same herd) with Jersey bull semen. Holstein cows were originated from the same herd but using HO bull semen (purebred animals).
The experimental period comprised two lactations (2012–2013 and 2013–2014). Evaluations started in autumn and were completed in summer. Cows were mechanically milked twice a day (6h00 and 16h30). Milk production was evaluated every 15 days (during two consecutive days) using Milk Meters (EZI TEST/TRU TEST GROUP, New Zealand). Milk was sampled for analysis once a month. Samples were taken in each of the two daily milking, directly from the milk meters into flasks containing bronopol, and a composite sample was sent for analysis to a laboratory at the University of São Paulo (Clínica do Leite—ESALQ/USP). Fat, crude protein, lactose, total solids (TS), and dry defatted extract were analyzed by Infra-Red PO ANA 001, according to TUT PC 005 (31). The 3.5% fat and crude protein-corrected milk (FCPCmilk) was calculated according to NRC (29).
Individual milk production, milk composition, and stocking rate (cows ha−1) data were used to calculate the productivity of milk and its components per year (kg ha−1 year−1). All cows (testers or not) were weighed monthly. The daily stocking rate (cows ha−1 d−1) was obtained by dividing the total weight of cows present in each replicate pasture by the average weight of the experimental cows (tester) of each genotype and by the area of the pasture.
At the beginning of the experimental period (2012), soil samples (0–20 and 20–40 cm) were randomly taken for the characterization of the soil profile of the CLS system and for liming and fertilization in the RHS system. Soil samples were at 0–5, 5–10, 10–20, 20–30, 30–40, 40–60, 60–80, and 80–100 cm depths in six trenches (three replications per area) of 1.2 x 1.2 x 1.2 m dimensions (20). They were randomly located about 100 and 150 m afar in each treatment (CLS, RHS, and FOR) and utilized for soil chemical–physical analyses using the protocol by Fernandes et al. (32). Composite soil samples were also taken at the same depths (from 0–5 to 80–100 cm) at twelve sampling points across each trench to evaluate soil textural structure, OM, and C, according to the protocol by Fernandes et al. (32).
Soil samples were sieved and weighed for the measuring of clay and sand. Silt was defined by subtracting sand and clay weight from the initial weight of the sample (10 g) (33). The simplified textural class triangle was used to determine soil texture (23). Soil samples were air-dried and sieved (2 mm). Sub-samples were sieved (60 mesh) using a roller-mill grinding process (34). An elemental analyzer was used to define C percentage by dry combustion. Soil C stocks (0–30 cm and 0–100 cm) were assessed using the protocol proposed by Fernandes et al. (32), based on Ellert and Bettany (35) and Sisti et al. (36), corrected based on the soil mass of a reference area, the forest in this experiment. The corrected C stock was estimated by Equation 1:
Cs = total C stock (Mg ha−1), corrected based on the soil mass of a reference area;
= sum of C stocks from the first to the next-to-last deepest layer sampled in the treatment (Mg ha−1);
Mtn = soil mass of the deepest layer in the treatment (Mg ha−1);
= sum of total soil mass in the treatment (Mg ha−1);
= sum of total soil mass in the reference area (Mg ha−1);
Ctn = soil C content in the deepest layer (Mg Mg−1 of soil).
Prior to the correction using soil mass, C stock of each layer was calculated using Equation 2 (37):
Cst = C stock in a certain layer (Mg ha−1).
CO = total organic C content in the layer (g kg−1).
Ds = soil density in the layer (kg dm−3).
e = layer thickness (cm).
Dividing the difference between C stock in the pasture systems and the one in the native forest (reference) by the number of years passed since the implementation of each pasture system until the soil sampling date (2012) was estimated the annual C accumulation rates for 0–100 cm layers, according to previous studies (19, 32, 38).
Soil organic C was determined by dichromatometry (33). Organic matter (OM) was extracted in sulfochromic solution (strong acid medium produced with sodium dichromate and sulfuric acid). The concentration of reduced Chromium (Cr III) ions was determined by colorimetry in a spectrophotometer, using 650 mm wavelength. The percentage of OM was calculated by multiplying the content of organic C by 1.724, this factor being derived from the C content in humus (58%).
Using a volumetric ring (Kopecky's Rings), undisturbed soil cores at the different layers of each trench were collected and used to evaluate the soil density. Bulk density was determined by dividing the dry weight of soil (105 °C) of each soil core by the volume of soil in the volumetric ring (33).
The CH4 evaluation was made with sulfur hexafluoride (SF6) gas tracer technique (39), and refined by Berndt et al. (40). This technique is established (41) and can be applied with confidence in studies evaluating treatment effects (42), mainly for grazing animals (McGinn et al., 2006). This technique applies a calibrated permeation capsule placed in the rumen. In the first year, the calibration was 190 SF6 gas of 2.396 ± 0.06 mg. day−1, and in the second year, it was 190 SF6 gas of 1.753 ± 0.19 mg. day−1. The gases expelled through the mouth and nostrils were aspirated by a capillar tube adapted to a halter and connected to a canister under vacuum (collector), which was fixed on the neck of the animal. The CH4 collections were performed for five consecutive days, with the evacuated sampling canisters being changed every 24 h.
The sampling canisters were sent for chromatographic analysis, next to collection phase. Their contents were diluted with pure N to quantity of SF6 and CH4 gases, using a “Greenhouse” GC-2014 gas chromatograph (Shimadzu), with a flame ionization detector (FID) and an electron capture detector (ECD), respectively. The concentrations of CH4 and SF6 found in the “blank readings” were discounted from the concentrations found in the evacuated sampling canisters. The periods of sampling collects were in spring (September 21 to December 20), summer (December 21 to March 20), autumn (March 21 to June 20), and winter (June 21 to September 20). Methane emissions from enteric fermentation (t CO2e..ha−1 per year) were estimated using the Equations 3, 4, and 5.
CH4 emissions from enteric fermentation (t CO2e..ha−1 per year) = (annual average of animal's number .ha−1 * annual average emission of individual animal) * Global Warming Potential (GWP) * 365 days.(3)
Annual average of animals number . ha−1 = (stocking rate daily spring average + stocking rate daily summer average + stocking rate daily autumn average + stocking rate daily winter average)/4, considering “put and take” method.(4)
Annual average emission (CH4) of an individual animal (t. animal−1) = (CH4 daily spring average + CH4 daily summer average + CH4 daily autumn average + CH4 daily winter average)/4.(5)
The collected gas samples were accomplished on an event basis for 2 years, according to Figure 1.
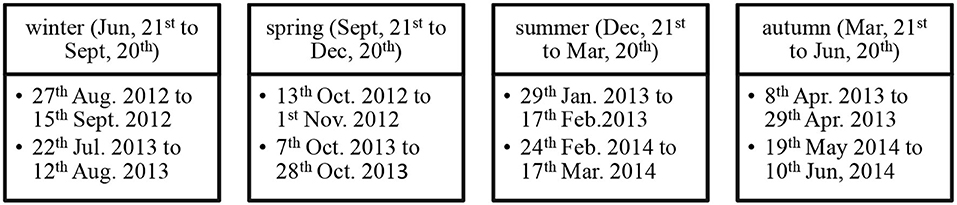
Figure 1. Flowchart of gas samples collect event basis.
PVC chambers installed in the experimental plots were used to collect gas samples (chamber technique), according to protocol suggested by Zanata et al. (43), based on Parkin et al. (44).
Three chambers were used per replicates (six per treatment). These were allocated randomly, not contemplating the possible presence of feces and urine from before. Instead, it was taken into consideration that in grazing systems with high stocking rates, feces and urine are distributed in the whole area making it difficult to detect places not contaminated by excreta (45). In every sampling period, samples were taken initially for five successive days and, subsequently, at two to three-day intervals until a total of 10-day samplings were finished in each season. This comprised 22 days of sampling per period. The first samplings occurred 24 h after fertilization, due to the use of N fertilizer in one of the treatments. Samples were collected between 8 and 10 a.m. Three individual samples were taken, after having fixed the chamber lids, at intervals of 0, 30, and 60 min. Whole samples were collected from 18 chambers (2 treatments and the forest x 6 chambers) for a total of 4,320 sampling events (18 chambers x 3 sampling times x 10 samplings x 4 seasons x 2 years). The analysis was realized in a Thermo Scientific™ TRACE™ 1310 GC with an automatic injector. The concentrations of CH4 and CO2 were defined with a flame ionization detector (FID) and the concentrations of N2O electron capture detector (ECD). External calibration was required to quantify the analytes. A calibration curve was generated with five different certified reference gas mixtures, each one containing SF6, CH4 + N2 balance with increasing quantities.
The gas increment for times (t0, t30, and t60) was calculated, considering the linear adjustment model and the molecular volume correction for the temperature inside the chamber (T) during sampling and using the formula (6) explained in the protocol suggested by Zanata et al. (43) and estimated the fluxes (F):
where ΔC Δt−1 represents the rate of change of the gas inside the chamber per unit of time (ppb/hour); M is the molecular weight (g); V and A are volume (L) and chamber area (m2), respectively; Vm is the molecular volume of the gas (L), corrected as a function of the temperature inside the chamber during sampling (1 mole of gas occupies 22.4 L under normal temperature and pressure conditions—CNTP), by multiplying 22.4 by (273 + T) / 273, with T being the average temperature inside the chamber in degrees Celsius.
Nitrous oxide and CH4 emissions from N fertilization and animal wastes (t CO2e..ha−1 per year) were calculated according to Equations 7, 8, and 9.
N2O emissions from N fertilization and animal wastes (t CO2e..ha−1 per year) = (annual average of emission N2O . ha−1 * GWP).(7)
CH4 emissions from N fertilization and animal wastes (t CO2e..ha−1 per year) = (annual average of emission CH4 . ha−1 * GWP).(8)
Annual average GHG emission from fertilization and animal wastes (t.ha−1 per year) = (daily spring average GHG emission*91.25 days) + (daily summer average GHG emission*91.25 days) + (daily autumn average GHG emission*91.25 days) + (daily winter average emission*91.25 days).(9)
Carbon balance was determined as the difference between the annual C accumulation rates of the grazing and the emissions of CO2e. derived from the dairy cattle production systems for 1 year (CH4 emissions from enteric fermentation, N2O and CH4 emissions from N fertilization and animal wastes), using AR6 – methodology (46) (GWP CH4=27.2, N2O=273) and the conversion factor of C to CO2e. = 3.67 (Equations 10 and 11).
CB (t of CO2e. /ha per year) = [(annual C accumulation rates 0-100 cm layers t.ha−1 * 3.67) – (annual emissions of CO2e. t.ha−1)].(10)
Annual emissions of CO2e. (t of CO2e..ha−1 per year) = (CH4 emissions from enteric fermentation + N2O emissions from N fertilization and animal wastes + CH4 emissions from N fertilization and animal wastes), using AR6 (46) (GWP CH4=27.2, N2O=273) and the conversion factor of C to CO2e. = 3.67(11)
The intensity of GHG emissions was calculated as the division between annual GHG emissions (t of CO2e..ha−1 per year) and the product output, FCPCmilk (kg.ha−1 per year).
The intensity of GHG removals was calculated as the division between annual C accumulation rates (t of CO2e..ha−1 per year) and the product output, FCCPmilk (kg.ha−1 per year).
The intensity of emission (CB emission intensity), considering the results of C balance, was calculated as the division between CB (t of CO2e..ha−1 per year) and the product output: stocking rate (cows.ha−1), milk (kg.ha−1 per year), FCPCmilk (kg.ha−1 per year), and ST (total solid; kg.ha−1 per year) of each treatment. The number of trees necessary to compensate the emissions of GHG from dairy cattle production systems was performed using these results.
Data from silvopastoral systems with Eucalyptus (333 trees. ha−1 during five first years and 166 trees. ha−1 over the next 3 years) in an additional experimental area located close to the area this study were collected in April 2016 and in April 2019. Forty trees (five years old) and 90 trees (8 years old), respectively, were utilized to define the wood volume and to acquire wood rings. Afterward, these samples were used to define biomass and C pools of the tree trunks. These findings were used to develop the Equations for the determination of stem volume and tree biomass. The Equations projected trunk volume at 215.2 m3 and trunk biomass at 98.9 t. ha−1 in the silvopastoral system. The diameter at the beginning and end of each segment and the segment mass were quantified. Afterward, a trunk sample (15 cm ring) was taken from each segment to establish the moisture content after oven drying at 60°C until constant weight. For these samples, density (ratio of dry mass to volume) and C content (by elemental Analyzer Perkin Elmer model CHNS 2400ii) were also defined (47).
Annual C sequestration potential rate for eucalyptus (CO2e..tree−1 per year) considered that 166 trees. ha−1 during 8 years and 167 during 5 years resulted in 98.9 t DM. ha−1 (215.2 m3 lumber) with 0.45 t C. t DM−1 that provided 75.6 kg CO2e.. tree−1 per year, according to Equation 12.
Annual C sequestration rate (kg CO2eq..tree−1) = ((98.9 t DM . ha−1 x 0.45 t C. t DM−1)/((8 years*166 trees) + (5 years*167 trees)))*3.67 *1000,(12)
where DM = dry mass.
This result was utilized to estimate the number of trees required to mitigate the GHG emissions of grazing production systems.
The “put and take” technique (25) using stocking rate adjustments was applied in all grazing systems, considering the forage availability of each paddock. The grasses' stubble height [30 cm for Panicum and 15 cm for Brachiaria, according to Costa (28)] was used as the method to adjust the pasture management. Annual average stocking rates were estimated for CLS and RHS pasture systems (20).
The land-saving effect of the intensified pasture system was calculated using equation 13, according to the methodology by Martha Jr. et al. (48):
RHS SR = Intensive management stocking rate (animals. ha−1).
CLS SR = Extensive management stocking rate (animals. ha−1).
To assess the forest productivity components, the following C sinks were evaluated: (a) above-ground biomass, within necromass; (b) under-ground biomass (roots); and (c) litter. The experimental plots were designed according to the Brazilian National Forest Inventory (NFI) (20).
The diameter at breast height (DBH), tree height, and crown diameter (based on their projection onto the soil) were logged to estimate the above-ground biomass. Allometric models were registered to estimate the seasonal semi-deciduous forest biomass (20).
Samples of litter deposited in the floor were collected with a metal frame, and subsamples were utilized for C and DM analyses to measure and characterize the litter pool (20).
Data were analyzed by the MIXED procedure of Statistical Analyses System (SAS) (49) after verifying for outliers and the residue normality by using the Shapiro–Wilk test (PROC UNIVARIATE, SAS Institute). For the analysis, among the 15 different covariance structures tested, the matrix that best fit to the data was chosen based on the lower corrected Akaike information criteria value (AICC) (50). The model included the effects of two types of pasture and two animals' genotypes and the interaction between pasture and genotypes (2 x 2). The Tukey test was used as the test to separate the means. The effect of periods and area replication was included in the model as random effect. The effects were considered significant at p ≤ 0.05.
The animal stocking differed in the treatments with an interaction between pasture and genotype (P = 0.0178), such that in the CLS system, the stoking rate did not vary according to the animal genotypes, but in the RHS system the stocking rate was higher (7.87 cows.ha−1) for the JE x HO crossbreed than for the purebred HO cows (6.85 cows.ha−1) (Table 2, Figure 2). Despite this difference in the stocking rate, the other variables related to productivity (milk yield, corrected milk yield, and total solids) did not vary as a function of genotypes (Table 2).
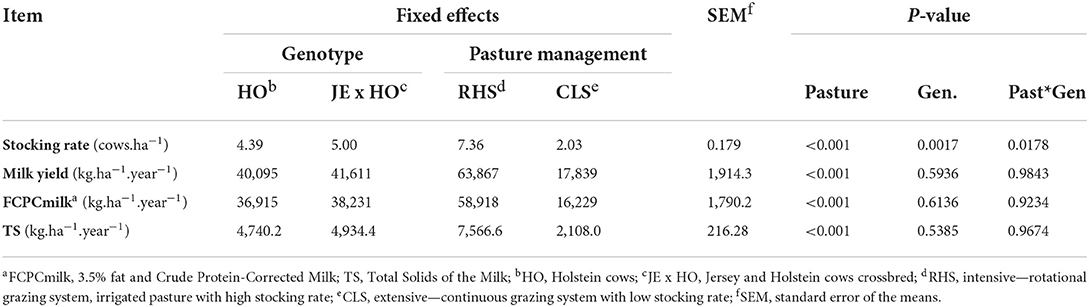
Table 2. Stocking rate, milk yield, and its components for two cow genotypes and two levels of intensification in grazing systems.
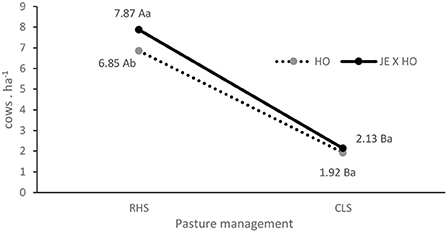
Figure 2. Interaction between two cow genotypes and two levels of intensification in grazing management systems for stocking rate. HO, Holstein cows; JE x HO, Jersey and Holstein cows crossbred; RHS, intensive—rotational grazing system, irrigated pasture with high stocking rate; CLS, extensive—continuous grazing system with low stocking rate. a − b;A − B, means followed by different uppercase letters to pasture and lowercase to genotype are significantly different (p ≤ 0.05).
The factor that most affected productivity was the intensification of pastures (P < 0.0001), which promoted an increase of more than 3.5 times in milk production, in FCPCmilk, and in total solids per hectare per year (Table 2). The CB, calculated as the difference between GHG emissions and GHG removals (Tables 3, 4), had a greater C deficit in RHS system compared with the CLS system (P < 0.0001), due to the higher GHG emissions (Table 3) and lower C removals (Table 4), resulting from a lower annual rate of C accumulation in RHS. Animal genotype did not influence GHG emissions (P = 0.3012) or the CB (P = 0.3207) of two production systems (Table 3).
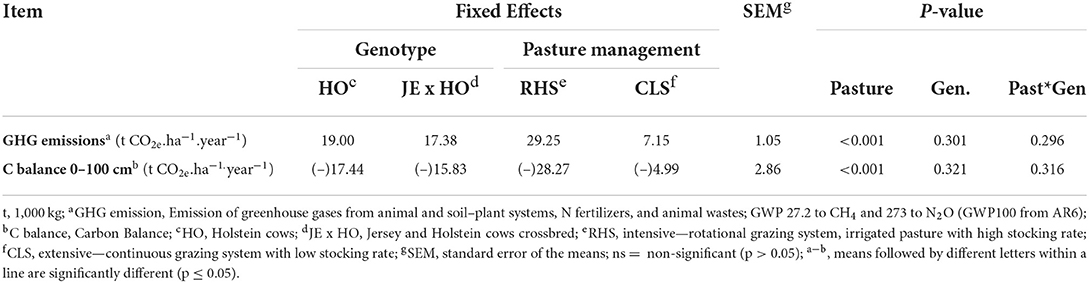
Table 3. Greenhouse gas emissions and carbon balance for two cow genotypes and two levels of intensification in grazing management systems—Atlantic Forest as reference area to calculate carbon stocks.
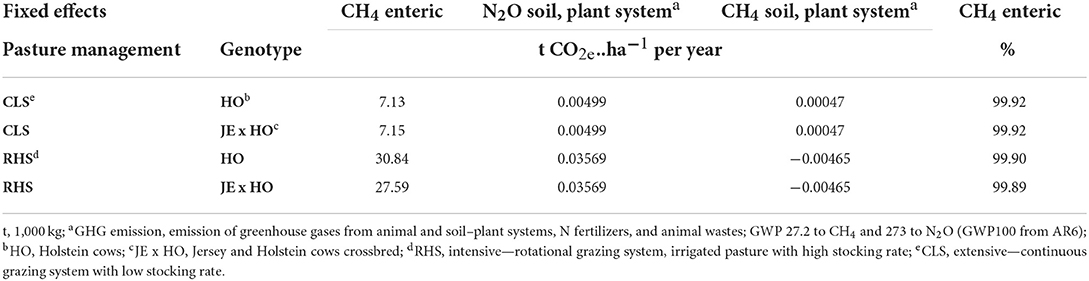
Table 3.1. Contribution of enteric CH4 and GHGs from the soil–plant system in the composition of GHG emissions for the interaction of two levels of intensification in grazing management systems and two cow genotypes.
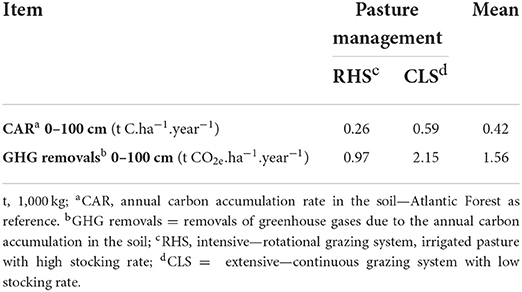
Table 4. Annual carbon accumulation rate in the soil and removals of greenhouse gases of two levels of intensification in grazing systems—Atlantic Forest as reference area to calculate carbon stocks.
The output comparison of both production systems showed that the pasture intensification enabled the land-saving phenomenon to occur and had a great contribution to the system. The stocking rate in CLS was 2.03 cows ha−1, while the RHS stocking rate was 7.36 cows ha−1. As a result, the intensified system had a land-saving effect of 2.64 ha. In other words, once it is possible to produce the same amount of milk in 1.0 ha of RHS as in 3.64 ha of CLS, the intensification adopted allows the reforestation of the remaining 2.64 ha in RHS (Table 2).
The C deficit in CB emission intensity per cow (P = 0.0552) and GHG emission intensity per FCPCmilk (P = 0.0355) was greater for HO purebred cows than for JE x HO crossbreed cows, but this difference was diluted when CB emission intensity was expressed by milk production (P = 0.4695), FCPCmilk (P = 0.4149), or TS (P = 0.4056), resulting in, this case, no difference between the genotypes (Tables 5, 6). This can be explained by a higher GHG removal intensity for HO purebred cows due to the lower product output per hectare, causing the ratio between the CAR/product output to be higher (Tables 2, 6).
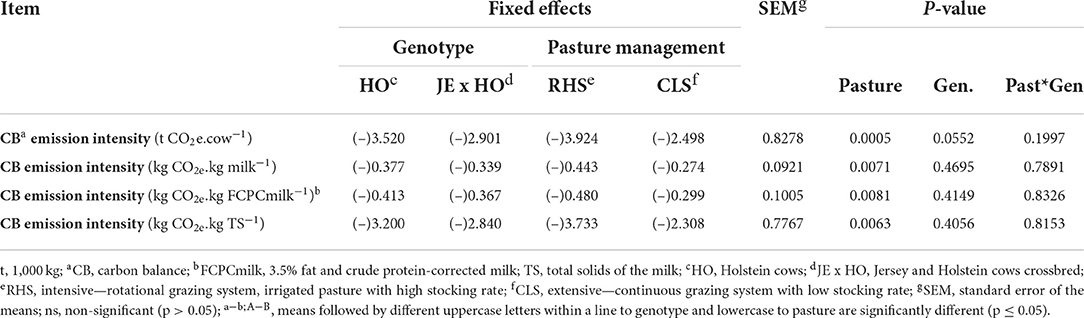
Table 5. Emission intensity of greenhouse gases (GHG) for two cow genotypes and two levels of intensification in grazing management systems considering the systems carbon balance.
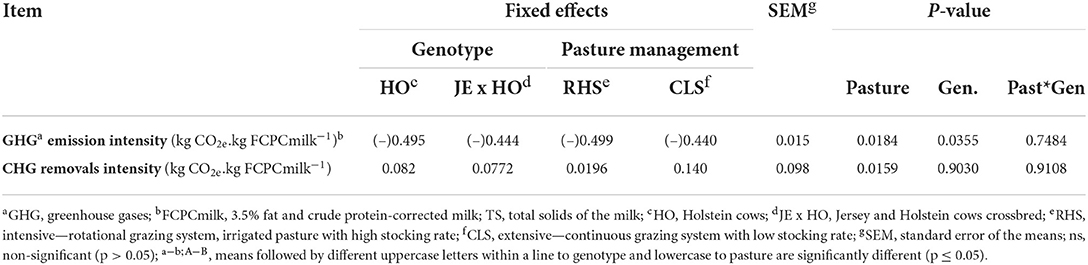
Table 6. Emissions and removal intensity of GHG per milk yield (FCPCmilk) for two cow genotypes and two levels of intensification in grazing systems.
The type of pastoral milk production system affected all CB emission intensity variables (P = 0.0005 to cow, P = 0.0071 to milk production, P = 0.0081 to FCPCmilk, and P = 0.0063 to TS), with the RHS system showing a greater C deficit for the CB emission intensity than the CLS system (Table 5).
To understand what influenced the results of the CB emission intensity of the different pastoral systems, the GHG emission intensity and the GHG removal intensity of FCPCmilk were calculated (Table 6). Although both GHG removals (0.14 to CLS higher than 0.02 to RHS kg CO2e.. kg−1 FCPCmilk) and GHG emissions (−0.49 to RHS higher than −0.44 to CLS kg CO2e.. kg−1 FPCmilk) contributed to the results in the GHG emission intensity of milk production (P=0.0184 and P = 0.0159, respectively), the greatest influence was due to the lower removals of GHG from RHS.
With the results of CB and emission intensity, the quantity of trees necessary to mitigate GHG emissions in dairy cattle production systems per cow and per ton of product output was calculated (Table 7). The RHS system required more trees to mitigate GHG emissions per cow (P = 0.0005) and per t FCPCmilk (P = 0.0081) than the CLS system (Table 7).
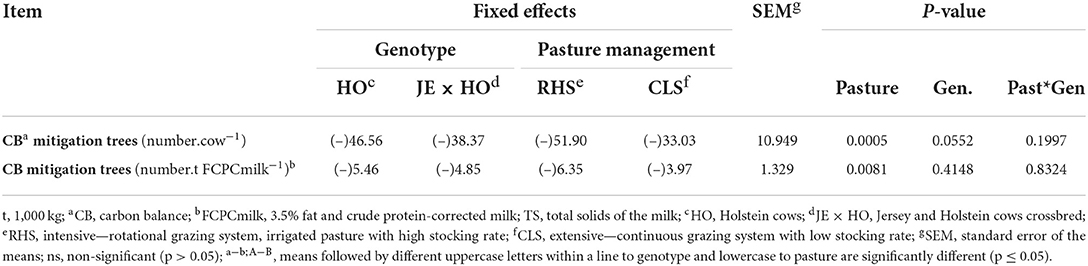
Table 7. Trees needed to mitigate GHG emissions for two cow genotypes and two levels of intensification in grazing systems considering the systems carbon balance.
The HO purebred cows required more trees (deficit of 46.56) than JE x HO crossbreed cows (deficit of 38.37) to mitigate GHG emissions intensity (P = 0.0552), but this difference did not occur when analyzed per product output (CB mitigation tress – number.t FCPCmilk−1) (Table 7). It followed the same pattern of results observed for CB emission intensity (kg CO2e.. kg FCPCmilk−1), in which GHG removals were diluted in lower milk production of HO purebred cows, favoring the C balance (Table 5).
The results obtained for annual milk production were higher than the Brazilian average for the south and southeast regions (1). In the case of the extensive system (CLS), the best result was due to the superior genetics of cows in the experimental herd in relation to cows from farms in these regions. In the case of the intensive systems (RHS), it was due to the superior pasture (fertilized tropical pasture irrigated and overseed with oats and ryegrass in the dry and cold season) and the superior genetics of cows. The Brazilian Atlantic Forest Biome is located mainly in the south, southeast, and northeast regions, but the main milk production area of this biome is concentrated in the south and southeast regions, where the average milk production per cow is 3,618 and 2,580 L. year−1, respectively (1). The annual averages in this experiment were 8,788 and 8,678 L.cow−1 in CLS and RHS, respectively.
Under environmental conditions similar to those observed in our study, Teixeira et al. (51) estimated an annual milk productivity of 19,000 kg. ha−1 for an intensively managed and irrigated pasture (Cynodon spp. Tifton 85) with a stocking rate of 4.6 AU ha−1 (AU = Animal Unit 450 kg live weight). Alvim et al. (52) observed annual milk productivity of 28,430 and 37,959 kg milk ha−1 for irrigated coast-cross (Cynodon dactylon) pasture systems in which the stocking rates were 4.5 and 5.1 cows ha−1 and average individual daily productions of 16.9 and 20.0 kg milk per cow. day−1 and concentrates were fed at the rate of 3.0 or 6.0 kg per cow. day−1, respectively. Considering the average genotypes in this trial, the higher milk productivity observed for the intensively managed pastures may be attributed to the association of two factors: the higher stocking rate obtained in the irrigated pastures (7.2 cows. ha−1) and the higher individual milk production presented by the cows (24.5 kg FCPCmilk per cow. day−1) associated, of course, with higher concentrate supplementation (8.1 kg per cow day−1). These same factors influenced the best results obtained for total solids.
According to Oliveira et al. (20), the RHS presented higher stocking rate (7.35 cows. ha−1) that resulted in 2.64 ha of land-saving effect; meanwhile, the CLS stocking rate was 2.02 cows. ha−1 (Table 2). This means that for each 3.64 ha of CLS, 1.0 ha of RHS could be adopted and 2.64 ha could be reforested. Within this area contribution, it is possible to preserve approximately 145 different native tree species, besides the maintenance of several Atlantic Forest fauna species. The vegetal biomass from this area was estimated in 220.5 Mg ha−1, in which the total biomass was multiplied by 0.475 factor, according to Magnussen et al. (53) to calculate the total C stock in this area (104.6 Mg ha−1).
The CB per area unit is relevant to identify sources and sinks of atmospheric CO2 in an effort to develop strategies to mitigate anthropogenic emissions of GHG per hectare. The intensity of emission by unit of the products generated in each system is also of great relevance because this provides a wider perspective of the production chain footprint, once the efficiency related to each product of different systems is considered. In this context, the best scenario is minimum GHG emission combined with maximum productivity, in other words, a lower GHG emission intensity.
The higher GHG emission in the RHS system was expected due to the significant increase in animal stocking rate (Table 3) and consequent increase in enteric CH4 emissions. The enteric CH4 had the greatest emission contribution, being above 99% share in the composition of all emissions measured in each treatment (Table 3.1). An increase in C sequestration was expected in the more intensified and irrigated pastures, which did not occur (Table 4), leading to a greater deficit of C.
Most of the experiment findings related to GHG emission intensity and CB corroborated with the results of recent research papers (5, 6, 12, 13, 54). Cunha et al. (5) did an inventory of GHG emission on two Brazilian farms from Southeast region, Minas Gerais State, with different characteristics: farm 1—intensive (using semi-confined animal full time), and farm 2—semi-intensive production system (using pasture exclusive and silvopastoral systems, during rainy season; and sugar cane and corn silage supplementary forage, during dry season). The two farms used concentrate supplementation. The emissions (enteric CH4, animal wastes, N fertilization, oil, and electrical use) from intensive and semi-intensive production systems were 3.21 and 3.18 t CO2e.animal−1.yr−1, respectively. In this experiment, the results were similar, RHS presented 3.97 t CO2e.cow−1.yr−1, and the CLS, more extensive system, presented 3.52 t CO2e.animal−1.yr−1 (Tables 2, 3).
In several experiments involving livestock, the majority of GHG emissions originated from CH4 enteric fermentation. Cunha et al. (5) reported 67.1 to 71.4% of GHG emission from enteric fermentation, and they were of similar proportions on both farms evaluated by them. Lovett et al. (12), while working with dairy cattle and grazing systems in Ireland, observed that regardless of location, enteric CH4 production was the greatest single source of on-farm GHG emissions. The location affected the relative source strength (58 to 63%). In this experiment, as the N fertilization and oil and electrical use were not accounted, the enteric fermentation contributed with more than 99% of GHG emission (Table 3.1).
The C deficit in CB emission intensity per cow and GHG emission intensity per FCPCmilk was greater for HO purebred cows than for JE x HO crossbreed cows, but this difference was diluted when CB emission intensity was expressed by milk production, FCPCmilk, or TS. Congio et al. (15), evaluating crossbreeding as strategies to reduce CH4 mitigation, in a meta-analysis, observed that increase in milk yield of F1 Holstein × Gyr was linked to a reduction in CH4 per milk yield, while this was not the case for purebred Holstein. Pedreira et al. (13) also observed that Holstein cows produced more CH4 (299.3 g day−1) than the crossbred (264.2 g day−1). It can be speculated that diets from Latin America and Caribbean dairy systems, usually with lower energy content than typical dairy confinement diets from the USA, for example, may have restricted the potential of Holstein cows under such conditions, and privileged crossbreeds and more locally adapted cows (15).
The type of pastoral milk production system affected all CB emission intensity variables, with the RHS system showing a greater C deficit for the CB emission intensity than the CLS system (Table 5). The values found in this experiment were lower than those of Famiglietti et al. (6), which evaluated the C footprint of Grana Padano PDO cheese. Three Italian farms differing in herd size, housing systems, milk yield (kg milk cow−1 day−1), manure management systems, home-grown crops, and type and amount of production inputs found different direct on-farm GHG emission intensities, ranging from 0.57 to 0.80 kg CO2e.kg FCPCmilk−1. The emission intensity was also lower than the direct on-farm observed for the intensive farm (0.782 kg CO2e.. L milk) and semi-intensive farm (0.974 kg CO2e.. L milk) in Minas Gerais, Southeast region of Brazil (5).
In this trial, the enteric CH4 was associated with improvement in the stocking rate of the pasture intensification (Tables 2–3.1), as the stocking rate increased, the enteric CH4 emission obviously increased as well. It was possible to observe a response pattern as a function of levels of intensification in dairy systems—more GHG emission to intensive systems and majority of CH4 emissions originated from enteric fermentation. Then, in the context of the GHG emissions of pasture-based dairy production systems, reducing the enteric emission of CH4 emissions per animal is very important to ensure the intensification of grazing systems and concomitantly reduce GHG emissions, but this action can be carried out to a certain extent, even more in systems that use tropical pastures, which have lower quality compared to temperate pastures. However, management actions to improve the quality of tropical pastures should be thoroughly studied. Congio et al. (14), in a study in the Southeast region of Brazil, reported that CH4 emission per kg of milk was reduced by 21% with grazing strategies modifying the sward structure and improving the nutritive value of the forage.
The amount of GHG emissions originated from enteric fermentation in livestock production systems justifies the recent concern of the scientific community related to strategies to mitigate the emission of enteric CH4. Meta-analysis by Congio et al. (15), for the Latin America and Caribbean, and Arndt et al. (16), using global data, selected the best technologies to reduce the emission of CH4 and, at the same time, maintain or increase the animal performance, divided in three main categories: animal breeding, dietary manipulation, and rumen manipulation. However, these technologies have the potential to reduce enteric CH4 only by 10 to 30%, which is still not sufficient to meet international goals to reduce GHG emissions (Global Methane Pledge). This led the researchers into a new challenge of finding actions to complementarily mitigate the GHG emissions of livestock production systems.
In this scenario, soil C sequestration is an option to be considered. Grasslands can act as a significant C sink with the implementation of improved management (55). Various studies observed that C sequestration can be increased by adequate management practices such as rotational grazing and the use of appropriate carrying capacity (17–20, 56).
Hammar et al. (54), in Sweden, used a life cycle perspective to assess the climate impact of beef production and a modeling to calculate the C sequestration in soil and the potential offset enteric CH4 emissions. It showed an average C sequestration rate of 0.2 t C ha−1 and yr−1, so C sequestration could potentially offset 15–22% of GHG emissions from beef cattle production (enteric fermentation, feed production, and manure management), depending on system boundaries and production intensity (54). In another meta-analysis by Conant et al. (55), the results from 115 studies containing over 300 data points were analyzed. It concluded that the management improvements contributing to C sequestration were fertilization (0.30 t C ha−1. yr−1), improved grazing management (0.35 t C ha−1. yr−1), conversion from cultivation to pasture (1.01 t C ha−1. yr−1), conversion from native vegetation to pasture (0.35 t C ha−1. yr−1), sowing of legumes (0.75 t C ha−1. yr−1), improved grasses species (3.04 t C ha−1. yr−1), earthworm introduction (2.35 t C ha−1. yr−1), and irrigation (0.11 t C ha−1. yr−1), with a mean of 0.54 t C ha−1. yr−1; the results were highly influenced by biome type and climate (55). However, Oliveira et al. (19) observed negative annual C accumulation rate to irrigated intensified beef cattle system (-0.81 t C ha−1. yr−1).
This trial used the annual C accumulation rate observed by Oliveira et al. (20), as 0.26 and 0.59 t C ha−1 per year−1 to RHS and CLS systems (depth 0–100 cm), respectively. Although the C sequestration results in RHS were not the highest, they were better than those reported by Conant et al. (55) and Oliveira et al. (19) to irrigated grazing systems. But even so, they were not enough to offset all GHG emissions from the evaluated production systems. In this trial, although both GHG removals and GHG emissions contributed to the results in the GHG emission intensity of milk production, the greatest influence was due to the lower removals of GHG from RHS, reinforcing the fact that annual C accumulation rate was still not enough to remove the aimed GHG emissions from the evaluated production systems (Tables 3–5).
Considering that (1) enteric CH4 emission is the one that contributes more to the intensity of GHG emissions; (2) two recent and important meta-analyses (15, 16) evaluating PB (increasing feeding level, decreasing grass maturity, and decreasing dietary forage-to-concentrate ratio) and ABS strategies (CH4 inhibitors, tanniferous forages, electron sinks, oils and fats, and oilseeds) found a maximum potential of 35% reduction in enteric CH4 emissions; 3. annual soil C accumulation rate was still not enough to offset all GHG emissions, more alternative approaches are necessary to mitigate GHG emissions of milk chain.
In addition, Arndt et al. (16) related that globally, only if 100% of farms adopt the most effective PB and ABS strategies, it is possible to avoid the increase of 1.5°C in the average global temperature by 2030 but not 2050, because mitigation effects are offset by projected increases in CH4 due to increasing milk and meat demand. Notably, by 2030 and 2050, low- and middle-income countries may not meet their contribution to the 1.5 °C target for this same reason, whereas high-income countries could meet their contributions due to only a minor projected increase in enteric CH4 emissions.
Brazil, as middle-income country and the third largest milk producer in the world, needs to provide other alternatives to offset GHG emissions. The introduction of trees in the dairy systems can be an alternative strategy. We calculated that 3.97 to 6.35 trees per t FCPCmilk−1 and 33.0 to 51.9 trees per cow (Table 7) are necessary to mitigate deficit on farm gate C balance (Table 3).
According to Oliveira et al. (19), who calculated the number of trees needed to compensate GHG emission of pasture-based beef cattle, considering the C balance within the farm gate, the trees must be growing while the animals are being raised and estimates have been annualized. When animals are slaughtered, they can be replaced, and new animals can benefit from emissions mitigation from the annual development rate and accumulation of C in the trunks of the eucalyptus trees (19). In a similar condition, the C being accumulated in trees can be used for pasture-based dairy systems.
The trees can be inserted in the farm as a separated tree plantation, or as integrated system (livestock and forest), according to Oliveira et al. (19). In integrated systems, the trees would bring in a new set of dynamics; they would have an effect on pasture production, herbage growth rates in response to N applied, soil moisture, animal performance, and animal comfort, among other typical aspects of integrated production systems (19).
In addition, after cutting the trees, when they are transformed into harvest wood products (HWP), they do not instantly emit all the C stored in their products but have a decay according to the type of wood products use (46), and this value is not being computed in most CBs for livestock that use trees on their farms. To better understand the use of trees to offset GHG emission, it would be important to study the CB until finding an equilibrium scenario between GHG emissions of grazing-based livestock and the sequestration of C from the growth of commercial forests in farms in addition to the products made with the wood from these forests after cutting the trees (using Guidelines for National Greenhouse Gas Inventories—HWP, IPCC (46). It is worth pointing out that with each cut of the commercial forest with exotic species on the farms (Eucalyptus and Pinus mainly), usually the area is renewed in the Southeastern region of Brazil, by long-term economic interests and as a way of diversifying income.
Although the CB and GHG emission intensity observed in this trial is better than other results reported in the literature, it is still necessary to adopt other complementary GHG mitigation strategies. Due to the reservation of the pasture-based dairy systems in increasing soil C sequestration to offset the GHG emissions, especially enteric CH4, planting trees can be used as a mitigation strategy. Also, the land-save effect of intensified areas can contribute to the issue, since the portion spared through the intensification in pasture management becomes available for reforestation with commercial trees.
The raw data supporting the conclusions of this article will be made available by the authors, without unduereservation.
The animal study was reviewed and approved by Project No. 05/2016 is in accordance with the precepts of Law No. 11,794, of 8 October 2008, Decree No. 6,899, of 15 July 2009, and the rules issued by the National Council for the Control of Animal Experimentation, and was approved by the Ethics Committee on the use of Animals of Embrapa.
PO, AB, and AP contributed to conception and design of the study. PO, TA, and AL organized the database. PR and BO performed the statistical analysis. PO wrote the first draft of the manuscript. JP wrote sections of the manuscript. All authors contributed to manuscript revision, read, and approved the submitted version.
The authors would like to thank EMBRAPA for financing Pecus network (01.10.06.0001.05.00), CNPq for the financial support to the project 562861/2010-6, FAPESP for the financial support to the project 2017/20084-5, and CAPES x EMBRAPA (15/2014) for the scholarship and financial support to the project.
The authors declare that the research was conducted in the absence of any commercial or financial relationships that could be construed as a potential conflict of interest.
All claims expressed in this article are solely those of the authors and do not necessarily represent those of their affiliated organizations, or those of the publisher, the editors and the reviewers. Any product that may be evaluated in this article, or claim that may be made by its manufacturer, is not guaranteed or endorsed by the publisher.
1. IBGE - Instituto Brasileiro de Geografia e Estatística. Produção da Pecuária Municipal. (2020). Available online at: https://www.ibge.gov.br/busca.html?searchword=Vacas$+$ordenhadas$+$; Tabela 74: https://www.ibge.gov.br/busca.html?searchword=Produ%C3%A7%C3%A3o$+$de$+$origem$+$animal%2C$+$por$+$tipo$+$de$+$produto$+$ (accessed August 01, 2022).
2. Ministério da Agricultura Pecuária e Abastecimento. Mapa do Leite. (2022). Available online at: https://www.gov.br/agricultura/pt-br/assuntos/producao-animal/mapa-do-leite#:$\sim$:text=O%20Brasil%20%C3%A9%20o%20terceiro%20maior%20produtor%20mundial,propriedades%2C%20empregando%20perto%20de%204%20milh%C3%B5es%20de%20pessoas (accessed May 25, 2022).
3. Honigmann S. Carta Leite - A Balança Comercial De Lácteos Em 2021 Foi A Melhor Dos Últimos Seis Anos. (2021). Available online at: https://www.scotconsultoria.com.br/noticias/cartas/55041/carta-leite–a-balan%C3%A7a-comercial-de-l%C3%A1cteos-em-2021-foi-a-melhor-dos-%C3%BAltimos-seis-anos.htm (accessed May, 25, 2022).
4. Ravaglia P, Famiglietti J, Valentino F. Certification and added value for farm productions. In: Bryant S, editor. Sustainable Use of Chemicals in Agriculture - Advances in Chemical, Pollution, Environmental, Management, and Protection. Cambridge, MA: ScienceDirect (2018). p. 63–108.
5. Cunha CS, Lopes NL, Veloso CM, Jacovine LAG, Tomich TR, Pereira LGR, et al. Greenhouse gases inventory and carbon balance of two dairy systems obtained from two methane-estimation methods. Sci Total Environ. (2016) 744:754. doi: 10.1016/j.scitotenv.2016.07.046
6. Famiglietti J, Guerci M, Proserpio C, Ravaglia P, Motta M. Development and testing of the product environmental footprint milk tool: a comprehensive LCA tool for dairy products. Sci Total Environ. (2019) 648:1614–26. doi: 10.1016/j.scitotenv.2018.08.142
7. Franchi GA, Garcia PR, Silva IJO. Welfare quality applied to the Brazilian dairy cattle. J Anim Behav Biometeorol. (2014) 2:60–5. doi: 10.14269/2318-1265.v02n02a04
8. Ministério da Ciência Tecnologia e Inovações. Inventário Nacional de Emissões e Remoções de Gases de Efeito Estufa (GEE) da Quarta Comunicação Nacional do Brasil – Emissões por subsetor. Emissões de GEE por Subsetor — Português (Brasil) (2021). Available online at: www.gov.br (acessed August 02, 2022).
9. EMBRAPA - Brazilian Agricultural Research, Corporation. ABC Sector Plan – Sector Plan for Mitigation Adaptation to Climate Change for the Consolidation of a Low-Carbon Economy in Agriculture. (2022). Available online at: https://www.embrapa.br/en/tema-agricultura-de-baixo-carbono/sobre-o-tema (accessed May 30, 2022).
10. Ministério da Agricultura Pecuária e Abastecimento. Plano ABC+. (2021). Available online at: https://www.gov.br/agricultura/pt-br/assuntos/sustentabilidade/plano-abc/arquivo-publicacoes-plano-abc/abc-english.pdf/view (accessed May 25, 2022).
11. Global Methane Pledge. About the Global Methane Pledge. (2021). Available online at: https://www.globalmethanepledge.org/#about (accessed May 25, 2022).
12. Lovett DK, Shalloo L, Dillon P, O'Mara FP. Greenhouse gas emissions from pastoral based dairying systems: the effect of uncertainty and management change under two contrasting production systems. Livest Sci. (2008) 116:260–74. doi: 10.1016/j.livsci.2007.10.016
13. Pedreira MS, Primavesi O, Lima MA, Frighetto R, Oliveira SG, Berchielli TT, et al. Ruminal methane emission by dairy cattle in Southeast Brazil. Sci Agric. (2009) 66:742–50. doi: 10.1590/S0103-90162009000600004
14. Congio GFS, Batalha CDA, Chiavegato MB, Berndt A, Oliveira PPA, Frighetto RTS, et al. Strategic grazing management towards sustainable intensification at tropical pasture-based dairy systems. Sci Total Environ. (2018) 636:872–80. doi: 10.1016/j.scitotenv.2018.04.301
15. Congio GFS, Bannink A, Mogollon OLM, Latin America Methane Project Collaborators. Enteric methane mitigation strategies for ruminant livestock systems in the Latin, America and Caribbean region: a meta-analysis. J Clean. (2021) 312:127693. doi: 10.1016/j.jclepro.2021.127693
16. Arndt C, Hristov AN, Price WJ, McClelland SC, Pelaez AM, Cueva SF, et al. Full adoption of the most effective strategies to mitigate methane emissions by ruminants can help meet the 1.5 °C target by 2030 but not 2050. PNAS. (2022) 119:e2111294119. doi: 10.1073/pnas.2111294119
17. O'Mara FP. The role of grasslands in food security and climate change. Ann Bot. (2012) 110:1263–70. doi: 10.1093/aob/mcs209
18. Segnini A, Xavier AAP, Otaviani Junior PL, Oliveira PPA, Pedroso AF, Praes MFFM, et al. Soil carbon stock and humification in pastures under different levels of intensification in Brazil. Sci Agric. (2019) 76:33–40. doi: 10.1590/1678-992x-2017-0131
19. Oliveira PPA, Berndt A, Pedroso AF, Alves TC, Pezzopane JRM, Sakamoto LS, et al. Greenhouse gas balance and carbon footprint of pasture-based beef cattle production systems in the tropical region (Atlantic Forest biome). Animal. (2020) 1:11. doi: 10.1017/S1751731120001822
20. Oliveira PPA, Rodrigues PHM, Praes MFFM, Pedroso AF, Oliveira BA, Sperança MA, et al. Soil carbon dynamics in Brazilian Atlantic Forest converted into pasture-based dairy production systems. Agron J. (2021) 1:14. doi: 10.1002/agj2.20578
21. Rolim GDS, Camargo MBPD, Lania DG, Moraes JFLD. Climatic classification of Köppen and Thornthwaite systems and their applicability in the determination of agroclimatic zonning for the state of São Paulo, Brazil. Bragantia. (2007) 66:711–20. doi: 10.1590/S0006-87052007000400022
22. IBGE- Instituto Brasileiro de Geografia e Estatística. Mapa de vegetação do Brasil. (1993). Available online at: http://mapas.sosma.org.br/ (accessed May 31, 2022).
23. Raij B Van, Quaggio JÁ, Cantarella H, Abreu CA. Interpretação de resultados de análise de solo. In: Raij B Van, Cantarella H, Quaggio JA, Furlani AMC, editors. Recomendações de Adubação e Calagem Para o Estado de São Paulo. Campinas: Instituto Agronômico (1996). p. 8–13.
24. Rassini JB. Water management of irrigation for alfalfa in a Red-Yellow Latosol (Hapludox). Pesqui Agropecu Bras. (2002) 37:503–7. doi: 10.1590/S0100-204X2002000400012
25. Mott GO, Lucas HL. The design conduct and interpretation of grazing trials on cultivated and improved pastures. In: International Grassland. Pennsylvania, PA: Congress. State College Press (1952). p. 1380.
26. Petersen RG, Lucas HL. Computing methods for the evaluation of pastures by means of animal response. Agron J. (1968) 60:682–7. doi: 10.2134/agronj1968.00021962006000060031x
27. Petersen R. Agricultural Field Experiments: Design and Analysis. Boca Raton, FL: CRC Press (1994). p. 301–2.
28. Costa JAA. Pasture ruler. Technical Report (125th ed., pp. 1–7). (2013). Available online at: https://www.infoteca.cnptia.embrapa.br/infoteca/bitstream/doc/1077406/1/Reguademanejodepastagens.pdf (accessed May 31, 2022).
29. NRC National Research Council, Nutrient Nutrient Requirements of Dairy Cattle. Washington, DC: National Academy Press (2001).
30. AOAC and Association of official analytical chemists. Official Methods of Analysis. 11th Ed. Arlington, TX: AOAC (1990).
31. TUT PC. 005 - Tutorial de Acesso ao Portal da Clínica do Leite. Piracicaba: ESALQ - and USP (2015).
32. Fernandes F, Fernandes AHBM, Alves BJR, Bayer C, Boddey RM, Oliveira PPA. Protocolo Para Quantificação Dos Estoques De Carbono Do Solo da Rede de Pesquisa Pecus. (2014). Available online at: http://ainfo.cnptia.embrapa.br/digital/bitstream/item/117416/1/Documentos116.pdf (accessed May 31, 2022).
33. Embrapa - Centro Nacional de Pesquisa de Solos. Manual de Métodos de Análise de solo Embrapa Soil. 2nd ed. Rio de Janeiro: Embrapa Soil (1997).
34. Arnold SL, Schepers JSA. simple roller-mill grinding procedure for plant and soil samples. Commun Soil Sci Plant Anal. (2004) 35:537–45. doi: 10.1081/CSS-120029730
35. Ellert BH, Bettany JR. Calculation of organic matter and nutrients stored in soils under contrasting management regimes. Can J Soil Sci. (1995) 75:529–38. doi: 10.4141/cjss95-075
36. Sisti CPJ, Santos HP, Kohhann R, Alves BJR, Urquiaga S, Boddey RM, et al. Change in carbon and nitrogen stocks in soil under 13 years of conventional or zero tillage in southern Brazil. Soil Tillage Res. (2004) 76:39–58. doi: 10.1016/j.still.2003.08.007
37. Veldkamp E. Organic carbon turnover in three tropical soils under pasture after deforestation. Soil Sci Soc Am J. (1994) 58:175–80. doi: 10.2136/sssaj1994.03615995005800010025x
38. Alves LA, Denardina LG, de O Martins, Bayer C, Veloso MG, Bremm C, et al. The effect of crop rotation and sheep grazing management on plant production and soil C and N stocks in a long-term integrated crop-livestock system in Southern Brazil. Soil Tillage Res. (2020) 203:104678. doi: 10.1016/j.still.2020.104678
39. Johnson KA, Johnson DE. Methane emission from cattle. J Anim Sci. (1995) 73:2483–92. doi: 10.2527/1995.7382483x
40. Berndt A, Boland T, Deighton MH, Gere JI, Grainger C, Hegarty RS, et al. Guidelines for Use of Sulphur Hexafluoride (SF6) Tracer Technique to Measure Enteric Methane Emissions From Ruminants. New Zeland: New Zealand Agricultural Greenhouse Gas Research Center (2014).
41. Boadi DA, Wittenberg K. Methane production from dairy and beef heifers fed farages differing in nutrient density using the sulphur hexafluoride (SF6) trace gas technique. Can J Anim Sci. (2002) 82:201–6. doi: 10.4141/A01-017
42. Pinares-Patiño CS, Clark H. Reliability of the súlfur hexafluoride tracer technique for methane emission measurement from individual animals: an overview. Can J Anim Sci. (2008) 48:223–9. doi: 10.1071/EA07297
43. Zanata JA, Alves BJ, Bayer C, Tomazi M, Fernandes AHBM, Costa FS, et al. Protocolo Para Medição De Fluxos De Gases De Efeito Estufa Do Solo. (2014). Available online at: http://ainfo.cnptia.embrapa.br/digital/bitstream/item/123470/1/Doc.-265-Protocolo-Josileia.pdf (accessed May 31, 2022).
44. Parkin TB, Venterea RT, USDA- ARS. GRACEnet Project Protocols: Chamber-Based Trace Gas Flux Measurements. Fort Collins: USDA-ARS 39 (2010).
45. Gusmão MR, Alves TC, Lemes AP, Bettiol GM, Pedroso AF, Barioni Junior W, et al. Sodium fluorescein as an internal tracer on the location of bovine urine patches in pastures. Grass Forage Sci. (2015) 71:305–14. doi: 10.1111/gfs.12182
46. IPPC– Intergovernmental Panel on Climate Change. Harvest wood products. In: Pingoud K, Skog KE, Martino DL, Tonosaki, M, Xiaoquan, Z. Guidelines for National Greenhouse Gas Inventories. Hayama, Japan: IGES (2006). p. 33.
47. Pezzopane JRM, Bosi C, Bernardi AC, de C Muller MD, Oliveira PPA. Managing eucalyptus trees in agroforestry systems: productivity parameters and PAR transmittance. Agric Ecosyst Environ. (2021) 312:107350. doi: 10.1016/j.agee.2021.107350
48. Martha Jr GB, Alves E, Contini E. Land-saving approaches and beef production growth in Brazil. Agric. Syst. (2012) 110:173–7. doi: 10.1016/j.agsy.2012.03.001
49. Statistical Analyses System Institute [SAS]. Guide of Personal Computers. Version 9.2. Cary: SAS Institute (2002)
50. Wang LA, Goonewardene Z. The use of MIXED models in the analysis of animal experiments with repeated measures data. Can J Anim Sci. (2004) 84:1–11. doi: 10.4141/A03-123
51. Teixeira NM, Freitas AF, Barra RB. Environmental factors influencing monthly variation of milk composition and somatic cell counts in herds of the State of Minas Gerais. Arq Bras Med Vet Zootec. (2003) 55:491–9. doi: 10.1590/S0102-09352003000400016
52. Alvim MJ, Vilela D, Lopes RS. Efeito de dois níveis de concentrado sobre a produção de leite de vacas da raça Holandesa em pastagem de coastcross. Rev Bras de Zootec. (1997) 26:967–75.
53. Magnussen S, Reed D. Modelling for Estimation and Monitoring. (2004). Available online at: https://www.fao.org/fileadmin/user_upload/national_forest_assessment/images/PDFs/English/KR2_EN__10_.pdf (accessed September 12, 2022).
54. Hammar T, Hansson P, Röös H. Time-dependent climate impact of beef production – can carbon sequestration in soil offset enteric methane emissions? J Clean. (2022) 331:129948. doi: 10.1016/j.jclepro.2021.129948
55. Conant RT, Paustian K, Elliott ET. Grassland management and conversion into grassland: effects on soil carbon. Ecol Appl. (2001) 11:343–55. doi: 10.1890/1051-0761(2001)011[0343:GMACIG]2.0.CO;2
Keywords: GHG emission intensity, carbon sequestration, enteric methane emission, eucalyptus, Nitrous oxide emission, mitigation GHG emissions
Citation: Oliveira PPA, Berndt A, Pedroso AdF, Alves TC, Lemes AP, Oliveira BA, Pezzopane JRM and Rodrigues PHM (2022) Greenhouse gas balance and mitigation of pasture-based dairy production systems in the Brazilian Atlantic Forest Biome. Front. Vet. Sci. 9:958751. doi: 10.3389/fvets.2022.958751
Received: 01 June 2022; Accepted: 26 August 2022;
Published: 23 September 2022.
Edited by:
Paulo M. T. Lima, University of São Paulo, BrazilReviewed by:
Jayakrishnan Nair, Southern Illinois University Carbondale, United StatesCopyright © 2022 Oliveira, Berndt, Pedroso, Alves, Lemes, Oliveira, Pezzopane and Rodrigues. This is an open-access article distributed under the terms of the Creative Commons Attribution License (CC BY). The use, distribution or reproduction in other forums is permitted, provided the original author(s) and the copyright owner(s) are credited and that the original publication in this journal is cited, in accordance with accepted academic practice. No use, distribution or reproduction is permitted which does not comply with these terms.
*Correspondence: Patrícia Perondi Anchão Oliveira, cGF0cmljaWEuYW5jaGFvLW9saXZlaXJhQGVtYnJhcGEuYnI=
Disclaimer: All claims expressed in this article are solely those of the authors and do not necessarily represent those of their affiliated organizations, or those of the publisher, the editors and the reviewers. Any product that may be evaluated in this article or claim that may be made by its manufacturer is not guaranteed or endorsed by the publisher.
Research integrity at Frontiers
Learn more about the work of our research integrity team to safeguard the quality of each article we publish.