 Dinesh H. Wellawa
 Po-King S. Lam1
 Aaron P. White
 Wolfgang Köster
95% of researchers rate our articles as excellent or good
Learn more about the work of our research integrity team to safeguard the quality of each article we publish.
Find out more
ORIGINAL RESEARCH article
Front. Vet. Sci. , 02 August 2022
Sec. Veterinary Infectious Diseases
Volume 9 - 2022 | https://doi.org/10.3389/fvets.2022.948448
This article is part of the Research Topic Bacterial Diseases In Poultry: Biology, Virulence And Prevention In The Age Of Reduced Antibiotic Use View all 9 articles
The light emitting module lux operon (luxCDABE) of Photorhabdus luminescens can be integrated into a “dark” bacterium for expression under a suitable promoter. The technique has been used to monitor kinetics of infection, e.g., by studying gene expression in Salmonella using mouse models in vivo and ex vivo. Here, we applied the bioluminescence imaging (BLI) technique to track Salmonella Enteritidis (SEn) strains carrying the lux operon expressed under a constitutive promoter sequence (sigma 70) in chicken after oral challenge. Detectable photon signals were localized in the crop, small intestine, cecum, and yolk sac in orally gavaged birds. The level of colonization was determined by quantification of signal intensity and SEn prevalence in the cecum and yolk sac. Furthermore, an isogenic SEn mutant strain tagged with the lux operon allowed for us to assess virulence determinants regarding their role in colonization of the cecum and yolk sac. Interestingly, mutations of SPI-1(Salmonella Pathogenicity Island 1) and fur (ferric uptake regulator) showed significantly decreased colonization in yolk sac that was correlated with the BLI data. A similar trend was detected in a ΔtonB strain by analyzing enrichment culture data. The inherently low quantum yield, light scattering, and absorption by tissues did not facilitate detection of signals from live birds. However, the detection limit of lux operon has the potential to be improved by resonance energy transfer to a secondary molecule. As a proof-of-concept, we were able to show that sensitization of a fluorescent-bound molecule known as the lumazine protein (LumP) improved the limit of detection to a certain extent.
Photons emitted during a bioluminescent reaction can be captured with a cooled charged coupled device (CCD) camera and converted into an electron charge. The recorded electrical charge pattern is then utilized to generate an image. This is the basis of a bioluminescent imaging (BLI) system to detect the light source generated within a tissue. The light-emitting module of bacterial origin, luxCDABE, encodes all enzymes needed to produce signals and is advantageous because no reagents are needed to be injected during imaging (1). Also, the expression of the lux operon allows for monitoring of the kinetics of most prokaryotic infection processes. The light-emitting reaction is catalyzed by the enzyme luciferase encoded by luxAB. In the presence of molecular oxygen, luciferase catalyzes the oxidation of a long chain aldehyde (luciferin) into an aliphatic carboxylic acid using FMNH2 (reduced flavin mononucleotide) as a cofactor (2). During the oxidation process, substrates form excited intermediate compounds and release photons in a broad spectrum (490 nm maximum) with a low quantum yield (<1; Figure 1) (3). The key substrate in the reaction, aliphatic aldehyde, is supplied and recycled in the bioluminescent reaction by fatty acid reductase systems encoded by luxCDE. FMNH2, is considered as abundant since bacteria encodes for de novo synthesis of riboflavin (vitamin B2), which is the precursor for flavin compounds (4). Hence, the rate-limiting step of the light emitting reaction catalyzed by bacterial luciferase is molecular oxygen. The first detailed feasibility of BLI to track bacterial infection was described by Contag et al. (5) using mice infected with Salmonella Typhimurium (STm) strains expressing the lux operon from Photorhabdus luminescens. Live imaging of mice up to 8 days revealed that the bioluminescent signal was localized in the cecum, suggesting that STm persistently infected the cecum after oral gavage. Furthermore, the study revealed that oxygen is a limiting factor to generate bioluminescence in the gastrointestinal environment because it is more anaerobic (5). To our knowledge, a similar kinetic analysis using Salmonella serovars during gastrointestinal infection in chicken has not been published.
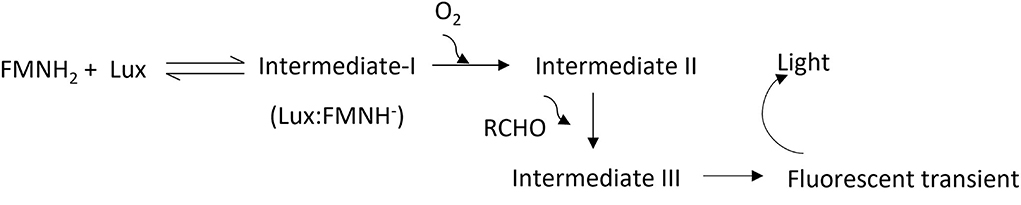
Figure 1. Proposed light-emitting reaction. Intermediates; I, II, and III are produced during the engagement of bacterial luciferase (Lux) with flavin, oxygen, and aldehydes. A florescent transient is produced during the degradation of intermediates and believed to be excited by other high-energy intermediates during degradation of intermediate III. FMNH2: reduced riboflavin phosphate, and RCHO: aliphatic aldehyde.
Chicken (Gallus gallus domesticus) is a reservoir host for non-typhoidal Salmonella (NTS) serovars and responsible for most food-borne human salmonellosis globally (6). The Salmonella enterica subspecies enteric serovar Enteritidis (SEn) has become one of the most dominant serovars in poultry (different phage type exists) on most continents including America, Europe, Africa, and Asia. There are number of genetic traits of SEn governed by pseudogenization of metabolic pathways, acquisition of pathogenicity islands, virulence plasmids, invasins, fimbria, and acid tolerance response thus leading to a broad host range of SEn (7). However, it is not fully understood how each of these genes contribute to efficient colonization in chicken. In a report published by Li et al. (8), it was shown that the global spread of SEn is critically linked to breeders' harboring of SEn, reinstating that our understanding of kinetics of colonization, harborage sites, and colonization mechanisms remains largely unknown regarding the reservoir avian host. In this sense, we believe that the development of a BLI in a chicken model will be valuable in refining colonization niches and understanding the colonization kinetics of SEn, which is not accurately determined through conventional methods (9, 10). For example, random sampling of tissue may miss out on important colonization sites. Once established, a working BLI model can be used for gene expression studies to facilitate-high throughput screening of virulence factors in SEn.
This study describes our efforts to analyze early kinetic events of SEn infection in day-old chicken by BLI. The detection limit of the current reporter strength was determined regarding several colonization sites. Furthermore, we have described a way to improve the signal intensity of the current reporter by allowing for energy transfer to an accessory protein, which possesses a florescent molecule. The improved reporter will be advantageous in future in gene expression studies. During the study, we were able to visualize tissue localization of various mutant strains of SEn tagged with the lux operon, thus enabling us to assess for virulence determinants that are not well characterized in chicken.
We incorporated the lux operon of Photorhabdus luminescens into the Salmonella Enteritidis chromosome using the modular Tn7-based systems described by Shivak et al. (11). In this methodology, the lux operon carried in a miniTn7 vector flanked by Tn7 elements (right and left) was inserted into the attTn7 site in the SEn chromosome. This was achieved by transposases (tnsABCD) carried by helper plasmid pHSG415 (11). Shivak et al. constructed two strengths of the synthetic promoter derived from a σ70-dependent consensus sequence: sig70c35 and sig70c10. Sigma 70 factors are essential proteins that direct DNA-dependent RNA polymerases to designated transcription start sites to constitutively express “housekeeping” genes in a bacterial cell during growth (12). The consensus sequence TTGACA in 35 base pairs upstream from the transcription start site of the double stranded DNA (-35) showed high expression of the lux operon (sig70c35 lux) and increased light production in Salmonella Typhimurium (STm) (11). The promoter containing sequence TATAA in the−10 region (sig70c10) was commuted to a more moderate level of expression than sig70c35 (11). In line with that, SEn chicken isolate Sal18 showed a mean maximum of ~64,000 counts per second (CPS) of luminescence after being transformed with the sig70c35 lux (Sal18sig70c35lux) while being transformed with the sig70c10 lux gave a maximum of ~26,000 CPS as determined with a plate reader (Figure 2A). Maximum signal intensities of both reporters were achieved between OD595nm 0.3 and 0.4 (shaded areas in Figure 2A). SEn continued to grow beyond OD 0.4 in the liquid culture (145 μl), but the generated bioluminescent signal declined at a steady rate over time (Figure 2A). We were able to measure the total emitted light signals (photons/s) from a 200-μl aliquot of Sal18sig70c35lux as detected with the CCD camera in the whole animal imager (IVIS Lumina II; Figure 2B). The Sal18sig70c35lux was grown to an OD600nm ~0.7 in a liquid culture (50 ml) and diluted to give rise to varied cell densities determined by OD values (Figure 2B). An undiluted sample (OD = 0.69) emitted ~3 ×10⁸ photons/s and then gradually decreased at each dilution (1:1.25) to a level of <108 photons/s after the sixth dilution (OD ~0.16). This indicated that emission of a bioluminescence signal from a cell population of a SEn strain in the same exponential growth phase is positively correlated with bacterial cell densities (R2 = 0.9764). Furthermore, the expression of the lux operon under the sig70c35 promoter did not alter the growth rate compared to its wild type in a nutrient rich medium (Figure 2C). The overnight culture of strain Sal18 grown at 37°C showed a longer lag phase getting into the exponential growth phase after subculturing at 42°C (Figure 2C). Even though there was an initial lag phase, at 4 h the SEn strains grown at 42°C reached a cell density of ~109 CFU/ml, which is similar to cells grown at 37°C (Figure 2C). The body temperature of a newly hatched chicken is around ~39.7°C, and in adult birds it is ~42°C, which is higher than in most mammals. Our growth curve analysis suggested that SEn strains carrying bioluminescent reporters will be able to grow in similar rate as the wild type of strain at temperatures in the bird. The growth patterns of the reporter was further confirmed by assaying multiple times using a plate reader (Victor X3-Perkin Elmer), which did not show a defect at 37°C or switching to 42°C (Supplementary Figure 1).
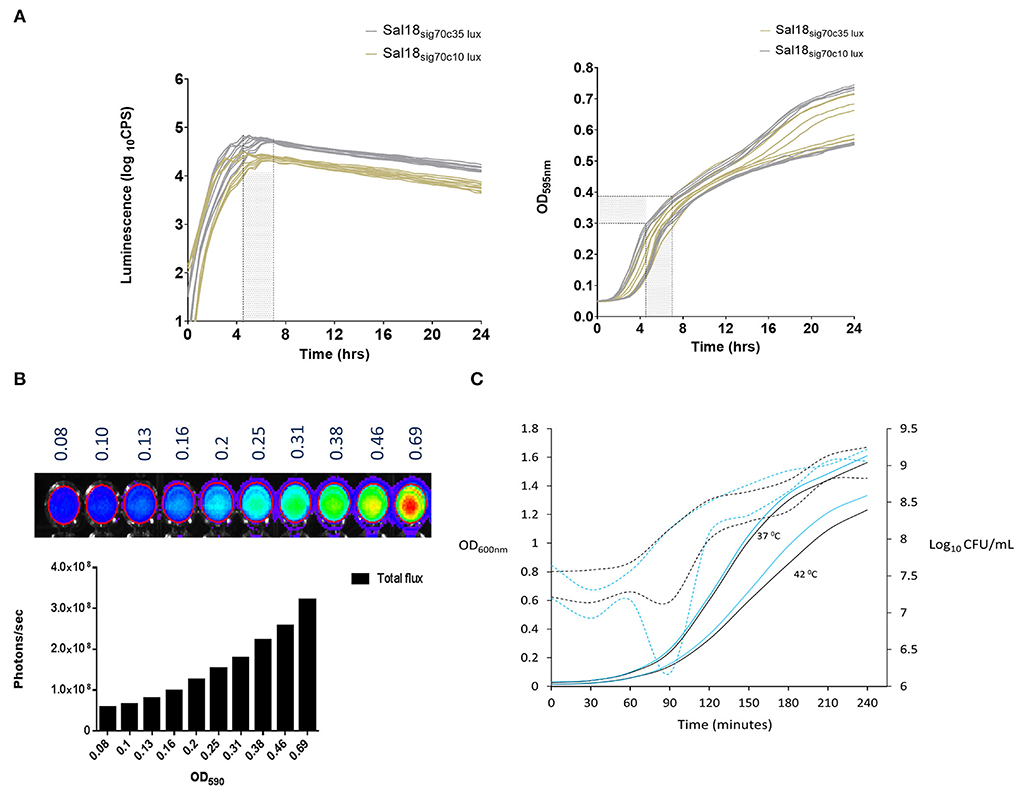
Figure 2. In vitro kinetics of luminescence expression and growth of Salmonella Enteritidis expressed under a constitutive promoter. (A) Level of lux operon expression and growth under two different promoters over time. Lux operon expression was measured as means of light signal production. Luciferase assay was performed using a Victor V3 plate reader (Perkin Elmer). Strains: Sal18sig70c10lux and Sal18sig70c35lux. (B) Correlation between cell densities and light emission of Sal18sig70c35lux.. Culture with OD600nm of 0.7 was diluted at 1:1.25 with an LB medium. Red circle marks the demarcation for total flux calculation with the software. Total flux: cumulative scores of photons/second recorded by each pixel in the CCD camera of the whole animal imager (IVIS Lumina II). Setting of the IVIS Lumina II; exposure: 3 sec, f = 1, binning = 4. (C) Growth curve of the Sal18 wild-type strain and Sal18sig70c35lux grown in the LB medium (1:100). Overnight cultures were obtained from SEn strains grown in the LB medium at 37°C. Solid lines represent OD and dotted lines CFU/ml. The experiment was performed once Black line: wild-type Sal 18, blue line: Sal18sig70c35lux.
Three groups of SPF birds (five birds/group) were orally gavaged with the Sal18sig70c35lux reporter. Each group was challenged with a different number of bacteria: 105, 107, and, 109 CFU per bird. At each time point, a single bird was euthanized and imaged using the an animal imager (IVIS Lumia II) to track the SEn strain in the gastrointestinal tract. The birds orally challenged with the 105 CFU dose did not reveal detectable bioluminescent signals from the gastrointestinal tract at all time points examined (Figure 3A). The birds challenged with the 107 CFU dose gave a detectable signal from the crop region 2 h post infection (p.i.), with intensities ranging from 50 to 700 counts after 60 s of exposure time. Signal intensities with similar range of photon counts were detected from the crop of a chick challenged with 109 CFU at 2 h p.i. (Figure 3A) during a 15-s exposure. Our data suggested that a portion of the challenged SEn remained in the crop region before “traveling” to the lower part of the GI tract. Furthermore, strong bioluminescent signals were detected in the small intestine of the birds challenged with 109 CFU at 2 h p.i.. Some signal intensities reached >1,000 counts (Figure 3A, 109 CFU dose) in the small intestine, reflecting that a major population of SEn may reside in the small intestine at 2 h p.i. However, we did not quantify the intestinal bacterial burden in different locations as directed by imaging. The estimated Salmonella burden in the cecum at 2 h p.i., was ~105 CFU/g from the birds infected with high challenge doses (107 and 109 CFU; Figure 3B). Reporter strains at a concentration of ~105 CFU/g of the cecum did not give detectable signals (15- or 60-s exposure); hence, we believe that to be detected from the intestinal tract, the reporter strain needs to reach a population of >105 CFU/g in 1-day old birds.
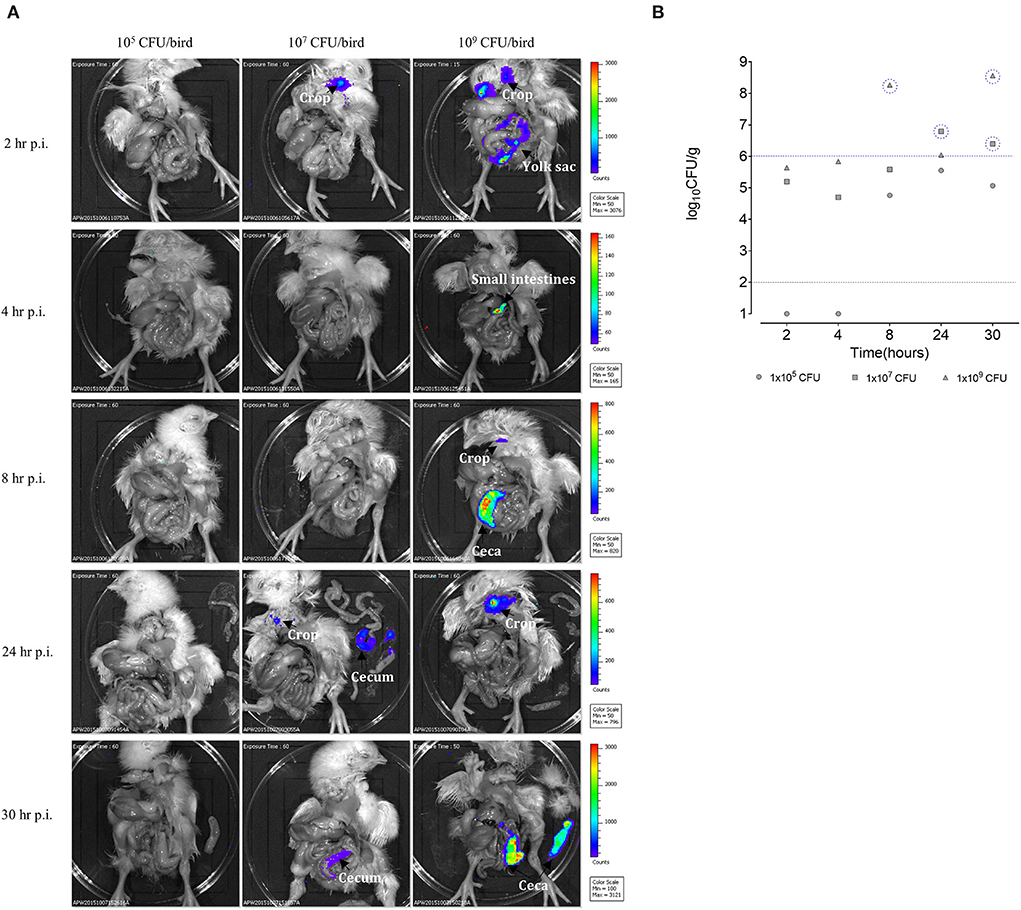
Figure 3. (A) Ex vivo imaging of the day-old SPF birds challenged with SEn carrying the sig70c35 lux reporter. Each color-coded area represents a photon captured with the CCD camera in counts. Setting of the IVIS Lumina II: auto exposure: f = 1, binning: 8. Background bioluminescent was set at 50 counts as determined by images taken from unchallenged birds (data not shown). (B) Bacterial load in the cecum. Dilutions were made from the cecal content enumerated in brilliant green agar plates. Each symbol represents a bird. Black dotted line is the detection limit of the brilliant green agar plate. Blue dotted line indicates the limit of detection of IVIS Lumina II in visualizing the SEn in the cecum under settings described here.
A major bioluminescent signal detected at 4 h p.i. was from the small intestine (ileum region) of the birds challenged with 109CFU with intensities ranging ~100–~140 photon counts. This range of signal intensity was lower than what we observed from the small intestine at 2 h p.i. (> 1,000 counts) in the same group. The low-signal intensity in the small intestine may be correlated with the low SEn concentration at 4 h p.i. compared to 2 h p.i. Since the small intestine has regular peristaltic movements, it is plausible that SEn will not remain in the intestinal lumen in high numbers. The cecal bacterial load remained ~105 CFU/g in the birds challenged with 109 CFU and did not result in a bioluminescent signal, confirming that only a population of >105 CFU/g can be detected with the bioluminescent imager (Figure 3B). The bird challenged with the 107 CFU oral dose contained ~104 CFU/g at 4 h p.i. (Figure 3B). It was relatively lower than the quantified bacterial load at 2 h p.i. in the same group (Figure 3B). The lowest dose of 105 CFU did not result in recovery of SEn from the cecum at this time point, which is similar to 2 h p.i.
The birds that obtained the highest oral dose of SEn emitted signals from the ceca with surface areas consisting of 200–800 photon counts at 8-h p.i (Figure 3A). The emission corresponded to a population of ~108 CFU/g of SEn as estimated by cecal material processing and plating on selective media (Figure 3B). In parallel, the birds infected with the 105 CFU oral dose reached ~104 CFU/g, and the birds infected with 107 CFU had ~105 CFU/g (Figure 3B) with no signal emissions. In chickens, the food material takes 6 h to travel into the cecum after ingestion. Hence, we expected a relatively high load of SEn in the cecal material at 8 h p.i. In line with this, we observed a dose-dependent seeding of the cecum reaching a comparatively high concentration from the birds challenged with each dose. In addition to the cecum, a bioluminescent signal was detected from the crop at 8 h p.i. in the birds challenged with 109 CFU (Figure 3B). It had ~50 counts of surface intensities, which were relatively low compared to the signal generated at 2-h p.i (200–400 photon counts). We speculate that low bacterial concentration in the crop may account for the low-signal intensity at 8-h p.i compared to 2 h p.i. Furthermore, the imaging data suggested that the majority of the challenge doses had migrated into the intestines 8 h p.i. Even though we did not quantify the bacterial burden in the crop content, the emission of bioluminescent signals from the crop at early time points suggested that the crop may act as a transient attachment/colonization site for SEn.
Digested food materials can be retained up to 12 h in the chicken cecum before emptying into the large intestine for expulsion as a fecal material (13). In nature, this is not a fully synchronized process and greatly varies among individual birds. We saw a dramatic drop in SEn burden in the cecum from ~108 (1.85 ×10⁸) to ~106 CFU/g (1.11 ×10⁶) at 24 h p.i. in the birds challenged with the highest oral dose (Figure 3B). We suggest that this drop in Salmonella burden resulted from the emptying of cecal materials into the large intestine that occurred during the 24-h infection window. At this concentration, there were no signals detected from the cecum, while the bird challenged with 107 CFU dose gave a detectable signal at SEn concentration of ~6 ×10⁶ CFU/g cecal material. Taken together, we concluded that the detection limit of SEn by ex vivo imaging (IVIS Lumina II) was ~1 ×10⁶CFU/g using the current reporter strength on exposure at 60 s. The crop material from the birds challenged with the 109 CFU oral dose had bioluminescent signal intensities reaching a maximum of 800 photon counts at 24 h p.i. but there was no signal from the cecum. In parallel, the birds challenged with the 107 CFU oral dose also had a small area of intensity reaching 100 photon counts in the crop material. It is plausible that during the 24-h infection window SEn has been shed into the environment in adequate amount and then was transmitted by contamination of feed or water. Hence, a signal generated from the crop materials at 24 h p.i. was highly suggestive of SEn transmission from the environment to the birds. In the future, transmission events of Salmonella may be accurately tracked by simply imaging crop materials rather than randomly collecting environmental samples. The crop acts as a transient storage diverticulum, since such material can be found at frequent time points at ease for this purpose. The imaging data confirmed that during the next 6 h (30 p.i.) the crop was completely emptied (less material), which suggested that anything which was stored had been moved to the intestines (Figure 3A). At 30 h p.i., in birds other than those challenged with the lowest dose, SEn reached a cecal concentration of more than the detection limit (Figure 3B), resulting in bioluminescent signals from the cecum (Figure 3A). The SEn burden of ~ 4 ×10⁸ CFU/g of cecal material resulted in signal intensities ranging from 1,000 to 3,000 photon counts at 30 h p.i. (109 dose), which was the highest intensity so far from the cecum (Figure 3B). In parallel, ~2.5 ×10⁶ CFU/g of an SEn population gave rise to 100 photon counts (107 dose, Figure 3A). The difference between the two signal intensities can partly correspond to the bacterial concentration at this time point. However, when the signal intensities emitted from the cecum at 8 h p.i. were compared to 30 h p.i. of the birds challenged with the highest oral dose, surface signal intensities from the cecum significantly differed even though both times shared a similar SEn burden (~108 CFU/g). The signal generated at 30 h p.i. (1,000–3,000 counts) was significantly higher than the 8-h p.i. (200–800; Figure 3B). We suggest that this will be largely related to the relatively high transcription of the lux operon by the SEn strain residing in the cecum milieu at 30 h p.i. compared to 8 h p.i. As mentioned earlier, the expression of the lux operon is a driven by a sigma 70 factor-recognized promoter, which expressed constitutively to activate housekeeping factors inside the bacterium. Hence, we suggest that this gain in signal intensities marks a true colonization event taking place by SEn with chicken's cecum milieu at 30 h p.i. We hypothesized that SEn actively produced more sigma 70 factors to keep up with the metabolically demanding process in establishing the cecal environment. Overall, our imaging data together with colony counts suggested that SEn actively begins to colonize the cecum 30-h post infection, and that this is a dose-dependent process. Also, we conclude that a normal dose of 109 CFU per bird is an optimal challenge dose for visualizing early kinetic events using SEn strains carrying the lux operon with current signal strength.
We hypothesized that the lumazine protein from Photobacterium leiognathi will closely interact with the luciferase enzyme from Photorhabdus luminescens and will give a brighter intensity of light that potentially could improve the detection limit. The lumazine protein (LumP) possesses a non-covalently bound fluorophore, 6,7-dimethyl-8-ribityllumazine (DMRL), which interacts closely with the alpha subunit of the luciferase enzyme (14, 15). This fluorophore acts as a secondary emitter of the Photobacterium species that generates brighter blue light (475 nm) in these bacteria. In our construct, lump was cloned upstream of the lux operon of Photorhabdus luminescens and expressed under the sigma 70c35 promoter (sig70c35 lump lux). The measured light production over time by SEn strains expressing the sig70c35 lump lux showed relatively faster kinetics (blue line in Figure 4A) and reached a new maximum compared to the original construct (Figure 4B). Calculated relative fold changes in the maximum luminescence signal for Sal18, LS101, and LS183 were 1.9, 1.4, and 2, respectively (relative fold change = mean max lumP reporter/mean max lux reporter; Figure 4B). The bright blue light was visualized from the Sal18sig70c35lumplux culture grown to OD600 = 0.7 compared to Sal18sig70c35lux (blue to green color), indicating that bioluminescence has shifted to blue color (Figure 4C). LS183sig70c35lumplux showed the highest light intensity determined with the plate reader in a 145-μl volume culture reaching ~1.8 ×10⁵ CPS. Interestingly, LS183sig70c35lumplux showed relatively slower growth in LB media compared to the wild-type strain indicating that LumP expression had some metabolic constraint on the strain grown in the LB media (Figure 4D). This phenomenon was not shown by other SEn strains expressing the LumP. It reflected individual strain differences at the expense of the reporter expression. In the in vitro detection limit of the reporter expressing the LumP was improved by two-fold compared to the sig70c35 lux construct as determined by bioluminescent imaging of diluted cultures (Figure 5). The culture of OD600nm 0.7 contained a density of SEn~2 ×10⁸ CFU/ml (a standard of all our SEn isolates).
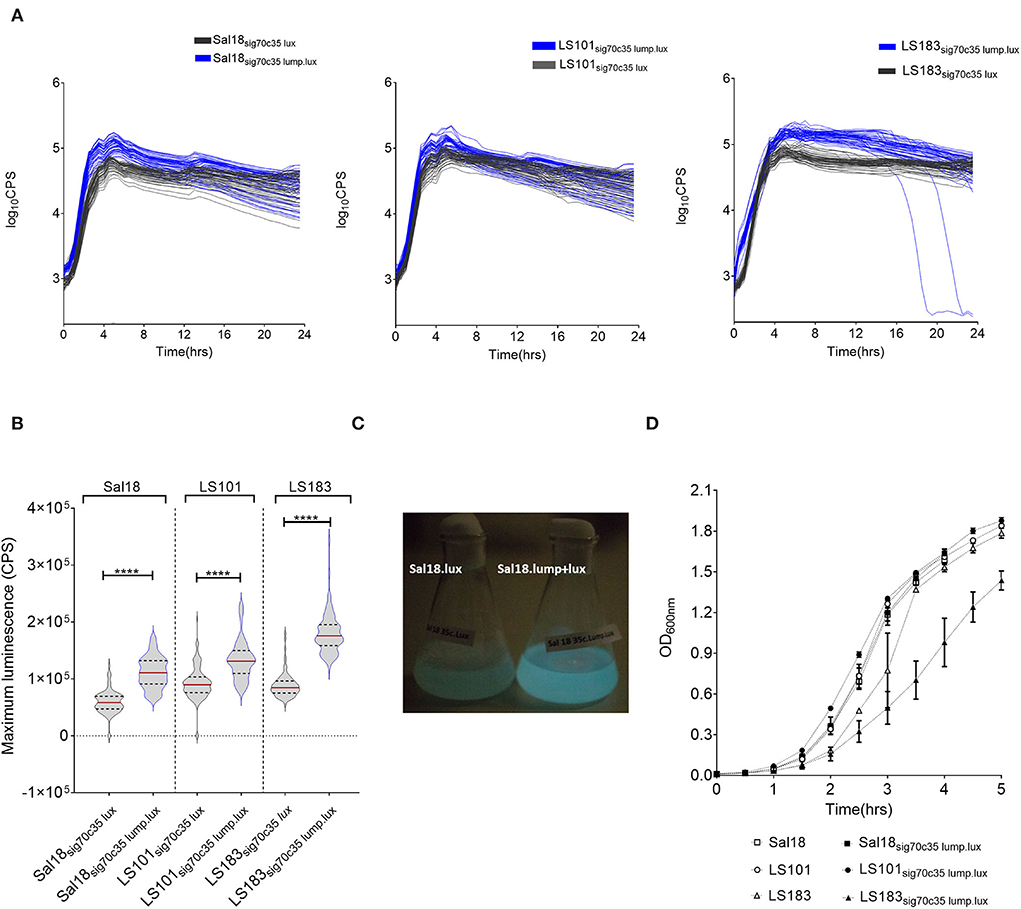
Figure 4. Modification in the light signal produced by different poultry isolates of Salmonella Enteritidis by LumP (lumazine protein). (A) Kinetics of light production by S. Enteritidis expressing luciferase and the lumP. An assay was performed using a Victor V3 plate reader on bacteria grown at 37°C. Each line indicates one biological replicate, and 48 biological replicates were represented here. (B) Violin plot of maximum light signal generated by each biological replicate presented in (A). The horizontal bar represents the median value while the upper and lower dashed lines are indicative of the 3rd and 1st quartiles, respectively. Median values were statistically analyzed. ****p = <0.0001. (C) Photographs of light emission from cultures of S. Enteritidis isolate Sal18. Overnight cultures were subculture at 1:100 in the LB medium to an OD600nm value of 8. (D) Growth curves grown in LB media. Each symbol represents mean with standard deviation of the optical density measured at 600 nm. The assay was run thrice using one biological replicate at each run.
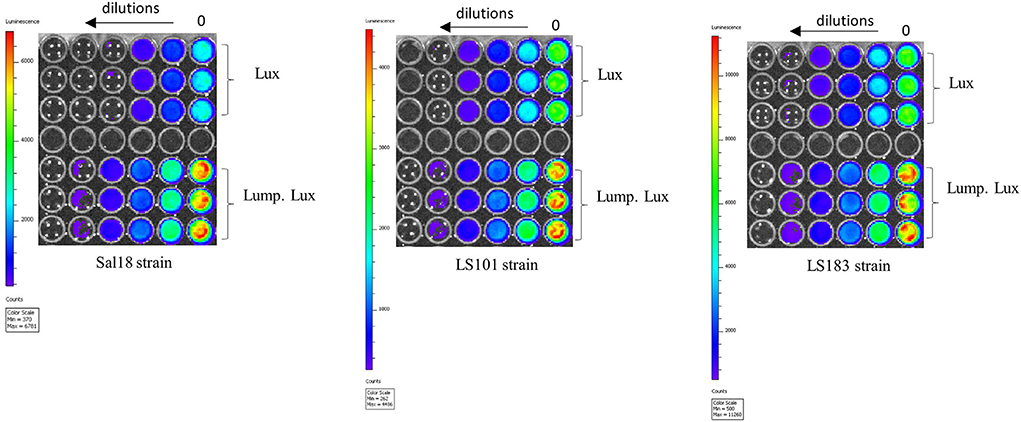
Figure 5. In vitro detection limit of various SEn strains carrying the reporter. Each strain was grown to an OD600nm of 0.7 (dilution 0) and diluted (two-fold). Aliquots 200 μl were placed on a 96-well plate. IVIS Lumina II setting: f = 1, expo = 5 s, and bin = medium.
Five isogenic chromosomal mutants of SEnLS101 (chicken isolate), namely, ΔSPI-1, ΔSPI-2, ΔpagN, Δfur, and ΔtonB, were tested in a chicken model to analyze the roles of these putative virulence genes in colonization of birds (Table 1). All the strains, including the wild type, carried the reporter sig70c35 lux to facilitate tracking by imaging. Ex vivo imaging of the gastrointestinal tract of the wild type infected bird showed (two birds per time point), bioluminescent imaging of cecum, ileum, and colon with surface intensities reaching to ~2,000 photon counts at day 4 p.i. (Figure 6). This surface intensity corresponded to a ~108 CFU/g of SEn concentration in the cecum as determined by enumeration of cecal content (Figure 7A). Bioluminescent imaging was possible from all the birds examined from each group with intensities ranging from 1,000 to 2,000 photon counts on day 4 p.i. One exception to the observation was that surface intensities generated by one of the Δfur-infected birds consisted of only 300 photons, which is relatively lower. However, the overall cecal SEn burden did not significantly differ in each group compared to the wild type; hence, signal intensity was generally comparable to the Salmonella densities on day 4 p.i. (Figure 7A). In addition to the gastrointestinal tract, a prominent bioluminescent signal was detected from the yolk sac of the wild type-infected birds. It consisted of signal intensities of ~5,000–~10,000 photon counts (Figure 6) with a density of~108 CFU/g of an SEn burden (Figure 7B). Compared to the gastrointestinal tract, the yolk sac is a thin membranous structure that allows for more light emission from the surface. This may have been a reason for the high signal strengths from the yolk sac compared to the cecal tissue despite both having similar SEn densities. Overall, our bioluminescent imaging approach was able to show that in addition to the cecum, the yolk sac is a niche that SEn can colonize in young chickens after oral fecal infection. In comparison to the wild type-infected birds, two birds infected with ΔSPI-1 did not show a bioluminescent signal from the yolk sac on day 4 p.i. (Figure 6). Direct plating of the yolk material from these birds did not result in any colony counts and hence were below the detection limit by imaging (Figure 7B). Compared to other mutants, ΔSPI-1 showed a trend in low recovery from yolk material since the overall median level only reached ~103 CFU/g on day 4 p.i (Figure 7B). The median SEn burden in the yolk for ΔSPI-1, ΔpagN, and Δfur day 4 p.i was ~104 CFU/g, suggesting that these mutations also have decreased the virulence in causing yolk sac infection compared to the wild type (~108 CFU/g). According to the available imaging data, detection limit in the yolk sac appeared to be between ~107 CFU/g and ~104 CFU/g (Figure 7B). We speculated that the detection limit of SEn infection in yolk sac by imaging might be less than that of SEn in the cecum, because it is more permissive for light penetration. We calculated the total photons emitted from the surface of the yolk sac and the cecum during bioluminescent imaging (Figure 8), which enabled us to estimate the minimum cell density required to facilitate bioluminescent imaging (Supplementary Table 1). The total photon count of ~104 used as the background signal, as determined with organs, did not result in visually detectable bioluminescent hot spots (Figure 8). We hypothetically used the surface emission of 105 photon count as the next available photon emission needed to generate a bioluminescent image. Based on this, minimum bacterial cell density was estimated, which was needed to generate an image. For the yolk sac infected with wild-type SEn, it was ~1 ×10⁷ CFU/g (1.1 + 07) day 4 p.i. and ~3 ×10⁶ CFU/g (3.48 + 0.07) on day 5 p.i. In the cecum, estimated cell density for detection by imaging was ~4 ×10⁸ CFU/g (3.99 + 0.08) on day 4 p.i. and ~1 ×10⁸ CFU/g (1.3 + 0.08) on day 5 p.i (Supplementary Table 1). So, overall, we predict that the detection limit of yok sac imaging will range from 106 to 107 CFU/g while being infected with the SEn strain LS101 with the sig70c35 lux reporter up to the age of 5-day-old. For the same age of birds, the detection limit in the cecum is ~108 CFU/g.
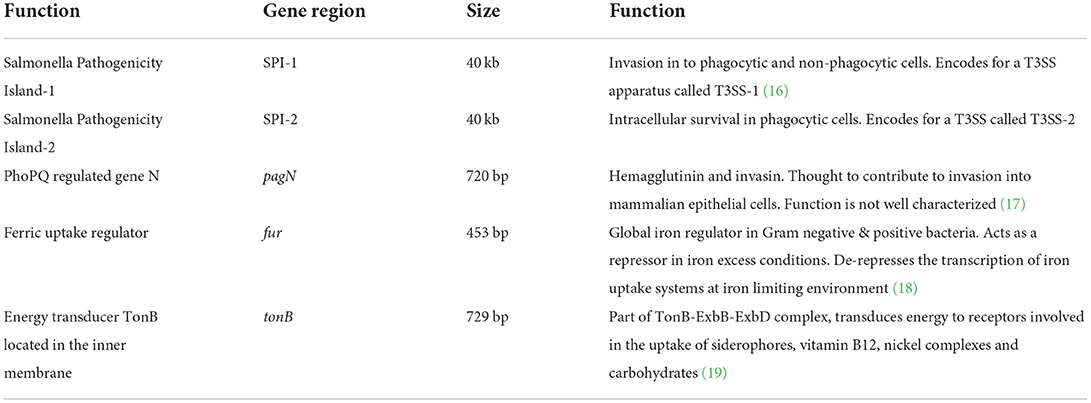
Table 1. Putative virulence genes.
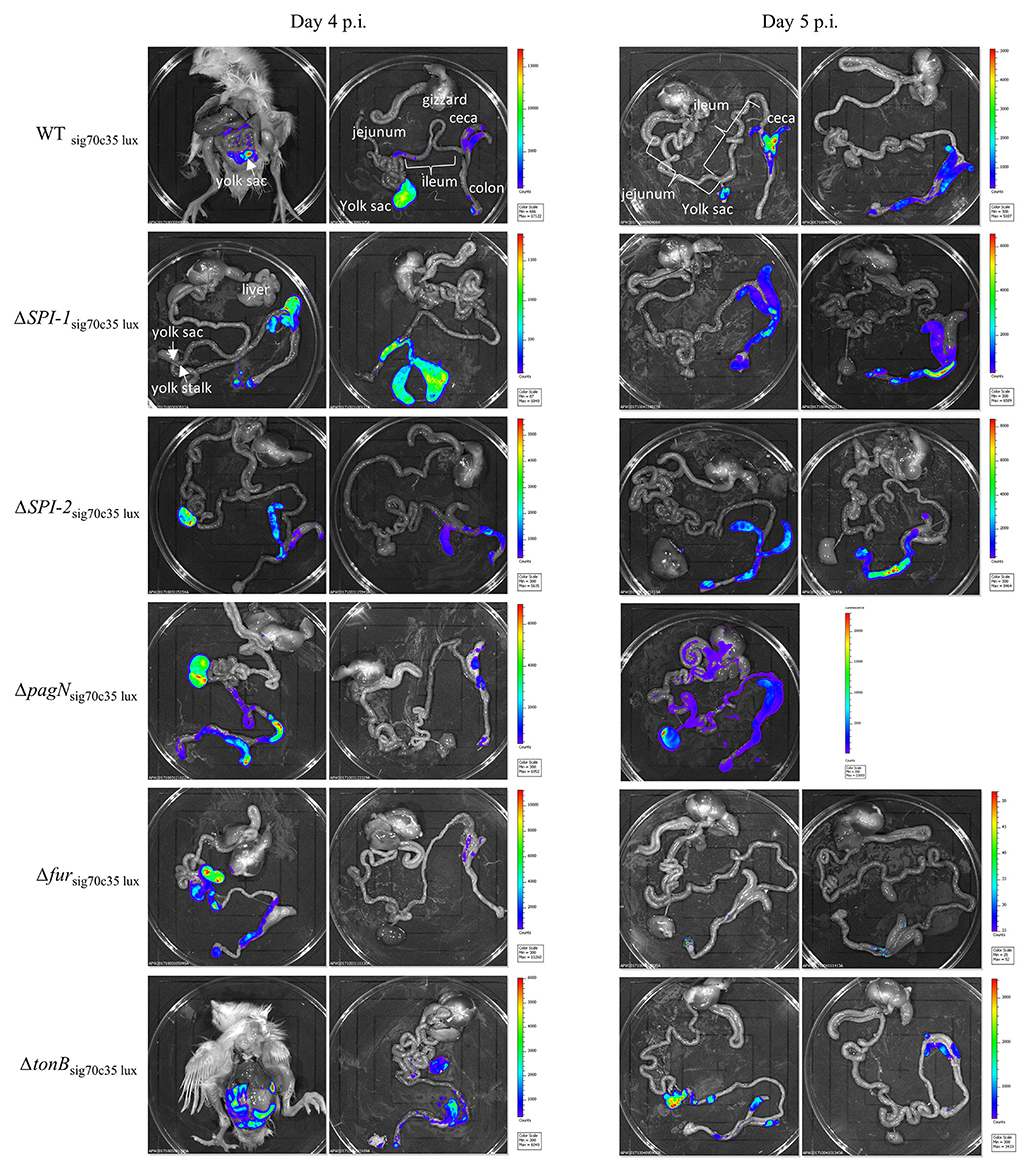
Figure 6. Ex vivo imaging of birds infected with wild type or mutants. The wild-type strain LS101 and isogenic mutant strains were tagged with the sig70c35 lux reporter. IVIS imaging setting: f = 1, exp = 30 s, binding = medium, and filter = open.
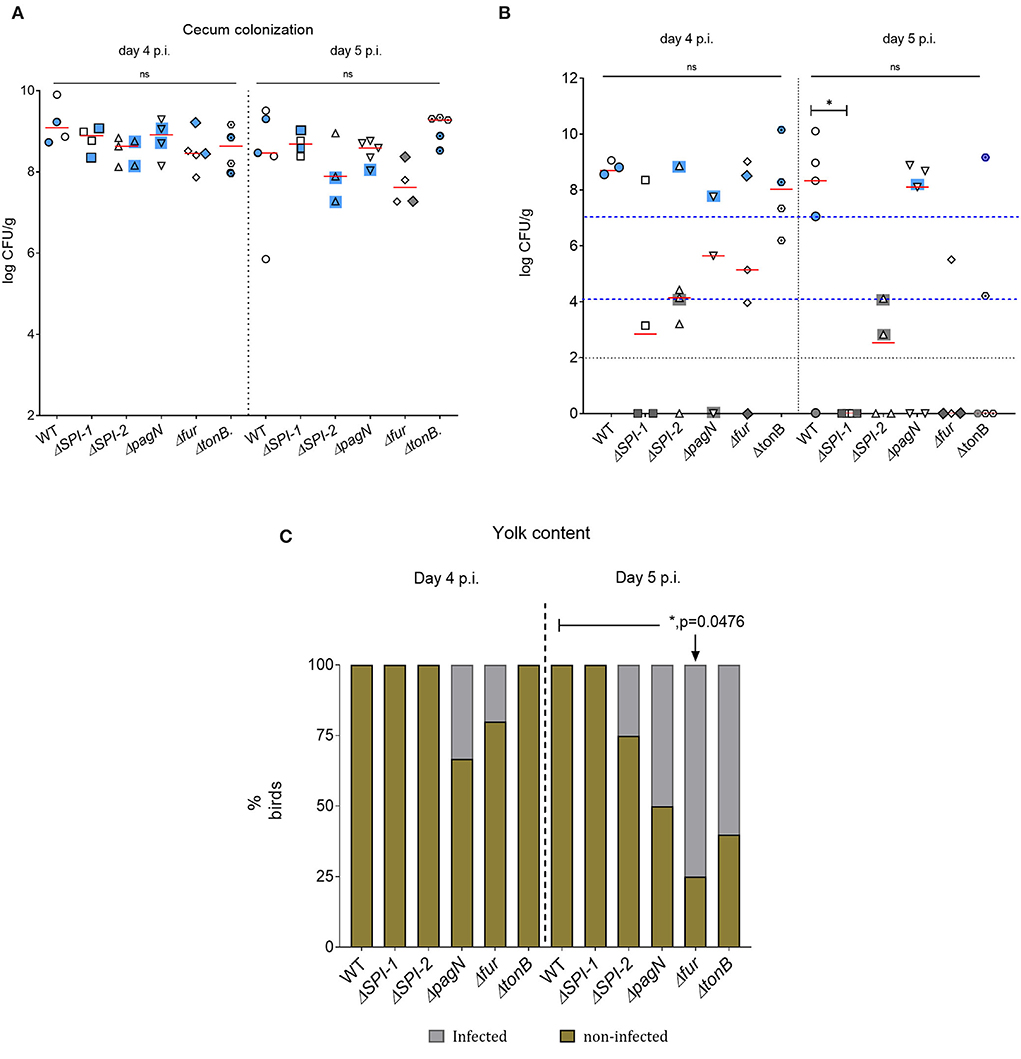
Figure 7. SEn burden by direct plating of cecal and yolk material. (A) cecum. (B) yolk. Each symbol represents a bird, and symbols with blue/gray color backgrounds are the birds selected for random imaging. Blue indicates that a bioluminescent signal was detected by imaging, while gray indicates no signals. The horizontal red bar is the median of the data set. Black dotted horizontal line indicates the detection limit of the brilliant green agar pate (100 CFU/g). Detection limit of the yolk sac by bioluminescent imaging was indicated by the blue dashed line. Mean colony count values of the cecum were statistically analyzed, while the yolk material median values were analyzed. The two blue lines in (B) stand for upper and lower margins of limit of detection by imaging, respectively. (C) Yolk sac infectivity after enrichments. ns, Not significant.
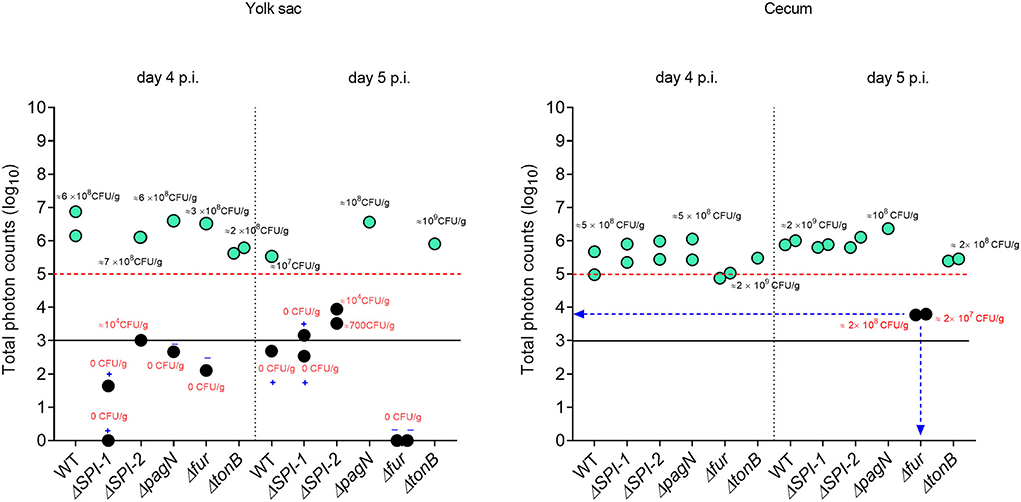
Figure 8. Relationship between total photons emitted from the organ and bacterial cell densities. Total photons are shown in log 10 scale. Each symbol represents a bird subjected to ex vivo imaging. Symbols highlighted in color represent positive for photonic detection while black symbols indicate no detectable photons. Some of the colony count values indicated proximity to the symbol. Infectivity of samples that underwent enrichment (samples with 0 CFU/g) is shown by + (infected) or – (non-infected). Black horizontal line is the background photon signal. Red horizontal bar represents minimum photon counts which are needed to for a bioluminescent signal to be detected from the surface of an image.
Bioluminescent images of the cecum were obtained from all the groups on day 5 p.i. (Figure 6). There was no significant difference in cecal colonization between the wild-type and mutant strains on day 5 p.i. (Figure 7A). However, the ex vivo imaging of the cecum in the group infected with Δfur did not generate a signal from the surface even if a concentration of 108 CFU/g of SEn was reached (Figure 6). The Δfur infected birds emitted ~ 6 ×10³ total photons, which was below the threshold for generating bioluminescent images. We speculate that in a Δfur background, accumulation of intracellular sigma 70 factor might be low. Low translation of sigma70 factor will eventually lead to less RNA polymerase bound to the promoter region for transcription of the lux operon. This hypothesis needs to be investigated in future experiments. Detection of bioluminescence signals from the yolk sac was visible from the wild type-, ΔpagN-, and ΔtonB-infected groups on day 5 p.i. (Figure 6). However, except for ΔpagN, the median recovery numbers of SEn from the yolk content of ΔSPI-1, ΔSPI-2 Δfur, and ΔtonB was <104 CFU/g, which is below detection by imaging (Figures 6, 7B). On most occasions, recovery of SEn from yolks in birds infected by mutants was below the detection limit by direct plating (Figure 7B). Enrichment data showed that yolk sac infectivity was significantly decreased by mutation in fur (25% infectivity) compared to the wild type (100% infectivity) on day 5 p.i. The mutation in tonB only showed 40% yolk sac infectivity, suggesting that Fe3+uptake systems may be involved in yolk sac infection.
Two groups of day-old SPF birds were orally challenged (13 birds from each group) on the day of hatch; one group was infected with LS101sig70c35lux (group A), and the other was infected with LS101sig70c35lump.lux (group B). Each group had unchallenged birds: group A was left with five birds and group B had four birds. Sampling and whole animal imaging of the gastrointestinal tract were carried out on days 4 and 5 p.i. Consistent with our previous findings, the wild-type SEn carrying the sig70c35 lux reporter (WTsig70c35lux) emitted bioluminescent signals from the cecum and yolk sac regions of the challenged birds on day 4 p.i. In parallel, WTsig70c35lux.lump with improved yield also facilitated imaging from the cecum and yolk sac. However, in contrast to the WTsig70c35lux, WTsig70c35lux.lump only resulted in 1/5 birds with a visible yolk sac infection on day 4 p.i. (Figure 9A). So, most of the samples were below the detection limit of imaging of the yolk sac by WTsig70c35lux.lump. The measured SEn burden using the cecal material clearly indicated that the two reporter strains were able to colonize the cecum in compatible numbers (~109 CFU/g) on day 4 p.i. (Figure 9B). Two imaged unchallenged birds on day 4 p.i. showed visually detectable bioluminescent signals from the cecum (Figure 10) and they were similar in strengths to the challenged birds (Figure 11), with the burden of Salmonella reaching ~109 CFU/g of cecal material (Figure 9B). Bioluminescent signals of yolk sacs from the unchallenged birds on day 4 p.i. generated total surface photon counts of between ~104 and ~103, which were below the visual detection limit of 105 total photons (Figure 11). The burden of SEn in the remaining unchallenged birds were maintained at ~109 CFU/g on day 5 p.i. (Figure 9B) and produced bioluminescent images from the cecum (Figure 10). In parallel, yolk sacs from the unchallenged birds had total surface bioluminescent signals < ~104 (Figure 11) and hence did not produce images with bioluminescent hot spots (Figure 10). The major way that the unchallenged birds had been infected with SEn was by ingestion of contaminated feed or water during this time. The crop material from one of the unchallenged birds on day 5 p.i. produced a bioluminescent image, which confirmed this mode of transmission (Figure 10). SEn-carrying reporters have been excreted into the litter, which was then picked up by the unchallenged birds at a certain time point. The level of colonization of the unchallenged birds was highly compatible to the level of the challenged birds in the two groups, indicating that both reporters had similar kinetics of transmission.
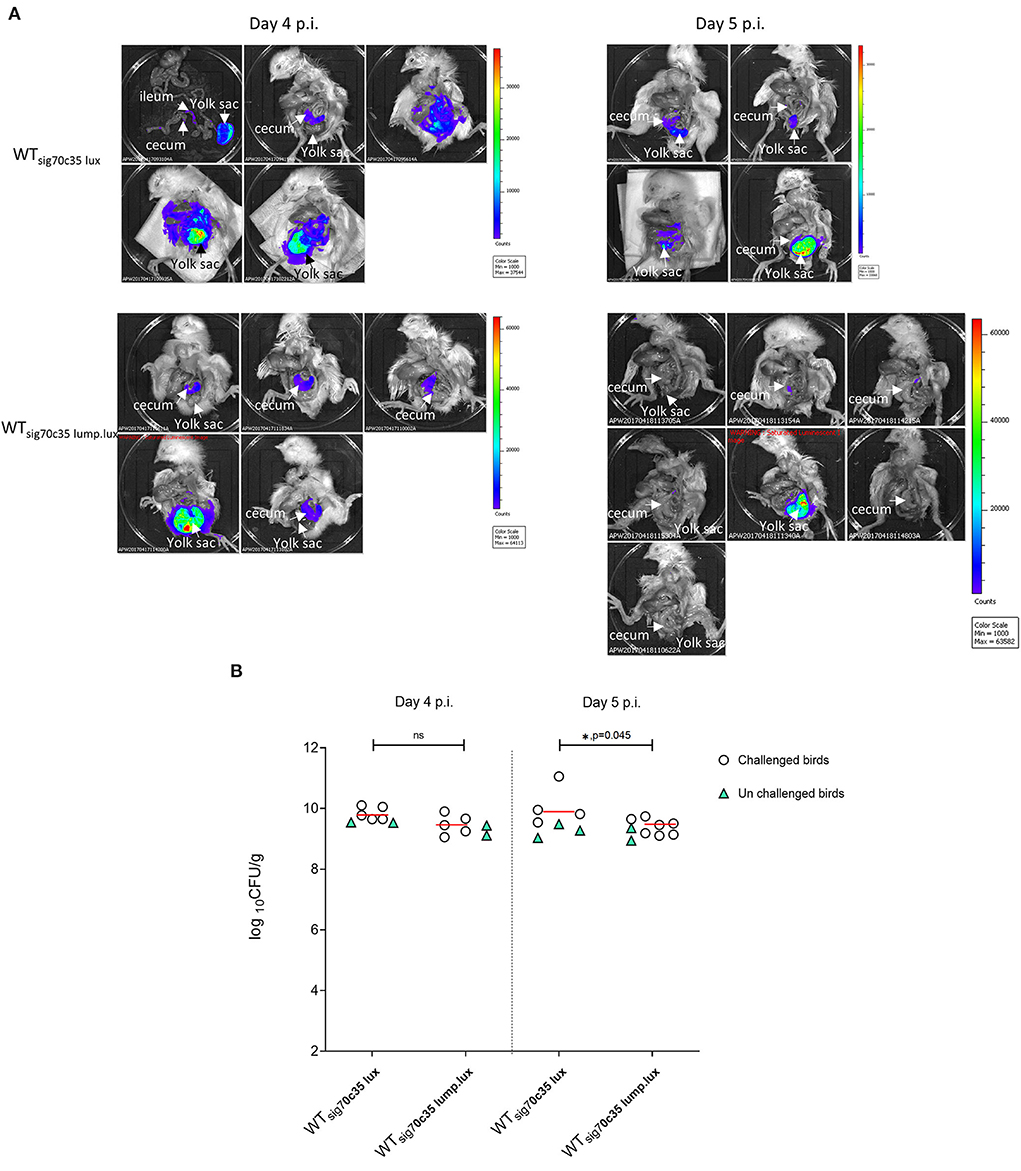
Figure 9. (A) Ex vivo imaging of the gastrointestinal tract by reporters. (B) Cecum bacterial cell densities. Each symbol represents a bird. The horizontal bar represents the median CFU/g value of challenged birds.
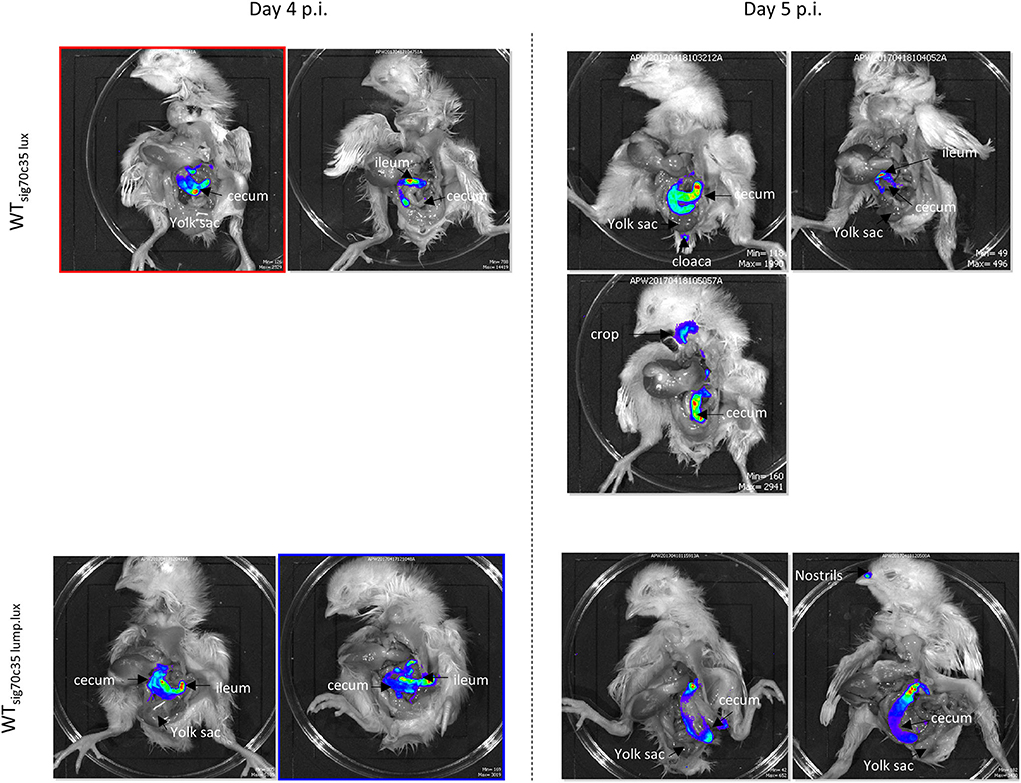
Figure 10. Ex vivo imaging of unchallenged birds infected by reporters. Signal intensities are displayed based on individual minimum and maximum photon counts.
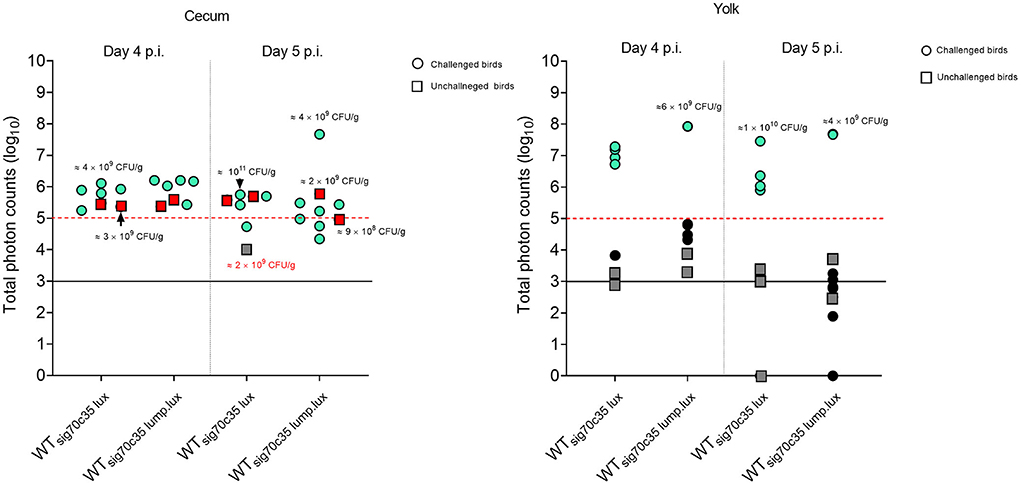
Figure 11. Relationship between total photons emitted from the organ and bacterial cell densities. Total photons are shown in log10 scale. Each symbol represents a bird that undergone ex vivo imaging. Some of the colony count values indicated proximity to the symbol. Red or blue color means positive for bioluminescent imaging, while dark gray to black is indicative of no images. Black horizontal line is background photon signals. Red horizontal bar is the minimum photons needed to be detected by bioluminescent imaging.
In contrast to the unchallenged birds, almost all the birds challenged with the WTsig70c35lux reporter gave rise to detectable bioluminescent images with a surface emission of >105 photons (Figure 11). Since most of the unchallenged birds had a total photon emission <104 from the yolk sac with lack of detectable signals, it was highly unlikely that environmental transmission caused yolk sac infections in this study. Since the detection limit of yolk sac was estimated to be at ~106 CFU/g (on day 5 p.i.) from our previous results, the yolk sac of the unchallenged birds may have had < ~106 CFU/g in the seeder model. Toward day 5 p.i., two out of three birds had a total photon emission of <103, which can lead to even 0 CFU/g by direct plating. Overall, our data suggested that the initial seeding of yolk sac through entry from the jejunum to the yolk via yolk stalk may have accounted for causing high frequencies of yolk sac infection rather than entry from the navel in the day-old chickens. The navel route of infection has been identified as the major route for yolk sac infection associated with bacteria. Hence, we conclude that the oral route provides a major entry point to cause yolk sac infection linked to SEn other than the navel.
We were able to calculate the minimum cell densities needed to obtain a bioluminescent image from the cecum, since we recorded the total photon emitted from the cecum and cell densities (Figure 11). On day 4 p.i., the detection limit of WTsig70c35lux−infected birds was ~109 CFU/g (1.05 + 0.09), while for WTsig70c35lump.lux it was ~3 ×10⁸ CFU/g (3.05 + 0.08; Supplementary Table 1). On day 5 p.i., the detection limit for the two reporters were as follows: ~1010 (9.6 5 + 0.09) and 4 ×10⁷ CFU/g (4.24 + 0.07; Supplementary Table 1). Our ex vivo imaging results indicated that WTsig70c35lump.lux showed some improvements in detecting SEn ex vivo in the cecum relative to theWTsig70c35lux. The margin of detection of WTsig70c35lump.lux in the cecum on day 5 p.i. extended to ~2 log improvement compared to WTsig70c35lux. However, the estimated limit of detection calculated for the WTsig70c35lux strain in this experiment was higher than that what we have estimated from the earlier experiment (animal experiment 2), which was ~108 CFU/g.
We hypothesized that colonization events of SEn can be detected by bioluminescent imaging (BLI) and that BLI can facilitate live bird imaging of day-old chickens. Our approach revealed that detection of bioluminescence signals was mainly possible from the gastrointestinal tract after performing a laparotomy. Detectable signals were localized in the cecum as early as 8 h p.i. and then again 30 h p.i. (Figure 3A). Furthermore, on days 4 and 5 p.i., the cecum was the major site for signal localization, confirming it is the predilection site for colonization of SEn (Figures 6, 9A, 11). Tracking photonic signal strength showed that the exact colonization event occurred beyond 24 h p.i. during infection with the sal18 strain (challenge dose of 109 CFU). In an event of colonization, Salmonella will be replicative and metabolically active within the cecal environment (20). Also, the transcription rate of most essential genes including those located downstream of sigma 70-dependent promoters will be higher in a metabolically active status. Hence, the lux operon with a sigma70-dependent promoter should give rise to higher expression under these conditions. The dramatic increment of bioluminescent signal at 30 h p.i indicated that the population of SEn was relatively more metabolically active than at 8 h p.i. (Figure 3). Even though at 8 h p.i the load of Salmonella was comparable to that at 30 h p.i (108 CFU/g), the elevated signal intensity suggested a more metabolically active status of bacterial cells at 30 h p.i. Our previous report showed that “active” colonization of the cecum with SEn strain LS101 occurred between 24 and 48 h p.i. in day-old birds challenged with the 109 CFU dose (21). In that study, the cecal Salmonella burden reached a maximum of ~109 CFU/g 24 and 48 h p.i. with surface photon ~5,000 counts imaged after 1 min of exposure. In this study, using the bioluminescent signal strength combined with colony counts, we were able to confirm our previous results that the most active SEn colonization occur >24 h <48 h p.i. Our approach also further stressed that BLI has the added advantage of defining key features of pathogenesis of Salmonella in chickens, such as temporal changes in colonization pattern.
The estimated detection limit in the cecum was ~106 CFU/g using 1-day old SPF birds at 1 min exposure at 30 h of infection (Figure 3B). We saw that the estimated limit of detection was increased to the range of ~108 CFU/g when image acquisition was set at 30 s of exposure on days 4 and 5 p.i. (Figure 8). In a series of experiments conducted by Rimet et al. (22), it was estimated that the limit of detection of Salmonella strains (S. Typhimurium and S. Heidelberg) from the chicken cecum was >106 CFU/g for reliable visualization. Hence, our estimated detection limits are in line with these findings. However, the limit of detection can vary significantly depending on reporter strength, experimental procedures, and exposure settings applied. For example, we have used a maximum of 1 min of exposure to avoid oversaturation as well as to minimize any low level of signals that are not reliable. The lux operon expressed under the sig70c35 promoter was strong enough to facilitate image acquisition at low exposure. In their study, Rimet et al. (22) used a long exposure time (3–5 min) for image acquisition optimized to the lux operon expressed under the EM7 promoter, which has been described by Burns-Guydish et al. (23). The EM7 promoter contains the sequences TTGACA in the “-35 region” (included in sig70c35) and TATAAT in the “-10 region” (not included in sig70c35), which are recognition consensus sequences for sigma factor family proteins. So, lux operon expression can be comparable between sig70c35 and EM7. However, the transposition of reporter into STm described in the previous study was located in the hha gene, which was disrupted during insertion, while in our study the reporter was placed in a permissive site, the attTn7 site, downstream of the glmS gene. Hence it is unknown if the expression of the lux operon from two different sites in the chromosome has an impact on signal strength and Salmonella performance in the chicken milieu in vivo. Long exposure time will be necessary as described by Rimet et al. (22) to image older birds (42 days old) as the tissues become less transparent. Longer exposure time using the reporter sig70c35 lux has not been conducted in this study but will be an option to improve the sensitivity. In this study, we have maintained the anaerobic environment of the cecum while capturing photon detection. To our knowledge, similar procedures have not been documented in other studies and an evaluation of the whole gastrointestinal tract has not been published so far. Since oxygen is needed to generate a light signal, BLI of intact organs or aerated tissues may result in different detection limits.
The total of 106 CFU or the concentration of ~108 CFU/g of STm in the cecum is considered as the limit of detection during in vivo imaging of mice (5). These results are from the first report of monitoring infection by BLI of a living animal tissue (5). In contrast to a chicken infection model, live BLI was possible using mice in which signals were mainly localized to the cecum throughout the study period (8 days) (5). The authors used the STm strain SL1344 carrying the plasmid-encoded lux operon of P. luminescence, which was constitutively expressed from the lac promoter. The Lac promoter consensus contains TTTACA in the−35 region and TATGTT in the−10 region. The strength of the signal generated under these conditions prohibited visualization of extraintestinal infection (liver, spleen and lung) since the bacterial load was below the detection limit (<106 CFU/organ). Shivak et al. (11) were able to show that STm carrying the lux expression under sig70c35 facilitated ex vivo imaging from the liver and splenic compartment; however, the detection limit has not been documented (11). In contrast to imaging of mice, chickens infected with the SEn strain LS101sig70c35 lux did not result in any BLI from surfaces of the liver or spleen, and most of the birds carried <105 CFU/g of Salmonella (Supplementary Figure 2A). The relatively large size of organs compared to mice and absorption of the blue light by blood may require higher bacterial numbers to be detected in the liver and spleen of chickens.
For the first time, we report the BLI-facilitated detection of yolk sac infection with SEn after oral gavage (with a detection limit of >106 CFU/g using the sig70c35 lux construct; Figures 6, 9). The yolk sac consists of a yolk material covered by a vascularized thin membrane structure called yolk sac membrane. So, it is more transmembrane than the gastrointestinal tract. In fact, the estimated detection limit during yolk sac infection by LS101sig70c35lux was much lower than in the cecum (~1–2 log difference in CFU/g). The yolk sac membrane resembles the intestinal epithelium with microfold for nutrient transport during embryonic stages. The absorptive function rapidly decreases after hatch, but the residual yolk material gets transported through the yolk stalk to the jejunoileal junction (24). This short channel will also provide the opportunity for bacteria to enter the yolk from the jejunum. SEn reached detectable levels to be visualized by BLI on day 4 p.i in most of the orally gavaged birds (Figures 6, 9A) and was not detected in any of the unchallenged birds examined (Figure 11). In parallel, an experiment from our previous study provided evidence that yolk sac infection was not visualized prior to day 2 p.i. by LS101sig70c35 [Supplementary Figure 4 of (21)]. The passage of the yolk stalk gets partially occluded by lymphocyte proliferation minimizing the transfer of material between the yolk and the jejunum (25). Altogether, it is highly likely that SEn had translocated from the intestine (at the jejunoileal junction) to the yolk material between days 1 and 3 p.i. and replicated to >106 CFU/g by day 4 p.i. to be visualized.
Incidences of yolk sac infection with different Salmonella serovars has been reported and led to yolk sac retention in commercial broilers (26). Recently, it has been shown that oral inculcation of E. coli (9.5 ×10² CFU/bird) was able to cause yolk sac infection with a mean value of 144 CFU/g of on day 2 p.i and persisted up to day 14 (mean value 104 CFU/g) (27). Oral inoculation of Salmonella Heidelberg (SHb) and SEn (phage type 4) in day-old SPF chicks resulted in lesions due to yolk sac infection on days 7 (SHb and SEn) and 14 p.i (SHb) (28). However, quantification of the Salmonella burden in the yolk sac has not been reported in the study (28). In the same study, the SEn strains did not appear to cause yolk sac-associated lesions as early as day 2 p.i., but the experiment was not designed to asses any presence of Salmonella (28). Our data support that the yolk sac can act as a colonization niche for Salmonella following oral infection, which can replicate to a level of detection by BLI on day 4 p.i. Future studies are warranted whether oral challenge of SEn can cause clinical manifestations and lesions linked to yolk sac infection. Intra-navel inoculation of avian pathogenic E. coli (APEC) strains has been the popular method for developing yolk sac infection-associated mortality and lesions to test therapeutics (29, 30). The model has many merits such as requirement of low challenge dose and reproducibility of clinical signs, lesions associated with yolk sac infections. In fact, an unhealed navel is considered a major route of infection along with defects in hatchery practices. However, we caution that in a healthy flock population, the oral route of infection will play a major role in disease pathogenesis and birds will be susceptible to yolk sac infection between days 1 and 4 post hatch. Virulence determinants of Salmonella serovars in causing yolk sac infection have not been thoroughly investigated and research on this avenue will facilitate the discovery of potential therapeutics against the ever-growing number of Salmonella serovars but should not be limited to Salmonella.
Mutant strains carrying the reporter (sig70c35 lux) facilitated the characterization of SEn within the gastrointestinal tract as well as in extraintestinal tissues such as yolk sac. Imaging data (Figure 6) and the bacterial quantification of the cecal material (Figure 7A) confirmed that cecum colonization was not affected by deletion of each gene alone. However, birds that were imaged on day 5 p.i. infected with Δfur were not able to produce detectable photons, indicating a colonization defect that did not correlate with the actual colony count (Figure 8). It is plausible that in a Δfur background, transcription of most of essential genes may not be regulated by sigma 70 factors. Deletion of ferric uptake regulators will directly interfere with normal iron hemostasis in the bacterium and further inhibit the activation of some detoxification mechanisms against reactive oxygen and nitrogen species. Therefore, we hypothesize that in a fur mutant background SEn may undergo a stressed condition in coping with the cecal environment, which in turn activates alternative sigma factors to drive metabolism and survival.
In contrast to the cecum, signal localization in yolk sacs infected with isogenic mutants showed a positive correlation with bacterial load. The lack of photonic detection from the yolk sacs of birds infected with ΔSPI-1 on days 4 and 5 p.i (Figure 6) was in agreement with the fact that we did not harbor SEn by direct plating (Figures 7B, 8). There was a significant difference in cecal colonization level on day 5 p.i, as none of the yolk sacs had colony counts by direct plating (Figure 7B). SPI-1 is a 40-kb size locus encoding mainly genes related to the type 3 secretion system-1 (T3SS-1) apparatus and effectors secreted through T3SS-1. It is well known that effectors secreted through T3SS-1 trigger actin polymerization of the host cell and facilitate invasion into vertebrate cells. The locus also bears a metal uptake system encoded by sitABCD. This is the first report to show that the SPI-1 of a Salmonella serovar contributes to yolk sac colonization after oral infection in chickens. It has been previously hypothesized that high SPI-1 expression during growth of SEn in egg yolk can potentiate virulence (31). Experimental evidence whether egg yolk conditions enhance induction of SPI-1 is currently unknown. The exact mechanism of how the SPI-1 locus contributes to yolk sac infection and colonization remains to be investigated. We suggest that SPI-1 might aid in effective colonization and replication in the jejunum, which induces more bacteria to swim toward the egg yolk. However, all the birds that were below the detection limit by direct plating remained 100% positive after yolk enrichments on day 5 p.i. (Figure 7C).
Furthermore, the enrichment data showed that Δfur led to significant lower infectivity of yolk sac on day 5 p.i compared to the wild-type strain (Figure 7C). In parallel, the BLI of Δfur-challenged birds did not show detectable photonic signals from the yolk sacs on day 5 p.i. (Figure 6). Deletion of the global iron regulator will enhance iron uptake because fur acts as a repressor for iron uptake systems. However, retractable iron influx will generate reactive oxygen species through the Fenton reaction that is toxic to bacterial cells. The number of superoxide dismutation enzymes is regulated by Fur (18), hence Δfur may be more susceptible to killing by reactive oxygen species (ROS). It is currently unknown which mechanisms may be behind this phenomenon and how Fur is involved in yolk sac infection and colonization. Our data suggested that deletion of fur significantly affects colonization in the yolk sac, which is in contrast to the situation in the cecum because the bacterial burden in the cecum was not affected. Yolk sac infection with a SEn strain devoid of functional TonB-dependent systems also showed a trend in reduction of yolk sac infection on day 5 p.i (Figure 7C). A mutation of tonB completely blocks internalization of Fe3+ siderophores from the environment. Almost all ferric iron can be bound to a ligand or proteins in the host. It is known that yolk contains ovotransferrin and lactoferrin, which can strongly bind ferric iron; hence, secretion of high affinity Fe3+ chelators such as enterobactin and salmochelin will be advantageous for growing efficiently in yolk. Summarily, ferric uptake will be involved in colonization of the intestinal milieu that facilitates migration of Salmonella from the jejunoileal junction to yolk. Since mutations of tonB have a pleotropic effect not limited to ferric uptake, future experiments are warranted using specific mutations in siderophore secretion (ΔentB and ΔiroB) to delineate the role of enterobactin and salmochelin in yolk sac infection by SEn. However, we suggest that recent advancements in vaccination strategy to induce high titers of anti-siderophore antibodies in eggs of layers (IgY) will constitute a promising avenue to protect chickens against yolk sac infection by SEn (32).
The blue shift in the “Lump. Lux” construct described in this study (Figure 4C) is mediated by excitation of a noncovalently bound fluorophore, 6,7-dimethyl-8-ribityllumazine (DMRL/lumazine) in the LumP, which interacts closely with luciferase and luciferin; however, a mechanistic view on obtaining a relatively high quantum yield is unknown (15, 33). Genes encoding the LumP are naturally present in Photobacterium species in opposite direction to the lux operon under the same promoter. In these species, the rib operon (riboflavin synthesis) is transcribed with the lux operon to ensure the supply of FMN (riboflavin-5'-phosphate) and DMRL molecules to the light-emitting reaction (34). In contrast, Photorhabdus lacks a coding sequence for the LumP, and the rib operon is not co-transcribed with the lux operon. Here, we showed that co-transcription of lump from Photobacterium leiognathi and the lux operon from Photorhabdus luminescens not only shifted the wavelength but also increased the signal intensity (Figure 4). This was possible because luciferases from various luminous bacteria have high sequence homology between each other (35). The in vitro detection limit of SEn carrying the sig70c35 lump.lux was improved by ~1 dilution (two-fold) compared to the original construct (sig70c35 lux; Figure 5) and followed a similar trend in vivo by improving the limit of detection to ~107 CFU/g (Supplementary Table 1). Future experiments are needed to accurately determine the detection limit. We suggest the improved reporter module (lump.lux) has more implication in gene regulation/ expression studies than expressing them constitutively. We assume that the constitutive expression of both lump and lux may have a fitness cost in replication of Salmonella in extraintestinal niches. For example, most of the birds infected with LS101sig70c35lump.lux did not show a detectable level of photons from the yolk sac compared to those infected with LS101sig70c35lux on days 4 and 5 p.i. (Figure 11). The median value of SEn concentration in the liver and spleen infected with LS101sig70c35lump.lux was <104 CFU/g of tissues, which was lower than the concentration of LS101sig70c35lux in the infected birds (>104 CFU/g; Supplementary Figure 2B). In contrast, cecal colonization level among infected groups by each reporter was comparable (Figure 11). In the future, co-infection experiments are needed to analyze any fitness cost associated with the need to constitutively express bioluminescent reporters in day-old chickens.
In summary, our effort to track SEn infection with the help of BLI facilitated the understanding of a colonization event and allowed for localization of signals in the gastrointestinal tract. This was enabled by ex vivo imaging of the excised gastrointestinal tract. Detection of bioluminescent signals emitted from the gastrointestinal tract from intact birds was not possible. This is largely because of anatomical barriers that absorb or block the light traversing to the surface. Bacterial bioluminescence has the potential to be improved by transfer of energy to a linked fluorescent molecule. As a proof of concept, co-transcription of the lux operon with lump boosted the signal strength without any need of a linker. The improved light-emitting module called sig70c35 lump.lux can be used in gene expression analysis in the future because of improved detection as determined by in vitro culture. For the first time, yolk sac infection was visualized by BLI during SEn infection after oral uptake. The anatomical location of the yolk sac may favor visualization of bioluminescent bacteria by live imaging during yolk sac infection. In an event of clinical manifestation, an enlarged yolk sac can move toward a more ventral-dorsal position side close to the skin, alleviating the blockage from the intestines and pectoral muscle. This, in turn, will facilitate photonic detection from the ventral side of the birds. Among putative virulence determinants, mutations in SPI-1, fur, and tonB showed clear trends in decrease in colonization, which were correlated with the lack of detectable photons. However, the exact mechanisms on how each of these factors contribute to yolk sac infection remain to be fully elucidated.
Salmonella enterica ssp. enterica serovar Enteritidis strains Sal18, LS101, and LS183 were used in this study. All the strains are poultry isolates recovered during Salmonella outbreaks in Canada. Regarding Sal18, numerous studies have been performed and published from our laboratory. The virulence potential of LS101 and LS183 was tested in a separate co-infection trial using 3-week-old birds (unpublished data). We found that both LS101 and LS183 showed higher potential for systemic infection and persistence than Sal18, measured as increased prevalence in the liver and spleen of orally challenged chickens. Some of the cloning experiments were performed on E. coli DH10B (pCS26-Cmr) or E. coli CC118 (pUC18R6K-mini-Tn7T-Cbr) provided by Aaron P White VIDO from University of Saskatchewan. Plasmid purification was performed using a Qiagen MiniPrep kit according to the manufacturer's guidelines. All the cloning strains were inoculated from frozen stocks into a Luria Bertani (LB) agar supplemented with appropriate antibiotics (Cm, chloramphenicol 9 or 34 μg/ml; Cb, carbenicillin, 50 μg/ml). A complete list of the bacterial strains and plasmid used in this study can be found in Supplementary Table 2.
Luciferase expression assays were conducted as described previously using a Victor V3 multilabel plate reader (Perkin-Elmer) (11). Here, the expression of the lux operon was measured by means of intensity of light signal. Briefly, overnight cultures of E. coli or S. Enteritidis strains carrying luxCDABE expressed under a constitutive sigma promoter were diluted 1:600 in an LB broth to a final volume of 150 μl (with or without antibiotics) on 96-well clear-bottom black plates (9520 Costar; Corning Inc.). The culture in each well was overlaid with 50 μl of mineral oil prior to the luciferase assays. The plate reader measured the absorbance (580 nm, 0.1s), luminescence (1s, counts per second CPSs) every 30 min during growth at 37°C with agitation.
Salmonella Enteritidis challenges were prepared from a frozen stock propagated on LB plates with an appropriate antibiotic (Cm 34 μg/ml). Single colonies were grown overnight in 5 ml LB medium at 37°C with agitation. Overnight cultures were then subcultured in LB at 37°C with agitation to gain an OD of 0.7 (2 ×10⁸ CFU/ml). Cells were harvested by rotation at 7,000 rpm and 37°C and resuspended in 1XPBS (Gibco, PH-7.2).
The method is based on the mintn7T transposon system described by Shivak et al. (11). Briefly, pHSG415 (12kb) and temperature-sensitive plasmid (helper vector) encoding transposon genes (tns-ABCD) were electroporated into SEn strains. Successful transformants were grown from LB plates supplemented with carbenicillin (50 μg/ml) at 30°C. Electro competent cells harboring pHSG415-tnsABCD were prepared to be used for electroporation with pUC18R6K-mini-Tn7T (delivery vector contained the sig70c35 luxCDABE). Following recovery in the SOC medium, bacterial cells were agitated at 30°C for another 1.5 h to facilitate integration of the lux operon at high frequency into the attTn7 site of bacteria by transposition. Then, the cells were recovered on Cm (9 μg/ml) LB agar plates at 37° overnight to remove the temperature-sensitive pHSG415. Colonies were imaged with IVIS Lumina II for light production and further confirmed by PCR using primers described previously (11). A complete list of the primers used in this study is shown in Supplementary Table 3.
A genetic fragment containing lump (P. leiognathi) was amplified using the Taq polymerase from the plasmid pSKB3-GBD-Lump (36) purchased from addgene (cat: 65894), and cloned into the pGEM T vector (Promega). A forward primer was designed to contain a BglII overhang plus a Shine-Dalgarno sequence for ribosome binding (Supplementary Table 3). The reverse primer included two stop codons and was flanked by BamHI (Supplementary Table 3). Both the BamHI and BglII enzymes recognize similar palindromic sequences (GGATCT and AGATCT respectively) and digestion will result in exact same overhangs. The amplicon was digested with BamHI and BglII to ligate into pCS26-Cmrsig70c35 lux(DH10B E coli), which was linearized by digestion of BamHI. Successful ligation of lump was screened by colony PCR using the pZE05 and pZE06 primers (Supplementary Table 3). The ligation resulted in two orientations of lump. Only forward orientation compatible with transcription by the sig70c35 promoter was selected by performing enzyme digestion using BamHI and XhoI (band patterns 9,567 and 776 bp). Plasmids were also sequenced from the pZE05 and pZE06 primers (Sanger sequencing at Plant Biotechnology Institute, University of Saskatchewan). The resulting pCS26-Cmr sig70c35 lump.lux plasmid was digested with the PacI enzyme and the reporter construct (~8.7 kb; Cmr sig70c35 lump.lux) was ligated into the PacI-digested pUC18R6K-mini-Tn7T (empty vector, modified to have a PacI restriction site; Cbr). Potential clones were selected by growth on LB agar supplemented with 50 μg/ml Cb and 9 μg/ml Cm. Ligation into the mini-Tn7T vector generated two orientations of the reporter, but reverse orientation was selected (direction of the transcription occurs Tn7 left to Tn7 right). To confirm that the constructs were ligated in the desired orientation, plasmids were digested with NotI -HF, XbaI, and EcoRV-HF, visualized, and resulted in a band pattern from agarose gel electrophoresis. The most prominent bands of ~4, ~3.8, and ~1.6 kb visualized in 1% agarose gel confirmed the reverse orientation.
The Lambda Red system, which was described by Datsenko et al. (37), was utilized to create gene knockouts and replacement by an antibiotic marker (refer to Table 1 for the description of selected genes). Briefly, strain LS101 was transformed with temperature-sensitive pKD46, which encoded red recombinase enzymes ⋎, β, and exo induced under L-arabinose. Fresh electro-competent cells containing pKD46 (50 μl of aliquots, induced by L-arabinose) were made to be used for subsequent transformation of PCR products for gene replacement. Primers were designed based on the complete genome sequence of a PT4 Salmonella enterica subsp. enterica serovar Enteritidis strain deposited in NCBI (NC_011294) (38). The PCR products generated by gene replacement had the Cm marker from the pKD3 flanked by a flippase recognition sequence and a 49-nucleotide homology extension of the gene of interest. Gel-purified PCR products (100–500 ng) were electroporated into LS101.pKD46 cells and cells recovered in an SOC medium at 37/30°C for 2–3 h and plated in 9 μg/ml of Cm. Cells of colonies containing the anticipated mutations were subjected to PCR, and PCR products were sequenced for further verification. The Cm marker was cured with pCP20 after transformation with the pCP20 plasmid (39, 40).
SPF eggs were purchased from Charles River Laboratories and incubated until the hatched at the VIDO animal facility. All the birds were raised at the VIDO-animal care facility in direct accordance with guidelines drafted by the University of Saskatchewan's Animal Care Committee (UACC) under Canadian Council on Animal Care (CCAC). On the day of hatch, swabs were collected to check for any Salmonella contamination before transferring the animals to separate rooms. The birds were not caged and had access to litter. Ad libitum feed and water were provided.
One-day old SPF birds were raised in three different rings in a room to accommodate three different concentration of challenge doses assigned to each group. Each group had 5 healthy birds before the challenge. Three doses of SEn strain Sal18 was prepared: ~2 ×10⁵, ~2 ×10⁷, and ~2 ×10⁹ CFU/ml. One-day old birds were orally gavaged with 0.5 ml of the assigned dose of Sal18. One bird from each group was euthanized at 2, 4, 8, and 24 h p.i., and BLI was performed. Samples from the liver (part of the liver) and spleen (whole organ) and cecal contents were weighed and homogenized (only liver and spleen) in saline (0.85% sodium chloride), and serial dilutions were plated onto brilliant green agar plates (BGA) to determine bacterial counts. In addition, aliquots from homogenates from the liver and spleen were enriched by incubation in a selenite broth overnight at 37°C. The enriched samples were streaked onto BGA to single colonies to determine whether they contained each Salmonella strain inoculated.
After hatch, eight to nine birds were assigned to six different rooms before the oral challenge with generated five mutant strains of LS101 carrying the reporter sig70c35 lux. One-day-old SPF birds from each room was orally challenged with 109 CFU from one mutant strain, which was assigned to the room. One group was challenged with the wild-type strain carrying the reporter sig70c35lux. Birds were euthanized for BLI and sampling. On days 4 and 5 p.i., BLI was performed before tissue samples were collected for bacterial enumeration. Two birds/room were randomly picked for BLI on each day. Liver, spleen, and cecal materials were collected as stated in the animal trial for bacterial enumeration on days 4 and 5 p.i. Apart from that, any other tissue with prominent signals was collected for enumeration. In our study, the yolk material was collected for bacterial quantification by direct plating.
One-day old SPF birds were assigned into two groups and raised in two separate rooms. One group of birds was assigned to be infected with the LS101sig70c35lux strain; nine of the 16 birds in this group was orally gavaged (109 CFU/bird) with the LS101sig70c35lux strain, and the remaining seven birds remained unchallenged and comingled with other infected birds. The second group of birds was assigned to be challenged with the LS101sig70c35lump.lux strain; 12 of the 16 birds from this group was orally gavaged (109 CFU/bird) with the LS101sig70c35lump.lux strain, and the remaining four remained unchallenged. BLI and sampling were performed on days and 5 p.i. The BLI and sampling procedure was same as in animal trial two except for some differences. In this experiment, all the birds were subjected to BLI at the end of the trial. Only selected yolk materials were enumerated for bacterial quantification.
First, a whole bird was imaged after being positioned to capture any surface signal emitted from the gastrointestinal tract through the skin. After that, laparotomy was performed to excise the gastrointestinal tract to be laid out on a large Petri dish to visualize the signal emitted from the surface of the organ. After initializing the instrument (IVIS Lumina II by Caliper Life science), the bioluminescent setting was selected (Filter-open). To maximize the capture of low bioluminescent signals, the size of the aperture was set to 1 (f = 1). In the first experiment, photons were detected by auto exposure settings (maximum 60 s). The next couple of animal exposures was set at 30 s with medium binning to create the images. The total photon count emitted from each cecal compartment or yolk sac was measured using the region of interest tool (ROI) provided by the Living imaging software (version 4.0). The region of interest was selected by drawing exact boundaries around the organ using the free drawing tool.
A statistical data analysis was conducted using the GraphPad Prism software version 8.4.2 under the institutional license provided to Vaccine and Infectious Disease Organization. Non-parametric tests were conducted to select an appropriate test method because the data were not normally distributed. Mean comparison of the colony counts between the wild type and the mutant was performed by the Kruskal–Wallis test. The Mann–Whitney was conducted to compare the median difference when mentioned. The Fisher's exact test was conducted to analyze enrichment data using fractions of infected and noninfected birds. The statistical significance of all the methods was set at p = 0.05.
The datasets presented in this study can be found in online repositories. The names of the repository/repositories and accession number(s) can be found in the article/Supplementary material.
The animal study was reviewed and approved by University of Saskatchewan's Animal Care Committee (UACC).
DW and WK designed the study and wrote the manuscript. DW, P-KL, and WK collected the experimental data and analyzed the data. BA and AW discussed the data and edited the manuscript. All authors contributed to the article and approved the submitted version.
This work was supported by Alberta Agriculture and Forestry (2018F145R), Chicken Farmers of Saskatchewan (KOE2018002), Egg Farmers of Alberta (2018F145R), Canadian Poultry Research Council (KOE2018002), and Chicken Farmers of Canada (1433-19). Financial support to DW was provided by the Devolved scholarship granted by the department of Veterinary Microbiology- WCVM.
The authors declare that the research was conducted in the absence of any commercial or financial relationships that could be construed as a potential conflict of interest.
All claims expressed in this article are solely those of the authors and do not necessarily represent those of their affiliated organizations, or those of the publisher, the editors and the reviewers. Any product that may be evaluated in this article, or claim that may be made by its manufacturer, is not guaranteed or endorsed by the publisher.
We are indebted to Colette Wheler and all members of the VIDO Clinical Research and Animal Care facility for the support and excellent expertise regarding all aspects of the chicken trials. We thank Heather Wilson for the fruitful discussions and technical advice. The study in the laboratory of WK was supported through funds from Chicken Farmers of Canada (CFC), Canadian Poultry Research Council (CPRC), The Saskatchewan Chicken Industry Development Fund (SCIDF), Canadian Poultry Research Council/Agri-Food (Canada), Egg Farmers of Alberta (EFA), The Department of Alberta Agriculture and Forestry (AAF), The Saskatchewan Ministry of Agriculture–Agriculture Development Fund (ADF), and Egg Farmers of Canada (EFC). VIDO receives operational funding from the government of Saskatchewan through Innovation Saskatchewan and the Ministry of Agriculture and from the Canada Foundation for Innovation through the Major Science Initiatives for its CL3 facility. This report was published with the permission of the Director of VIDO.
The Supplementary Material for this article can be found online at: https://www.frontiersin.org/articles/10.3389/fvets.2022.948448/full#supplementary-material
1. Badr CE. Bioluminescence imaging: basics and practical limitations. Bioluminescent Imaging. (2014) 1098:1–18. doi: 10.1007/978-1-62703-718-1_1
2. Meighen EA. Molecular biology of bacterial bioluminescence. Microbiol Rev. (1991) 55:123–42. doi: 10.1128/mr.55.1.123-142.1991
3. Lee J, Müller F, Visser AJ. The sensitized bioluminescence mechanism of bacterial luciferase. Photochem Photobiol. (2019) 95:679–704. doi: 10.1111/php.13063
4. Abbas CA, Sibirny AA. Genetic control of biosynthesis and transport of riboflavin and flavin nucleotides and construction of robust biotechnological producers. Microbiol Mol Biol Rev. (2011) 75:321–60. doi: 10.1128/MMBR.00030-10
5. Contag CH, Contag PR, Mullins JI, Spilman SD, Stevenson DK, Benaron DA, et al. Photonic detection of bacterial pathogens in living hosts. Mol Microbiol. (1995) 18:593–603. doi: 10.1111/j.1365-2958.1995.mmi_18040593.x
6. Wellawa DH, Allan B, White AP, Köster W. Iron-uptake systems of chicken-associated Salmonella serovars and their role in colonizing the avian host. Microorganisms. (2020) 8:1203. doi: 10.3390/microorganisms8081203
7. Foley SL, Johnson TJ, Ricke SC, Nayak R, Danzeisen J. Salmonella pathogenicity and host adaptation in chicken-associated serovars. Microbiol Mol Biol Rev. (2013) 77:582–607. doi: 10.1128/MMBR.00015-13
8. Li S, He Y, Mann DA, Deng X. Global spread of Salmonella Enteritidis via centralized sourcing and international trade of poultry breeding stocks. Nat Commun. (2021) 12:1–12. doi: 10.1038/s41467-021-25319-7
9. Taylor MC, Ward TH. Pathogen imaging applications. Methods. (2017) 127:1–2. doi: 10.1016/j.ymeth.2017.08.011
10. Doyle TC, Burns SM, Contag CH. Technoreview: in vivo bioluminescence imaging for integrated studies of infection. Cell Microbiol. (2004) 6:303–17. doi: 10.1111/j.1462-5822.2004.00378.x
11. Shivak DJ, MacKenzie KD, Watson NL, Pasternak JA, Jones BD, Wang Y, et al. A modular, Tn 7-based system for making bioluminescent or fluorescent Salmonella and Escherichia coli strains. Appl Environ Microbiol. (2016) 82:4931–43. doi: 10.1128/AEM.01346-16
12. Feklístov A, Sharon BD, Darst SA, Gross CA. Bacterial sigma factors: a historical, structural, and genomic perspective. Annu Rev Microbiol. (2014) 68:357–76. doi: 10.1146/annurev-micro-092412-155737
13. Svihus B, Hetland H, Choct M, Sundby F. Passage rate through the anterior digestive tract of broiler chickens fed on diets with ground and whole wheat. Br Poult Sci. (2002) 43:662–8. doi: 10.1080/0007166021000025037
14. O'Kane DJ, Karle VA, Lee J. Purification of lumazine proteins from Photobacterium leiognathi and Photobacterium phosphoreum: bioluminescence properties. Biochemistry. (1985) 24:1461–7. doi: 10.1021/bi00327a026
15. Sato Y, Shimizu S, Ohtaki A, Noguchi K, Miyatake H, Dohmae N, et al. Crystal structures of the lumazine protein from Photobacterium kishitanii in complexes with the authentic chromophore, 6, 7-dimethyl-8-(1′-D-ribityl) lumazine, and its analogues, riboflavin and flavin mononucleotide, at high resolution. J Bacteriol. (2010) 192:127–33. doi: 10.1128/JB.01015-09
16. Lostroh CP, Lee CA. The Salmonella pathogenicity island-1 type III secretion system. Microbes Infect. (2001) 3:1281–91. doi: 10.1016/S1286-4579(01)01488-5
17. Lambert MA, Smith SG. The PagN protein of Salmonella enterica serovar Typhimurium is an adhesin and invasin. BMC Microbiol. (2008) 8:142. doi: 10.1186/1471-2180-8-142
18. Hassan HM, Troxell B. Transcriptional regulation by Ferric Uptake Regulator (Fur) in pathogenic bacteria. Front Cell Infect Microbiol. (2013) 3:59. doi: 10.3389/fcimb.2013.00059
19. Postle K. TonB protein and energy transduction between membranes. J Bioenerg Biomembr. (1993) 25:591–601.
20. Harvey P, Watson M, Hulme S, Jones M, Lovell M, Berchieri Jr A, et al. Salmonella enterica serovar typhimurium colonizing the lumen of the chicken intestine grows slowly and upregulates a unique set of virulence and metabolism genes. Infect Immun. (2011) 79:4105–21. doi: 10.1128/IAI.01390-10
21. Wellawa DH, Lam P-KS, White AP, Gomis S, Allan B, Köster WL, et al. High affinity iron acquisition systems facilitate but are not essential for colonization of chickens by Salmonella Enteritidis. Front Microbiol. (2022) 280:824052. doi: 10.3389/fmicb.2022.824052
22. Rimet C-S, Maurer JJ, Pickler L, Stabler L, Johnson KK, Berghaus RD, et al. Salmonella harborage sites in infected poultry that may contribute to contamination of ground meat. Front Sustain Food Syst. (2019) 3:2. doi: 10.3389/fsufs.2019.00002
23. Burns-Guydish SM, Olomu IN, Zhao H, Wong RJ, Stevenson DK, Contag CH, et al. Monitoring age-related susceptibility of young mice to oral Salmonella enterica serovar Typhimurium infection using an in vivo murine model. Pediatr Res. (2005) 58:153–8. doi: 10.1203/01.PDR.0000157725.44213.C4
24. van der Wagt I, Jong dE, Mitchell IC, Molenaar MA, van den Brand RH. A review on yolk sac utilization in poultry. Poultry Sci. (2020) 99:2162–75. doi: 10.1016/j.psj.2019.11.041
25. Noy Y, Uni Z, Sklan D. Routes of yolk utilisation in the newly-hatched chick. Br Poult Sci. (1996) 37:987–96. doi: 10.1080/00071669608417929
26. Cox N, Richardson L, Buhr R, Northcutt J, Fedorka-Cray P, Bailey J, et al. Natural occurrence of Campylobacter species, Salmonella serovars, and other bacteria in unabsorbed yolks of market-age commercial broilers. J Appl Poult Res. (2006) 15:551–7. doi: 10.1093/japr/15.4.551
27. Chasser K, McGovern K, Duff A, Graham B, Briggs W, Rodrigues D, et al. Evaluation of day of hatch exposure to various Enterobacteriaceae on inducing gastrointestinal inflammation in chicks through two weeks of age. Poult Sci. (2021) 100:101193. doi: 10.1016/j.psj.2021.101193
28. Roy P, Dhillon A, Shivaprasad H, Schaberg D, Bandli D, Johnson S, et al. Pathogenicity of different serogroups of avian salmonellae in specific-pathogen-free chickens. Avian Dis. (2001) 45:922–937. doi: 10.2307/1592871
29. Allan B, Wheler C, Köster W, Sarfraz M, Potter A, Gerdts V, et al. In ovo administration of innate immune stimulants and protection from early chick mortalities due to yolk sac infection. Avian Dis. (2018) 62:316–21. doi: 10.1637/11840-041218-Reg.1
30. Nguyen TTT, Allan B, Wheler C, Köster W, Gerdts V, Dar A, et al. Avian antimicrobial peptides: in vitro and in ovo characterization and protection from early chick mortality caused by yolk sac infection. Sci Rep. (2021) 11:1–14. doi: 10.1038/s41598-021-81734-2
31. Moreau MR, Wijetunge DSS, Bailey ML, Gongati SR, Goodfield LL, Hewage EMKK, et al. Growth in egg yolk enhances Salmonella Enteritidis colonization and virulence in a mouse model of human colitis. PLoS ONE. (2016) 11:e0150258. doi: 10.1371/journal.pone.0150258
32. Zeng X, Wang H, Huang C, Logue CM, Barbieri NL, Nolan LK, et al. Evaluation of the immunogenic response of a novel enterobactin conjugate vaccine in chickens for the production of enterobactin-specific egg yolk antibodies. Front Immunol. (2021) 12:779. doi: 10.3389/fimmu.2021.629480
33. Lee J. Lumazine protein and the excitation mechanism in bacterial bioluminescence. Biophys Chem. (1993) 48:149–58. doi: 10.1016/0301-4622(93)85006-4
34. Ast JC, Urbanczyk H, Dunlap PV. Natural merodiploidy of the lux-rib operon of Photobacterium leiognathi from coastal waters of Honshu, Japan. J Bacteriol. (2007) 189:6148–58. doi: 10.1128/JB.00672-07
35. Delroisse J, Duchatelet L, Flammang P, Mallefet J. Leaving the dark side? Insights into the evolution of luciferases. Front Marine Sci. (2021) 690:673620. doi: 10.3389/fmars.2021.673620
36. Hoepker AC, Wang A, Le Marois A, Suhling K, Yan Y, Marriott G, et al. Genetically encoded sensors of protein hydrodynamics and molecular proximity. Proc Nat Acad Sci USA. (2015) 112:E2569–74. doi: 10.1073/pnas.1424021112
37. Datsenko KA, Wanner BL. One-step inactivation of chromosomal genes in Escherichia coli K-12 using PCR products. Proc Nat Acad Sci USA. (2000) 97:6640–5. doi: 10.1073/pnas.120163297
38. Thomson NR, Clayton DJ, Windhorst D, Vernikos G, Davidson S, Churcher C, et al. Comparative genome analysis of Salmonella Enteritidis PT4 and Salmonella Gallinarum 287/91 provides insights into evolutionary and host adaptation pathways. Genome Res. (2008) 18:1624–37. doi: 10.1101/gr.077404.108
39. Wisner AL, Desin TS, Koch B, Lam P-KS, Berberov EM, Mickael CS, et al. Salmonella enterica subspecies enterica serovar Enteritidis Salmonella pathogenicity island 2 type III secretion system: role in intestinal colonization of chickens and systemic spread. Microbiology. (2010) 156:2770–81. doi: 10.1099/mic.0.038018-0
Keywords: Salmonella, bioluminescence, lumazine, virulence, yolk sac infection, SPI-1, fur and tonB
Citation: Wellawa DH, Lam P-KS, White AP, Allan B and Köster W (2022) Characterization of colonization kinetics and virulence potential of Salmonella Enteritidis in chickens by photonic detection. Front. Vet. Sci. 9:948448. doi: 10.3389/fvets.2022.948448
Received: 19 May 2022; Accepted: 08 July 2022;
Published: 02 August 2022.
Edited by:
Zuowei Wu, Iowa State University, United StatesReviewed by:
Kenneth James Genovese, Agricultural Research Service (USDA), United StatesCopyright © 2022 Wellawa, Lam, White, Allan and Köster. This is an open-access article distributed under the terms of the Creative Commons Attribution License (CC BY). The use, distribution or reproduction in other forums is permitted, provided the original author(s) and the copyright owner(s) are credited and that the original publication in this journal is cited, in accordance with accepted academic practice. No use, distribution or reproduction is permitted which does not comply with these terms.
*Correspondence: Wolfgang Köster, d29sZmdhbmcua29lc3RlckB1c2Fzay5jYQ==
Disclaimer: All claims expressed in this article are solely those of the authors and do not necessarily represent those of their affiliated organizations, or those of the publisher, the editors and the reviewers. Any product that may be evaluated in this article or claim that may be made by its manufacturer is not guaranteed or endorsed by the publisher.
Research integrity at Frontiers
Learn more about the work of our research integrity team to safeguard the quality of each article we publish.