 Han Wang1
 Zhonghao Shen1
 Ruihua Huang2
 Ayong Zhao1Jiani Jiang3
 Pinghua Li2
 Xiaolong Zhou1
 Songbai Yang1
 Liming Hou2*
- 1Key Laboratory of Applied Technology on Green-Eco-Healthy Animal Husbandry of Zhejiang Province, Department of Animal Breeding, College of Animal Science and Technology, College of Veterinary Medicine, Zhejiang A&F University, Hangzhou, China
- 2Institute of Swine Science, Department of Animal Breeding, College of Animal Science and Technology, Nanjing Agricultural University, Nanjing, China
- 3Department of Statistical Sciences, University of Toronto, Toronto, ON, Canada
MicroRNAs (miRNAs) are posttranscriptional regulators that play key roles in meat color regulation. Changes in miRNA expression affect their target mRNAs, leading to multifunctional effects on biological processes and phenotypes. In this study, a G > A mutation site located upstream of the precursor miR-22 sequence in Suhuai pigs was significantly correlated with the meat color parameter a*(redness) of the porcine longissimus dorsi (LD) muscle. AA genotype individuals had the highest average meat color a* value and the lowest miR-22 level. When G > A mutation was performed in the miR-22 overexpression vector, miR-22 expression significantly decreased. Considering that Ca2+ homeostasis is closely related to pig meat color, our results further demonstrated that ELOVL6 is a direct target of miR-22 in pigs. The effects of miR-22 on skeletal muscle intracellular Ca2+ were partially caused by the suppression of ELOVL6 expression.
Introduction
MicroRNAs (miRNAs) are posttranscriptional regulators that play key roles in meat color regulation (1). Among these, meat color has a major impact on consumer preference and market price (2). Pig meat color is a complex quantitative trait with low heritability, ranging from 0.14 to 0.25 (3). The International Commission on Illumination (CIE) defined a colorimetric system that is widely used in meat color detection (4). According to CIE, any kind of object color characteristics can be represented by tri-stimulus values (i.e., X, Y, and Z). Through mathematical relationship conversion, the colorimeter converts the original CIE tri-stimulus values into understandable values, such as L* (lightness), a*(redness), and b*(yellowness). Because meat color can only be obtained after slaughter, early breeding for meat color is difficult. Recent advances in porcine genomics studies have applied whole-genome sequencing (WGS) and genome-wide association study (GWAS) to improve our understanding of the genetic regulation of pork meat quality by identifying quantitative trait loci (QTLs), candidate genes, and related genetic variants associated with pork meat quality traits (5). Thus, new tools are being developed to improve pig meat color traits using marker-associated selection (MAS) and genome selection (GS) approaches.
MicroRNAs are posttranscriptional regulators that play key roles in meat color regulation. Genetic variation in miRNA genes can alter precursor miRNA (pre-miRNA) transcription, affecting the processing or stability of pre-miRNA and the expression of mature miRNAs. These changes in turn affect target mRNAs, leading to multifunctional effects on individual phenotypes (6, 7). Genetic mutations in miR-208b and miR-1 precursor genes are significantly associated with pig muscle fiber characteristics and meat color traits (8, 9). The expression of miR-499 is significantly correlated with the expression of myoglobin, which typically reflects meat color (10). However, few studies have explored the mechanism of miRNA involvement in the regulation of pig meat color traits.
MiR-22 is a miRNA that plays key roles in multiple biological processes, including tumor suppression, cancer therapy, and the prevention of cardiac hypertrophy (11). Previous studies have shown that miR-22 inhibits the proliferation of porcine muscle satellite cells (PMSCs) and promotes their differentiation (12). MiR-22 is also involved in the regulation of muscle fiber type conversion via the inhibition of the AMPK-SIRT1-PGC-1α pathway in mouse muscle cells (13). Muscle fiber type is associated with meat color (14), and previous studies have demonstrated that Ca2+ homeostasis affects pig meat color (15, 16).
Through bioinformatics prediction, we discovered that elongase of very-long-chain fatty acids 6 (ELOVL6), an elongase that catalyzes de novo synthesis of fatty acids (17), is a direct potential target gene of miR-22. In our previous study, we showed that ELOVL6 is more highly expressed in white longissimus dorsi (LD) muscle than in red soleus (SOL) muscle (18). In ELOVL6-knockout Drosophila, the proportion of stearic acid in mitochondria was repressed. However, when stearic acid was added to food consumed by Drosophila, stearoylation was promoted, which inhibited the JNK signaling pathway and reduced the ubiquitination of mitochondrial fusion proteins, thereby promoting mitochondrial metabolism and fusion and maintaining its normal function (19). Dysfunction due to the inhibition of mitochondrial fusion decreased the sensitivity of myofibroblasts to Ca2+ action (20). The ELOVL6 gene may affect the concentration of Ca2+ in muscle cells, influencing pig meat color. However, few studies have investigated the involvement of ELOVL6 in muscle cell Ca2+ concentration.
Therefore, we hypothesized the existence of a functional mutation site related to meat color in the precursor sequence gene of porcine miR-22, which regulates Ca2+ concentration in porcine muscle cells by affecting the expression of miR-22. In this study, we explored the role of miR-22 in regulating skeletal muscle intracellular Ca2+ by investigating a mutation site related to pork color in the miR-22 gene. Our findings will provide a useful theoretical basis for future research on genetic markers of pig meat color traits.
Materials and methods
Animals and phenotype measurements
All animal procedures were performed in accordance with the Guidelines for Care and Use of Laboratory Animals of Nanjing Agriculture University and approved by the Animal Ethics Committee of Nanjing Agriculture University. A total of 300 healthy Suhuai pigs (i.e., 194 castrated barrows and 106 sows) with the same market weight (80–90 kg) and approximately 7–8 months old were reared at the Huaiyin Breeding Farm (Huaian, China) under the same feeding conditions and slaughtered at Sushi Meat Products Co., Ltd. (Huaian, China).
Ear tissues from the end of the right ear were collected and stored in 75% alcohol for DNA extraction. Samples of the LD, SOL, psoas major (PM), masseter (MA), and biceps femoris (BF) muscles were collected for RNA extraction from four randomly selected healthy Suhuai pigs with similar body weight and age. LD muscle samples from the last rib of the carcass were collected and used to determine meat color. In China, traditional hot fresh meat is usually marketed immediately after slaughter, whereas chilled fresh meat is often cooled quickly to a stable 0–4°C within 24 h postmortem and maintained at this temperature until sold to the consumer (21). Therefore, meat color (L*a*and b*) was measured on the last rib at 2 (room temperature) and 24 h (4°C) postmortem using a chromameter (Minolta Camera Co., Osaka, Japan).
Cell culture
Porcine muscle satellite cells were isolated as described previously (22). LD muscles of 3-day-old healthy male piglets were disinfected with alcohol and aseptically dissected in vitro. Muscle samples were washed three times with phosphate-buffered saline (PBS) (HyClone, Logan, USA) containing 1% penicillin–streptomycin (Solarbio, Beijing, China), and the skin, fat, and connective tissue were removed. The muscle was crushed into meat paste and digested with 2 ml PBS containing 0.1% collagenase II at 37°C for 10 min. The samples were centrifuged three times at 500 rpm for 5 min each. The cell suspension was sequentially passed through 100 and 40 μm nylon cell filters and a 20 μm mesh filter. The filtrate was collected into a 15 ml centrifuge tube and centrifuged at 1,500 rpm for 10 min, and the supernatant was discarded to obtain the cell pellets. The pellets were washed three times with PBS, added to a Percoll gradient solution, and centrifuged at 2,000 rpm for 1 h. Totally, 26% of the Percoll gradient solution was recovered, which then was cultured in growth medium (GM) and Dulbecco's modified Eagle medium (DMEM; HyClone, Logan, USA) supplemented with 10% fetal bovine serum (FBS) and 1% penicillin–streptomycin (Solarbio, Beijing, China). HEK293T cells and PK15 cells were cultured in 12-well plates in DMEM with 10% FBS and penicillin–streptomycin (50 mg/mL). All cells were incubated at 37°C under 5% CO2.
Isolation of genomic DNA and single-nucleotide polymorphism genotyping
Genomic DNA was isolated from ear tissue using the standard phenol–chloroform protocol method (23). DNA concentration and integrity were measured using a Nanodrop 2000 spectrophotometer (Thermo Fisher Scientific Inc., Waltham, MA, USA). A 688 bp DNA fragment encompassing porcine pre-miR-22 and its flanking sequences was amplified by polymerase chain reaction (PCR) using pooled genomic DNA isolated from eight randomly selected pigs. The primer sequences (miR-22-SNP) are provided in Table 1. Polymorphisms were sequenced by TsingKe Inc. and analyzed using the Chromas software. The NC_010454.4:g.47913559 G > A SNP was selected for genotyping and named according to sequence variation nomenclature guidelines provided by the Human Genome Variation Society. Sequences for the 300 pigs were individually amplified and genotyped by PCR using the miR-22-SNP primers (Table 1).
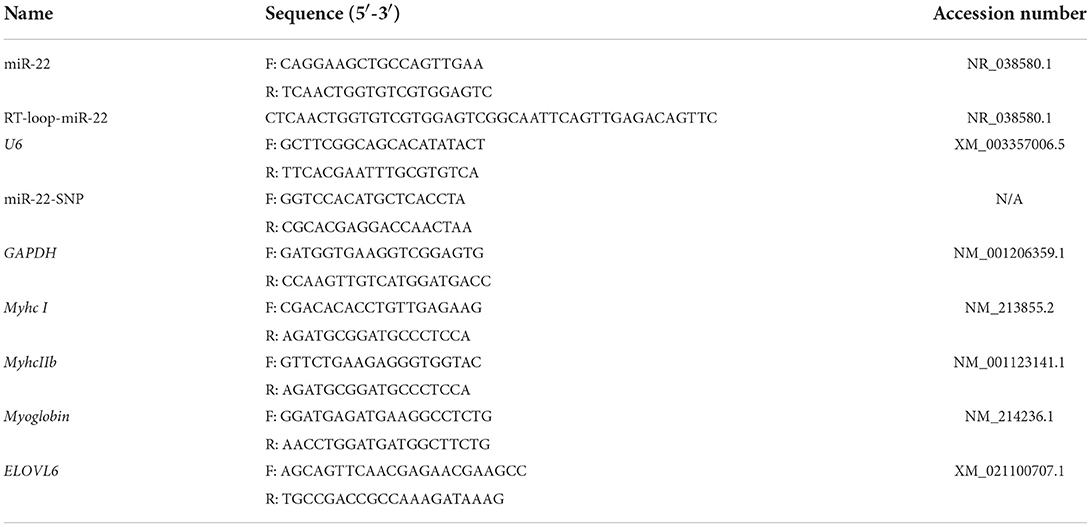
Table 1. The primers used for PCR in this study.
Quantitative reverse transcription PCR
TRIzol reagent was used to extract total RNA (24). Briefly, TRIzol (Invitrogen, Waltham, MA, USA) was added to the culture dish to lyse the cells or tissue in the tubes. Then, 0.2 ml chloroform per 1 ml TRIzol reagent was added, and the samples were incubated at 15–30°C for 2–3 min. Then, the samples were centrifuged for 15 min at 12,000× g at 4°C. Following centrifugation, approximately 0.5 ml of the aqueous phase was transferred to a fresh tube, and 0.5 ml of isopropyl alcohol was added. Samples were incubated at 15–30°C for 10 min and centrifuged at 12,000× g for 10 min at 2–8°C. The supernatant was removed, and the RNA pellet was washed once with 75% ethanol and air-dried for 5–10 min. qRT-PCR analyses were performed as described previously (25). Reverse transcription of miRNA was performed using the RR014a reverse transcription kit (Takara, Kusatsu, Japan). Differential expression was analyzed using the 2−ΔΔCt method (26). U6 and GAPDH were selected as housekeeping genes for miR-22 and protein coding genes, respectively. The primer sequences used in these analyses are provided in Table 1.
Plasmid construction
To construct the pcDNA3.1-miR-22 expression vector, a fragment of the first intron containing the NC_010454.4:g.47913559 G > A SNP and the entire second exon of the miR-22 host gene (TLC-domain containing 2, TLCD2) was amplified and cloned into the pcDNA 3.1 plasmid, which was digested with the EcoRI and XhoI restriction enzymes (Invitrogen). The primer sequences were 5'-GAATTCGGGACCAAGTCAGTTCGG-3′ and 5′-CTCGAGCCAGACTTAGGCAATACAGG-3′. The pcDNA3.1-miR-22 expression point mutant vector was generated using the Mut Express II Fast Mutagenesis kit (Vazyme Biotech Co., Ltd., Nanjing, China). The pcDNA3.1-ELOVL6 expression vector, ELOVL6 Psicheck-2 dual-luciferase reporter, and ELOVL6 point mutant vectors were generated by Tsingke (Hangzhou, China).
RNA oligonucleotides and transfection
MiR-22 mimics, miR-22 mimics NC, miR-22 inhibitor, miR-22 inhibitor NC, small interfering RNA (siRNA) against pig ELOVL6, and the negative control scramble siRNA (NC) were designed and synthesized by RiboBio (Guangzhou, China). The primer sequences are provided in Table 2. The Lipofectamine 3000 system (Invitrogen) was used for transfection according to the manufacturer's instructions.

Table 2. Sequence of RNA oligonucleotides.
Dual-luciferase reporter assay
In 12-well plates, miR-22 or NC mimics (50 nM) were transfected into HEK293T cells with 1 μg Psicheck-2 ELOVL6 luciferase vector (wild-type or mutated) using Lipofectamine 3000. The assays were performed 24 h after transfection according to the manufacturer's instructions (Promega, Madison, WI, USA).
Immunofluorescence staining
Porcine muscle satellite cells were cultured in 12-well cell culture plates with cell slides. When cells reached 70–80% confluence, they were washed three times with precooled PBS for 5 min and fixed with 4% paraformaldehyde for 15 min. Furthermore, the cells were permeabilized with 0.25% Triton X-100 for 10 min, blocked at 4°C overnight, and incubated with anti-Pax7 primary antibody (Abcam, Shanghai, China) or anti-Desmin primary antibody (Abcam, Shanghai, China) for 1 h at room temperature. Then, a fluorescent secondary antibody (Thermo Fisher, Shanghai, China) was incubated with the cells for 1 h at room temperature. We added 4′,6-diamidino-2-phenylindole (DAPI) (Invitrogen) to stain the nuclei, and the cells were incubated for 10 min at room temperature. A fluorescence microscope (Olympus, Tokyo, Japan) was used to observe the samples.
Detection of intracellular calcium concentration
The cells were washed twice with PBS and once with D-Hank's solution. Fura-2/AM (5 μM) was added, and the cells were incubated at 37°C for 30 min. The samples were washed three times and incubated with D-Hank's solution at 37°C for 20–30 min. A fluorescence spectrophotometer with excitation wavelengths of 340 and 380 nm, and an emission wavelength of 510 nm was used to measure R, Fmax, and Fmin, respectively. The following formula was used to calculate intracellular calcium concentration ([Ca2+]i): [Ca2+]i=Kd[R − Rmin)/(Rmax − R)](Fmin/Fmax), where Kd = 224 nmol/L, R is the ratio of fluorescence intensity measured at excitation wavelengths of 340/380 nm, Rmax is the same ratio after adding Triton X-100, and Rmin is the same ratio after adding ethylene glycol tetraacetic acid (EGTA). Fmax and Fmin are the maximum and minimum fluorescence intensities measured at 340 nm after adding Triton X-100 and EGTA, respectively.
Statistical analysis
Association analysis of the SNP for meat color was performed using the PROC GLM procedure in the SAS v9.2 software (SAS Institute Inc., Cary, NC, USA), with both sex and SNP as fixed effects and slaughter age as a covariate (27, 28). Kinship was not taken into account in this statistical model. The associated genotype mean eigenvalues were compared using the Tukey–Kramer program in SAS to detect significant differences. All data were expressed as mean ± standard error of the mean (SEM). Unpaired Student's t-tests were used to calculate P-values using the SPSS v20.0 software (SPSS Inc., Chicago, IL, USA). Significant differences were evaluated at a level of P < 0.05 and highly significant differences at P < 0.01.
Results
Expression profiling of miR-22 in different porcine muscle types
To investigate the expression profile of miR-22 in various muscle types, we performed a qRT-PCR assay. MiR-22 expression was significantly lower in the SOL, PM, and MA muscle than in the LD and BF muscle (P < 0.05) (Figure 1A). Myhc IIb, a marker gene for fast glycolytic muscle fibers (29), was more highly expressed in the LD and BF muscles than in the SOL, PM, and MA muscles (Figure 1B). However, Myhc I, a marker gene for slow oxidative muscle fibers (29), was highly expressed in the SOL and MA muscles (Figure 1C). We also found that myoglobin expression patterns were similar to those of Myhc I in different muscle types (Figure 1D).
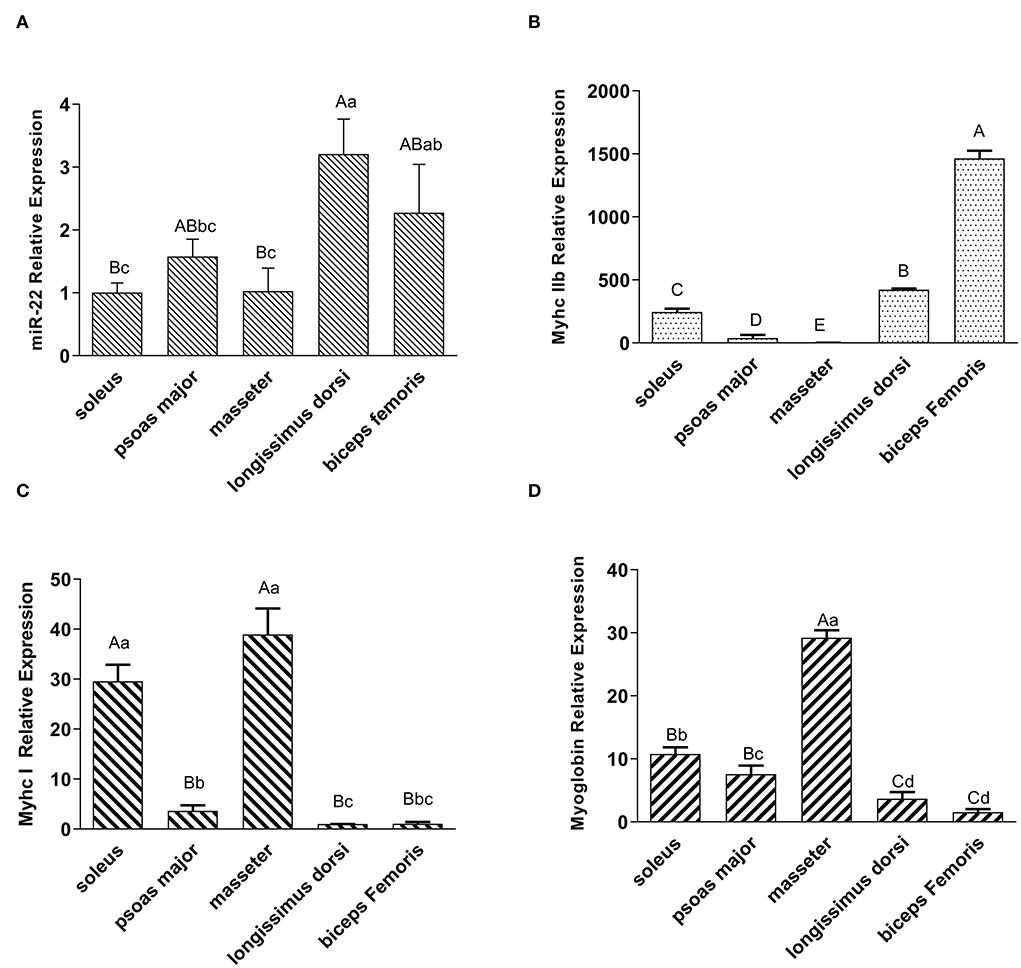
Figure 1. Expression profiling of miR-22, muscle fiber type marker genes, and myoglobin in different types of porcine muscle. (A) Expression of miR-22 in different type of skeletal muscles (i.e., SOL, psoas major, masseter, longissimus dorsi, and biceps femoris) in Suhuai pigs. (B) Expression of the glycolytic type IIb fiber marker gene MyhcIIb in different muscle types. The masseter group was treated as the control group. (C) Expression of oxidized type I fiber marker gene Myhc I in different muscle types. The longissimus dorsi group was treated as the control group. (D) Expression of myoglobin in different types of skeletal muscles. The biceps femoris group was treated as the control group. Capital letters indicate highly significant differences (P < 0.01); lowercase letters indicate significant differences (P < 0.05) (n = 4).
Descriptive statistics for meat color phenotypes
To understand the characteristics of the Suhuai pig population, we performed descriptive statistical analysis of meat color trait values. Mean values of meat color traits in this group were within the normal range, although there was a large difference between the maximum and minimum values (Figures 2A–C). The coefficient of variation for meat color a* reached 28.35% at 24 h postmortem (Table 3) and 25.82% at 2 h postmortem (Table 3). The coefficients of variation for all other meat color parameters were <10% (Table 3). These results indicate that the breeding of Suhuai pig meat color should be studied further.
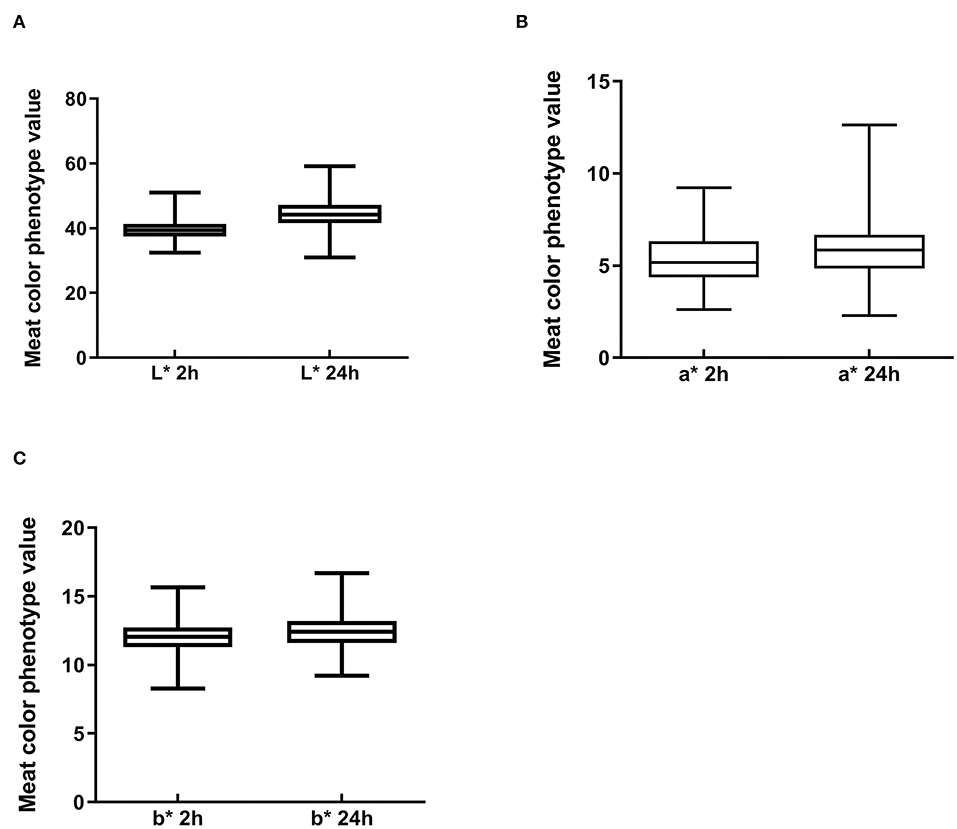
Figure 2. Boxplot of meat color index values in Suhuai pigs at 2 and 24 h after slaughter, including (A) lightness (L*), (B) redness (a*), and (C) yellowness (b*).
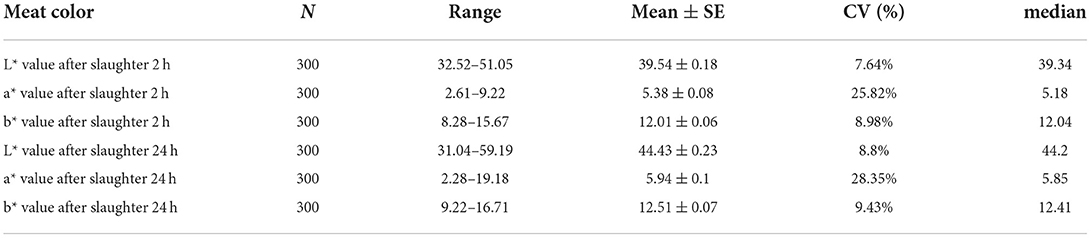
Table 3. Descriptive statistics analysis of meat color traits in 300 Suhuai pigs.
Detection of SNP in the miR-22 gene and association analysis of meat color traits
After sequencing the miR-22 genes of eight Suhuai pigs, we found a G/A mutation at NC_010454.4:g.47913559 (Figure 3A) within the 1st intron of the miR22 host gene (TLCD2), located 147 bp upstream of pre-miR-22 (Figure 3B). After sequencing the 688 bp DNA amplicons of 300 Suhuai pigs, we found 152, 111, and 37 GG, GA, and AA genotype individuals, respectively (Table 4). The frequency of allele G was 0.735 and that of allele C was 0.265 (Table 4). The NC_010454.4:g.47913559 G > A SNP was significantly associated with meat color a* at 2 h postmortem but not with other meat color parameters (Table 5). At 2 h postmortem, the AA genotype had the highest meat color a* value among all genotypes, and a* was higher for the GA genotype than for the GG genotype (Table 5).
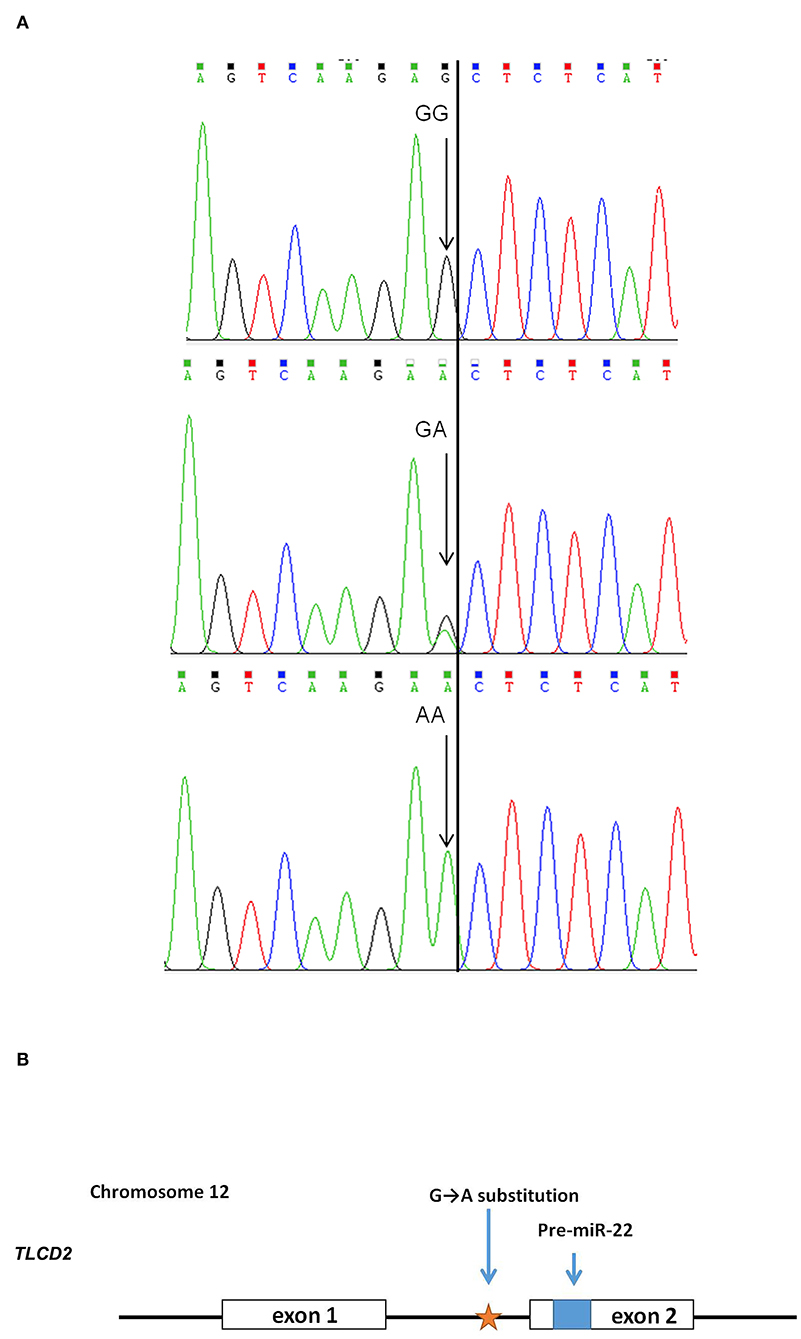
Figure 3. Scheme of the NC_010454.4: g.47913559 G > A mutation in the miR-22 gene. (A) Sequencing peak map of the GG, GA, and AA genotypes. Eight individuals were randomly divided into two groups, and each group of four was mixed for sequencing. Arrow indicates the target site. (B) Positional relationship between the NC_010454.4: g.47913559 site, ssc-miR-22 precursor, and its host gene TLCD 2.
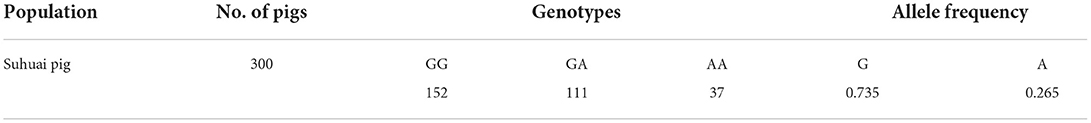
Table 4. Allele frequencies of the G > A substitution of miR-22 primary transcript in the Suhuai pig population.
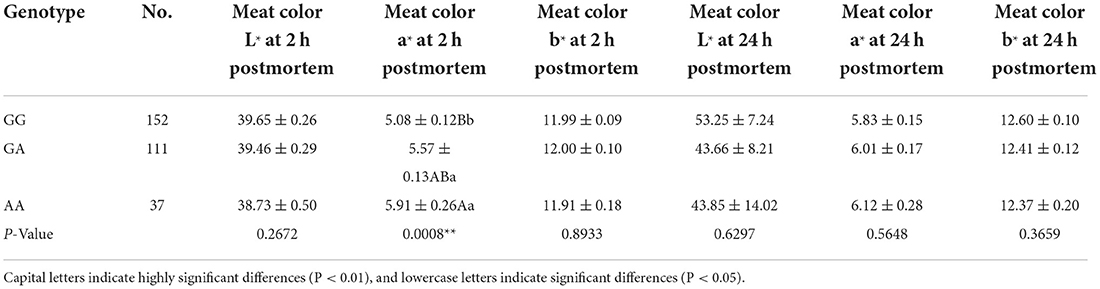
Table 5. Association results for the G > A polymorphism in miR-22 transcript with meat color traits.
Association between miR-22 expression levels and the g.47913559 G > A mutation
To determine the effect of NC_010454.4: g.47913559 G > A on the expression of miR-22 in pig skeletal muscle, we randomly selected six individuals from each genotype to detect the relative expression of miR-22. MiR-22 expression was lowest for the AA genotype, whereas no significant differences were detected between the GG and GA genotypes (Figure 4A). When G > A mutation was performed in the miR-22 overexpression vector, miR-22 expression decreased in the AA genotype compared with the GG genotype (Figure 4B). Together, these results suggest that the NC_010454.4:g.47913559 G > A SNP affects miR-22 expression.
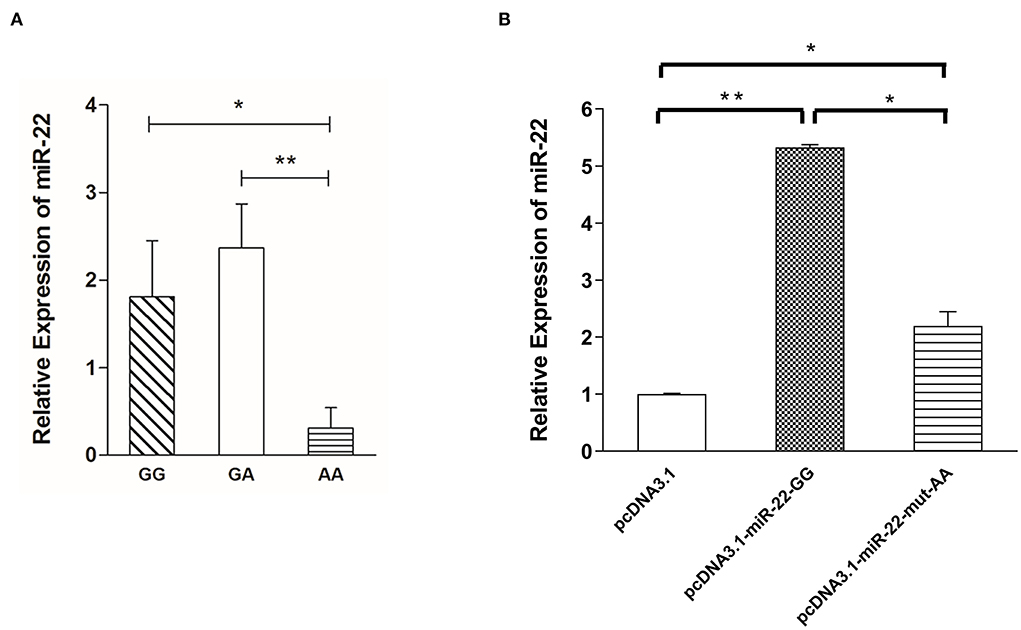
Figure 4. Expression levels of miR-22 are associated with g.47913559 G > A mutation. (A) Expression of miR-22 in longissimus dorsi muscle from Suhuai pigs with different genotypes (n = 6). (B) Expression of miR-22 after transfection of the miR-22 overexpression vector and the mutated vector (n = 3). *P < 0.05; **P < 0.01.
MiR-22 promotes intracellular Ca2+ concentration by targeting ELOVL6 in porcine skeletal muscle satellite cells
Isolated PMSCs adhered completely to the cell dish after 12 h of isolation, and the cells were spindle-shaped (Figure 5A). After 24 h, the cells increased in number and grew in a regular manner in one direction. These results indicated that the PMSCs showed vigorous cell viability and normal skeletal muscle satellite cell morphology. To further validate the isolated cells, we performed immunofluorescence staining with the skeletal muscle satellite cell-specific marker proteins Pax7 and Desmin (30). Pax7 and Desmin were positive in the nucleus and cytoplasm, respectively (Figure 5B), further demonstrating that the isolated cells were PMSCs.
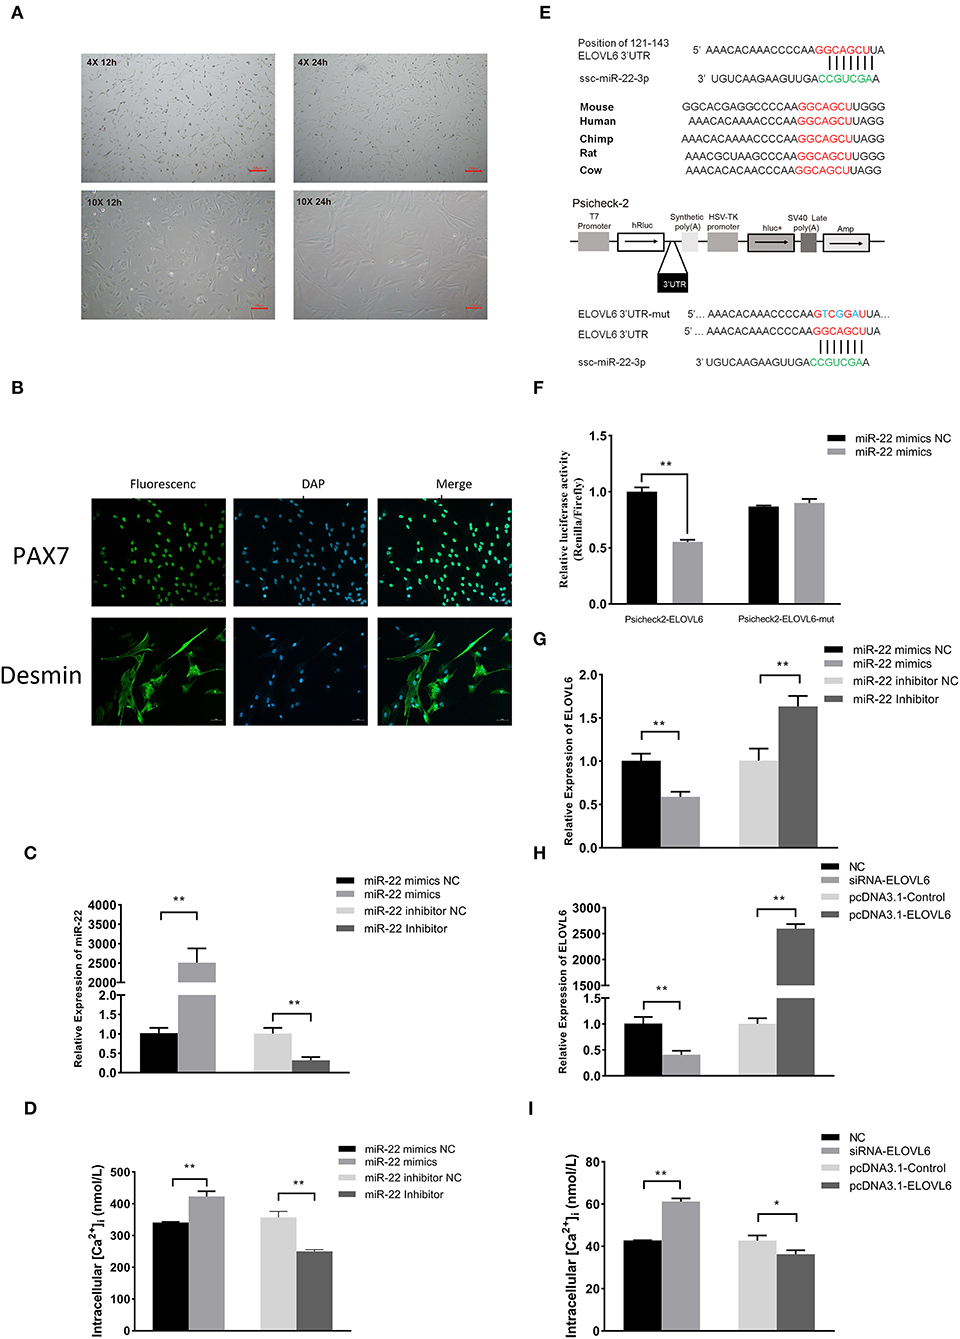
Figure 5. The miR-22 gene promotes intracellular calcium concentration by targeting the elongase of very long chain fatty acids 6 (ELOVL6) gene in porcine skeletal muscle satellite cells (PMSCs). Microscopic morphological observation of PMSC growth for 12 and 24 h at (A) 4× (upper panel) and 10× (bottom panel) magnification. (B) Immunofluorescence staining of satellite cell marker proteins (Pax7 and Desmin) in PMSCs. (C) Expression of miR-22 in PMSCs after transfection of miR-22 mimics and its NC and miR-22 inhibitor and its NC. (D) Intracellular calcium concentration was measured after PMSCs were transfected with miR-22 mimics, miR-22 mimics NC, miR-22 inhibitor, or miR-22 inhibitor NC for 24 h. (E) Sequence of miR-22 and its predicted conserved binding region in ELOVL6 3'UTR (red). Structural diagram of the dual-luciferase reporter vector Psicheck-2. The predicted miR-22 target site of the ELOVL6 3'UTR and mutated target site were inserted into the 3'-end of the Renilla luciferase gene (hRluc). Firefly luciferase gene (hluc+) expression was used as the standard control. (F) HEK293T cells transfected with miR-22 mimics or NC were co-transfected with the Psicheck-2 ELOVL6 vector or its mutated vector. Relative luciferase activity was determined after 24 h. (G) Expression of ELOVL6 mRNA in PMSCs following transfection of miR-22 mimics, miR-22 mimics NC, miR-22 inhibitor, or miR-22 inhibitor NC. (H) Expression of ELOVL6 mRNA in PMSCs following transfection of siRNA-ELOVL6, NC, pcDNA3.1-ELOVL6, or pcDNA3.1-Control. (I) Intracellular calcium concentration was measured after PMSCs were transfected with siRNA-ELOVL6, NC, pcDNA3.1-ELOVL6, or pcDNA3.1-Control for 24 h (n = 3). *P < 0.05; **P < 0.01.
Compared with the NC, overexpression of miR-22 effectively increased the intracellular Ca2+ concentration, whereas knockdown of miR-22 reduced the intracellular Ca2+ concentration of PMSCs (Figures 5C,D). Using the TargetScan online prediction program, we discovered that ELOVL6 was a potential target of miR-22, with an miR-22 binding site in its 3′UTR region, which is highly conserved in multiple species (Figure 5E). Furthermore, we conducted a dual-luciferase reporter assay to test whether ELOVL6 is a real target gene of miR-22. The predicted sequence of the ELOVL6 3′UTR was inserted into the Renilla luciferase report vector Psicheck-2 (Figure 5E). The mutated Psicheck-2 ELOVL6 luciferase vector, which has three mutant sites in the binding site of miR-22, was also generated. Overexpression of miR-22 significantly inhibited luciferase activity when co-transfected with Psicheck-2 ELOVL6 luciferase vector in HEK293T cells (Figure 5F). However, no significant changes in luciferase activity were observed when miR-22 was co-transfected with mutated Psicheck-2 ELOVL6 luciferase vector.
The expression of ELOVL6 was significantly downregulated after miR-22 overexpression (Figure 5G) in PMSCs. In contrast, loss of miR-22 upregulated the mRNA expression of ELOVL6. SiRNA-mediated knockdown of ELOVL6 increased the intracellular Ca2+ concentration in PMSCs, and overexpressing ELOVL6 decreased the intracellular Ca2+ concentration (Figures 5H,I). These results suggest that miR-22 increases the concentration of intracellular Ca2+ by targeting ELOVL6 in PMSCs.
Discussion
Genetic and nutritional factors such as breed, muscle fiber type, and feed nutrition, as well as physiological and biochemical factors such as mitochondrial function and lipid oxidation, regulate pig meat color by affecting the content or redox state of myoglobin (31). In this study, we found that miR-22 expression was significantly lower in red muscles with high proportions of oxidative fibers such as porcine SOL, PM, and MA muscles than in white muscles containing high proportions of glycolytic fibers such as the LD and BF. Previous studies have also found that porcine SOL, PM, and MA muscles are mainly composed of oxidized type I and type IIa muscle fibers, whereas muscles such as the LD and BF are mainly glycolytic type IIb muscle fibers (32). Among the reported target genes of miR-22, we discovered genes such as Sirt1 and HDAC4, which promote the formation of red muscles (33, 34). A previous study found that miR-22 eliminated the effects of resveratrol on slow MyHC and fast MyHC expression in porcine myotubes (35). Our results also showed that myoglobin expression was higher in red muscles than in white muscles and that the pattern was opposite to that of miR-22 in different pig muscle types. This finding further suggests that miR-22 expression may be lower in muscles with higher redness values. Therefore, further studies are needed to explore the genes or signaling pathways related to pig meat color regulated by miR-22.
Many studies have analyzed the association between miRNA and economic traits in farm animals through the detection of SNPs in miRNA genes. A T/C mutation in the miR-27a gene, which is associated with litter size in large white pigs, may be a potential molecular marker for litter size trait breeding (36). An SNP on the miR-206 gene is associated with the proportions of type IIa and IIb fibers in muscle and also with meat quality traits including drip loss and backfat and lean meat percentages (37). An SNP on miR-133b is significantly associated with the total number of muscle fibers, loin eye muscle area, and pH (37). In this study, we showed that the coefficient of variation for meat color a* at 2 h postmortem reached 25.82%, such that the meat redness trait has great breeding potential in Suhuai pigs.
Through sequencing, we found a G > A mutation site in the ssc-miR-22 gene that was highly significantly correlated with meat color a* at 2 h postmortem in Suhuai pigs. AA genotype individuals had the highest a*value and the lowest miR-22 expression. However, GG genotype individuals had lower a*values at 2 h postmortem than GA genotype individuals, but there were no significant differences in miR-22 expression between these genotypes. The G > A mutation in the miR-22 overexpression vector decreased miR-22 expression levels. Thus, this mutation may promote the binding of transcription factors that inhibit miR-22 expression; however, this phenomenon may be fully effective only for AA homozygous genotype. Future studies should further explore the mechanism underlying the effects of this mutation on miR-22 expression.
In a previous study, we found that the ELOVL6 gene was differentially expressed in different types of muscles in pigs (18), which was in contrast to the expression trend observed in miR-22 in this study. In this study, we also discovered that porcine miR-22 targets ELOVL6 to regulate the Ca2+ concentrations in PMSCs. The calcium/calmodulin kinase II (CaMK II) gene is a significantly enriched phosphorylation motif of ELOVL6−/− zebrafish compared with wild-type zebrafish (38). In skeletal muscle, CaMK II phosphorylation can stimulate intracellular Ca2+ levels. Therefore, we speculated that CaMK II may be downstream of miR-22 or its target gene ELOVL6, where it regulates intracellular Ca2+ in PMSCs (39).
In summary, a G/A mutation in the miR-22 gene was discovered to be associated with pig meat color a* at 2 h postmortem, and this mutation influences miR-22 expression. The NC_010454.4: g.47913559 G > A mutation site may act as a molecular marker for meat color in pig breeding. In addition, ELOVL6 is a direct target of miR-22 in pigs. The effects of miR-22 on skeletal muscle intracellular Ca2+ concentrations may be partly due to the inhibition of ELOVL6 expression.
Data availability statement
The raw data supporting the conclusions of this article will be made available by the authors, without undue reservation.
Ethics statement
The animal study was reviewed and approved by the Animal Ethics Committee of Nanjing Agriculture University.
Author contributions
LH and RH conceived and designed the experiments. HW and ZS performed the experiments. HW, XZ, SY, and JJ analyzed the data. AZ and PL helped to write the manuscript. JJ helped to revise the language. All authors read and approved the final manuscript.
Funding
This study was supported by the National Natural Science Foundation of China (Nos. 31802030, 32002149, and 32172710).
Conflict of interest
The authors declare that the research was conducted in the absence of any commercial or financial relationships that could be construed as a potential conflict of interest.
Publisher's note
All claims expressed in this article are solely those of the authors and do not necessarily represent those of their affiliated organizations, or those of the publisher, the editors and the reviewers. Any product that may be evaluated in this article, or claim that may be made by its manufacturer, is not guaranteed or endorsed by the publisher.
References
1. Nonneman D, Shackelford S, King D, Wheeler T, Wiedmann R, Snelling W, et al. Genome-wide association of meat quality traits and tenderness in swine. J Anim Sci. (2013) 91:4043–50. doi: 10.2527/jas.2013-6255
2. Brewer M, Jensen J, Sosnicki A, Fields B, Wilson E, McKeith F. The effect of pig genetics on palatability, color and physical characteristics of fresh pork loin chops. Meat Sci. (2002) 61:249–56. doi: 10.1016/S0309-1740(01)00190-5
3. Van Wijk H, Arts D, Matthews J, Webster M, Ducro B, Knol E. Genetic parameters for carcass composition and pork quality estimated in a commercial production chain. J Anim Sci. (2005) 83:324–33. doi: 10.2527/2005.832324x
4. Wu D, Sun D-W. Colour measurements by computer vision for food quality control–a review. Trends Food Sci Tech. (2013) 29:5–20. doi: 10.1016/j.tifs.2012.08.004
5. Davoli R, Braglia S. Molecular approaches in pig breeding to improve meat quality. Brief Funct Genomics. (2007) 6:313–21. doi: 10.1093/bfgp/elm036
6. Georges M, Coppieters W, Charlier C. Polymorphic miRNA-mediated gene regulation: contribution to phenotypic variation and disease. Curr Opin Genet Dev. (2007) 17:166–76. doi: 10.1016/j.gde.2007.04.005
7. Slaby O, Bienertova-Vasku J, Svoboda M, Vyzula R. Genetic polymorphisms and microRNAs: new direction in molecular epidemiology of solid cancer. J Cell Mol Med. (2012) 16:8–21. doi: 10.1111/j.1582-4934.2011.01359.x
8. Hong J-S, Noh S-H, Lee J-S, Kim J-M, Hong K-C, Lee YS. Effects of polymorphisms in the porcine microRNA miR-1 locus on muscle fiber type composition and miR-1 expression. Gene. (2012) 506:211–6. doi: 10.1016/j.gene.2012.06.050
9. Kim J, Lim K, Hong J, Kang J, Lee Y, Hong KC, et al. polymorphism in the porcine miR Y, Hong KCoRNA miR-1 locus on muscle fiber type composition and miR-1 expression coufects on muscle fibre characteristics and meat quality. Anim Genet. (2015) 46:73–7. doi: 10.1111/age.12255
10. Jiang A, Yin D, Zhang L, Li B, Li R, Zhang X, et al. Parsing the microRNA genetics basis regulating skeletal muscle fiber types and meat quality traits in pigs. Anim Genet. (2021) 52:292–303. doi: 10.1111/age.13064
11. Xiong J. Key roles of microRNA-22 family in complex organisms inferred from its evolution. Microrna. (2014) 3:64–74. doi: 10.2174/2211536603666140609232335
12. Dang HQ, Xu G-l, Hou L-J, Jian X, Hong G-l, Chingyuan H, et al. MicroRNA-22 inhibits proliferation and promotes differentiation of satellite cells in porcine skeletal muscle. J Integr Agric. (2020) 19:225–33. doi: 10.1016/S2095-3119(19)62701-2
13. Wen W, Chen X, Huang Z, Chen D, Zheng P, He J, et al. miR-22-3p regulates muscle fiber-type conversion through inhibiting AMPK/SIRT1/PGC-1α pathway. Anim Biotechnol. (2021) 32:254–61. doi: 10.1080/10495398.2020.1763375
14. Offer G. Modelling of the formation of pale, soft and exudative meat: Effects of chilling regime and rate and extent of glycolysis. Meat Sci. (1991) 30:157–84. doi: 10.1016/0309-1740(91)90005-B
15. Cheah K, Cheah A, Crosland A, Casey J, Webb A. Relationship between Ca2+ release, sarcoplasmic Ca2+, glycolysis and meat quality in halothane-sensitive and halothane-insensitive pigs. Meat Sci. (1984) 10:117–30. doi: 10.1016/0309-1740(84)90064-0
16. Chai J, Xiong Q, Zhang P, Shang Y, Zheng R, Peng J, et al. Evidence for a new allele at the SERCA1 locus affecting pork meat quality in part through the imbalance of Ca2+ homeostasis. Mol Biol Rep. (2010) 37:613–9. doi: 10.1007/s11033-009-9872-0
17. Matsuzaka T, Shimano H, Yahagi N, Kato T, Atsumi A, Yamamoto T, et al. Crucial role of a long-chain fatty acid elongase, Elovl6, in obesity-induced insulin resistance. Nat Med. (2007) 13:1193–202. doi: 10.1038/nm1662
18. Li B, Dong C, Li P, Ren Z, Wang H, Yu F, et al. Identification of candidate genes associated with porcine meat color traits by genome-wide transcriptome analysis. Sci Rep. (2016) 6:1–12. doi: 10.1038/srep35224
19. Senyilmaz D, Virtue S, Xu X, Tan CY, Griffin JL, Miller AK, et al. Regulation of mitochondrial morphology and function by stearoylation of TFR1. Nature. (2015) 525:124–8. doi: 10.1038/nature14601
20. Gandra PG, Shiah AA, Nogueira L, Hogan MC, A. mitochondrialh Argeted antioxidant improves myofilament Ca2+ sensitivity during prolonged low frequency force depression at low. J Physiol. (2018) 596:1079–89. doi: 10.1113/JP275470
21. Liu R, Xing L, Zhou G, Zhang W. What is meat in China? Animal Frontiers. (2017) 7:53–6. doi: 10.2527/af.2017.0445
22. Yue T, Fang Q, Yin J, Li D, Li W. S-adenosylmethionine stimulates fatty acid metabolism-linked gene expression in porcine muscle satellite cells. Mol Biol Rep. (2010) 37:3143–9. doi: 10.1007/s11033-009-9893-8
23. Russell DW, Sambrook J. Molecular Cloning: A Laboratory Manual. New York: Cold Spring Harbor Laboratory Cold Spring Harbor (2001).
24. Rio DC, Ares M, Hannon GJ, Nilsen TW. Purification of RNA using TRIzol (TRI reagent). Cold Spring Harb Protoc. (2010) 2010:pdb. prot5439. doi: 10.1101/pdb.prot5439
25. Wang H, Shi L, Liang T, Wang B, Wu W, Su G, et al. MiR-696 regulates C2C12 cell proliferation and differentiation by targeting CNTFRα. Int J Biol Sci. (2017) 13:413. doi: 10.7150/ijbs.17508
26. Livak KJ, Schmittgen TD. Analysis of relative gene expression data using real-time quantitative PCR and the 2– ΔΔCT method. methods. (2001) 25:402–8. doi: 10.1006/meth.2001.1262
27. Iqbal A, Kim Y-S, Kang J-M, Lee Y-M, Rai R, Jung J-H, et al. Genome-wide association study to identify quantitative trait loci for meat and carcass quality traits in Berkshire. Asian-Australas J Anim Sci. (2015) 28:1537. doi: 10.5713/ajas.15.0752
28. Reardon W, Mullen A, Sweeney T, Hamill R. Association of polymorphisms in candidate genes with colour, water-holding capacity, and composition traits in bovine M. longissimus and M semimembranosus. Meat Sci. (2010) 86:270–5. doi: 10.1016/j.meatsci.2010.04.013
29. Lefaucheur L, Milan D, Ecolan P, Le Callennec C. Myosin heavy chain composition of different skeletal muscles in Large White and Meishan pigs. J Anim Sci. (2004) 82:1931–41. doi: 10.2527/2004.8271931x
30. Li B-j, Li P-h, Huang R-h, Sun W-x, Wang H, Li Q-f, et al. Isolation, culture and identification of porcine skeletal muscle satellite cells. Asian-Australas J Anim Sci. (2015) 28:1171. doi: 10.5713/ajas.14.0848
32. Karlsson A, Klont R, Fernandez X. Skeletal muscle fibres as factors for pork quality. Livest Prod Sci. (1999) 60:255–69. doi: 10.1016/S0301-6226(99)00098-6
33. Ljubicic V, Burt M, Lunde JA, Jasmin BJ. Resveratrol induces expression of the slow, oxidative phenotype in mdx mouse muscle together with enhanced activity of the SIRT1-PGC-1α axis. Am J Physiol Cell Physiol. (2014) 307:C66–82. doi: 10.1152/ajpcell.00357.2013
34. Cohen TJ, Choi M-C, Kapur M, Lira VA, Yan Z, Yao T-P. HDAC4 regulates muscle fiber type-specific gene expression programs. Mol Cells. (2015) 38:343. doi: 10.14348/molcells.2015.2278
35. Wen W, Chen X, Huang Z, Chen D, Yu B, He J, et al. Resveratrol regulates muscle fiber type gene expression through AMPK signaling pathway and miR-22-3p in porcine myotubes. Anim Biotechnol. (2022) 2022:1–7. doi: 10.1080/10495398.2022.2046599
36. Lei B, Gao S, Luo L, Xia X, Jiang S, Deng C, et al. A SNP in the miR-27a gene is associated with litter size in pigs. Mol Biol Rep. (2011) 38:3725–9. doi: 10.1007/s11033-010-0487-2
37. Lee JS, Kim JM, Lim KS, Hong JS, Hong KC, Lee YS. Effects of polymorphisms in the porcine micro RNA MIR206/MIR133B cluster on muscle fiber and meat quality traits. Anim Genet. (2013) 44:101–6. doi: 10.1111/j.1365-2052.2012.02362.x
38. Wang X, Sun S, Cao X, Gao J. Quantitative phosphoproteomic analysis reveals the regulatory networks of Elovl6 on lipid and glucose metabolism in zebrafish. Int J Mol Sci. (2020) 21:2860. doi: 10.3390/ijms21082860
Keywords: pig, meat color, miR-22, ELOVL6, intracellular calcium concentration, mutation
Citation: Wang H, Shen Z, Huang R, Zhao A, Jiang J, Li P, Zhou X, Yang S and Hou L (2022) A polymorphism in porcine miR-22 is associated with pork color. Front. Vet. Sci. 9:939440. doi: 10.3389/fvets.2022.939440
Received: 09 May 2022; Accepted: 28 June 2022;
Published: 28 July 2022.
Edited by:
Nelida Rodriguez-Osorio, Universidad de la República, UruguayCopyright © 2022 Wang, Shen, Huang, Zhao, Jiang, Li, Zhou, Yang and Hou. This is an open-access article distributed under the terms of the Creative Commons Attribution License (CC BY). The use, distribution or reproduction in other forums is permitted, provided the original author(s) and the copyright owner(s) are credited and that the original publication in this journal is cited, in accordance with accepted academic practice. No use, distribution or reproduction is permitted which does not comply with these terms.
*Correspondence: Liming Hou, bGltaW5naG91QG5qYXUuZWR1LmNu