 Yuliang Wen†Shaobin Li*†Gaoliang BaoJiqing WangXiu LiuJiang HuFangfang ZhaoZhidong ZhaoBingang ShiYuzhu Luo*
- Gansu Key Laboratory of Herbivorous Animal Biotechnology, Faculty of Animal Science and Technology, Gansu Agricultural University, Lanzhou, China
Tibetan sheep are mainly distributed in the Qinghai–Tibet Plateau. Its meat is not only essential for the local people but also preferred by the non-inhabitant of this plateau also. To investigate the salient development features and molecular mechanism of the meat difference of LT muscle caused by different growth stages in Tibetan sheep, the carcass performance, meat quality, and comparative transcriptome analysis were performed for investigating the potential molecular mechanism of the meat quality difference of the LT muscle caused by four growth stages [4-months old (4 months), 1.5-years old (1.5 years), 3.5-years old (3.5 years), and 6-years old (6 years)] in the Tibetan sheep. The shear force increased with the increase of age (p < 0.05) while the intramuscular fat (IMF) was the highest at 1.5 y. The AMPK signaling pathway was significantly enriched in the four comparative groups. The weighted gene co-expression network analysis (WGCNA) results showed that the hub genes P4HA2, FBXL4, and PPARA were identified to regulate the meat quality. In summary, 1.5 years was found to be the most suitable slaughter age of the Tibetan sheep which ensured better meat tenderness and higher IMF content. Moreover, the genes LIPE, LEP, ADIPOQ, SCD, and FASN may regulate the transformation of the muscle fiber types through the AMPK signaling pathway, further affecting the meat quality.
Introduction
Meat quality traits constitute important economic traits of livestock. The molecular mechanism of skeletal muscle growth and muscle tenderness is conducive to improving livestock performance and meat quality. Tibetan sheep (Ovis aries) are mainly distributed on the Qinghai–Tibet Plateau above 3,000-m altitude. The sheep is wholly adapted to the special ecological environment with extreme conditions, such as lower temperature, thinner oxygen level, and stronger ultraviolet rays. The sheep mainly produces meat and is loved by all the consumers in Northwest China for its unique flavor and palatability, which is influenced by the natural environment (1). However, it remains elusive whether this living environment is related to the type of muscle energy metabolism in Tibetan sheep. The number of skeletal muscle fibers is constant in mammals after birth (2, 3). The growth and development of muscle fiber mainly includes the increase of the muscle fiber diameter and the muscle fiber types transition after birth (4). Moreover, there are real differences in the structure, function, and metabolism between the different muscle fibers types, which further influencing the meat quality. Hence, it is crucial to investigate the skeletal muscles growth and development in livestock after birth for the meat traits. Tenderness is an important index to evaluate the meat quality, and also influences the consumers' intention for purchase and its market acceptance (5). Saccà et al. (6) have identified the goat meat tenderness decreased with the increase of age. Nevertheless, it remains elusive whether muscle development influences meat tenderness in livestock after birth growth.
Currently, there have been a lot of studies on the mechanism of skeletal muscle transcriptome and proteome in the species such as cattle (7, 8), sheep (9, 10), and goats (11). The previous studies have demonstrated the important role of the related genes and signaling pathway in muscle growth and development, including the myogenic transcription factor Pax3 and Pax7 (12); the myogenic regulatory factors Myf5, MyoD, and myogenin (13); the fibroblast growth factor (FGF); and transforming growth factor β (TGF-β). The skeletal muscle development and differentiation were regulated through these regulatory factors and Wnt, AMPK, MAPK, and PI3K-Akt signaling pathways (14). The skeletal muscle is composed of a variety of functionally diverse fiber types, there are mainly four types of muscle fibers in the adult mammalian skeletal muscle, including MyHC I, MyHC IIa, MyHC IIx, and MyHC IIb.
The previous studies have identified that the different types of muscle fibers to influence many meat quality traits such as the water-holding capacity (WHC), tenderness, color, juiciness, and flavor (15). Liu et al. (16) demonstrated CaN/NFAT as an important signaling pathway, regulating the transformation of the chicken muscle fiber types. Zhu et al. (17) found MYH6 and Ca2+ signaling pathways to regulate the muscle fiber types of skeletal muscle in large white pigs. In addition, the previous studies have also found that increasing the AMPK activity can change the proportion of fiber types in pork (18). However, the molecular mechanism of the LT muscle fiber types transition in the Tibetan sheep at different growth stages, and its influence on the meat tenderness remains largely unknown.
There is still a lack of systematic research on the regulation of changes in the muscle fiber types especially during the growth and development of the skeletal muscle of the animals after birth. In the few years, the next generation sequencing technology and bioinformatics methods have developed rapidly, like the RNA-seq, the molecular mechanism of muscle tenderness changes at different growth stages in Tibetan sheep was explored simply and effectively. The comparative transcriptome analysis of the LT muscle was used for identifying the regulatory genes related to meat tenderness and meat quality at different growth stages in Tibetan sheep. Furthermore, the functions and signaling pathways of DEGs were investigated. The WGCNA regulatory network was further used to analyze the hub genes related to meat quality.
Materials and Methods
Ethics Statement
The animal study was reviewed and approved by the Faculty Animal Policy and Welfare Committee of Gansu Agricultural University (Ethic approval file No. GSAU-Eth-AST-2021-001).
Animals and Muscle Sampling
A total of 16 healthy female Tibetan sheep were selected from the same flock of the Haiyan County, Qinghai Province, China, including 4 months (n = 4), 1.5 years (n = 4), 3.5 years (n = 4), and 6 years (n = 4). For the detailed samples collection process, see our previous study (19). Then, the initial weight, hot carcass weight, and dressing percentage were recorded and the meat quality were determined. The sample collection and processing for RNA extraction were carried out according to the results of our previous study (19).
Meat Quality Measurements
The shear force was measured according to the methods as described by Honikel (1998) (20). The process included the meat samples from Tibetan sheep for 48 h after slaughter were cooked in the cooking bags until the internal temperature was maintained at 75°C. Then taking out the meat samples and cooling them, using a sampler with a diameter of 1.27 cm to take meat slices and measuring shear force by a shearing device (C-LM3B, Runhu Instrument Co., Ltd., Guangzhou, China). The intramuscular fat (IMF) and crude protein content in mutton was determined according to the methods as described by AOAC (2007) (21). The experiment was repeated 3 times in each group (22).
RNA Extraction and Sequencing
The total RNA was extracted according to the methods as described by Bao et al. (23). After the total RNA was extracted, Illumina TruSeq TM RNA (Illumina, USA) kit was used to construct cDNA libraries for RNA sequencing and sequenced using Illumina Novaseq6000 (or other platforms) by Gene Denovo Biotechnology Co. (Guangzhou, China).
Raw Data Cleaning and Transcriptome
The raw data cleaning was filtered by fastp (v0.18.0) (24). The detailed process can refer to our previous study (23). Bowtie2 (v2.2.8) (25) was used to identify ribosomal RNA and were removed. The remaining clean reads were mapped the sheep Oar_v1.0 reference genome using HISAT2 (26) (v2.1.0). The software Stringtie (v1.3.4) (27, 28) was used to reconstruct the transcripts. All software used default parameters.
Differentially Expressed Genes Analysis
The fragment per kilobase of transcript per million mapped reads (FPKM) was used to calculate the expression levels of mRNA using RSEM (29). The DEGs were analyzed by DESeq2 (30) and edgeR (31). The false discovery rate (FDR) < 0.05 and |log2(Fold Change)| > 1 were used to identify DEGs.
Gene Ontology (GO) Enrichment and Kyoto Encyclopedia of Genes and Genomes Pathway Analysis of the DEGs
In this study, DAVID (http://david.abcc.ncifcrf.gov/) online analysis software was used for GO function annotation and KEGG pathway enrichment analysis (32).
Weighted Gene Co-Expression Network Analysis
The WGCNA was performed using the WGCNA R software (33) for constructing a co-expression network. The top 50% of genes with the largest variation for WGCNA were selected after threshold screening while calculating degree of variation in the expression level of each gene between samples. For power processing on the original scaled relation matrix, β = 8 was finally selected, and the unscaled adjacency matrix was generated. In addition, the correlation between the modules and meat quality traits of the LT muscle of Tibetan sheep were investigated using Pearson's correlation.
Gene Co-Expression Network
To analyze the selected module gene, The Search Tool for the Retrieval of Interacting Genes (STRING) database (v11.5) was used to construct the network. The top-10 connectivity within the module genes was screened for constructing the network, and it was displayed by the Cytoscape software (34).
Gene Expression Analysis With RT-qPCR
The real-time quantitative polymerase chain reaction (RT-qPCR) was used to verify the authenticity of the transcriptome results according the methods as described by Wen et al. (35). The primers were designed by Primer (v5.0), and listed in Supplementary Table 1. GAPDH was used as a reference gene for calculating the relative expression according to 2−ΔΔCt method (36).
Statistical Analysis
Statistical analyses included the ANOVA, followed by Duncan's multiple range test for multiple comparisons of the difference of carcass quality and meat quality in SPSS 20.0 software (SPSS, Armonk, NY, USA). All data in this study were presented as mean ± standard error (SEM), p < 0.05 and different lowercase letters means that the difference was significant.
Results
Carcass Performance and Meat Quality of the Tibetan Sheep
As shown in Table 1, the muscle development associated with live weight and carcass weights was found to increase with the increase of age. The live weight was increased from 4 months to 3.5 years (p < 0.05). The hot carcass weight was increased from 4 months to 3.5 years (p < 0.05), while the weight was decreased from 3.5 years to 6 years (p < 0.05). The dressing percentage was largest at 1.5 years, and then decreased with the increase of age (p < 0.05). The IMF content was increased from 4 months to 1.5 years (p < 0.05), and then decreased with the increase of age. The shear force was increased with the increase of age (p < 0.05). The crude protein was increased with the increase of age, while there was no significant difference between the 3.5 years and 6 years sheep.
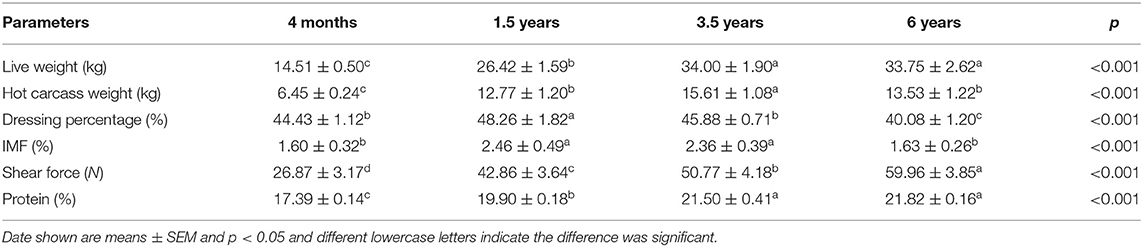
Table 1. Carcass quality and meat quality of Tibetan sheep.
Summary of the RNA-Seq Data
Total 16 libraries were constructed in this study. As shown in Supplementary Table 2, 91,167,071, 95,150,638, 90,313,673, and 87,472,429 average raw reads were generated from four growth stages respectively, the correlation coefficient between 4 months, 1.5 years, 3.5 years, and 6 years samples of Tibetan sheep were 0.983, 0.890, 0.962, and 0.990, respectively. Of the remaining clean reads, there was more than an average of 82 million (92.04 %) mapped to the reference genome.
The criterion of FPKM > 0.01 was used for identifying the potentially expressed genes (37). A total of 9,912, 10,011, 10,048, and 9,788 expressed genes were identified in the LT muscle tissues from the four growth stages of Tibetan sheep, respectively, and 9,241 genes were co-expressed in four ages.
Analysis of DEGs
To analyze the timing of muscle growth and development in the Tibetan sheep, the DEGs of the contiguous period transcriptome comparative groups (4 months vs. 1.5 years, 1.5 years vs. 3.5 years, 3.5 years vs. 6 years, and 4 months vs. 6 years) were identified, each group was identified with 220, 48, 101, and 678 unique DEGs, respectively (Figure 1A; Supplementary Table 3). Overall, there were 666 (385 up-regulated; 281 down-regulated), 179 (86 up-regulated; 93 down-regulated), 272 (94 up-regulated; 178 down-regulated), and 1,202 (501 up-regulated; 701 down-regulated) DEGs were identified in 4 months vs. 1.5 years, 1.5 years vs. 3.5 years, 3.5 years vs. 6 years and 4 months vs. 6 years groups, respectively (Figures 1B–F).
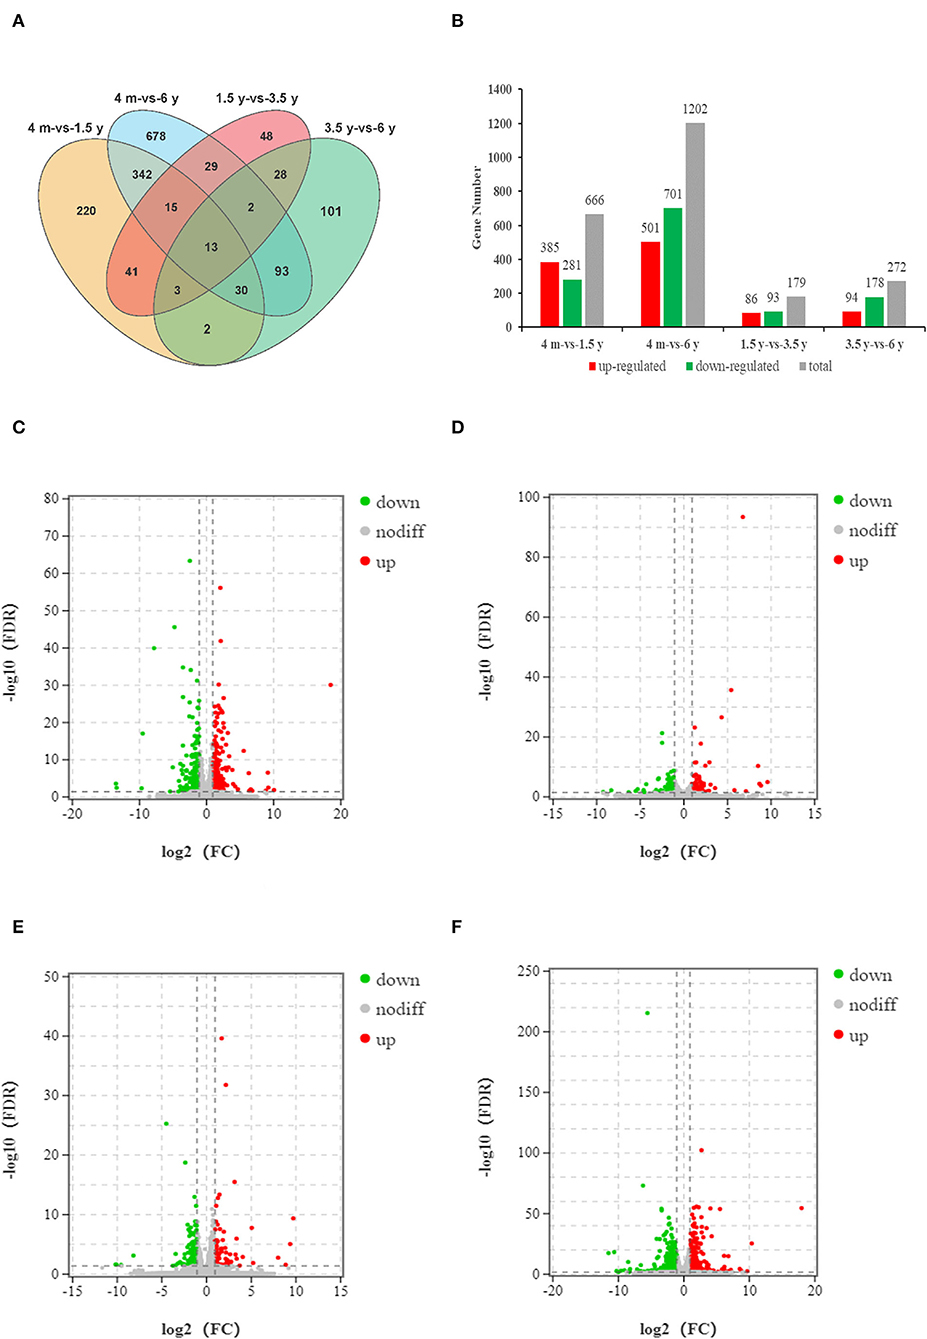
Figure 1. Analysis of the DEGs of four groups. (A) The Venn diagram of DEGs. (B) Histogram of DEGs of four comparative groups. (C–F) Volcano diagrams of DEGs in group of 4 months vs. 1.5 years, 1.5 years vs. 3.5 years, 3.5 years vs. 6 years, and 4 months vs. 6 years, respectively. The abscissa represents the logarithm of the fold change of DEGs between the two groups, and the ordinate represents the negative log10 value of the FDR of the DEGs between the two groups. A point in the volcano represents a gene, red represents up-regulated genes, green represents down-regulated genes, and black represents non-differentially expressed genes.
GO and KEGG Enrichment Analysis of DEGs
The GO enrichment analysis can assist in understanding the function of DEGs between each group more comprehensively, similar to most studies, the DEGs were significantly enriched into the following three main GO categories: Biological processes (BP), molecular functions (MF), and cellular components (CC). Based on the GO significant enrichment analysis (P < 0.05), and the annotation of the GO database 666 DEGs of 4 months vs. 1.5 years group were found to be significantly enriched to 226 BP, 51MF, and 11 CC (Supplementary Table 4). Most of the DEGs were mainly divided into the functional groups, including those related to biosynthesis, nutrient metabolism, and development (Figure 2A). The GO term involved in the function of organ growth (GO: 0035265), endochondral bone growth (GO: 0003416), and regulation of lipid metabolic process (GO: 0019216). Among these terms, the most significantly enriched GO term constituted a response to the biotic stimulus (GO: 0009607) (p = 7.39E-5). Also, many DEGs were involved in the coenzyme A metabolic process (GO: 0015936), where the number of genes enriched in the term of binding (GO: 0005488) was the most significant. The organs and bones were speculated to develop first in this stage, and the energy metabolism was relatively vigorous. The IMF content was found to increase significantly from the age of 4 months to 1.5 years, possibly related to the active fatty acid metabolism. The crude protein content also increased significantly in this stage, and was related to amino acid metabolism.
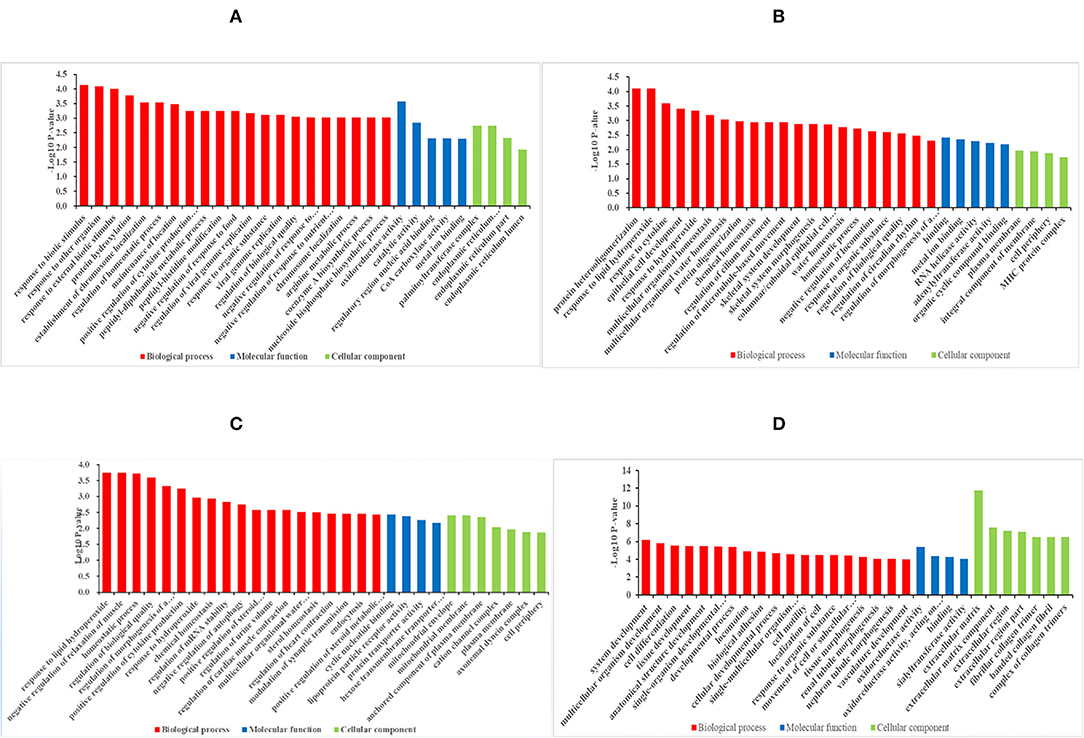
Figure 2. Histogram diagram of DEGs in GO enrichment. (A–D) Histogram diagram of GO enrichment results of DEGs in group of 4 months vs. 1.5 years, 1.5 years vs. 3.5 years, 3.5 years vs. 6 years, and 4 months vs. 6 years, respectively.
Based on the significant enrichment analysis (p < 0.05), the DEGs in the 1.5 years vs. 3.5 years group were found to be significantly enriched in 146 BP, 33 MF, and 10 CC (Supplementary Table 4). The GO term was involved in the function of synthesis, cell differentiation, and metabolic regulation (Figure 2B), including regulation of fatty acid metabolic process (GO: 0019217) and epithelial cell differentiation (GO: 0030855). Among these terms, protein heterooligomerization (GO:0051291) (p = 7.77E-5) was the most significantly enriched GO term. The protein content increased during this growth stage due to the functions linked with protein synthesis. Although DEGs were also enriched in the functions such as fat synthesis and fatty acid metabolism, the IMF content decreased compared to that in the 1.5-years old, with no significant difference. This might be accountable to the lipids deposited in the subcutaneous fat or other lipids for providing energy.
Based on the significant enrichment analysis (p < 0.05) the DEGs in the 3.5 years vs. 6 years group were significantly enriched to 230 BP, 38 MF, and 26 CC (Supplementary Table 4). The GO term involved in the function of metabolism and regulation (Figure 2C) included negative regulation of relaxation of muscle (GO: 1901078), regulation of striated muscle contraction (GO: 0006942), and positive regulation of lipid biosynthetic process (GO: 0046889). Also, many DEGs were involved in regulating of autophagy (GO: 0010506). Among these terms, a response to lipid hydroperoxide (GO:0006982) (p = 0.00018) was the most significantly enriched GO term. It showed the difference in the contractility of different types of muscle fibers, and the IMF was found to significantly decrease due to negative regulation of the lipid biosynthesis.
Based on the significant enrichment analysis (p < 0.05), the DEGs in the 4 months vs. 6 years group were significantly enriched to 337 BP, 46 MF, and 31 CC (Supplementary Table 4). The GO term involved in the function of development, differentiation and metabolism (Figure 2D). The most significantly enriched GO term was the extracellular matrix (GO: 0031012) (p = 1.84E-12). The DEGs were mainly enriched in the development, differentiation, and metabolism of the skeletal muscle and other tissues, it was mainly enriched in the process of maturation to aging of the body.
The KEGG pathway was used for further analyzing the potential functional signaling pathways of DEGs (Table 2). The results showed that the DEGs in the 4 months vs. 1.5 years group were significantly enriched in the AMPK signaling pathway (p = 0.00006), and there were 14 DEGs annotated in this pathway, which were closely related to the connection of the muscle cells (Figure 3). The lipid metabolism related pathway, including PPARA, SCD, and APOA1 were significantly enriched in the PPAR signaling pathway (p < 0.05), and a total of 10 DEGs were annotated. In addition, the adipocytokine, and antigen processing signaling pathway, were also significantly enriched (p < 0.05).
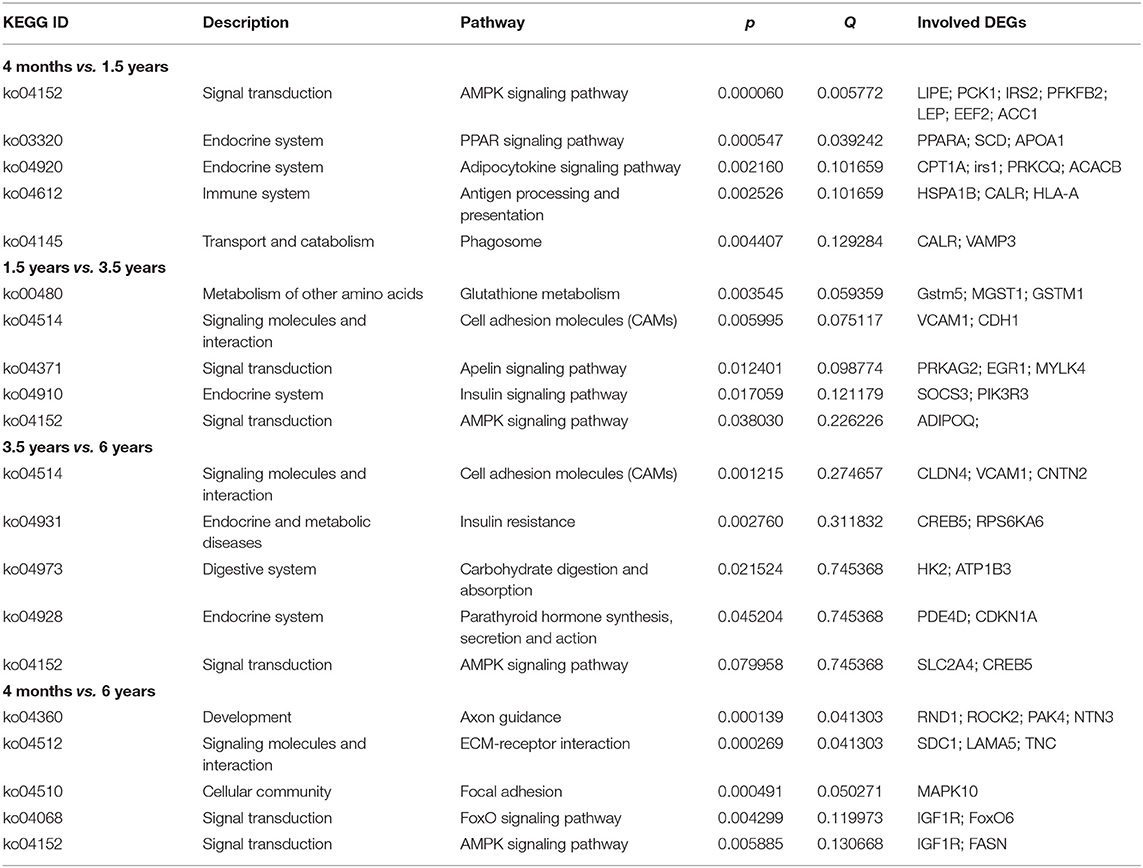
Table 2. The significant KEGG enrichment results of DEGs.
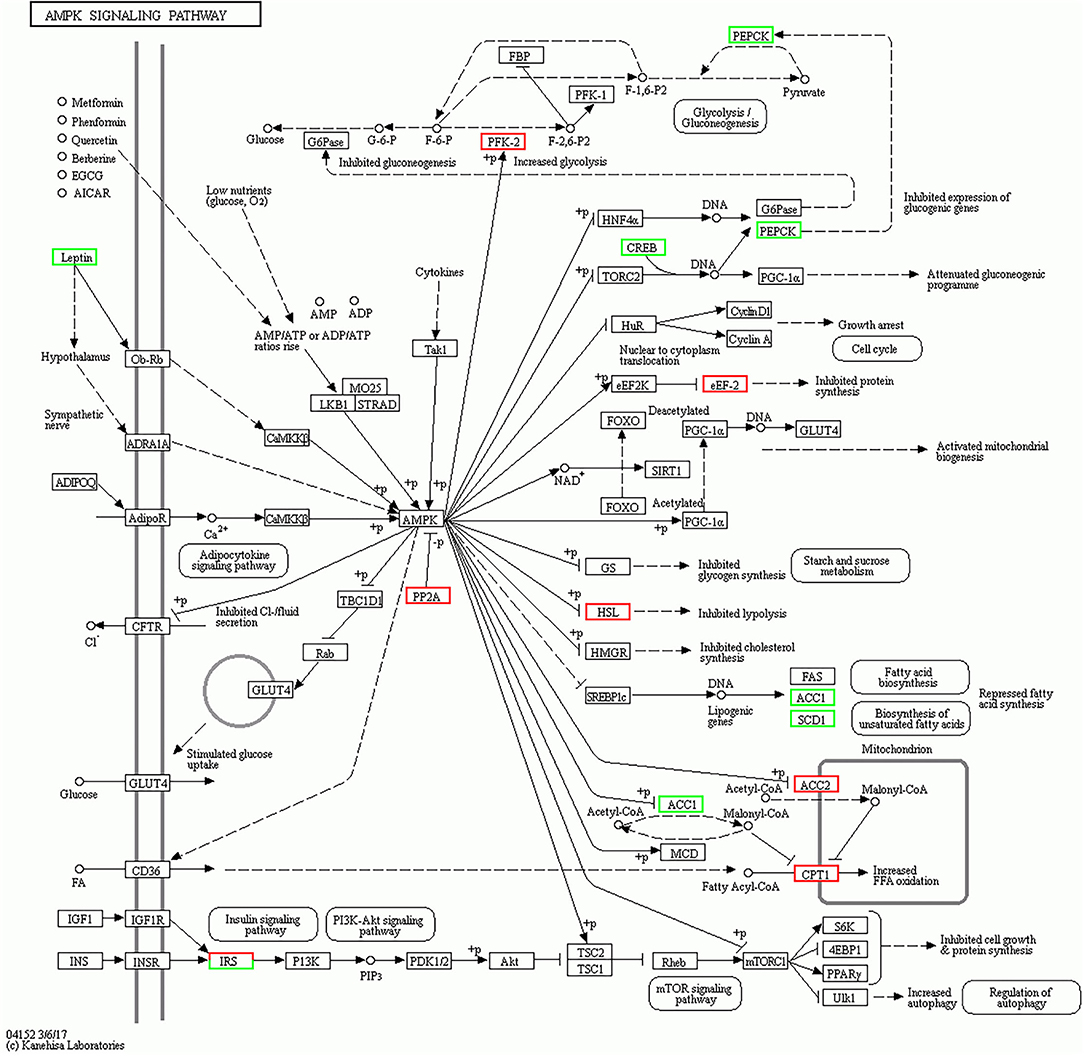
Figure 3. AMPK signaling pathway in the 4 months vs. 1.5 years group. The white square represents a gene or protein, the red square is the up-regulated genes in the pathway at this time, the green square is the down-regulated genes in the pathway at this time.
The KEGG enrichment results were shown in Supplementary Table 5. Specifically, the DEGs in the 1.5 years vs. 3.5 years group were also significantly enriched (p = 0.038) in the AMPK signaling pathway and ADIPOQ was annotated (Table 2; Supplementary Figure 1A). Gstm5, MGST1, and GSTM1 were significantly enriched (p < 0.05) in glutathione metabolism, and was related to the protein synthesis, and there were 4 DEGs annotated in this pathway. In addition, the cell adhesion molecules (CAMs), Apelin signaling pathway and Insulin signaling pathway were significantly enriched (p < 0.05).
The DEGs in the 3.5 years vs. 6 years group were significantly enriched (p = 0.001215) in the cell adhesion molecules (CAMs), which were related to cell recognition, signal transduction, activated proliferation, and differentiation. A total of eight DEGs were annotated in the above pathway. The DEGs in the 3.5 years vs.6 years group were also enriched in the AMPK signaling pathway (p = 0.079), SLC2A4, and CREB5 were enriched in this signaling pathway (Table 2; Supplementary Figure 1B). In addition, insulin resistance, carbohydrate digestion, absorption, and action were significantly enriched (p < 0.05).
There were 24 DEGs in the 4 months vs. 6 years group were found to be significantly enriched in the axon guidance (p = 0.0001393), while 15 DEGs were found to be significantly enriched in the AMPK signaling pathway (p < 0.05) (Table 2; Supplementary Figure 1C).
Co-Expression Module of WGCNA
The scale-free fit index and mean connectivity were calculated, selecting the soft-thresholding power of β = 8. The scale free R2 > 0.8, mean connectivity tends to zero revealed that the power of β = 8 to power processing could construct a scale-free network (Figures 4A,B). The weighted gene co-expression network analysis divided the DEGs of four groups into various modules. The dynamic shearing algorithm clustered and partitioned the genes, and the module feature vector of each module was calculated, merging the similar modules. As a result, 19 modules were determined (Figure 4C). The significant negative correlations were found between the MM.green and live weight (r = −0.89, p < 0.001), hot carcass weight (r = −0.79, p < 0.001), shear force (r = −0.92, p < 0.001), and crude protein (r = −0.91, p < 0.001). There were significant positive correlations found between the MM.gray 60 and shear force (r = 0.77, p < 0.001), live weight (r = 0.66, p < 0.01), and crude protein (r = 0.68, p < 0.01). There were significant positive correlations between the MM.dark-red and IMF (r = 0.52, p < 0.05) (Figure 4D).
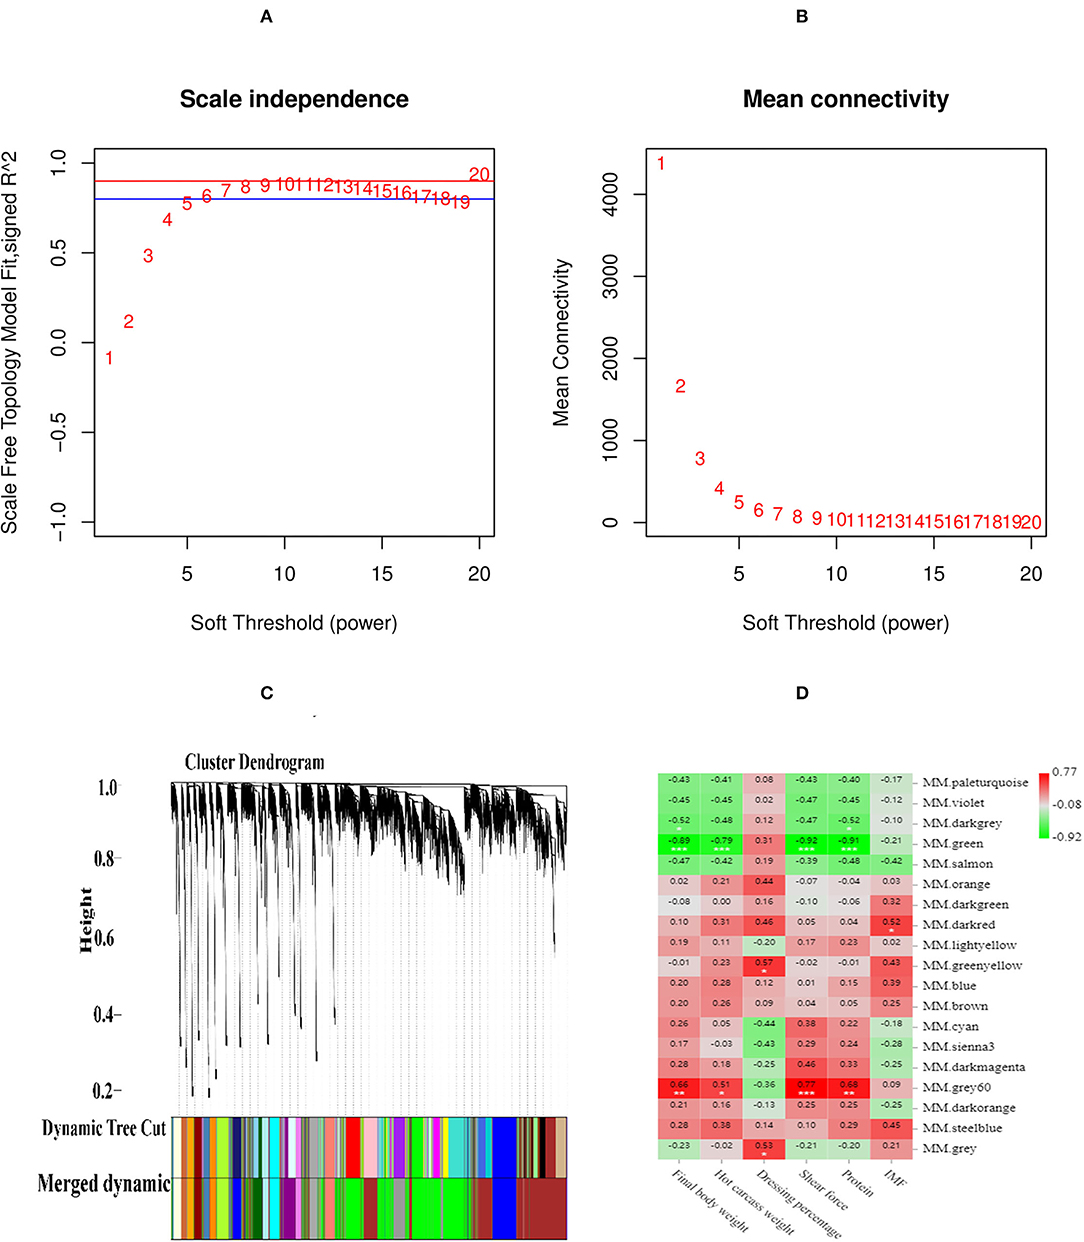
Figure 4. The scale-free fit index and mean connectivity of WGCNA. (A) Abscissa represents the soft threshold (power value, β). Ordinate represents the correlation coefficient R2. Blue horizontal line represents the correlation coefficient R2 = 0.8, red horizontal line represents the correlation coefficient R2 = 0.9. (B) Abscissa represents the soft threshold (power value, β), Ordinate represents the mean connectivity. (C) Clustering tree (dendrogram) defined by WGCNA representing the co-expression modules. Branches of the dendrogram correspond to modules labeled with different colors below the dendrogram. (D) Correlation between modules and meat quality and slaughter trait according to Pearson correlation.
Identification of the Hub Gene and Construction of the Gene Co-Expression Network
The hub genes usually refer to the genes with high connectivity within the module. The gene interaction network of MM.green module was constructed, and the top five genes (P4HA2, PLXND1, COL22A1, COL5A1, and NID2) and a transcription factor (Sox8) were identified as the hub genes (Figure 5A). P4HA2 and COL5A1 are related to collagen synthesis, COL22A1 is related to skeletal muscle contraction, and the transcription factor Sox8 is involved in regulating embryonic development. The top four genes (FBXL4, FBXO32, TBC1D17, and PCMTD2) and a transcription factor (RORC) were identified with the highest degree of connectivity in the interaction network of MM. grey60 module as hub genes (Figure 5B). FBXL4 was found to play a critical role in the cell cycle, FBXO32 was related to muscle atrophy, and TBC1D17 is related to mitochondrial autophagy; RORC is a DNA binding transcription factor. The top four transcription factors (PPARA, ADAM30, UBTFL1, and EGR2) and a gene (KNDC1) were identified to possess the highest degree of connectivity in the interaction network of MM.dark-red module as hub genes (Figure 5C). Among these genes, PPARA was related to fat deposition, EGR2 was involved in fat metabolism, UBTFL1 was involved in early development and the origin of embryonic stem cells, ADAM30 was involved in muscle development.
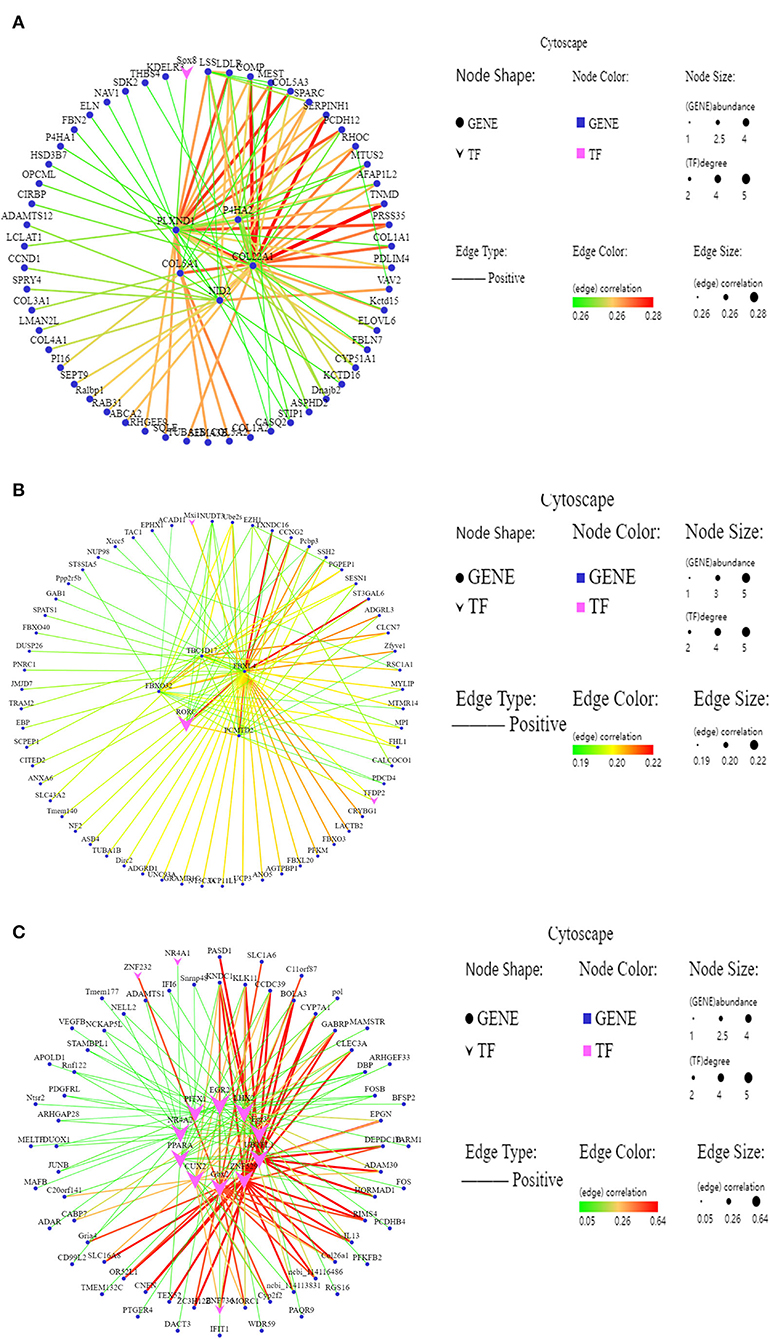
Figure 5. The gene co-expression regulatory interaction network. (A–C) Gene co-expression network of the MM.green module, MM.grey60 module, MM.dark-red module, respectively. Larger and darker colors in large lines in the corresponding network indicate genes with higher connectivity; vee represents transcription factors; ellipse represent other genes.
RT-qPCR Validation
There were 20 genes randomly selected for validation by RT-qPCR in different compare group, and the RT-qPCR results were consistent with the RNA-seq results (Figures 6A–D).
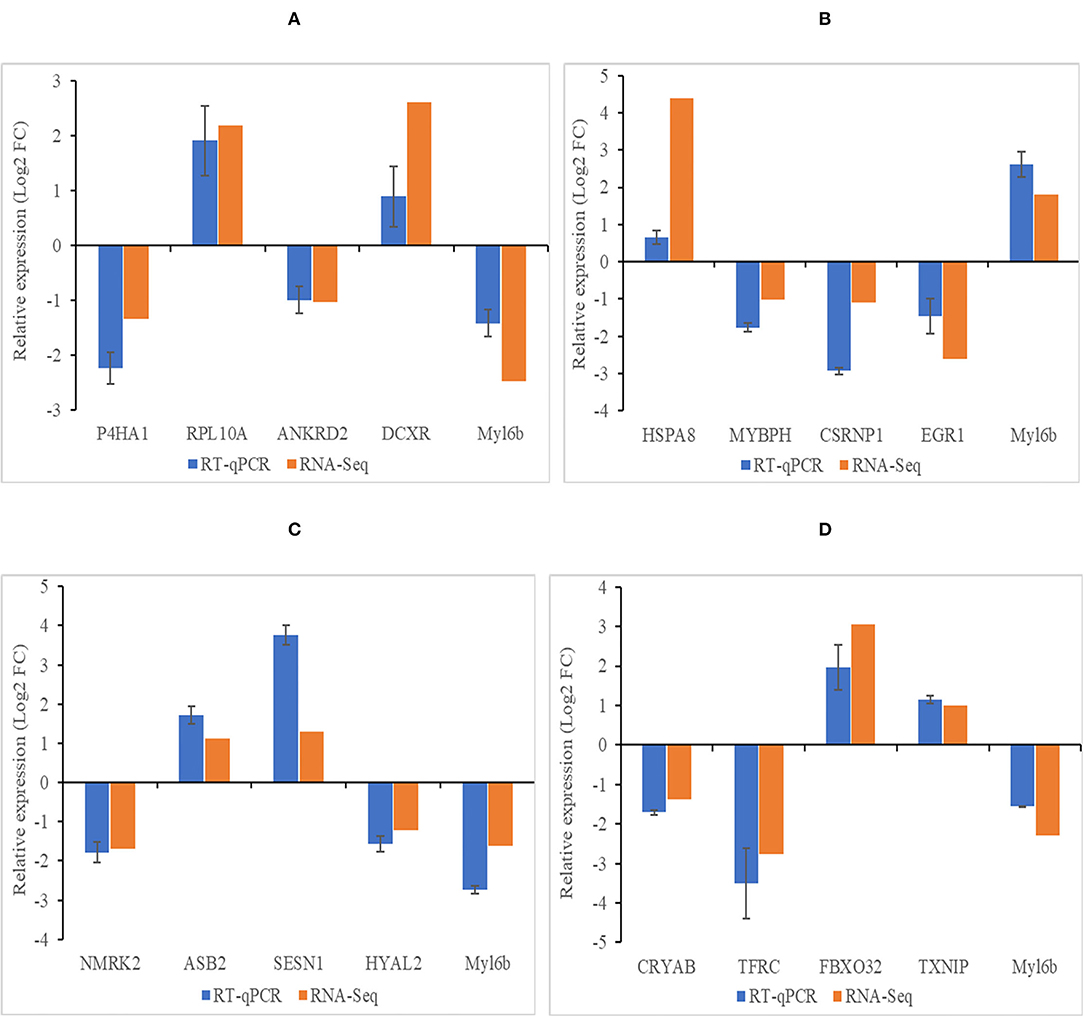
Figure 6. Verification results of DEGs by RT-qPCR. (A–D) Histogram diagram of validation results in group of 4 months vs. 1.5 years, 1.5 years vs. 3.5 years, 3.5 years vs. 6 years, and 4 months vs. 6 years, respectively. Abscissa represents genes in different compare group, ordinate represents the relative fold change. Data shown on figure are mean ± SEM.
Discussion
This study revealed the molecular mechanism of the difference in the meat yield, meat quality, and muscle tenderness of the Tibetan sheep at different growth stages. The meat tenderness mainly influences the consumers' intention for purchase as well as the key factor for its market acceptance (4). The IMF content critically influences the tenderness, juiciness, and flavor, and has a positive impact on meat tenderness (38). Similar to the study by Pascual–Alonso et al. (39), the increase in the sheer force with the increase of age (p < 0.05). In this study, was the highest in the 6 years Tibetan sheep meat. The IMF content increased from 4 months to 1.5 years, and then decreased and this was consistent with the result of Saccà (2019) study on the goat meat at different growth stages (5). In this study, the IMF content and dressing percentage of Tibetan sheep were the highest in 1.5 years; therefore, 1.5 years is the most suitable slaughter age for Tibetan sheep and yields better meat quality.
Transcriptome analysis has been applied in many applied research. This novel study has revealed the molecular mechanism of differences in Tibetan sheep meat tenderness at different ages using the RNA-seq approach. In this study, four samples were selected each group. However, based on the expression of the entire gene in any two samples, the correlation coefficient of every two samples were calculated, and the results showed the correlation coefficients of the Tibetan sheep to be above 0.983, 0.890, 0.962, and 0.990 at 4 months, 1.5 years, 3.5 years, and 6 years, respectively, Hence, the four sample sizes were found to satisfy the reliability of the RNA-seq results (11).
There are two stages of muscle growth and development in mammals, before and after birth. During the fetal period of development stage before birth, a group of mesenchymal cells located paraxial mesoderm of the embryo can form skeletal muscle. The precursor myoblasts are formed first, and then the cell fusion forms multinucleated primitive muscle fibers with a nucleus in the center after the proliferation of myoblasts. The number of muscle fibers in mammals remains constant after birth development (1, 2); however, the muscle fiber diameter increases and the tenderness decreases with age in this growth stage, and various muscle fibers transform each other simultaneously (3). The different types of muscle fibers are closely related to meat color, tenderness, water-holding, juiciness, and flavor. Our previous study has identified four types of muscle fibers (Types I, IIa, IIx, and IIb) in the LT muscle of the Tibetan sheep at different ages, corresponding to the four myosin heavy chains, MyHC I, MyHC IIa, MyHC IIx, and MyHC IIb, respectively (40).
MYH4 is a differentially expressed gene in the LT muscle of 4 months vs. 1.5 years group, while, there was no difference in the group of the 1.5 years vs. 3.5 years and 3.5 years vs. 6 years. MYH1 and MYH4 were differential expressed; however, MYH2 and MYH7 were not expressed in the group of 4 months vs. 6 years. MYH1, MYH2, MYH4, and MYH7 encode MyHC IIx, MyHC IIa, MyHC IIb, and MyHC I types of muscle fibers in the mammalian skeletal muscle, respectively. Generally, the type I fibers generally contain more lipids than the type IIb fibers, whereas a high content of type IIb fiber accounts for the toughness of the meat (41). The previous studies have identified the types of muscle fibers in the skeletal muscles to transform each other with the increase of age (42). Also, AMPK is an important signaling pathway that transforms the muscle fiber types, which is mainly linked with the regulation of the energy and energy regulators of the cells (43). This study, identified the DEGs in the 4 months vs. 1.5 years group as the most significantly enriched (p < 0.05) in the AMPK signaling pathway (p = 0.00006), with 14 annotated DEGs including LIPE, PCK1, IRS2, PFKFB2, LEP, EEF2, and ACC1, which were closely related to cell proliferation and metabolism. The lipase E hormone sensitive (LIPE) is a type of lipid catabolism enzyme, with a key role in regulating the deposition of fat tissues. The genetic polymorphism of LIPE has been closely related to the dressing percentage of sheep (44).
PFKFB2 is related to cell proliferation (45) and survival (46). PCK1 was originally identified as a gluconeogenic enzyme and has been recently shown to possess protein kinase activity (47). Leptin (LEP) is a kind of adipokines produced by adipocytes or other cells. In vitro studies have found LEP to stimulate the activation and proliferation of the endothelial cells (48). The eukaryotic translation elongation factor (EEF2), controls the translational elongation of proteins and inhibits protein production. ACC1 is an acetyl-CoA carboxylase, providing malonyl-CoA for mitochondrial biogenesis (49). The content of mitochondria was found to be different for the different types of muscle fibers, so ACC1 might be involved in muscle fiber types switching. This study found significant enrichment of PRKAG2, ADIPOQ, PIK3R3, and ACACA in the AMPK signaling pathway in the 1.5 years vs. 3.5 years group (p < 0.05). These genes were mainly involved in the lipid metabolism pathways. PRKAG2 participates in regulating the AMPK activity and further affects the AMPK signaling pathway. ADIPOQ plays an important role in fat metabolism regulation, mainly by binding to the receptors and playing a biological function by acting on the target tissues. ADIPOQ receptor 1 (AdipoR1) preferentially binds to the spherical region of ADIPOQ, which is expressed in the skeletal muscle cells and acts through the AMPK and mitogen activated protein kinase (MAPK) pathways (50). ACACA is an acetyl-Coenzyme A carboxylase α is a key rate limiting enzyme for synthesizing fatty acid, and plays an important regulatory role in fatty acid biosynthesis (51).
The genes of SREBF1, PRKAG2, CREB5, and SLC2A4 were significantly enriched in the AMPK signaling pathway in the 3.5 years vs. 6 years group (p < 0.05). The sterol regulatory element binding proteins (SREBPs) maintain lipid homeostasis by regulating target genes (52). Solute carrier family 2 member 4 (SLC2A4) has been related to the contraction of the skeletal muscles (53). Fifteen DEGs including ACACB, IRS2, IGF1R, Ppp2r2d, PCK1, LIPE, SCD, and FASN were found to be significantly enriched in the 4 months vs. 6 years group (p < 0.05) in the AMPK signaling pathway. ACACB was possibly involved in regulating fatty acid oxidation rather than fatty acid biosynthesis, thereby affecting the milk production of dairy cows (54). The type 1 insulin-like growth factor receptor (IGF1R) located on the cell membrane, is activated by the insulin-like growth factor (IGF1 or IGF2) and regulates the growth and differentiation of the cells, as well as the growth, development, and senescence of higher animals (55). SCD is stearoyl-CoA desaturase, previously identified to reduce adipogenesis in skeletal muscle upon inhibition of the SCD gene expression (56), while the knockout of SCD has been found to accelerate the accelerated fatty acid catabolism (57). FASN is a fatty acid synthase regulating the content of the saturated fatty acids in milk and meat (58), and further improving a human healthy diet.
In addition, the PPAR signaling pathway, glutathione metabolism, cell adhesion molecules (CAMs), insulin signaling pathway, and FoxO signaling pathway were significantly enriched in this study. The peroxisome proliferator activated receptor (PPAR) is a member of type II nuclear receptor superfamily, and a type of nuclear transcription factor activated by the ligands, which critically regulates lipid metabolism, adipogenesis, insulin sensitivity, inflammation, cell growth, and differentiation (59). There were significant enrichment of the genes PPARA, SCD, and APOA1 (p < 0.05) in the PPAR signaling pathway. These genes are related to lipid metabolism and also play a positive effect in regulating the muscle fiber types (60). The IGF-I of the insulin signaling pathway stimulates the differentiation rate of the myoblasts and affects the expression of the myogenic regulatory factor family genes (61). The FoxO signaling pathway is critical for cell proliferation, apoptosis, autophagy and inflammation (62, 63). The possible interaction of the signaling pathways involved in muscle, fat, and connective tissue development, form a complex regulatory network that affects muscle fiber development and type composition. These signaling pathways might be involved in muscle development and transformation of the muscle fiber type.
In this study, MM.green, MM.grey60, and MM.dark-red related to the meat quality and slaughter performance were identified using WGCNA. Among these modules, P4HA2, PLXND1, COL22A1, COL5A1, NID2, and Sox8 were identified as the hub gene in the interaction network of MM.green module. FBXL4, FBXO32, TBC1D17, and PCMTD2 were identified as the hub gene in the MM.grey60 module. PPARA, ADAM30, UBTFL1, EGR2, and KNDC1 were identified as the hub gene in the MM.dark-red module. P4HA2 is an important factor affecting hypoxia-inducible factor 1α (64), is a central gene for the Tibetan sheep to adapt to high altitude hypoxic conditions. PLXND1 regulates the cell patterns by regulating the structure of the cytoskeleton and adhesion proteins (65). COL22A1 encodes collagen, and knocking out the COL22A1 gene in zebrafish can lead to muscle atrophy (66), showing that COL22A1 is related to muscle development. The SOX family is a type of transcription factor regulating the genes related to organ development. and cell stemness and differentiation; SOX8 not only participates in the normal physiological functions but also closely affects the occurrence and development of tumors (67). The proteins FBXL4 and FBX032 are related to the cell cycle transition, apoptosis, transcription regulation, cell signal transduction, and other various physiological functions by recognizing and degrading substrate proteins (68). TBA1D17 might be involved in mitochondrial autophagy, and the content of mitochondria in muscle cells might be related to the muscle fiber types switching. PPARα regulates the expression of many proteins related to fat metabolism homeostasis (69). This study, investigated changes in the multiple genes involved in muscle growth and the difference in meat tenderness of LT muscle in Tibetan sheep at different ages. The DEGs, GO terms, KEGG signaling pathway and hub genes helped to better understand the muscle growth and development and meat quality of Tibetan sheep at different ages, which would benefit in improving the meat quality in the Tibetan sheep in the future.
Conclusion
In conclusion, the results indicated 1.5 years as the most suitable slaughter age of Tibetan sheep. The KEGG enrichment results showed that LIPE, LEP, ADIPOQ, SCD, and FASN might be participated in the AMPK signaling pathway to regulate the muscle development and muscle fiber types transformation of Tibetan sheep, thereby effecting the meat quality. P4HA2, COL22A1, COL5A1, FBXO32, TBC1D17, and Sox8 were related to the meat tenderness and protein content. PPARA, EGR2, and ADAM30 were related to the IMF content. This study provides a theoretical foundation for studying the mechanism for the difference of Tibetan sheep meat quality at the molecular level and further to improve the meat quality traits.
Data Availability Statement
The datasets presented in this study can be found in online repositories. The names of the repository/repositories and accession number(s) can be found in the article/Supplementary Material.
Ethics Statement
The animal study was reviewed and approved by the Faculty Animal Policy and Welfare Committee of Gansu Agricultural University (Ethic approval file No. GSAU-Eth-AST-2021-001).
Author Contributions
YW: data curation and writing—original draft. JW, XL, and GB: formal analysis, methodology, and software. JH, ZZ, BS, and FZ: investigation, validation, methodology, and software. SL: funding acquisition and writing—review and editing. YL: project administration, supervision, and writing—review and editing. All authors contributed to the article and approved the submitted version.
Funding
This work was supported by the fund of Basic Research Creative Groups of Gansu Province (17JR5RA137), the Fuxi Young Talents Fund of Gansu Agricultural University (Gaufx-03Y04) and the Projects of Gansu Agricultural University (GSAU-ZL-2015-031/033), and the key R&D projects in Gansu Province (18YF1WA082).
Conflict of Interest
The authors declare that the research was conducted in the absence of any commercial or financial relationships that could be construed as a potential conflict of interest.
Publisher's Note
All claims expressed in this article are solely those of the authors and do not necessarily represent those of their affiliated organizations, or those of the publisher, the editors and the reviewers. Any product that may be evaluated in this article, or claim that may be made by its manufacturer, is not guaranteed or endorsed by the publisher.
Acknowledgments
The authors would like to thank all the reviewers who participated in the review, as well as MJEditor (www.mjeditor.com) for providing English editing services during the preparation of this manuscript.
Supplementary Material
The Supplementary Material for this article can be found online at: https://www.frontiersin.org/articles/10.3389/fvets.2022.926725/full#supplementary-material
Supplementary Figure 1. AMPK signaling pathway.
Supplementary Table 1. The information of PCR primer used for RT-qPCR.
Supplementary Table 2. The summary of the RNA-seq data.
Supplementary Table 3. The information of DEGs of the contiguous period transcriptome comparative groups.
Supplementary Table 4. The results of GO annotation in the contiguous period transcriptome comparative groups.
Supplementary Table 5. The results of KEGG signaling pathway in the contiguous period transcriptome comparative groups.
References
1. Wang X, Xu T, Zhang X, Geng Y, Kang S, Xu S, et al. Effects of dietary protein levels on growth performance, carcass traits, serum metabolites, and meat composition of Tibetan sheep during the cold season on the Qinghai-Tibetan Plateau. Animals. (2020) 10:801. doi: 10.3390/ani10050801
2. Du M, Wang B, Fu X, Yang Q, Zhu MJ. Fetal programming in meat production. Meat Sci. (2015) 109:40–7. doi: 10.1016/j.meatsci.2015.04.010
3. Oksbjerg N, Therkildsen M. Myogenesis and muscle growth and meat quality. New aspects of meat quality. Food Sci Technol Nutr. (2017) 33–62. doi: 10.1016/B978-0-08-100593-4.00003-5
4. Kim GD, Ryu YC, Jo C, Lee JG, Yang HS, Jeong JY, et al. The characteristics of myosin heavy chain-based fiber types in porcine longissimus dorsi muscle. Meat Sci. (2014) 96:712–8. doi: 10.1016/j.meatsci.2013.09.028
5. Anderson MJ, Lonergan SM, Fedler CA, Prusa KM, Binning JM, Huff-Lonergan E. Profile of biochemical traits influencing tenderness of muscles from the beef round. Meat Sci. (2012) 91:247–54. doi: 10.1016/j.meatsci.2012.01.022
6. Saccà E, Corazzin M, Bovolenta S, Piasentier E. Meat quality traits and the expression of tenderness-related genes in the loins of young goats at different ages. Animal. (2019) 13:2419–28. doi: 10.1017/S1751731119000405
7. Silva-Vignato B, Coutinho LL, Cesar ASM, Poleti MD, Regitano LCA, Balieiro JCC. Comparative muscle transcriptome associated with carcass traits of Nellore cattle. BMC Genomics. (2017) 18:506. doi: 10.1186/s12864-017-3897-x
8. Zhang HM, Xia HL, Jiang HR, Mao YJ, Qu KX, Huang BZ, et al. Longissimus dorsi muscle transcriptomic analysis of Yunling and Chinese simmental cattle differing in intramuscular fat content and fatty acid composition. Genome. (2018) 61:549–58. doi: 10.1139/gen-2017-0164
9. Cheng SR, Wang XY, Zhang QW, He Y, Zhang X, Yang L, et al. Comparative transcriptome analysis identifying the different molecular genetic markers related to production performance and meat quality in Longissimus Dorsi tissues of MG x STH and STH Sheep. Genes. (2020) 11:183. doi: 10.3390/genes11020183
10. Sun LL, Bai M, Xiang LJ, Zhang G, Ma W, Jiang H. Comparative transcriptome profiling of longissimus muscle tissues from Qianhua mutton merino and small tail han sheep. Sci Rep. (2016) 6:33586. doi: 10.1038/srep33586
11. Shen JY, Hao ZY, Wang JQ, Hu J, Liu X, Li S, et al. Comparative transcriptome profile analysis of longissimus dorsi muscle tissues from two goat breeds with different meat production performance using RNA-Seq. Front Genet. (2021) 11:619399. doi: 10.3389/fgene.2020.619399
12. Bentzinger CF, Wang YX, Rudnicki MA. Building muscle: molecular regulation of myogenesis. Cold Spring Harb Perspect Biol. (2012) 4:a008342. doi: 10.1101/cshperspect.a008342
13. Sabourin LA, Rudnicki MA. The molecular regulation of myogenesis. Clin Genet. (2000) 57:16–25. doi: 10.1034/j.1399-0004.2000.570103.x
14. Chen PR, Lee K. Invited review: inhibitors of myostatin as methods of enhancing muscle growth and development. J Anim Sci. (2016) 94:3125–34. doi: 10.2527/jas.2016-0532
15. Kim GD, Ryu YC, Jeong JY, Yang HS, Joo ST. Relationship between pork quality and characteristics of muscle fibers classified by the distribution of myosin heavy chain isoforms. J Anim Sci. (2013) 91:5525–34. doi: 10.2527/jas.2013-6614
16. Liu YF, Zhang M, Shan YJ, Ji G, Ju X, Tu Y, et al. miRNA-mRNA network regulation in the skeletal muscle fiber phenotype of chickens revealed by integrated analysis of miRNAome and transcriptome. Sci Rep. (2020) 10:10619. doi: 10.1038/s41598-020-67482-9
17. Zhu JY, Shi X, Lu HZ, Xia B, Li Y, Li X, et al. RNA-seq transcriptome analysis of extensor digitorum longus and soleus muscles in large white pigs. Mol Genet Genomics. (2016) 291:687–701. doi: 10.1007/s00438-015-1138-z
18. Park SK, Sheffler TL, Spurlock ME, Grant AL, Gerrard DE. Chronic activation of 5'-AMP-activated protein kinase changes myosin heavy chain expression in growing pigs. J Anim Sci. (2009) 87:3124–33. doi: 10.2527/jas.2009-1989
19. Bao GL, Zhao FF, Wang JQ, Liu X, Hu J, Shi B, et al. Characterization of the circRNA-miRNA-mRNA network to reveal the potential functional ceRNAs associated with dynamic changes in the meat quality of the longissimus thoracis muscle in Tibetan sheep at different growth stages. Front Vet Sci. (2022) 9:803758. doi: 10.3389/fvets.2022.803758
20. Honikel KO. Reference methods for the assessment of physical characteristics of meat. Meat Sci. (1998) 49:447–57. doi: 10.1016/S0309-1740(98)00034-5
21. AOAC. Official Methods of Analysis 18th ed. Gaithersburg, MD: Association of official Analytical Chemists (2007).
22. Folch J, Lees M, Sloane Stanley GH. A simple method for the isolation and purification of total lipides from animal tissues. J Biol Chem. (1957) 226:497–509. doi: 10.1016/S0021-9258(18)64849-5
23. Bao GL, Li SB, Zhao FF, Wang J, Liu X, Hu J, et al. Comprehensive transcriptome analysis reveals the role of lncRNA in fatty acid metabolism in the longissimus thoracis muscle of Tibetan sheep at different ages. Front Nutr. (2022) 9:847077. doi: 10.3389/fnut.2022.847077
24. Chen S, Zhou Y, Chen Y, Gu J. Fastp: an ultra-fast all-in-one FASTQ preprocessor. Bioinformatics. (2018) 34:884–90. doi: 10.1093/bioinformatics/bty560
25. Langmead B, Salzberg SL. Fast gapped-read alignment with bowtie 2. Nat Methods. (2012) 9:357–9. doi: 10.1038/nmeth.1923
26. Kim D, Langmead B, Salzberg SL. HISAT a fast spliced aligner with low memory requirements. Nat Methods. (2015) 12:357–60. doi: 10.1038/nmeth.3317
27. Pertea M, Pertea GM, Antonescu CM, Chang TC, Mendell JT, Salzberg SL. StringTie enables improved reconstruction of a transcriptome from RNA-seq reads. Nat Biotechnol. (2015) 33:290–5. doi: 10.1038/nbt.3122
28. Trapnell C, Williams BA, Pertea G, Mortazavi A, Kwan G, van Baren MJ, et al. Transcript assembly and quantification by RNA-Seq reveals unannotated transcripts and isoform switching during cell differentiation. Nat Biotechnol. (2010) 28:511–5. doi: 10.1038/nbt.1621
29. Dewey CN, Li B. RSEM accurate transcript quantification from RNA-Seq data with or without a reference genome. BMC Bioinformatics. (2011) 12:323–323. doi: 10.1186/1471-2105-12-323
30. Love MI, Huber W, Anders S. Moderated estimation of fold change and dispersion for RNA-seq data with DESeq2. Genome Biol. (2014) 15:550. doi: 10.1186/s13059-014-0550-8
31. Robinson MD, McCarthy DJ, Smyth GK. EdgeR: a bioconductor package for differential expression analysis of digital gene expression data. Bioinformatics. (2010) 26:139–40. doi: 10.1093/bioinformatics/btp616
32. Kanehisa M, Araki M, Goto S, Hattori M, Hirakawa M, Itoh M, et al. KEGG for linking genomes to life and the environment. Nucleic Acids Res. (2008) 36:480–4. doi: 10.1093/nar/gkm882
33. Botía JA, Vandrovcova J, Forabosco P, Guelfi S, D'Sa K., UK Brain Expression Consortium, et al. An additional k-means clustering step improves the biological features of WGCNA gene co-expression networks. BMC Syst Biol. (2017) 11:47. doi: 10.1186/s12918-017-0420-6
34. Shannon P, Markiel A, Ozier O, Baliga NS, Wang JT, Ramage D, et al. Cytoscape: a software environment for integrated models of biomolecular interaction networks. Genome Res. (2003) 13:2498–504. doi: 10.1101/gr.1239303
35. Wen YL, Li SB, Zhao FF, Wang J, Liu X, Hu J, et al. Changes in the mitochondrial dynamics and functions together with the mRNA/miRNA network in the heart tissue contribute to hypoxia adaptation in Tibetan Sheep. Animals. (2022) 12:583. doi: 10.3390/ani12050583
36. Livak KJ, Schmittgen TD. Analysis of relative gene expression data using real-time quantitative PCR and the 2(-Delta Delta C(T)) Method. Methods. (2001) 25:402–8. doi: 10.1006/meth.2001.1262
37. Mortazavi A, Williams BA, McCue K, Schaeffer L, Wold B. Mapping and quantifying mammalian transcriptomes by RNA-Seq. Nat Methods. (2008) 5:621–8. doi: 10.1038/nmeth.1226
38. Renand G, Picard B, Touraille C, Berge P, Lepetit J. Relationships between muscle characteristics and meat quality traits of young Charolais bulls. Meat Sci. (2001) 59:49–60. doi: 10.1016/S0309-1740(01)00051-1
39. Pascual-Alonso M, Aguayo-Ulloa L, Miranda-De la Lama GC, Alierta S, Olleta JL, Campo MM, et al. Effect of slaughter age on meat quality of Chamarito lambs. Animal Genet Res. (2015) 57:73–9. doi: 10.1017/S2078633615000156
40. Bao GL, Liu X, Wang JQ, Hu J, Shi B, Li S, et al. Effects of slaughter age on myosin heavy chain isoforms muscle fibers fatty acids and meat quality in Longissimus thoracis muscle of Tibetan sheep. Front Vet Sci. (2021) 8:689589. doi: 10.3389/fvets.2021.689589
41. Kang YK, Choi YM, Lee SH, Choe JH, Hong KC, Kim BC, et al. Effects of myosin heavy chain isoforms on meat quality fatty acid composition and sensory evaluation in Berkshire pigs. Meat Sci. (2011) 89:384–9. doi: 10.1016/j.meatsci.2011.04.019
42. Candek-Potokar M, Zlender B, Lefaucheur L, Bonneau M. Effects of age and/or weight at slaughter on longissimus dorsi muscle: biochemical traits and sensory quality in pigs. Meat Sci. (1998) 48:287–300. doi: 10.1016/S0309-1740(97)00109-5
43. Witczak CA, Sharoff CG, Goodyear LJ. AMP-activated protein kinase in skeletal muscle: from structure and localization to its role as a master regulator of cellular metabolism. Cell Mol Life Sci. (2008) 65:3737–55. doi: 10.1007/s00018-008-8244-6
44. Al-Thuwaini TM, Al-Shuhaib MBS, Lepretre F, Mahdi ZA. Co-inherited novel SNPs of the LIPE gene associated with increased carcass dressing and decreased fat-tail weight in Awassi breed. Trop Anim Health Prod. (2020) 52:3631–8. doi: 10.1007/s11250-020-02400-9
45. Yalcin A, Clem BF, Simmons A, Lane A, Nelson K, Clem AL, et al. Nu-clear targeting of 6-phosphofructo-2-kinase (PFKFB3) increases proliferation via cyclin-dependent kinases. J Biol Chem. (2009) 284:24223–32. doi: 10.1074/jbc.M109.016816
46. Ozcan SC, Sarioglu A, Altunok TH, Akkoc A, Guzel S, Guler S, et al. PFKFB2 regulates glycolysis and proliferation in pancreatic cancer cells. Mol Cell Biochem. (2020) 470:115–29. doi: 10.1007/s11010-020-03751-5
47. Xu DQ, Wang Z, Xia Y, Shao F, Xia W, Wei Y, et al. The gluconeogenic enzyme PCK1 phosphorylates INSIG1/2 for lipogenesis. Nature. (2020) 580:530–5. doi: 10.1038/s41586-020-2183-2
48. Yu YM, Tsai CC, Tzeng YW, Chang WC, Chiang SY, Lee MF. Ursolic acid suppresses leptin-induced cell pro-liferation in rat vascular smooth muscle cells. Can J Physiol Pharmacol. (2017) 95:811–8. doi: 10.1139/cjpp-2016-0398
49. Monteuuis G, Suomi F, Kerätär JM, Masud AJ, Kastaniotis AJ. A conserved mammalian mitochondrial isoform of acetyl-CoA carboxylase ACC1 provides the malonyl-CoA essential for mitochondrial biogenesis in tandem with ACSF3. Biochem J. (2017) 474:3783–97. doi: 10.1042/BCJ20170416
50. Tomas E, Tsao TS, Saha AK. Enhanced muscle fat oxidation and glucose transport by ACRP30 globular domain: acetyl-CoA carboxylase inhibition and AMP-activated protein kinase activation. Proc Natl Acad Sci U S A. (2002) 99:16309–13. doi: 10.1073/pnas.222657499
51. Tong L. Acetyl-coenzyme A carboxylase: crucial metabolic enzyme and attractive target for drug discovery. Cell Mol Life Sci. (2005) 62:1784–803. doi: 10.1007/s00018-005-5121-4
52. Liang C, Qiao LY, Han YL, Liu J, Zhang J, Liu W. Regulatory roles of SREBF1 and SREBF2 in lipid metabolism and deposition in two chinese representative fat-tailed sheep breeds. Animals. (2020) 10:1317. doi: 10.3390/ani10081317
53. Machado UF, Shimizu I, Saito M. Reduced content and preserved translocation of glucose transporter (GLUT 4) in white adipose tissue of obese mice. Physiol Behav. (1994) 55:621–5. doi: 10.1016/0031-9384(94)90035-3
54. Han B, Liang W, Liu L, Sun D. Genetic association of the ACACB gene with milk yield and composition traits in dairy cattle. Anim Genet. (2018) 49:169–77. doi: 10.1111/age.12651
55. Li J, Choi E, Yu HT, Bai XC. Structural basis of the activation of type 1 insulin-like growth factor receptor. Nat Commun. (2019) 10:4567. doi: 10.1038/s41467-019-12564-0
56. Poudyal H, Brown L. Stearoyl-CoA desaturase: a vital checkpoint in the development and progression of obesity Endocr Metab Immune Disord Drug Targets. (2011) 11:217–31. doi: 10.2174/187153011796429826
57. Dobrzyn P, Dobrzyn A, Miyazaki M, Cohen P, Asilmaz E, Hardie DG, et al. Stearoyl-CoA desaturase 1 deficiency increases fatty acid oxidation by activating AMP-activated protein kinase in liver. Proc Natl Acad Sci U S A. (2004) 101:6409–14. doi: 10.1073/pnas.0401627101
58. Morris CA, Cullen NG, Glass BC, Hyndman DL, Manley TR, Hickey SM, et al. Fatty acid synthase effects on bovine adipose fat and milk fat. Mammalian Genome. (2007) 18:64–74. doi: 10.1007/s00335-006-0102-y
59. Giby VG, Ajith TA. Role of adipokines and peroxisome proliferator-activated receptors in nonalcoholic fatty liver disease. World J Hepatol. (2014) 6:570–9. doi: 10.4254/wjh.v6.i8.570
60. Wang YX, Zhang CL, Yu RT, Cho HK, Nelson MC, Bayuga-Ocampo CR, et al. Regulation of muscle fiber type and running endurance by PPARdelta. PLoS Biol. (2004) 2:e294. doi: 10.1371/journal.pbio.0020294
61. Coolican SA, Samuel DS, Ewton DZ, McWade FJ, Florini JR. The mitogenic and myogenic actions of insulin-like growth factors utilize distinct signaling pathways. J Biol Chem. (1997) 272:6653–62. doi: 10.1074/jbc.272.10.6653
62. Hu QX, Wang G, Peng JP, Qian G, Jiang W, Xie C, et al. Knockdown of SIRT1 suppresses bladder cancer cell proliferation and migration and induces cell cycle arrest and antioxidant response through FOXO3a-mediated pathways. Biomed Res Int. (2017) 2017:3781904. doi: 10.1155/2017/3781904
63. Zou ZW, Liu B, Zeng LS, Yang X, Huang R, Wu C, et al. Cx43 Inhibition attenuates sepsis-induced intestinal injury via downregulating ROS transfer and the activation of the JNK1/Sirt1/FoxO3a signaling pathway. Mediators Inflamm. (2019) 2019:7854389. doi: 10.1155/2019/7854389
64. Bruick RK, McKnight SL. A conserved family of prolyl-4-hydroxylases that modify HIF. Science. (2001) 294:1337–40. doi: 10.1126/science.1066373
65. Mehta V, Pang KL, Rozbesky D, Nather K, Keen A, Lachowski D, et al. The guidance receptor plexin D1 is a mechanosensor in endothelial cells. Nature. (2020) 578:290–5. doi: 10.1038/s41586-020-1979-4
66. Charvet B, Guiraud A, Malbouyres M, Zwolanek D., Guillon, Bretaud S, et al. Knockdown of col22a1 gene in zebrafish induces a muscular dystrophy by disruption of the myotendinous junction. Development. (2013) 140:4602–13. doi: 10.1242/dev.096024
67. Xie C, Han YW, Liu Y, Han L, Liu J. miRNA-124 down-regulates SOX8 expression and suppresses cell proliferation in non-small cell lung cancer. Int J Clin Exp Pathol. (2014) 7:7518–26.
68. Bai C, Sen P, Hofmann K, Ma L, Goebl M, Harper JW, et al. SKP1 connects cell cycle regulators to the ubiquitin proteolysis machinery through a novel motif the F-box. Cell. (1996) 86:263–74. doi: 10.1016/S0092-8674(00)80098-7
Keywords: RNA sequencing, Tibetan sheep, muscle tenderness, different growth stages, muscle development, meat quality
Citation: Wen Y, Li S, Bao G, Wang J, Liu X, Hu J, Zhao F, Zhao Z, Shi B and Luo Y (2022) Comparative Transcriptome Analysis Reveals the Mechanism Associated With Dynamic Changes in Meat Quality of the Longissimus Thoracis Muscle in Tibetan Sheep at Different Growth Stages. Front. Vet. Sci. 9:926725. doi: 10.3389/fvets.2022.926725
Received: 23 April 2022; Accepted: 06 June 2022;
Published: 06 July 2022.
Edited by:
Li Guangyu, Qingdao Agricultural University, ChinaReviewed by:
Xiaofei Guo, Tianjin Academy of Agricultural Sciences, ChinaXin Wang, Northwest A&F University, China
Mingxing Chu, Institute of Animal Sciences (CAAS), China
Copyright © 2022 Wen, Li, Bao, Wang, Liu, Hu, Zhao, Zhao, Shi and Luo. This is an open-access article distributed under the terms of the Creative Commons Attribution License (CC BY). The use, distribution or reproduction in other forums is permitted, provided the original author(s) and the copyright owner(s) are credited and that the original publication in this journal is cited, in accordance with accepted academic practice. No use, distribution or reproduction is permitted which does not comply with these terms.
*Correspondence: Shaobin Li, lisb@gsau.edu.cn; Yuzhu Luo, luoyz@gsau.edu.cn
†These authors have contributed equally to this work