 Le Zhao
 Haili Yang
 Yongju Zhao
- Chongqing Key Laboratory of Herbivore Science, College of Animal Science and Technology, Southwest University, Chongqing, China
Brown adipose tissue (BAT) is mainly present in young mammals and is important for maintaining body temperature in neonatal mammals because of its ability to produce non-shivering thermogenesis. There is usually a large amount of BAT around the kidneys of newborn kids, but the BAT gradually “whiting” after birth. Screening and validating appropriate reference genes is a prerequisite for further studying the mechanism of goat brown adipose tissue “whiting” during the early stages. In this study, the expression stability of 17 candidate reference genes: 12 COPS8, SAP18, IGF2R, PARL, SNRNP200, ACTG1, CLTA, GANAB, GABARAP, PCBP2, CTSB, and CD151) selected based on previous transcriptome data as new candidate reference genes, 3 (PFDN5, CTNNB1, and EIF3M) recommended in previous studies, and 2 traditional reference genes (ACTB and GAPDH) was evaluated. Real-time quantitative PCR (RT-qPCR) technology was used to detect the expression level of candidate reference genes during goat BAT “whiting”. Four algorithms: Normfinder, geNorm, ΔCt method, and BestKeeper, and two comprehensive algorithms: ComprFinder and RefFinder, were used to analyze the stability of each candidate reference genes. GABARAP, CLTA, GAPDH, and ACTB were identified as the most stable reference genes, while CTNNB1, CTSB, and EIF3M were the least stable. Moreover, two randomly selected target genes IDH2 and RBP4, were effectively normalized using the selected most stable reference genes. These findings collectively suggest that GABARAP, CLTA, GAPDH, and ACTB are relatively stable reference genes that can potentially be used for the development of perirenal fat in goats.
Introduction
Nowadays, people's over-nutritious diets and sedentary lifestyles are easily causing obesity. Notably, obesity is closely related to hypertension and cardiovascular and metabolic diseases, having long-term health impacts (1). Mammalian adipose tissue can be divided into white adipose tissue (WAT) and brown adipose tissue (BAT) (2, 3). WAT is mainly in the form of triglycerides which store excess energy that is used when needed. BAT can increase the energy consumption of the body, and the adipose tissue has strong plasticity (4). Activating the formation of BAT or converting WAT into BAT could thus be an important strategy for treating obesity in the future (5). BAT also helps protect young animals against cold because it produces non-shivering thermogenesis.
Various techniques and tools, such as whole genome sequencing (WGS), methylated DNA co-immunoprecipitation (MeDIP-Seq), chromatin co-immunoprecipitation (ChIP-seq), and transcriptome sequencing (RNA-seq) have been used to further explore the developmental regulation process of adipose tissue. Quantitative real-time PCR (RT-qPCR) is an important method for analyzing gene expression because of its strong specificity, high sensitivity, and good repeatability. It has thus become a very effective method for detecting gene transcription levels (6–9). However, RT-qPCR results largely depend on the stability of the reference genes (8, 10). The expression of reference genes is not completely universal, and certain differences exist between different tissues, environmental conditions, and species (11–15).
To date, there are only a few systematic studies on goat adipose tissue reference genes despite many scholars having used different algorithms to evaluate some reference genes suitable for human and mouse adipose tissues (12, 16–21). In addition, the internal regulatory mechanism driving the change from BAT to WAT in goat kids remains unclear despite the change process of BAT to WAT occurring in goat and sheep perirenal adipose tissue from birth to adulthood (22, 23). It is particularly important to screen suitable reference genes to further study the internal regulatory mechanism driving this change process.
In this study, we systematically studied the perirenal adipose tissue of Dazu black goats at 0, 7, 14, 21, and 28 d after birth and screened 12 novel candidate reference genes through transcriptome sequencing. The candidate reference genes were compared and ranked using currently available major computational programs geNorm (14), ΔCt (24), Normfinder (25), BestKeeper (26), and RefFinder (27) methods and a comprehensive method ComprFinder (a newly developed method by our team) (10).
Materials and methods
Sample collection
Samples were collected at five postnatal stages: 0 days (n = 4), 7 days (n = 4), 14 days (n = 3), 21 days (n = 3), and 28 days (n = 4), denoted as D0, D7, D14, D21, and D28, respectively. The Dazu black goats were provided by Chongqing Tengda Animal Husbandry Co., Ltd., China.
The perirenal adipose tissue was collected after bloodletting and slaughtering the goats. Part of the perirenal adipose tissues were immediately stored in liquid nitrogen for RNA extraction. The remaining perirenal adipose tissues were washed with sterile saline, preserved in 4% paraformaldehyde, and stored at 4°C for later use in immunohistochemical tests.
Histological analysis and immunohistochemistry (IHC)
Perirenal adipose tissues were first fixed in 4% neutral buffered formaldehyde (pH 7.4) for over 24 h at room temperature and were then paraffin-embedded and cut into 5 μm sections. The sections were then subjected to hematoxylin-eosin (HE) and IHC staining following standard procedures. The primary antibody (anti-uncoupling protein 1 (UCP1) was purchased from Proteintech Group (Chicago, IL, USA). All images were taken using an Olympus DP73 camera installed on an Olympus IX51 inverted microscope.
Selection of candidate reference genes
We screened candidate reference genes from the RNA-seq data (Unpublished data) of 18 perirenal adipose tissues in the five stages. The screening of reference genes was based on the coefficient of variation (CV, %) and the fragments per kb per million reads (FPKM) value. The screening criteria were FPKM>50 and CV < 15%.
RNA extraction and cDNA synthesis
Total RNA from perirenal adipose tissue collected at different stages was extracted using the Trizol reagent (Invitrogen, USA) following the manufacturer's instructions. In brief, the adipose tissues were placed into a centrifuge tube containing 1 mL TRIzol reagent and incubated for 15 min, followed by the addition of 200 mL chloroform (cdkelong, Chengdu, China). The mixture was then centrifuged at 12,000 rpm for 20 min at 4°C to collect the supernatant to which 500 mL isopropanol (cdkelong, Chengdu, China) was added and the mixture further centrifuged at 12,000 rpm for 10 min at 4°C to pellet the RNA. The supernatant was drained off, and the pellet was washed several times with 1 mL of cold 75% ethanol by centrifuging at 12,000 rpm for 5 min at 4°C. The pellets were then air-dried and resuspended in 20 μL of DEPC-treated water. A Nanodrop2000 (ThermoFisher, Meridian, USA) was then used to measure the concentration and optical density (OD) ratio of OD260/OD280 of the RNA. RNA integrity was checked using agarose gel electrophoresis (Bio-Rad, Richmond, USA). First-strand cDNA was synthesized using Prime Script TM RT reagent Kit with gDNA Eraser (Tiangen, China).
RT-qPCR analysis
The primer pairs of COP9 signalosome subunit 8 (COPS8), Sin3A associated protein 18 (SAP18), Insulin-like growth factor 2 receptor (IGF2R), Small nuclear ribonucleoprotein U5 subunit 200 (SNRNP200), Presenilin associated rhomboid like (PARL), glucosidase II alpha subunit (GANAB), Actin gamma 1 (ACTG1), Poly(rC) binding protein 2 (PCBP2), Clathrin light chain A (CLTA), GABA type A receptor-associated protein (GABARAP), Cathepsin B (CTSB), CD151 molecule (Raph blood group) (CD151), Prefoldin subunit 5 (PFDN5), Catenin beta 1 (CTNNB1), Eukaryotic translation initiation factor 3 subunit M (EIF3M), Actin beta (ACTB) and, Glyceraldehyde-3-phosphate dehydrogenase (GAPDH) were designed using the Primer Premier 5.0 software. The sequences of the primer pairs are outlined in Supplementary Table 1. The RT-qPCR reactions were performed on a CFX96 Real-Time System (BIO-RAD) using TB Green ® Premix Ex Taq™ III. The RT-qPCR reaction conditions were: initial denaturation at 95°C for 30s, followed by 40 cycles of denaturation and annealing at 95°C for 5s and 60°C for 30s, respectively. The Ct values were automatically generated using the default settings of the Real-Time System.
Determination of the expression stability of the candidate reference genes
The evaluation of reference gene expression stability was based of the Ct data from all candidate reference genes obtained from RT-qPCR experiments. It was done using 5 widely used algorithms: geNorm (14), ΔCt (24), Normfinder (25), BestKeeper (26), and RefFinder (27), and the newly developed algorithm ComprFinder (10).
Validation of selected reference genes
Two genes, IDH2 which is highly expressed in brown adipose tissue, and RBP4 which are highly expressed in white adipose tissue, were selected to further verify the effect of the screened reference genes on the normalized target genes. The expression of the target genes was analyzed using traditional, the most stable, and the most unstable reference genes. The relative differences in gene expression were calculated using the 2−ΔΔCT method.
Results
RNA-seq-based selection of novel candidate reference genes during perirenal fat development in goats
The histological study of goat perirenal fat showed that the perirenal fat gradually changed from brown adipose tissue at D0 to white adipose tissue at D28 (Figure 1A). The immunohistochemical results of UCP1 also showed that the content of UCP1 was highest at D0, and then gradually decreased (Figure 1A).
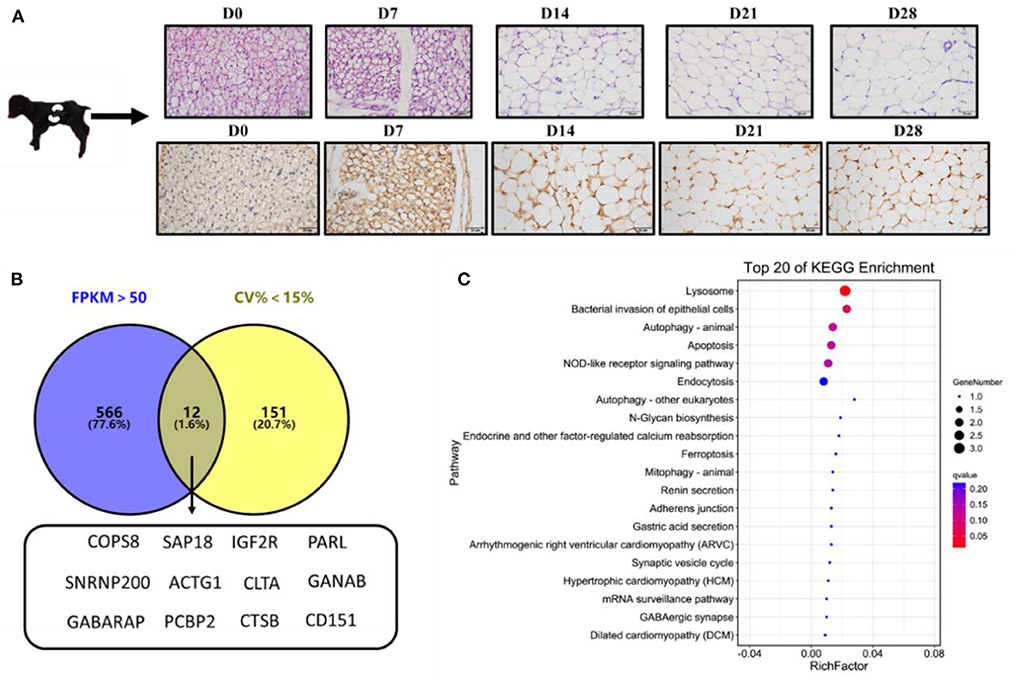
Figure 1. Selection of novel candidate reference genes. (A) Hematoxylin-eosin (HE) and UCP1immunohistochemical staining of perirenal adipose tissue; (B) Venn diagram of overlapping genes with FPKM >50 and CV < 15%; (C) The top 20 enriched signaling pathways of the 12 candidate reference genes based on KEGG analysis.
Analysis of the transcriptome sequencing data, based on FPKM>50 and CV < 15%, revealed 12 candidate reference genes: COPS8, SAP18, IGF2R, PARL, SNRNP200, ACTG1, CLTA, GANAB, GABARAP, PCBP2, CTSB, and CD151 (Figure 1B). KEGG enrichment analysis revealed that the genes were mainly enriched in lysosome pathways (Figure 1C). Reference genes reported in previous studies, including PFDN5, CTNNB1, and EIF3M (28), and 2 (ACTB and GAPDH) traditional reference genes used to study the expression of target genes (10, 29–31) were also included to study the expression levels of target genes in goat perirenal fat. The 17 genes were ranked according to their CV values, with the lower CV values get a higher-ranking order (Supplementary Table 2).
RNA purity and primer verification of the candidate reference genes
The RIN values of the 18 RNA samples extracted herein were between 7.6 and 9.7, and their concentrations were also high (Supplementary Table 3), indicating that the RNA quality of the samples was good and could be used for the next experiment. Primer specificity detection results showed that the 17 candidate reference genes had a single melting curve, with no non-specific amplification (Figure 2A). Agarose gel electrophoresis also revealed a single band of the amplified product, suggesting good primer specificity (Figure 2B).
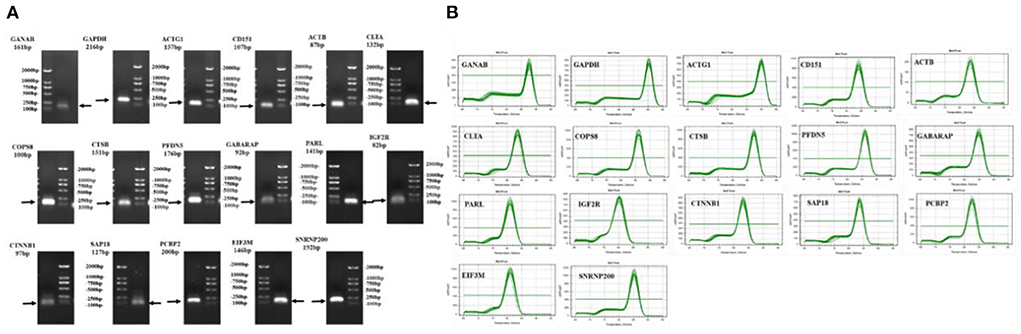
Figure 2. Detection the primer-specific detection of candidate reference genes. (A) Agarose gel electrophoresis detection of primers; (B) Melting curves of primers.
Analysis of the expression levels of the candidate reference gene
The expression levels of the 17 candidate reference gene were tested by qPCR. Notably, SAP18 (mean Ct value: 22.938) had the lowest cycle threshold (Ct) value, while GANAB (mean Ct value: 30.617) had the highest Ct (Figure 3). The Ct values of the other genes lay within certain ranges: GAPDH 22.56 and 23.30 (mean Ct value: 22.9535), GABARAP 22.51 and 24.00 (mean Ct value: 23.187), PFDN5 22.41 and 24.01 (mean Ct value: 23.3385), EIF3M 22.87 and 26.02 (mean Ct value: 24.3755), PCBP2 23.69 and 25.51 (mean Ct value: 24.5305), CLTA 24.09 and 25.85 (mean Ct value: 25.0085), ACTG1 24.09 and 26.31 (mean Ct value: 25.147), COPS8 24.44 and 26.32 (mean Ct value: 25.3245), ACTB 25.59 and 26.80 (mean Ct value: 26.089), PARL 25.31 and 27.19 (mean Ct value: 26.186), CTNNB1 25.68 and 28.15 (mean Ct value: 26.186) 27.0155, SNRNP200 26.83 and 28.55 (mean Ct value: 27.797), CD151 27.92 and 29.75 (mean Ct value: 28.687), IGF2R 29.38 and 30.63 (mean Ct value: 29.8755), CTSB 29.19 and 32.67 (mean Ct value: 30.363), and GANAB 29.88 and 31.32 (mean Ct value: 30.617). GABARAP, GANAB, IGF2R, ACTB, and GAPDH had the most stable Ct values, while the CTSB, EIF3M, and CTNNB1 had the most unstable Ct values.
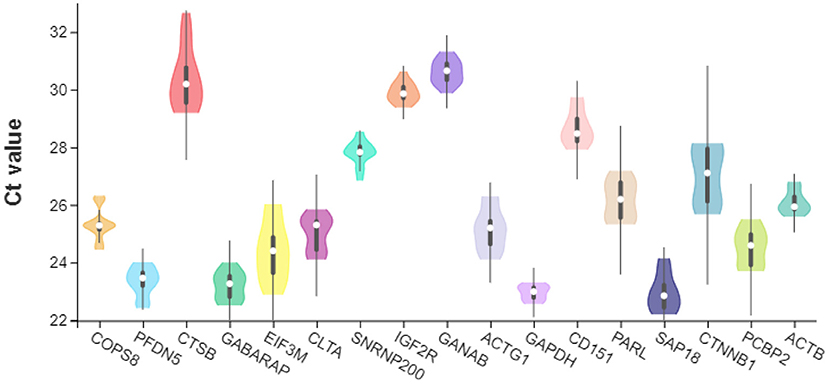
Figure 3. Violin plot of Ct values of 17 candidate reference genes.
GeNorm analysis
GeNorm was used to analyze the expression stability of the 17 candidate reference genes in goat perirenal fat at different periods after birth. The M value reflected the gene expression stability; the lower the M value, the more stable the gene expression and vice versa. GANAB and SAP18 had the lowest M values, while CTSB had the highest M values at D0 (Figure 4A). PFDN5 and ACTG1 were the most stable genes, while IGF2R was the least stable at D7 (Figure 4B). CTSB and GANAB were the most stable genes, while IGF2R was the least stable gene at D14 (Figure 4C). PFDN5 and PCBP2 were the most stable genes, while IGF2R was the least stable gene at D21 (Figure 4D). COPS8 and GANAB were the most stable genes, while CD151 was the least stable gene at D28 (Figure 4E). The rank order of all samples based on the M value was: CTSB>EIF3M>SAP18>CTNNB1>COPS8>PFDN5>CD151>IGF2R>GANAB>SNRNP200>GAPDH>ACTB>ACTG1>PCBP2>PARL> GABARAP and CLTA (Figure 4F). In the pairwise variation analysis, we found all the experimental variables were below the cut-off value of 0.15 (Supplementary Figure 1).
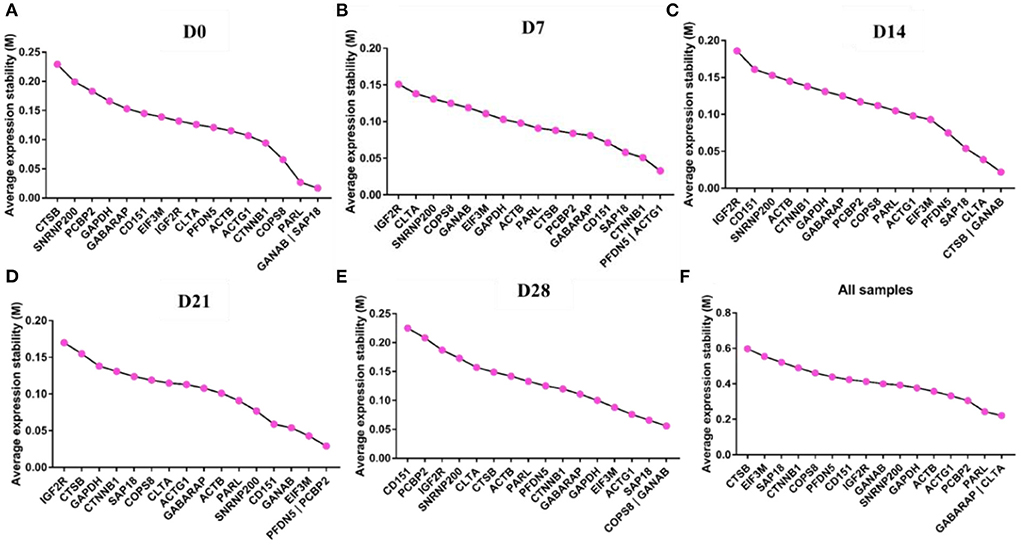
Figure 4. GeNorm analysis the average expression stability of candidate reference genes. (A) D0, (B) D7, (C) D14, (D) D21, (E) D28, and (F) All samples including D0–D28.
Normfinder analysis
Figure 5 shows the Normfinder-based analysis results of the expression stability of the 17 candidate reference genes. PFDN5 was the most stable gene, while CTSB was the least stable gene at D0. CTNNB1, COPS8, and CD151 were the most stable genes at D7, D14, and D21, respectively, while IGF2R was the most unstable gene. GABARAP was the most stable gene, while PCBP2 was the most unstable gene at D28. Notably, GABARAP was the most stable gene, while CTSB was the most unstable gene in all samples.
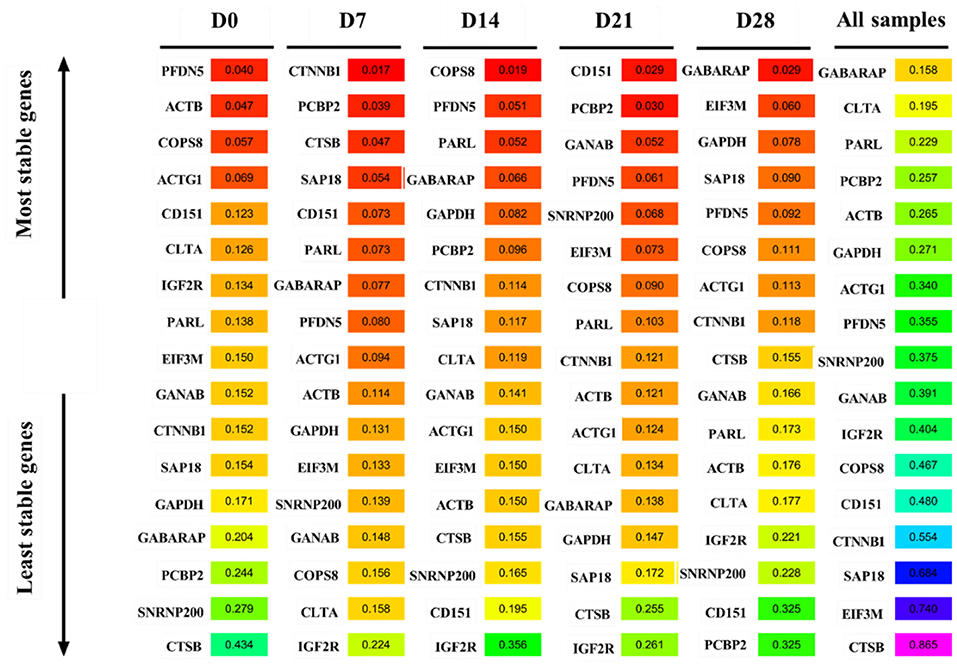
Figure 5. Normfinder analysis the average expression stability of candidate reference genes.
BestKeeper analysis
The stability of the candidate reference genes was also assessed using the BestKeeper; the lower the std-value, the more stable the gene expression, and vice versa. ACTB and PCBP2 were the most stably expressed genes at D0 and D21, respectively (Figure 6). In contrast, CTSB was the most unstable gene at D0 and D21but the most stable gene at D7. IGF2R was the most unstable gene at D7 and D14. GABARAP was the most stable gene, while CD151 was the most unstable gene at D28. Notably, GAPDH, IGF2R, SNRNP200, ACTB, GANAB, COPS8, PFDN5, and GABARAP were the most stable genes, while CTNNB1, EIF3M, and CTSB were the most unstable genes in all samples.
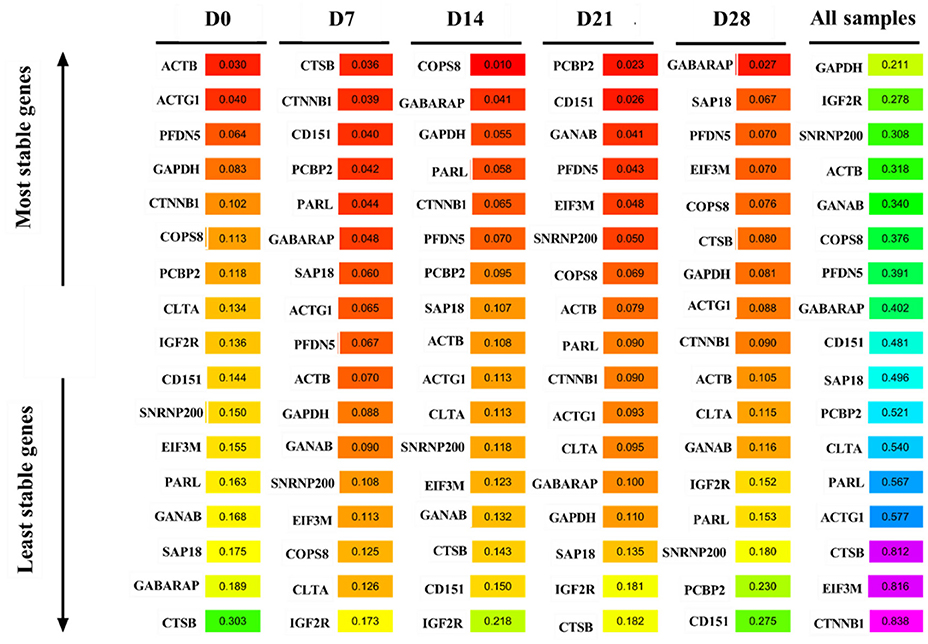
Figure 6. BestKeeper analysis the expression stability of candidate reference genes.
ΔCt analysis
Figure 7 shows the analysis results of the expression stability of the 17 candidate reference genes based on the ΔCt method. COPS8 was the most stable gene at D0 and D14, while CTSB was the least stable gene at D0. CTTNB1 and PCBP2 were the most stably expressed genes at D7 and D21, respectively. In contrast, IGF2R was the most unstable gene at D7, D14, and D21. EIF3M was the most stable gene, while CD151 was the most unstable gene at D28. GABARAP was the most stable gene, while CTSB was the most unstable gene in all samples.
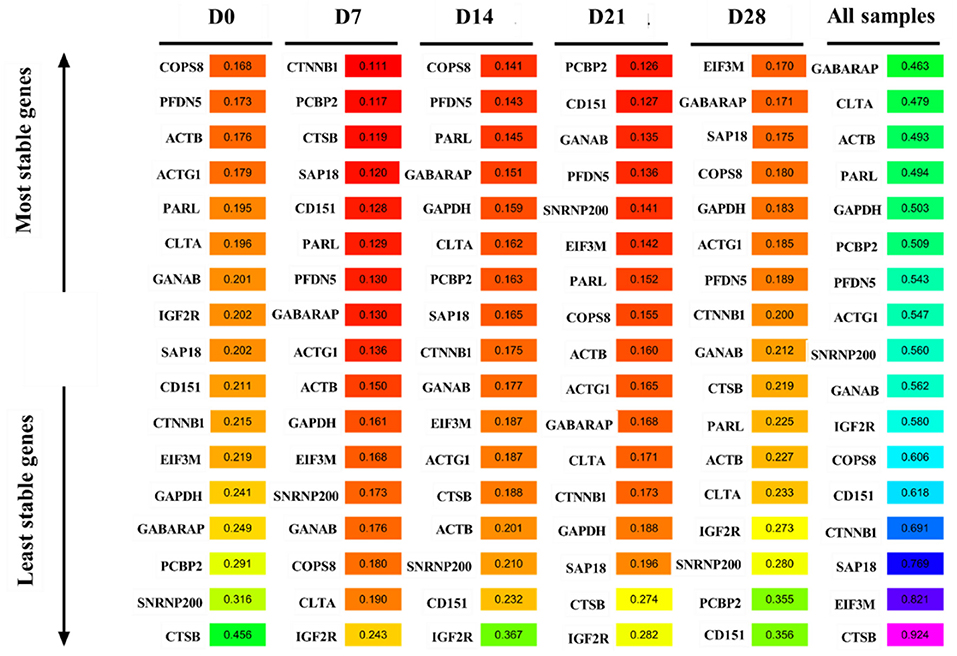
Figure 7. ΔCt method analysis the expression stability of candidate reference genes.
RefFinder analysis
The RefFinder algorithm was used to comprehensively rank the candidate reference genes based on geNorm, Normfinder, BestKeeper, and ΔCt methods. ACTB was the most stable gene, while CTSB was the most unstable gene at D0. CTTNB1, COPS8, and PCBP2were the most stably expressed genes at D7, D14, and D21, respectively. In contrast, IGF2R was the most unstable gene at D7, D14, and D21. GABARAP was the most stable gene, while CD151 was the most unstable gene at D28. GABARAP was the most stable gene, while CTSB was the most unstable gene in all samples (Figure 8).
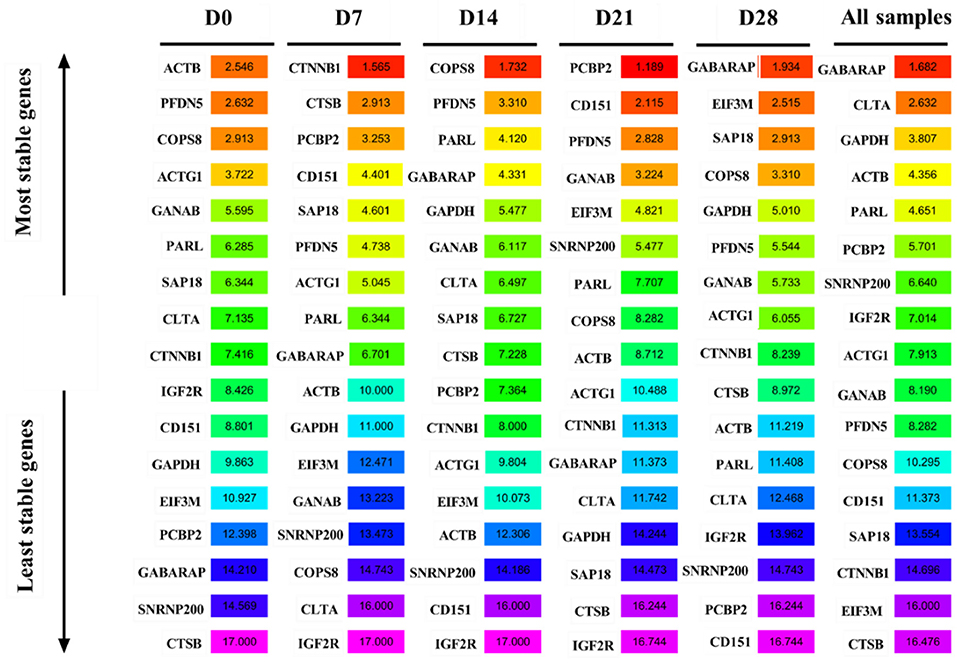
Figure 8. RefFinder analysis the expression stability of candidate reference genes.
ComprFinder analysis
ComprFinder is a new comprehensive analysis algorithm developed by our team during the early stage. Figure 9 shows the ComprFinder-based analysis results of the expression stability of the 17 candidate reference genes. ACTB was the most stable gene, while CTSB was the most unstable gene at D0. CTTNB1, COPS8, and PCBP2were the most stably expressed genes at D7, D14, and D21, respectively. However, IGF2R was the most unstable gene at D7, D14, and D21. GABARAP was the most stable gene, while CD151 was the most unstable gene at D28. GABARAP was the most stable gene, while CTSB was the most unstable gene in all samples.

Figure 9. ComFinder analysis the expression stability of candidate reference genes.
Validation of the most stable reference genes with target genes
GABARAP was the most stable gene, while CTSB was the most unstable gene amongst the 17 candidate reference genes at different stages of goat development. Similar target genes were normalized using the most stable reference genes GABARAP and CLTA, the traditional reference genes ACTB and GAPDH, and the most unstable reference genes CTSB, EIF3M, and CTNNB1 to further validate the candidate reference genes. The gene expression levels of IDH2 and RBP4 were consistent with the RNA-seq data. IDH2 was highly expressed at D0 (brown adipose tissue), while RBP4 was highly expressed at D28 (white adipose tissue). The expression of IDH2 at D0 was significantly higher than at D7 (P < 0.01), D14 (P < 0.01), D21 (P < 0.01), and D28 (P < 0.01), while its expression at D7 was significantly higher than at D14 (P < 0.01), D21 (P < 0.01), and D28 (P < 0.01) when IDH2 was normalized with GABARAP, CLTA, ACTB, GAPDH, and CTSB. In the same line, the expression of IDH2 at D0 was significantly higher than at D7 (P < 0.01), D14 (P < 0.01), D21 (P < 0.01), and D28 (P < 0.01), while its expression at D21 was significantly higher than at D7 (P < 0.05), D14 (P < 0.05) and D28 (P < 0.05) when IDH2 was normalized with EIF3M and CTNNB1. The expression of RBP4 at D28, D21, and D14 was significantly higher than at D0 (P < 0.01) and D7 (P < 0.01), its expression at D28 was significantly higher than at D14 (P < 0.01) and D21 (P < 0.01), while its expression at D21 was significantly lower than D14 (P < 0.01) when RBP4 was normalized with GABARAP, CLTA, ACTB, GAPDH, CTSB, and CTNNB1. The expression of IDH2 at D28, D21, and D14 was significantly higher than at D0 (P < 0.01) and D7 (P < 0.01), while its expression at D28 was significantly higher than at D21 (P < 0.01) when IDH2 was normalized with EIF3M (Figure 10). Of note, the target genes exhibited varying statistical differences when different reference genes were used, highlighting the importance of selecting appropriate reference genes.
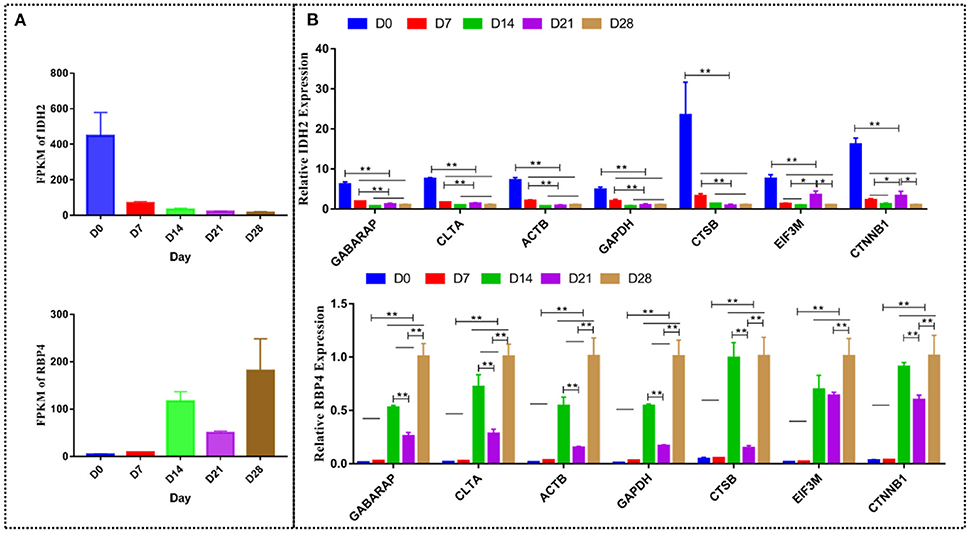
Figure 10. The relative expression of IDH2 and RBP4 normalized by different reference genes. (A) The mRNA expression level measured by RNA-seq. (B) The expression of IDH2 and RBP4 was normalized using GABARAP, CLTA, ACTB, GAPDH, CTSB, EIF3M, and CTNNB1 genes. *p < 0.05; **p < 0.01.
Discussion
Goat BAT is mainly observed around the kidney at birth. In this study, BAT rapidly “whiting” within 2 weeks and turns into WAT at about 4 weeks, which was consistent with the results of previous studies in goats and sheep (22, 23, 28). Transcriptome sequencing is an important research method for gene expression analysis and screening differentially expressed and functional genes. Notably, screening reference genes using transcriptome data is an effective experimental method for screening reference genes in non-model species (32–34). RPS4X and RPS6 are more stable than traditionally used housekeeping genes in the goat rumen (35), while NCBP3, SDHA, and PTPRA are more stable than traditionally used housekeeping genes in goat skin tissue (10).
Adipose tissue has strong plasticity and is easily affected by environmental temperature, diet, and hormones. Some scholars have studied the stability of reference genes in adipose tissue. For instance, WDR33 and HDAC3 are relatively stable reference genes in bovine adipose tissue (13), TOP2B and UXT in buffalo adipose tissue (36), and TBP in mice (16). Herein, GABARAP was the most stable reference gene, followed by CLTA. GABARAP has also been reported to be a more stable reference gene in ovine pulmonary adenocarcinoma (32). At the same time, CLTA is a relatively stable reference gene in melanoma samples and melanoma cell lines (37). ACTB and GAPDH are traditional reference genes but also showed better expression stability in this study, a finding that was consistent with previous reports. For example, ACTB has been postulated to be the most suitable reference gene in the 3T3-L1 adipocyte differentiation model (38). ACTB exhibits medium stability as a reference gene in goat perirenal adipose (28). In this study, ACTG1 exhibited medium stability. However, ACTG1 presents less stable expression when employed as a reference gene for cerebral cortical astrocytes (39). A previous study postulated that CTNNB1, PFDN5, and EIF3M are the most stable reference genes for BAT to WAT in goats (28). However, PFDN5 showed medium stability, while CTNNB1 and EIF3M had poor stability in this study. This variance was attributed to the previous study collecting tissues at three postnatal periods (1 day, 30 days, and 1 year after birth), covering the entire growth cycle but with a larger period. In contrast, this study concentrated on the early growth stage, picking samples at five postnatal stages (0, 7, 14, 21, and 28 days). The differences in the results further indicate that the same reference gene may have large transcriptional differences in samples under different conditions. It also emphasizes the proper selection of appropriate reference genes because it directly impacts the research results.
RBP4 is a useful biomarker for diagnosing obesity and the prognosis of related diseases (40), while IDH2 affects brown adipose tissue thermogenesis (41). In this study, RBP4 and IDH2 were differentially expressed based on the RNA-seq data (data not shown). However, the results differed when RBP4 and IDH2 were normalized using different reference genes. Therefore, selecting reference genes with relatively stable expressions under different conditions can more accurately quantify the expression of target genes in different samples.
Conclusion
GABARAP, CLTA, GAPDH, and ACTB genes are relatively stable reference genes that can potentially be used to develop perirenal fat in goats.
Data availability statement
The data presented in the study are deposited in the Genome Sequence Archive (Genomics, Proteomics and Bioinformatics 2021) in National Genomics Data Center (Nucleic Acids Res 2022), accession number CRA008594.
Ethics statement
All animal experiments followed the Southwest University Institutional Animal Care and Use Committee (22-9-2019, No. GB14925-2010) regulations. Written informed consent was obtained from the owners for the participation of their animals in this study.
Author contributions
LZ drafted the manuscript. LZ, XL, YZho, and TL collected experimental tissues. LZ, HY, and XL collected the data and organized the references. YZha was involved in this study design and wrote the manuscript. All authors contributed to the article and approved the submitted version.
Funding
This work was financially supported by the Chongqing's Modern Agricultural Industry Technology System Program for Herbivore [2022(12)], the Collection, Utilization and Innovation of Germplasm Resources by Research Institutes and Enterprises of Chongqing, China (cqnyncw-kqlhtxm), the National Natural Science Foundation of China (No. 31772564), the Chongqing Postgraduate Research Innovation Project (CYB22141).
Acknowledgments
We appreciate the Chongqing Key Laboratory of Herbivore Science for providing data of this study and technical assistance.
Conflict of interest
The authors declare that the research was conducted in the absence of any commercial or financial relationships that could be construed as a potential conflict of interest.
Publisher's note
All claims expressed in this article are solely those of the authors and do not necessarily represent those of their affiliated organizations, or those of the publisher, the editors and the reviewers. Any product that may be evaluated in this article, or claim that may be made by its manufacturer, is not guaranteed or endorsed by the publisher.
Supplementary material
The Supplementary Material for this article can be found online at: https://www.frontiersin.org/articles/10.3389/fvets.2022.1055866/full#supplementary-material
References
1. Koletzko B, Godfrey KM, Poston L, Szajewska H, van Goudoever JB, de Waard M, et al. Nutrition during pregnancy, lactation and early childhood and its implications for maternal and Long-Term child health: The early nutrition project recommendations. Ann Nutr Metab. (2019) 74:93–106. doi: 10.1159/000496471
2. Symonds ME, Pope M, Budge H. The ontogeny of brown adipose tissue. Annu Rev Nutr. (2015) 35:295–320. doi: 10.1146/annurev-nutr-071813-105330
3. Zhao L, Yang H, Li X, Zhao Y. Current understanding of the role of microRNAs from adipose-derived extracellular vesicles in obesity. Biochem Soc Trans. (2022) 50:447–57. doi: 10.1042/BST20211031
4. Sakers A, De Siqueira MK, Seale P, Villanueva CJ. Adipose-tissue plasticity in health and disease. Cell. (2022) 185:419–46. doi: 10.1016/j.cell.2021.12.016
5. Cypess AM. Reassessing human adipose tissue. N Engl J Med. (2022) 386:768–79. doi: 10.1056/NEJMra2032804
6. Bustin SA. Quantification of mRNA using real-time reverse transcription PCR (RT-PCR): Trends and problems. J Mol Endocrinol. (2002) 29:23–39. doi: 10.1677/jme.0.0290023
7. Nolan T, Hands RE, Bustin SA. Quantification of mRNA using real-time RT-PCR. Nat Protoc. (2006) 1:1559–82. doi: 10.1038/nprot.2006.236
8. Huggett J, Dheda K, Bustin S, Zumla A. Real-time RT-PCR normalisation; Strategies and considerations. Genes Immun. (2005) 6:279–84. doi: 10.1038/sj.gene.6364190
9. Bustin SA, Benes V, Garson JA, Hellemans J, Huggett J, Kubista M, et al. The MIQE guidelines: Minimum information for publication of quantitative real-time PCR experiments. Clin Chem. (2009) 55:611–22. doi: 10.1373/clinchem.2008.112797
10. Zhang J, Deng C, Li J, Zhao Y. Transcriptome-based selection and validation of optimal house-keeping genes for skin research in goats (Capra hircus). BMC Genomics. (2020) 21:493. doi: 10.1186/s12864-020-06912-4
11. Yin J, Sun L, Zhang Q, Cao C. Screening and evaluation of the stability of expression of reference genes in Lymantria dispar (Lepidoptera: Erebidae) using qRT-PCR. Gene. (2020) 749:144712. doi: 10.1016/j.gene.2020.144712
12. Fan X, Yao H, Liu X, Shi Q, Lv L, Li P, et al. High-Fat diet alters the expression of reference genes in male mice. Front Nutr. (2020) 7:589771. doi: 10.3389/fnut.2020.589771
13. Cao KX, Hao D, Wang J, Peng WW, Yan YJ, Cao HX, et al. Cold exposure induces the acquisition of brown adipocyte gene expression profiles in cattle inguinal fat normalized with a new set of reference genes for qRT-PCR. Res Vet Sci. (2017) 114:1–5. doi: 10.1016/j.rvsc.2017.02.021
14. Vandesompele J, De Preter K, Pattyn F, Poppe B, Van Roy N, De Paepe A, et al. Accurate normalization of real-time quantitative RT-PCR data by geometric averaging of multiple internal control genes. Genome Biol. (2002) 3:H34. doi: 10.1186/gb-2002-3-7-research0034
15. van Rijn SJ, Riemers FM, van den Heuvel D, Wolfswinkel J, Hofland L, Meij BP, et al. Expression stability of reference genes for quantitative RT-PCR of healthy and diseased pituitary tissue samples varies between humans, mice, and dogs. Mol Neurobiol. (2014) 49:893–9. doi: 10.1007/s12035-013-8567-7
16. Almeida-Oliveira F, Leandro J, Ausina P, Sola-Penna M, Majerowicz D. Reference genes for quantitative PCR in the adipose tissue of mice with metabolic disease. Biomed Pharmacother. (2017) 88:948–55. doi: 10.1016/j.biopha.2017.01.091
17. Mehta R, Birerdinc A, Hossain N, Afendy A, Chandhoke V, Younossi Z, et al. Validation of endogenous reference genes for qRT-PCR analysis of human visceral adipose samples. BMC Mol Biol. (2010) 11:39. doi: 10.1186/1471-2199-11-39
18. Taube M, Andersson-Assarsson JC, Lindberg K, Pereira MJ, Gäbel M, Svensson MK, et al. Evaluation of reference genes for gene expression studies in human brown adipose tissue. Adipocyte. (2015) 4:280–5. doi: 10.1080/21623945.2015.1039884
19. Perez LJ, Rios L, Trivedi P, D'Souza K, Cowie A, Nzirorera C, et al. Validation of optimal reference genes for quantitative real time PCR in muscle and adipose tissue for obesity and diabetes research. Sci Rep. (2017) 7:3612. doi: 10.1038/s41598-017-03730-9
20. Gabrielsson BG, Olofsson LE, Sjögren A, Jernås M, Elander A, Lönn M, et al. Evaluation of reference genes for studies of gene expression in human adipose tissue. Obes Res. (2005) 13:649–52. doi: 10.1038/oby.2005.72
21. Chechi K, Gelinas Y, Mathieu P, Deshaies Y, Richard D. Validation of reference genes for the relative quantification of gene expression in human epicardial adipose tissue. PLoS One. (2012) 7:e32265. doi: 10.1371/journal.pone.0032265
22. Basse AL, Dixen K, Yadav R, Tygesen MP, Qvortrup K, Kristiansen K, et al. Global gene expression profiling of brown to white adipose tissue transformation in sheep reveals novel transcriptional components linked to adipose remodeling. BMC Genom. (2015) 16:215. doi: 10.1186/s12864-015-1405-8
23. Wang L, Yang X, Zhu Y, Zhan S, Chao Z, Zhong T, et al. Genome-Wide identification and characterization of long noncoding RNAs of brown to white adipose tissue transformation in goats. Cells-Basel. (2019) 8:904. doi: 10.3390/cells8080904
24. Silver N, Best S, Jiang J, Thein SL. Selection of housekeeping genes for gene expression studies in human reticulocytes using real-time PCR. Bmc Mol Biol. (2006) 7:33. doi: 10.1186/1471-2199-7-33
25. Andersen CL, Jensen JL, Ørntoft TF. Normalization of real-time quantitative reverse transcription-PCR data: a model-based variance estimation approach to identify genes suited for normalization, applied to bladder and colon cancer data sets. Cancer Res. (2004) 64:5245–50. doi: 10.1158/0008-5472.CAN-04-0496
26. Pfaffl MW, Tichopad A, Prgomet C, Neuvians TP. Determination of stable housekeeping genes, differentially regulated target genes and sample integrity: BestKeeper–Excel-based tool using pair-wise correlations. Biotechnol Lett. (2004) 26:509–15. doi: 10.1023/B:BILE.0000019559.84305.47
27. Xie F, Xiao P, Chen D, Xu L, Zhang B. MiRDeepFinder: A miRNA analysis tool for deep sequencing of plant small RNAs. Plant Mol Biol. (2012). doi: 10.1007/s11103-012-9885-2
28. Wang L, Chen X, Song T, Zhang X, Zhan S, Cao J, et al. Using RNA-Seq to identify reference genes of the transition from brown to white adipose tissue in goats. Animals (Basel). (2020) 10:1626. doi: 10.3390/ani10091626
29. Nazari F, Parham A, Maleki AF, GAPDH. β-actin and β2-microglobulin, as three common reference genes, are not reliable for gene expression studies in equine adipose- and marrow-derived mesenchymal stem cells. J Anim Sci Technol. (2015) 57:18. doi: 10.1186/s40781-015-0050-8
30. Najafpanah MJ, Sadeghi M, Bakhtiarizadeh MR. Reference genes selection for quantitative real-time PCR using RankAggreg method in different tissues of Capra hircus. PLoS ONE. (2013) 8:e83041. doi: 10.1371/journal.pone.0083041
31. Zhu W, Lin Y, Liao H, Wang Y. Selection of reference genes for gene expression studies related to intramuscular fat deposition in Capra hircus skeletal muscle. PLoS One. (2015) 10:e121280. doi: 10.1371/journal.pone.0121280
32. Yang H, Zhang L, Liu S. Determination of reference genes for ovine pulmonary adenocarcinoma infected lung tissues using RNA-seq transcriptome profiling. J Virol Methods. (2020) 284:113923. doi: 10.1016/j.jviromet.2020.113923
33. Zheng Q, Wang X, Qi Y, Ma Y. Selection and validation of reference genes for qRT-PCR analysis during fruit ripening of red pitaya (Hylocereus polyrhizus). FEBS Open Bio. (2021) 11:3142–52. doi: 10.1002/2211-5463.13053
34. Sampathkumar NK, Sundaram VK, Danthi PS, Barakat R, Solomon S, Mondal M, et al. RNA-Seq is not required to determine stable reference genes for qPCR normalization. Plos Comput Biol. (2022) 18:e1009868. doi: 10.1371/journal.pcbi.1009868
35. Zhao J, Wang C, Zhang L, Lei A, Wang L, Niu L, et al. Genome-Wide identification of reference genes for Reverse-Transcription quantitative PCR in goat rumen. Animals (Basel). (2021) 11:3137. doi: 10.3390/ani11113137
36. Feng X, Cao X, Zhu R, Huang J. Selection and validation of reference genes for RT-qPCR in adipose and longissimus dorsi muscle tissues of buffalo. Anim Biotechnol. (2022) 33:526–35. doi: 10.1080/10495398.2020.1811715
37. Christensen JN, Schmidt H, Steiniche T, Madsen M. Identification of robust reference genes for studies of gene expression in FFPE melanoma samples and melanoma cell lines. Melanoma Res. (2020) 30:26–38. doi: 10.1097/CMR.0000000000000644
38. Arsenijevic T, Grégoire F, Delforge V, Delporte C, Perret J. Murine 3T3-L1 adipocyte cell differentiation model: validated reference genes for qPCR gene expression analysis. PLoS ONE. (2012) 7:e37517. doi: 10.1371/journal.pone.0037517
39. Oliveira SR, Vieira HL, Duarte CB. Effect of carbon monoxide on gene expression in cerebrocortical astrocytes: Validation of reference genes for quantitative real-time PCR. Nitric Oxide. (2015) 49:80–9. doi: 10.1016/j.niox.2015.07.003
40. Flores-Cortez YA, Barragán-Bonilla MI, Mendoza-Bello JM, González-Calixto C, Flores-Alfaro E, Espinoza-Rojo M. Interplay of retinol binding protein 4 with obesity and associated chronic alterations (Review). Mol Med Rep. (2022) 26:244. doi: 10.3892/mmr.2022.12760
Keywords: goat, reference genes, brown adipose tissue, whiting, transcriptome
Citation: Zhao L, Yang H, Li X, Zhou Y, Liu T and Zhao Y (2022) Transcriptome-based selection and validation of optimal reference genes in perirenal adipose developing of goat (Capra hircus). Front. Vet. Sci. 9:1055866. doi: 10.3389/fvets.2022.1055866
Received: 28 September 2022; Accepted: 02 November 2022;
Published: 17 November 2022.
Edited by:
Sara Pegolo, University of Padua, ItalyReviewed by:
Yanhui Lu, Zhejiang Academy of Agricultural Sciences, ChinaHui Li, Guangxi University, China
Copyright © 2022 Zhao, Yang, Li, Zhou, Liu and Zhao. This is an open-access article distributed under the terms of the Creative Commons Attribution License (CC BY). The use, distribution or reproduction in other forums is permitted, provided the original author(s) and the copyright owner(s) are credited and that the original publication in this journal is cited, in accordance with accepted academic practice. No use, distribution or reproduction is permitted which does not comply with these terms.
*Correspondence: Yongju Zhao, enlvbmdqdUAxNjMuY29t
†ORCID: Yongju Zhao orcid.org/0000-0001-9256-8856