
95% of researchers rate our articles as excellent or good
Learn more about the work of our research integrity team to safeguard the quality of each article we publish.
Find out more
ORIGINAL RESEARCH article
Front. Vet. Sci. , 05 January 2023
Sec. Livestock Genomics
Volume 9 - 2022 | https://doi.org/10.3389/fvets.2022.1010045
 Changchun Lin1
 Weimin Wang2
 Deyin Zhang2
 Kai Huang2Xiaolong Li1Yukun Zhang2
 Yuan Zhao2Jianghui Wang1Bubo Zhou1
 Jiangbo Cheng1Dan Xu1Wenxin Li1Liming Zhao1
 Zongwu Ma1Xiaobin Yang1Yongliang Huang1Panpan Cui1Jia Liu1Xiwen Zeng1Rui Zhai1Landi Sun2Xiuxiu Weng2Weiwei Wu3
 Xiaoxue Zhang1*Wenxin Zheng4*
In animal husbandry, feed efficiency is a crucial economic trait. In this study, the general linear model was used to perform association analysis for various genotypes and feed conversion ratio (FCR)-related traits. Reverse transcription-quantitative PCR (RT-qPCR) was used to detect the expression of SHISA3 and RFC3 mRNA levels in 10 tissues from 6 sheep. The results showed that SNPs in the NC_040257.1:c.625 T > C and NC_040261.1:g.9905 T > C were analyzed whether they were associated to feed efficiency parameters in Hu sheep (body weight, feed intake, average daily growth, and feed conversion ratio). NC_040257.1:c.625 T > C was shown to be significantly associated with body weight at 80, 100, and 120 days as well as feed conversion ratio (P < 0.05), whereas NC_040261.1:g.9905 T > C was found to be significantly associated with average daily weight gain from 80-140 days (ADG80-140) and FCR (P < 0.05). In Hu sheep, the CC genotypes of SHISA3 and RFC3 were the most common genotypes related to feed efficiency traits. Furthermore, the feed conversion ratio of the combined genotypes TTSHISA3-CCRFC3, TTSHISA3-CTRFC3, TTSHISA3-TTRFC3, CTSHISA3-CCRFC3 and CTSHISA3-CTRFC3 was significantly better than the FCR of CCSHISA3-TTRFC3. RT-qPCR results showed that the expression levels of SHISA3 were lower in the lung than in spleen, kidney, muscle and lymph (P < 0.05), and RFC3 was the lung had a highly significant higher expression level than the heart, liver, spleen, and muscle (P < 0.01). In conclusion, SHISA3 and RFC3 polymorphisms can be used as genetic markers for improving feed conversion efficiency in Hu sheep.
Sheep farming plays a vital role in the regional economic development of Northwest China. According to studies, the cost of feed accounts for between two-thirds to three-quarters of the entire cost in a housed sheep farming system (1). Improving the efficiency of sheep feed consumption not only increases farmer income, but also decreases methane gas emissions for environmental protection (2). The feed conversion ratio (FCR) is a traditional metric for assessing feed efficiency (FE), which is defined as the ratio of feed intake to body weight (BW) growth per unit time (3, 4). Therefore, improving FE has become a major concern for sheep farmers. With the fast advancement of science and technology, whole genome sequencing is now extensively employed in livestock and poultry breeding, including pigs (5–9), cattle (10–13) and other species (14). Many relevant candidate genes and quantitative trait loci associated to feed efficiency were screened using sequencing technology, which may be used for marker-assisted selection (MAS) to enhance FE and lower production costs (15–21). In Hu sheep, it was discovered that ME1 gene polymorphism was significantly associated with FCR and RFI (P < 0.05), whereas CA1 gene polymorphism was significantly associated with FCR (P < 0.05) and the polymorphism in gene RTP4 were significantly associated with RFI (P < 0.05) (17, 22). According to methodological research using genome-wide association analysis, the genes CREB1, STEAP4, CTBP1, RIP140, SMURF2, FBF1, DTNBP1, SETD7, and RBM11 may be candidates for fat deposition in sheep tails (23, 24). According to research, synonymous mutations in ELOVL5 are associated to tail width, tail fat weight, and relative tail fat weight (P < 0.05). FASN synonymous mutations were shown to be related to tail length and breadth (P < 0.05) (25).
In this work, we selected two candidate genes, SHISA3 and RFC3, which showed differential expression in previous studies on residual feed intake (21), while circulating RNAs associated with lamb feed efficiency were identified as miRNA target genes in studies (22). SHISA family member 3 (SHISA3) is a gene that codes for proteins. SHISA3 belongs to the SHISAs family of endoplasmic reticulum-resident proteins, which has eight members (SHISA2–SHISA9) and is mostly involved in head development in non-human animals such as Xenopus, mouse, and chicken (26–28). SHISA3 research is mostly focused on human cancer. SHISA3 has been found to be a tumor suppressor gene, inhibiting carcinogenesis, invasion, and metastasis by increasing—catenin degradation (29). SHISA3 gene expression has been shown to be dysregulated in colorectal cancer (30), laryngeal squamous cell carcinoma (31), and nasopharyngeal carcinoma (32) in subsequent research. This demonstrates the crucial role of SHISA3 in clinical tumor identification and prediction. However, the effect of SHISA3 gene with sheep FE is not clear. The eukaryotic replication factor C (RFC) complex is part of the DNA polymerase, which consists of five subunits (RFC1-5) (33, 34). It functions as a AAA+ ATPase that is required for DNA replication, damage repair, and cell cycle checkpoint regulation in all eukaryotes (35–40). The RFC is a clamp loader that helps to lengthen the DNA strand by loading proliferating cell nuclear antigen (PCNA) onto primed DNA (41). The replication factor C subunit 3 (RFC3) is a subunit of the RFC complex. Reduced RFC3 expression has been shown to inhibit cancer cell proliferation by forming complexes with proliferating cell nuclear antigen (PCNA) (42). RFC3 has recently been described to be largely focused on human malignancies, such as liver, breast, esophageal, and ovarian cancers, where it plays a significant role in cell proliferation, invasion, and metastasis (42–45). However, the effect of RFC3 on animal FCR remains unclear.
Thus, the following hypotheses were proposed in this study: (1) the presence of polymorphisms in the SHISA3 and RFC3 genes; (2) the different genotypes of the polymorphic loci are associated with feed efficiency in sheep. To test the validity of the hypothesis, the purpose of this study was to identify SHISA3 and RFC3 polymorphisms, to associate different genotypes of polymorphic loci with feed efficiency attributes in sheep, and to examine SHISA3 and RFC3 expression levels in various tissues of sheep.
All animal experiments were conducted out in compliance with the rules and recommendations of Gansu Province's NPC government and were authorized by Gansu Agricultural University's Animal Health and Ethics Committee (Animal Experimentation License No. 2012-2-159).
In this research, 1,382 male Hu sheep lambs were obtained from Defu Agricultural Technology Co., Ltd (Gansu, China). Their birthplaces were from different farming enterprises, and the detailed sources refer to the study of Lin et al. (46). Before weaning at 56 days of age, all of the lambs were in excellent development condition and fit, and they had all finished a standardized vaccination schedule administered by a practicing veterinarian. After weaning, the lambs were transported in batches to Defu Agricultural Technology Co., Ltd. and housed inside in separate 0.8 × 1 m enclosures until the trial ended. All lambs were given the same feed and were subjected to the same management settings as in our prior research (1). It can be briefly summarized in three phases: a 14-day transition period, a 10-day acclimation period and a 60-day formal experiment. The transition phase consisted of transitioning from traditional feed to 100 percent pellet feed and then maintaining it until the conclusion of the trial, during which time the feed and water supply was enough to fulfill the lambs' needs for free feeding and drinking. The particles used in the experiment were all from Gansu Sanyang Jinyuan Animal Husbandry Co., Ltd (Gansu, China). The weight of lambs was recorded at 80 days of age as the starting weight, and then every 20 days until the lambs were 140 days of age as the ending weight, while feed consumption was collected for the calculation of average day feed intake (ADFI), average daily gain (ADG), and FCR.
where BWf represents 140 days weight; BWi represents 80 days weight; N represents number of experimental days. After the experiment was completed, a blood sample (5 ml) was taken from each lamb's jugular vein for further DNA extraction. Genomic DNA was extracted from 1,382 blood samples using the EasyPure Blood Genomic DNA Kit (TransGen Biotech, Beijing, China), dissolved in TE buffer, and kept at −20°C according to the manufacturer's recommendations.
Using the Oligo 7.0 software (Olgi.net, Colorado Springs, CO, USA), specific PCR primers (GenBank Accession Nos. NC_040257.1 and NC_040261.1) were based primarily on the genomic DNA sequences of SHISA3 and RFC3 (Supplementary Table S1). To find single nucleotide polymorphisms (SNPs) in SHISA3 and RFC3, 10 individual DNA samples from 1,382 sheep DNA samples were randomly chosen and blended as PCR templates for PCR fragment amplification and DNA sequencing. The PCR reaction that was done in order to sequence the DNA was carried out in a volume of reaction that was 25 ul, and it included 10 ul of PCR buffer, 0.35 uM of primers, 87.5 uM of dNTPs, 50 ng of genomic DNA, and 1.25 ul of UTaq DNA Polymerase (TransGen Biotech, Beijing, China). Using the following thermocycling conditions: 5 mins at 94°C, followed by 30 s at 94°C, followed by 30 s at 50–60°C, and finally 30 s at 72°C (35 cycles), followed by a final extension incubation for 5 mins at 72°C. The technique of competitive allele-specific FRET-based PCR analysis (KASPar) was then performed to genotype SNPs within SHISA3 and RFC3 (47). Information on primer pairs used for genotyping is listed in Supplementary Table S2. The 1,382 lambs were genotyped for SHISA3 and RFC3, and finally 1,355 were successfully genotyped for SHISA3, while 1340 for RFC3.
In this study, all variables were subjected to the Shapiro-Wilk normality test (48), and those that failed the test were transformed using the logarithm (49). The general linear model was used to perform association analysis for various genotypes and FCR-related traits. The stats package of R (version 4.0.5) was used to model building which based on ordinary least square and execute significance tests. Genotype frequency and allele frequency, effective allele number (Ne), expected heterozygosity (He), expected homozygosity (Ho), and polymorphism information content (PIC) were calculated by referring to previous studies (50). The specific model and parameters are shown below:
where Yijkl and Yimjkln was the phenotypic observation value of FCR-related traits, μ is the mean, Genotypei and Genotypem is the effect of the ith and mth genotypes; Batchj is the fixed effects (j = 1, 2,…, 6); Seasonk is the fixed effects (k = 1, 2); Sirel is the fixed effects; Combinationn refers to the effect of combination, εijkl and εimjkln are the random error. All of our samples are collected around August (summer), and January (winter) of each year. To test the significance of the genotype means, the least significant difference (LSD) test was utilized. When P < 0.05 indicates statistical significance.
Six sheep were selected at random from all of the samples (n = 1,382) to act as experimental subjects. Following that, these individuals' heart, liver, spleen, lung, kidney, muscle, tail fat, lymph, rumen, and duodenum were all collected. TRIzol reagent (Invitrogen, Waltham, MA, USA) was used to extract total RNA from the samples, which was then reverse transcribed into cDNA using a reverse transcriptase kit (TransGen Biotech, Beijing, China).
The mRNA levels of SHISA3 and RFC3 genes were detected in 10 tissues of the 6 sheep collected above. The Oligo 7.0 tool was used to design the particular primers utilized to evaluate gene expression (Supplementary Table S3). The qRT-PCR system that was used had a volume of 20 μl and included 10 μl of Takara Biotechnology's 2 X SYBR Green PCR Master Mixture, 0.8 μl of each primer, 2 μl of template cDNA, and 6.4 μl of RNase-free water (TransGen Biotech, Beijing, China). The conditions were as follows: 95°C for 3 mins, 95°C for 15 s, the optimal annealing temperature for 15 s, 72°C for 20 s, 40 cycles, and then 72°C for 5 mins. The qRT-PCR reactions were carried out using a Roche LightCycler 480 (Roche Applied Science, Basel, Switzerland): reaction protocols are based on earlier research (46). The data obtained were normalized using β-actin as an internal reference gene and analyzed using the 2−ΔΔCt method (51). The Games-Howell test is a statistical model for measuring the degree of gene expression (52).
The results of the Shapiro-Wilk normality test showed that all traits conformed to the normal distribution, except for FCR80-140, which did not conform to the normal distribution. FCR80-140 was then log-transformed. Descriptive statistics are reported in Table 1. The genotyping sample size for Hu sheep was 1,382. The table shows the mean, standard deviation, maximum and minimum values for sheep BW80, BW100, BW120 and BW140. The average weight increase from BW80 to BW100, BW100 to BW120, and BW120 to BW140 for the bearded sheep population was 5.51 kg. The disparity between the maximum and minimum body weight readings increased with time, with a difference of 37.55 kg at BW140, with the greatest value being about three times the minimum.

Table 1. Descriptive statistics on traits correlated with FCR for SHISA3 and RFC3 genes.
499 bp and 326 bp PCR fragment sequence were amplified from the DNA pool of the experimental population using the primer pairs shown in Supplementary Table S1, Figure 1 and each detected a mutant site (Figure 2). Both mutations were genotyped using the KASPar method and all three genotypes, CC, CT and TT, were detected (Figure 3). The genotype frequencies, allele frequencies, and genetic diversity of the two genes are displayed in Table 2. The frequencies of the three genotypes CC, CT and TT for NC_040257.1:c.625 T > C and NC_040261.1:g.9905 T > C were 0.46, 0.46, 0.08 and 0.30, 0.49, 0.21, respectively. The gene frequency of C in NC_040257.1:c.625 T > C was 0.69, whereas it was 0.54 in NC_040261.1:g.9905 T > C. The Ne, Ho, He, and PIC values for the SHISA3 gene were 1.75, 0.57, 0.43, and 1.75, respectively, and for the RFC3 gene were 2, 0.5, 0.5, and 0.38 (Table 2), indicating that the two genes showed intermediate polymorphism.
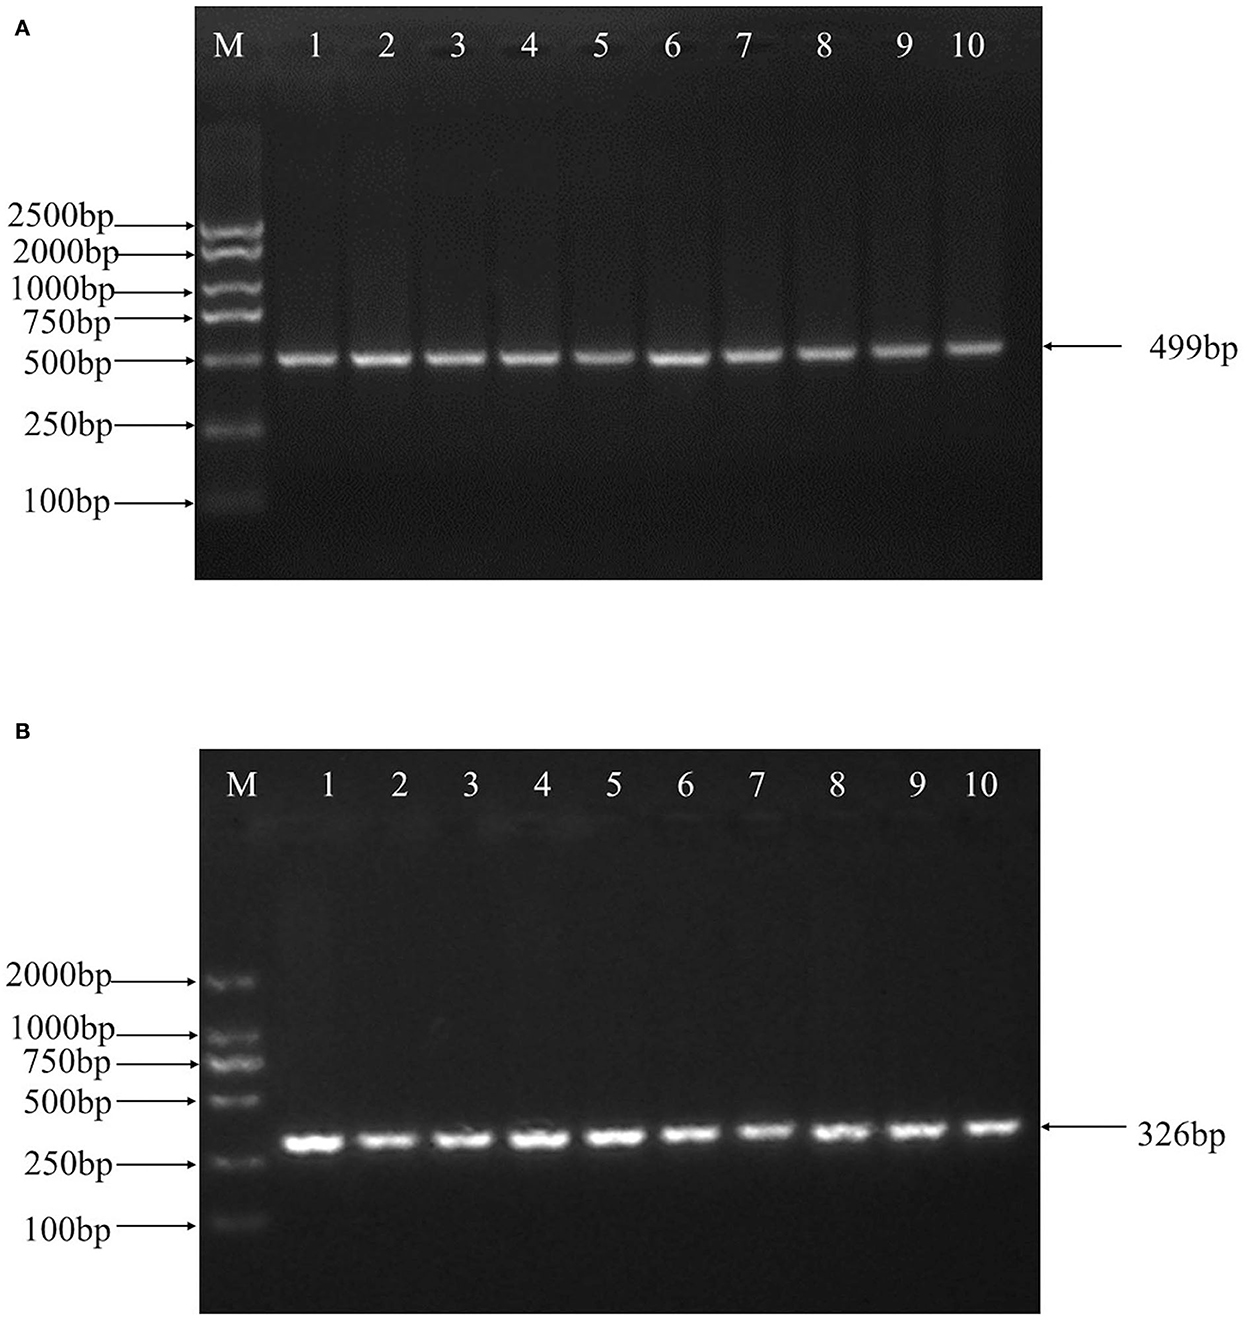
Figure 1. PCR amplification of ovine SHISA3 (A) and RFC3 (B) genes target fragment. M, DNA marker; 1–10, PCR products.
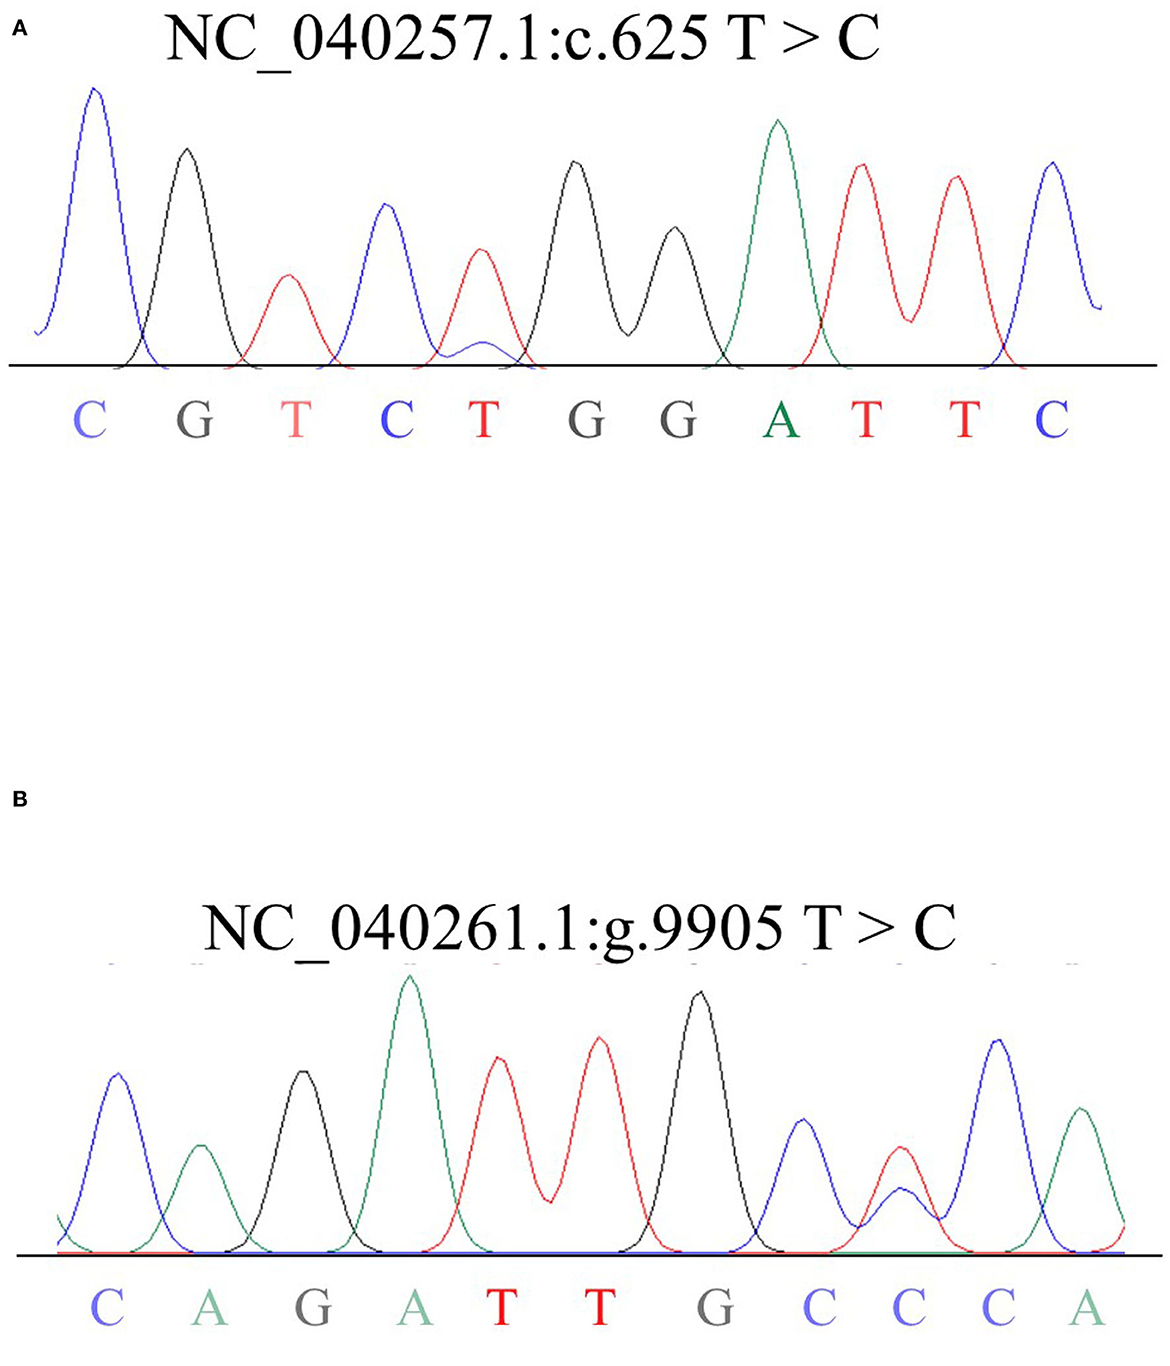
Figure 2. Sequencing results of mixed DNA from Hu sheep SHISA3 (A) and RFC3 (B). Overlapping peaks reflect mutation sites.
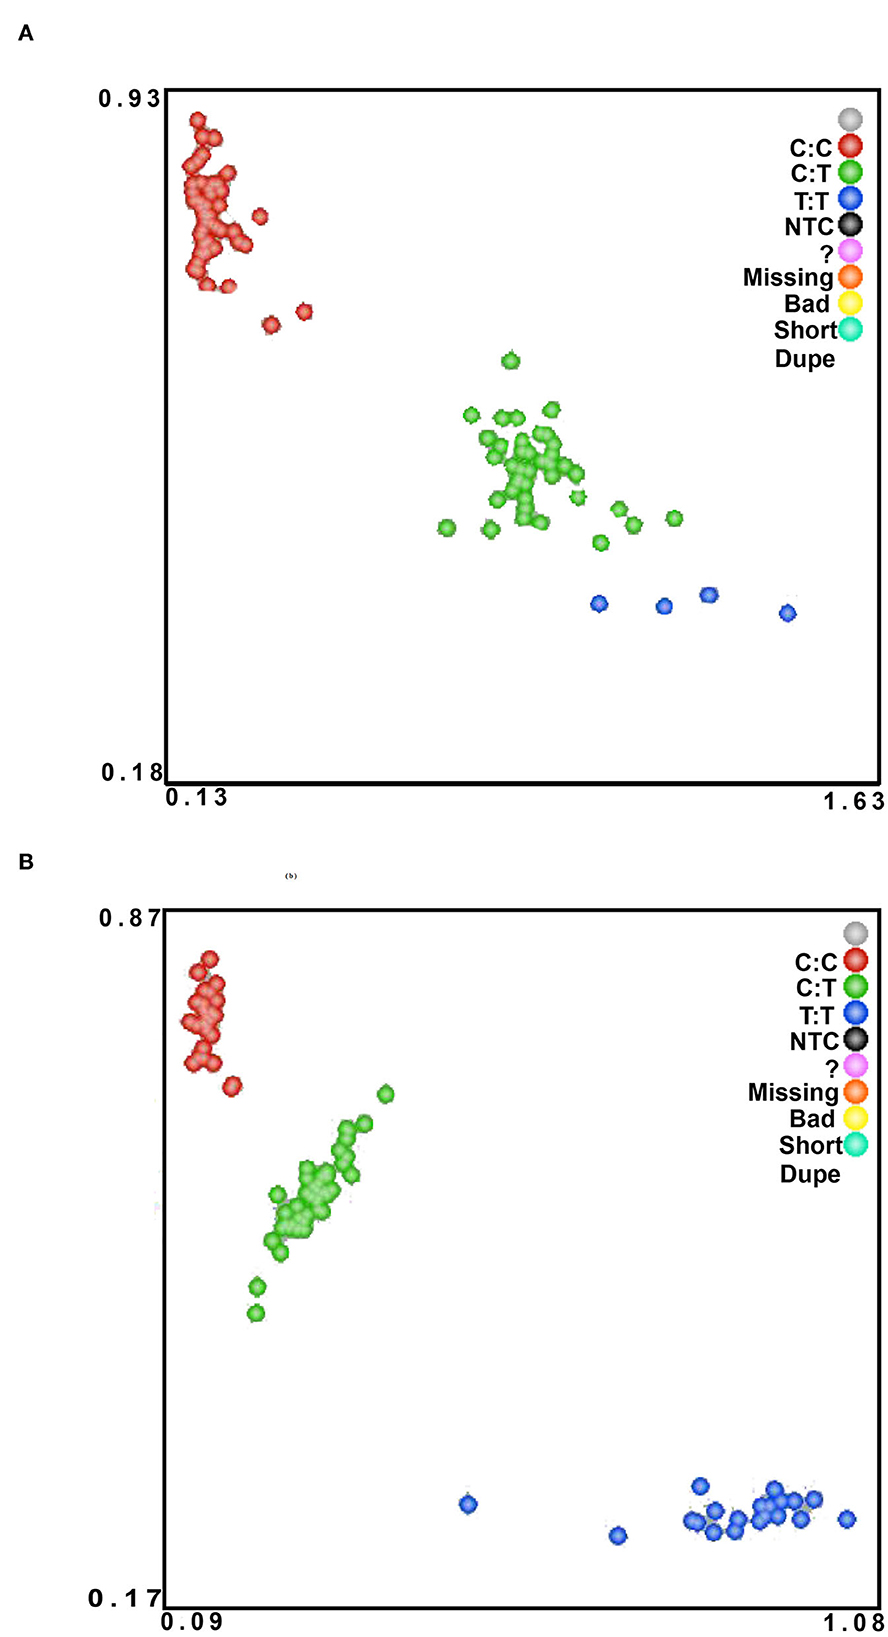
Figure 3. The KASPar method was used to genotype Hu sheep NC_040257.1:c.625 T > C (A) and NC_040261.1:g.9905 T > C (B) SNPs in the experimental population. The color of the dots indicates the result of genotyping; green, red, and blue in the figure indicate three different genotypes.
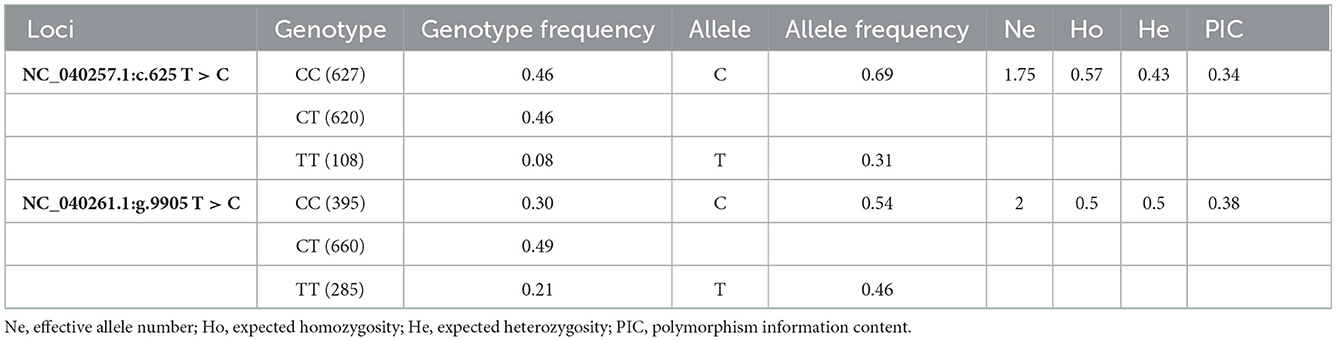
Table 2. The genotype frequency, allele frequency and genetic diversity of SHISA3 and RFC3 sites.
To study the effects of the SNPs of Hu sheep NC_040257.1:c.625 T > C and NC_040261.1:g.9905 T > C on FCR, association analysis was performed using the linear model in R 4.0.5 version. The results indicated that the SNP at NC_040257.1:c.625 T > C was significantly associated with BW80, 100, 120 (P < 0.05) (Table 3). BW80 and BW100 were significantly higher in animals carrying the CC genotype than in those carrying the CT or TT genotypes (P < 0.05). However, at BW120, the CC genotype outperformed the TT genotype, while the CT genotype did not differ from the other two genotypes (P > 0.05). The FCR80-140 association results revealed that CT and TT genotypes performs better CC genotypes. The findings of the association analysis for SNP NC_040261.1:g.9905 T > C revealed no significant effects with body weight and feed intake (P > 0.05). The results of the ADG80-140 and FCR80-140 association analysis revealed that the CC genotype with NC_040261.1:g.9905 T > C was markedly better than the TT genotype (P < 0.05).
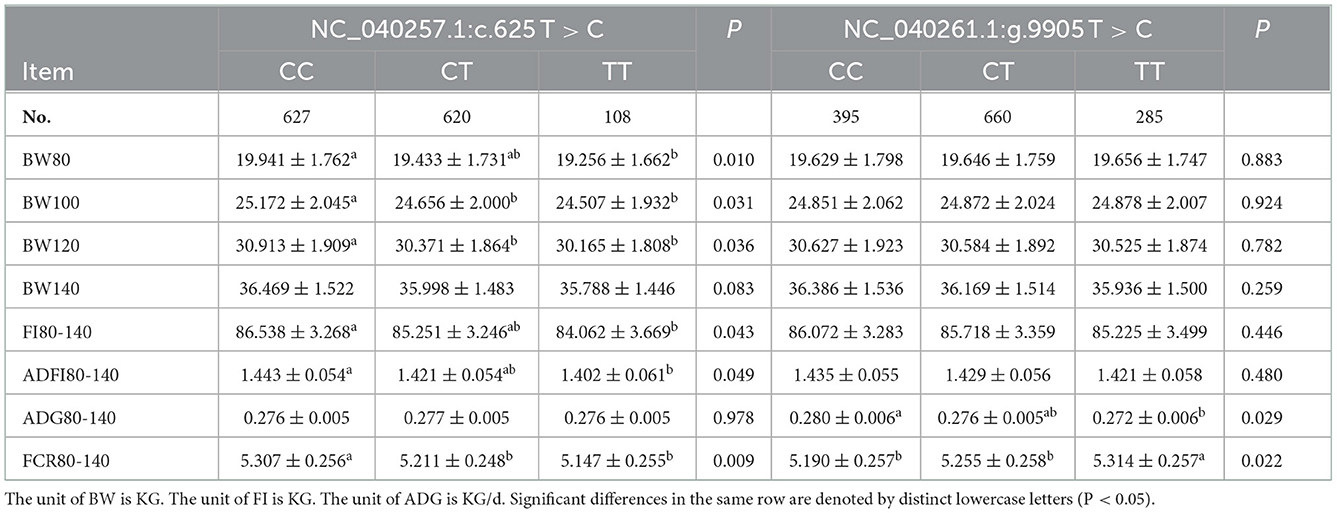
Table 3. The association between SHISA3 and RFC3 polymorphism and traits related to feed conversion ratio.
The combined impacts of various genotypes of the NC_040257.1:c.625 T > C and NC_040261.1:g.9905 T > C polymorphisms with attributes associated to FCR were evaluated using linear regression analysis (Table 4). As both NC_040257.1:c.625 T > C and NC_040261.1:g.9905 T > C have three genotypes, a three-by-three combinatorial pattern was generated. BW80, 100, 120, 140, FI80-140, and ADG80-140 did not present significance in association analysis of various combinations (P > 0.05). However, in FCR80-140, TTSHISA3-CCRFC3, TTSHISA3-TTRFC3, TTSHISA3-CTRFC3, CTSHISA3-CCRFC3 and CTSHISA3-CTRFC3 showed better results than CCSHISA3-TTRFC3 (P < 0.05) (Table 4).
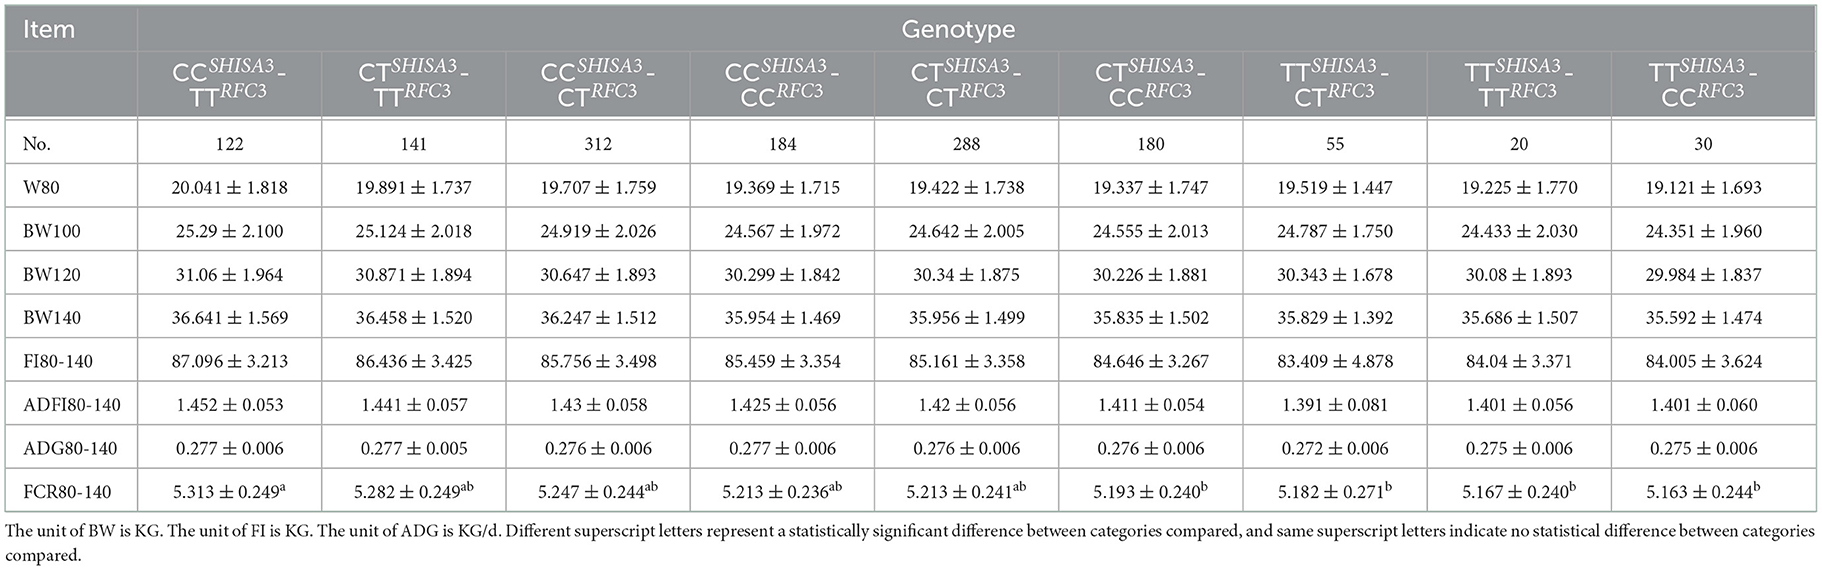
Table 4. Association analysis of combined genotypes at the SHISA3 and RFC3 traits related to feed conversion ratio.
The expression levels of SHISA3 (Figure 4A) and RFC3 (Figure 4B) genes in heart, liver, spleen, lung, kidney, rumen, duodenum, muscle, lymph and tail fat were analyzed by qRT-PCR, and the results showed significant differences in expression levels in different tissues (P < 0.05) (Figure 4). Figure 4A shows the expression levels of the SHISA3 gene, which were significantly lower in the lung than in spleen, kidney, muscle and lymph (P < 0.05). However, the expression pattern of RFC3 differed from that of the SHISA3 gene (Figure 4B). Notably, the lung was extremely significant more expressed than the heart, liver, spleen and muscle (P < 0.01), while spleen was also extremely significantly higher than muscle (P < 0.01). It is also widely distributed in the lymph, rumen and duodenum.
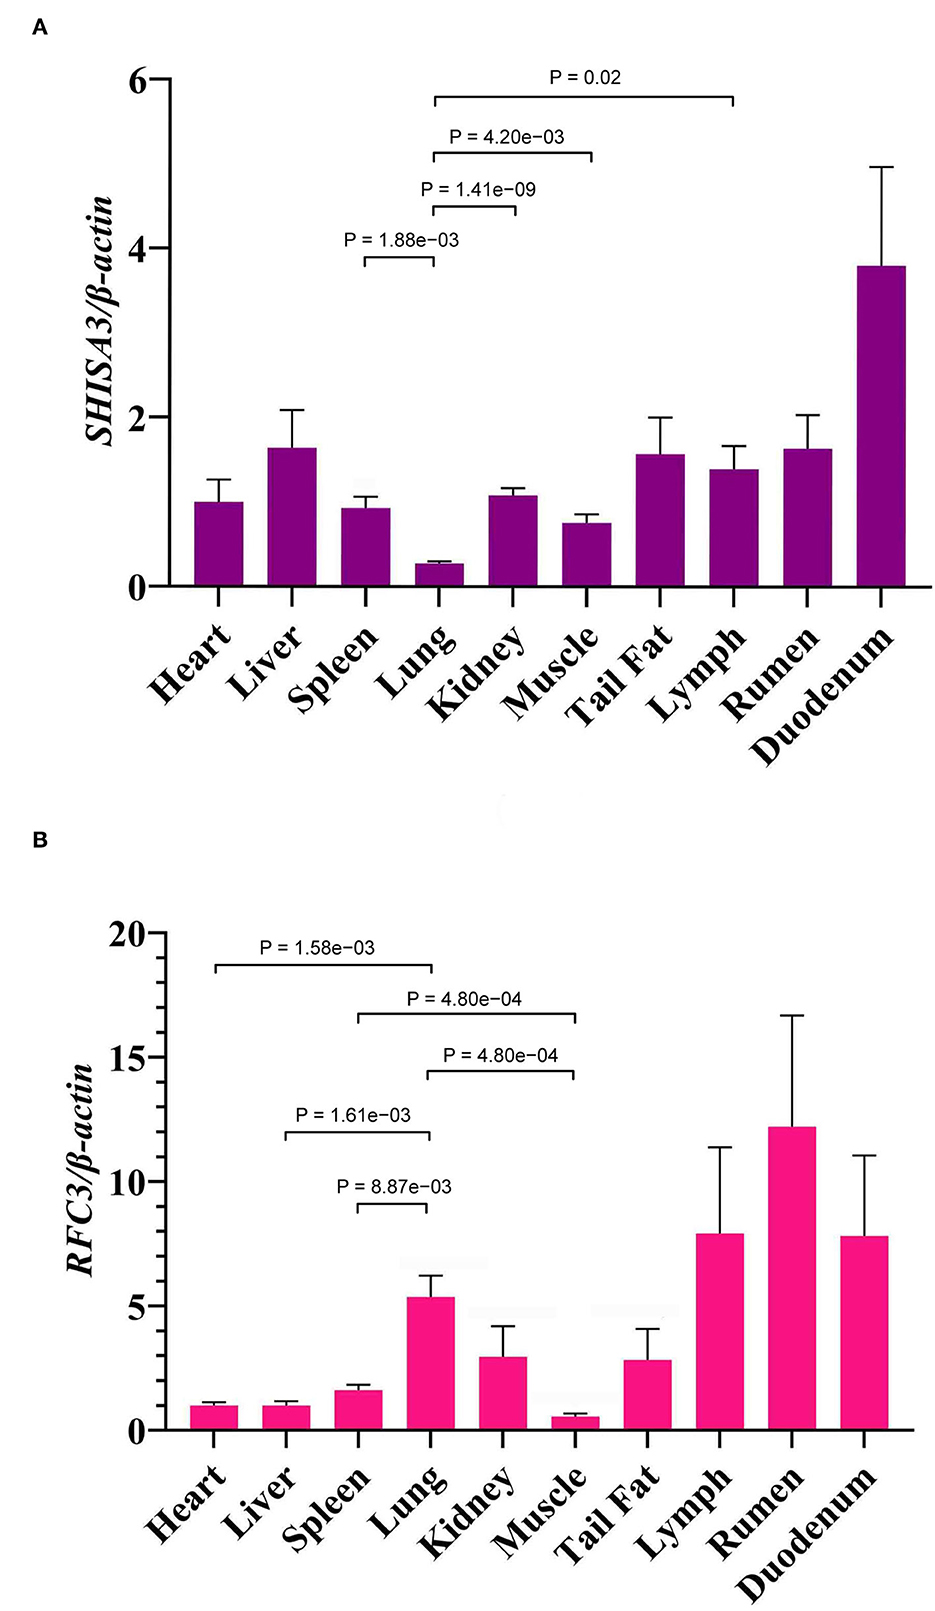
Figure 4. The expression of SHISA3 mRNA in different tissues (A). The expression of RFC3 mRNA in different tissues (B).
The FCR has a considerable impact on agricultural efficiency, economic viability, and environmental sustainability (53). FCR is impacted by a variety of variables, making it difficult for breeding programs to test it directly on candidate populations (54). Broiler dietary protein and energy sources have a major influence on FCR (55), and beef cattle live weight affects FCR through influencing maintenance and production needs, according to studies (56). In this study, we compared different stages of ADG to observe changes in weight and FCR-related characteristics over time. The findings revealed that body weight did not correlate with ADG but did associate with FCR. FCR features are economically significant qualities that have been the focus of the growing livestock sector, and advances in FCR directly lead to feed consumption reductions (57). These results show that FCR is a measurable trait that may be used to direct breeding and selection.
SNPs are single alterations in a single base in the genome that most typically describe inter-individual genetic variation (58). Because SNPs are associated with numerous economically relevant features in livestock, they have grown in importance as a molecular marker (59). It may be separated into synonymous mutations, missense mutations, and silent mutations based on the various kinds of mutation (60). Missense mutations were more likely to occur than silent mutations (61). Numerous studies have shown that missense mutations may play a crucial role in the development of many illnesses (62). In this work, we identified a missense mutation in SHSA3. The results show that it is associated with body weight and feed efficiency in sheep. Silent mutations are often ignored because they do not result in changes to the proteins (63). However, synonymous mutations have their own benefits in terms of modifying mRNA stability, splicing regulatory regions, miRNA binding sites, or translation efficiency, all of which result in changes in protein level or shape (64). Recent research has shown that synonymous or silent mutations contribute to the breeding of economic features in sheep (65–67).
In this study, two SNPs were discovered in NC_040257.1:c.625 T > C and NC_040261.1:g.9905 T > C. The potential of an association between these two mutant loci and BW, FI, ADG, and FCR was studied. The results showed that NC_040257.1:c.625 T > C was significantly associated with BW80, BW100, BW120 and FCR (P < 0.05). NC_040261.1:g.9905 T > C was significantly associated with ADG and FCR (P < 0.05). SHISA3 has been demonstrated in studies to contribute to the suppression of carcinogenesis, invasion, and metastasis by increasing β-catenin degradation (29). The RFC3 gene is implicated in the enrichment of the Wnt/-catenin signaling pathway (34). The Wnt pathway has been found to play a key part in its formation as well as its anti-inflammatory properties (68, 69). Animal FE is related to immunoinflammatory effects (21), hence we predicted that NC_040257.1:c.625 T > C and NC_040261.1:g.9905 T > C is associated to animal feed efficiency.
Association analysis revealed a strong correlation between the combined genotypes of these two loci (NC_040257.1:c.625 T > C and NC_040261.1:g.9905 T > C) and the FCR of Hu sheep (P < 0.05). In addition, FCR increases with increasing T allele frequency and peaks when both genes are for T. The mRNA level of SHISA3 was substantially greater in the duodenum than in other organs, according to the findings of qRT-PCR analysis. The intestine is a vital digestive organ and the greatest immunological organ in animals, and the duodenum, as a component of the intestine, likewise performs digestive and immune activities. In addition, duodenal bypass is essential for improving glycemic control (70). As a result, our hypothesis that the immune response is linked to animal feed efficiency has been confirmed. Additionally, lymph, rumen, and duodenum had significantly higher RFC3 expression levels than other tissues. When this study's expression profile was compared to the bovine gene expression profile, the findings were very similar (71). Animal rumen efficiency is related to feed efficiency, according to studies, and rumen passage rate is affected by both feed intake and rumen size (72–74). Furthermore, both the lymph and the duodenum are immunological tissues that execute immune tasks in the animal (75, 76). As a consequence, we speculated that mutations in the SHISA3 and RFC3 genes may influence animal FE by affecting the immunological response. The SHISA3 and RFC3 genes in sheep may be chosen as candidate genes for improved FCR. However, further research is required to confirm the association between SHISA3 and RFC3 and FE features.
In short, NC_040257.1:c.625 T > C and NC_040261.1:g.9905 T > C were shown to be substantially associated with feed efficiency features in this research (BW, ADG, FCR). In the sheep population, these two genes had a similar influence on FCR. SHISA3 expression was significantly higher in the duodenum, while RFC3 expression was significantly higher in the rumen, lymph, and duodenum than in the other tissues. As a conclusion, using the SHISA3 and RFC3 genes as genetic markers might help to enhance FCR while also increasing economic efficiency.
The original contributions presented in the study are included in the article/Supplementary material, further inquiries can be directed to the corresponding authors.
The animal study was reviewed and approved by Gansu Agricultural University's Animal Health and Ethics Committee.
XZh, CL, and WZ designed the study. XL, YZhao, JW, JC, DX, WL, BZ, and LZ involved in animal husbandry and liver sample collection. ZM, XY, XZe, JL, RZ, PC, and YH involved in DNA extraction. CL wrote the paper. YZhan, DZ, KH, WWa, LS, XW, and WWu reviewed and edited the manuscript. All authors contributed to the article and approved the submitted version.
This work was supported by the National Key Research and Development Program of China (2021YFD1300901), the National for Joint Research on Improved Breeds of Livestock and Poultry (19210365), the West Light Foundation of the Chinese Academy of Sciences (CN), Discipline Team Project of Gansu Agricultural University (No. GAU-XKTD-2022-20), and the China Agriculture Research System (CARS-39).
The authors declare that the research was conducted in the absence of any commercial or financial relationships that could be construed as a potential conflict of interest.
All claims expressed in this article are solely those of the authors and do not necessarily represent those of their affiliated organizations, or those of the publisher, the editors and the reviewers. Any product that may be evaluated in this article, or claim that may be made by its manufacturer, is not guaranteed or endorsed by the publisher.
The Supplementary Material for this article can be found online at: https://www.frontiersin.org/articles/10.3389/fvets.2022.1010045/full#supplementary-material
1. Zhang X, Wang W, Mo F, La Y, Li C, Li F. Association of residual feed intake with growth and slaughtering performance, blood metabolism, and body composition in growing lambs. Sci Rep. (2017) 7:12681. doi: 10.1038/s41598-017-13042-7
2. Arokiyaraj S, Stalin A, Shin H. Anti-methanogenic effect of rhubarb (Rheum spp.)—an in silico docking studies on methyl-coenzyme M reductase (MCR). Saudi J Biol Sci. (2019) 26:1458–62. doi: 10.1016/j.sjbs.2019.06.008
3. Crews DH Jr. Genetics of efficient feed utilization and national cattle evaluation: a review. Genet Mol Res. (2005) 4:152–65.
4. Soleimani T, Gilbert H. Evaluating environmental impacts of selection for residual feed intake in pigs. Animal. (2020) 14:2598–608. doi: 10.1017/S175173112000138X
5. Onteru SK, Gorbach DM, Young JM, Garrick DJ, Dekkers JC, Rothschild MF. Whole genome association studies of residual feed intake and related traits in the pig. PLoS ONE. (2013) 8:e61756. doi: 10.1371/journal.pone.0061756
6. Fu L, Jiang Y, Wang C, Mei M, Zhou Z, Jiang Y, et al. A genome-wide association study on feed efficiency related traits in landrace pigs. Front Genet. (2020) 11:692. doi: 10.3389/fgene.2020.00692
7. Do DN, Ostersen T, Strathe AB, Mark T, Jensen J, Kadarmideen HN. Genome-wide association and systems genetic analyses of residual feed intake, daily feed consumption, backfat and weight gain in pigs. BMC Genet. (2014) 15:27. doi: 10.1186/1471-2156-15-27
8. Yang R, Guo X, Zhu D, Tan C, Bian C, Ren J, et al. Accelerated deciphering of the genetic architecture of agricultural economic traits in pigs using a low-coverage whole-genome sequencing strategy. GigaScience. (2021) 10:giab048. doi: 10.1093/gigascience/giab048
9. Do DN, Strathe AB, Ostersen T, Pant SD, Kadarmideen HN. Genome-wide association and pathway analysis of feed efficiency in pigs reveal candidate genes and pathways for residual feed intake. Front Genet. (2014) 5:307. doi: 10.3389/fgene.2014.00307
10. Delgado B, Bach A, Guasch I, González C, Elcoso G, Pryce JE, et al. Author Correction: whole rumen metagenome sequencing allows classifying and predicting feed efficiency and intake levels in cattle. Sci Rep. (2020) 10:2875. doi: 10.1038/s41598-020-60003-8
11. Seabury CM, Oldeschulte DL, Saatchi M, Beever JE, Decker JE, Halley YA, et al. Genome-wide association study for feed efficiency and growth traits in U. S. beef cattle. BMC Genom. (2017) 18:386. doi: 10.1186/s12864-017-3754-y
12. Zhang F, Wang Y, Mukiibi R, Chen L, Vinsky M, Plastow G, et al. Genetic architecture of quantitative traits in beef cattle revealed by genome wide association studies of imputed whole genome sequence variants: I: feed efficiency and component traits. BMC Genom. (2020) 21:36. doi: 10.1186/s12864-019-6362-1
13. Rolf MM, Taylor JF, Schnabel RD, McKay SD, McClure MC, Northcutt SL, et al. Impact of reduced marker set estimation of genomic relationship matrices on genomic selection for feed efficiency in Angus cattle. BMC Genet. (2010) 11:24. doi: 10.1186/1471-2156-11-24
14. Miao Y, Soudy F, Xu Z, Liao M, Zhao S, Li X. Candidate gene identification of feed efficiency and coat color traits in a C57BL/6J × Kunming F2 mice population using genome-wide association study. Biomed Res Int. (2017) 2017:7132941. doi: 10.1155/2017/7132941
15. Dekkers JC. Marker-assisted selection for commercial crossbred performance. J Anim Sci. (2007) 85:2104–14. doi: 10.2527/jas.2006-683
16. Li W, Liu R, Zheng M, Feng F, Liu D, Guo Y, et al. New insights into the associations among feed efficiency, metabolizable efficiency traits and related QTL regions in broiler chickens. J Anim Sci Biotechnol. (2020) 11:65. doi: 10.1186/s40104-020-00469-8
17. Zhang D, Zhang X, Li F, Yuan L, Zhang Y, Li X, et al. Polymorphisms in ovine ME1 and CA1 genes and their association with feed efficiency in Hu sheep. J Anim Breed Genet. (2021) 138:589–99. doi: 10.1111/jbg.12541
18. Abo-Ismail MK, Vander Voort G, Squires JJ, Swanson KC, Mandell IB, Liao X, et al. Single nucleotide polymorphisms for feed efficiency and performance in crossbred beef cattle. BMC Genet. (2014) 15:14. doi: 10.1186/1471-2156-15-14
19. Alexandre PA, Gomes RC, Santana MH, Silva SL, Leme PR, Mudadu MA, et al. Bovine NR1I3 gene polymorphisms and its association with feed efficiency traits in Nellore cattle. Meta Gene. (2014) 2:206–17. doi: 10.1016/j.mgene.2014.01.003
20. Serão NV, González-Peña D, Beever JE, Faulkner DB, Southey BR, Rodriguez-Zas SL. Single nucleotide polymorphisms and haplotypes associated with feed efficiency in beef cattle. BMC Genet. (2013) 14:94. doi: 10.1186/1471-2156-14-94
21. Zhang D, Zhang X, Li F, Li C, La Y, Mo F, et al. Transcriptome analysis identifies candidate genes and pathways associated with feed efficiency in Hu sheep. Front Genet. (2019) 10:1183. doi: 10.3389/fgene.2019.01183
22. Zhang D, Zhang X, Li F, Li X, Zhao Y, Zhang Y, et al. Identification and characterization of circular RNAs in association with the feed efficiency in Hu lambs. BMC Genomics. (2022) 23:288. doi: 10.1186/s12864-022-08517-5
23. Zhang T, Gao H, Sahana G, Zan Y, Fan H, Liu J, et al. Genome-wide association studies revealed candidate genes for tail fat deposition and body size in the Hulun Buir sheep. J Anim Breed Genet. (2019) 136:362–70. doi: 10.1111/jbg.12402
24. Xu SS, Ren X, Yang GL, Xie XL, Zhao YX, Zhang M, et al. Genome-wide association analysis identifies the genetic basis of fat deposition in the tails of sheep (Ovis aries). Anim Genet. (2017) 48:560–9. doi: 10.1111/age.12572
25. Zhao L, Li F, Liu T, Yuan L, Zhang X, Zhang D, et al. Ovine ELOVL5 and FASN genes polymorphisms and their correlations with sheep tail fat deposition. Gene. (2022) 807:145954. doi: 10.1016/j.gene.2021.145954
26. Murakami K, Zhifeng H, Suzuki T, Kobayashi Y, Nakamura Y. The Shisa3 knockout mouse exhibits normal bone phenotype. J Bone Miner Metab. (2019) 37:967–75. doi: 10.1007/s00774-019-01014-y
27. Yamamoto A, Nagano T, Takehara S, Hibi M, Aizawa S. Shisa promotes head formation through the inhibition of receptor protein maturation for the caudalizing factors, Wnt and FGF. Cell. (2005) 120:223–35. doi: 10.1016/j.cell.2004.11.051
28. Pei J, Grishin NV. Unexpected diversity in Shisa-like proteins suggests the importance of their roles as transmembrane adaptors. Cell Signal. (2012) 24:758–69. doi: 10.1016/j.cellsig.2011.11.011
29. Chen CC, Chen HY, Su KY, Hong QS, Yan BS, Chen CH, et al. Shisa3 is associated with prolonged survival through promoting β-catenin degradation in lung cancer. Am J Respir Crit Care Med. (2014) 190:433–44. doi: 10.1164/rccm.201312-2256OC
30. Tsai MH, Chen WC Yu SL, Chen CC, Jao TM, Huang CY, et al. DNA Hypermethylation of SHISA3 in colorectal cancer: an independent predictor of poor prognosis. Ann Surg Oncol. (2015) 22 Suppl 3:S1481–9. doi: 10.1245/s10434-015-4593-1
31. Shen Z, Chen X, Li Q, Zhou C, Li J, Ye H, et al. SSTR2 promoter hypermethylation is associated with the risk and progression of laryngeal squamous cell carcinoma in males. Diagn Pathol. (2016) 11:10. doi: 10.1186/s13000-016-0461-y
32. Zhang J, Li YQ, Guo R, Wang YQ, Zhang PP, Tang XR, et al. Hypermethylation of SHISA3 promotes nasopharyngeal carcinoma metastasis by reducing SGSM1 stability. Cancer Res. (2019) 79:747–59. doi: 10.1158/0008-5472.CAN-18-1754
33. Uhlmann F, Cai J, Flores-Rozas H, Dean FB, Finkelstein J, O'Donnell M, et al. In vitro reconstitution of human replication factor C from its five subunits. Proc Natl Acad Sci USA. (1996) 93:6521–6. doi: 10.1073/pnas.93.13.6521
34. Gong S, Qu X, Yang S, Zhou S, Li P, Zhang Q. RFC3 induces epithelial-mesenchymal transition in lung adenocarcinoma cells through the Wnt/β-catenin pathway and possesses prognostic value in lung adenocarcinoma. Int J Mol Med. (2019) 44:2276–88. doi: 10.3892/ijmm.2019.4386
35. Gaubitz C, Liu X, Magrino J, Stone NP, Landeck J, Hedglin M, et al. Structure of the human clamp loader reveals an autoinhibited conformation of a substrate-bound AAA+ switch. Proc Natl Acad Sci USA. (2020) 117:23571–80. doi: 10.1073/pnas.2007437117
36. Gaubitz C, Liu X, Pajak J, Stone NP, Hayes JA, Demo G, et al. Cryo-EM structures reveal high-resolution mechanism of a DNA polymerase sliding clamp loader. eLife. (2022) 11:e74175. doi: 10.7554/eLife.74175
37. Kang MS, Ryu E, Lee SW, Park J, Ha NY, Ra JS, et al. Regulation of PCNA cycling on replicating DNA by RFC and RFC-like complexes. Nat Commun. (2019) 10:2420. doi: 10.1038/s41467-019-10376-w
38. Liu Q, Wang J, Miki D, Xia R, Yu W, He J, et al. DNA replication factor C1 mediates genomic stability and transcriptional gene silencing in Arabidopsis. Plant Cell. (2010) 22:2336–52. doi: 10.1105/tpc.110.076349
39. Venclovas C, Colvin ME, Thelen MP. Molecular modeling-based analysis of interactions in the RFC-dependent clamp-loading process. Protein Sci. (2002) 11:2403–16. doi: 10.1110/ps.0214302
40. Shen H, Cai M, Zhao S, Wang H, Li M, Yao S, et al. Overexpression of RFC3 is correlated with ovarian tumor development and poor prognosis. Tumour Biol. (2014) 35:10259–66. doi: 10.1007/s13277-014-2216-2
41. Mossi R, Hübscher U. Clamping down on clamps and clamp loaders—the eukaryotic replication factor C. Eur J Biochem. (1998) 254:209–16. doi: 10.1046/j.1432-1327.1998.254209.x
42. He ZY, Wu SG, Peng F, Zhang Q, Luo Y, Chen M, et al. Up-regulation of RFC3 promotes triple negative breast cancer metastasis and is associated with poor prognosis via EMT. Transl Oncol. (2017) 10:1–9. doi: 10.1016/j.tranon.2016.10.004
43. Yao Z, Hu K, Huang H, Xu S, Wang Q, Zhang P, et al. shRNA-mediated silencing of the RFC3 gene suppresses hepatocellular carcinoma cell proliferation. Int J Mol Med. (2015) 36:1393–9. doi: 10.3892/ijmm.2015.2350
44. Shen H, Xu J, Zhao S, Shi H, Yao S, Jiang N. ShRNA-mediated silencing of the RFC3 gene suppress ovarian tumor cells proliferation. Int J Clin Exp Pathol. (2015) 8:8968–75.
45. Lockwood WW, Thu KL, Lin L, Pikor LA, Chari R, Lam WL, et al. Integrative genomics identified RFC3 as an amplified candidate oncogene in esophageal adenocarcinoma. Clin Cancer Res. (2012) 18:1936–46. doi: 10.1158/1078-0432.CCR-11-1431
46. Lin C, Li F, Zhang X, Zhang D, Li X, Zhang Y, et al. Expression and polymorphisms of CD8B gene and its associations with body weight and size traits in sheep. Anim Biotechnol. (2021) 2021:1–9. doi: 10.1080/10495398.2021.2016432
47. Smith SM, Maughan PJ. SNP genotyping using KASPar assays. Methods Mol Biol. (2015) 1245:243–56. doi: 10.1007/978-1-4939-1966-6_18
48. Elliott AC, Woodward WA. Statistical Analysis Quick Reference Guidebook: With SPSS Examples. London: Sage (2007). doi: 10.4135/9781412985949
49. Brian MS, Matthews EL, Watso JC, Babcock MC, Wenner MM, Rose WC, et al. The influence of acute elevations in plasma osmolality and serum sodium on sympathetic outflow and blood pressure responses to exercise. J Neurophysiol. (2018) 119:1257–65. doi: 10.1152/jn.00559.2017
50. Zhao H, Wu X, Cai H, Pan C, Lei C, Chen H, et al. Genetic variants and effects on milk traits of the caprine paired-like homeodomain transcription factor 2 (PITX2) gene in dairy goats. Gene. (2013) 532:203–10. doi: 10.1016/j.gene.2013.09.062
51. Livak KJ, Schmittgen TD. Analysis of relative gene expression data using real-time quantitative PCR and the 2(–Delta Delta C(T)) method. Methods. (2001) 25:402–8. doi: 10.1006/meth.2001.1262
52. Games PA, Howell JF. Pairwise multiple comparison procedures with unequal N's and/or variances: a Monte Carlo study. J Educ Stat. 1:113–25. doi: 10.3102/10769986001002113
53. Sarker PK, Kapuscinski AR, McKuin B, Fitzgerald DS, Nash HM, Greenwood C. Microalgae-blend tilapia feed eliminates fishmeal and fish oil, improves growth, and is cost viable. Sci Rep. (2020) 10:19328. doi: 10.1038/s41598-020-75289-x
54. de Verdal H, Vandeputte M, Mekkawy W, Chatain B, Benzie JAH. Quantifying the genetic parameters of feed efficiency in juvenile Nile tilapia Oreochromis niloticus. BMC Genet. (2018) 19:105. doi: 10.1186/s12863-018-0691-y
55. Khan AR, Nawaz H, Zahoor I. Effect of different levels of digestible threonine on growth performance of broiler chicks. Breast. (2006) 60:61–25.
56. Cantalapiedra-Hijar G, Abo-Ismail M, Carstens GE, Guan LL, Hegarty R, Kenny DA, et al. Review: Biological determinants of between-animal variation in feed efficiency of growing beef cattle. Animal. (2018) 12:s321–s35. doi: 10.1017/S1751731118001489
57. Ali BM, Bastiaansen JWM, de Mey Y, Oude Lansink A. Response to a selection index including environmental costs and risk preferences of producers. J Anim Sci. (2019) 97:156–71. doi: 10.1093/jas/sky400
58. Syvänen AC. Accessing genetic variation: genotyping single nucleotide polymorphisms. Nat Rev Genet. (2001) 2:930–42. doi: 10.1038/35103535
59. Benavides MV, Sonstegard TS, Van Tassell C. Genomic regions associated with sheep resistance to gastrointestinal nematodes. Trends Parasitol. (2016) 32:470–80. doi: 10.1016/j.pt.2016.03.007
60. Youn A, Simon R. Identifying cancer driver genes in tumor genome sequencing studies. Bioinformatics. (2011) 27:175–81. doi: 10.1093/bioinformatics/btq630
61. Dickins B, Nekrutenko A. High-resolution mapping of evolutionary trajectories in a phage. Genome Biol Evol. (2009) 1:294–307. doi: 10.1093/gbe/evp029
62. Nishi H, Tyagi M, Teng S, Shoemaker BA, Hashimoto K, Alexov E, et al. Cancer missense mutations alter binding properties of proteins and their interaction networks. PLoS ONE. (2013) 8:e66273. doi: 10.1371/journal.pone.0066273
63. Sharma Y, Miladi M, Dukare S, Boulay K, Caudron-Herger M, Groß M, et al. A pan-cancer analysis of synonymous mutations. Nat Commun. (2019) 10:2569. doi: 10.1038/s41467-019-10489-2
64. Sauna ZE, Kimchi-Sarfaty C. Understanding the contribution of synonymous mutations to human disease. Nat Rev Genet. (2011) 12:683–91. doi: 10.1038/nrg3051
65. Zhao L, Li F, Yuan L, Zhang X, Zhang D, Li X, et al. Expression of ovine CTNNA3 and CAP2 genes and their association with growth traits. Gene. (2022) 807:145949. doi: 10.1016/j.gene.2021.145949
66. Wang W, La Y, Li F, Liu S, Pan X, Li C, et al. Molecular characterization and expression profiles of the ovine LH? gene and its association with litter size in Chinese Indigenous Small-Tailed Han Sheep. Animals. (2020) 10:460. doi: 10.3390/ani10030460
67. Zhang D, Zhang X, Li F, La Y, Li G, Zhang Y, et al. The association of polymorphisms in the ovine PPARGC1B and ZEB2 genes with body weight in Hu sheep. Anim Biotechnol. (2022) 33:90–7. doi: 10.1080/10495398.2020.1775626
68. Davis EK, Zou Y, Ghosh A. Wnts acting through canonical and noncanonical signaling pathways exert opposite effects on hippocampal synapse formation. Neural Dev. (2008) 3:32. doi: 10.1186/1749-8104-3-32
69. Karnam A, Rambabu N, Das M, Bou-Jaoudeh M, Delignat S, Käsermann F, et al. Therapeutic normal IgG intravenous immunoglobulin activates Wnt-β-catenin pathway in dendritic cells. Commun Biol. (2020) 3:96. doi: 10.1038/s42003-020-0825-4
70. Casella-Mariolo J, Castagneto-Gissey L, Angelini G, Zoli A, Marini P, Bornstein SR, et al. Simulation of gastric bypass effects on glucose metabolism and non-alcoholic fatty liver disease with the Sleeveballoon device. EBioMedicine. (2019) 46:452–62. doi: 10.1016/j.ebiom.2019.07.069
71. Fang L, Cai W, Liu S, Canela-Xandri O, Gao Y, Jiang J, et al. Comprehensive analyses of 723 transcriptomes enhance genetic and biological interpretations for complex traits in cattle. Genome Res. (2020) 30:790–801. doi: 10.1101/gr.250704.119
72. Fan P, Nelson CD, Driver JD, Elzo MA, Peñagaricano F, Jeong KC. Host genetics exerts lifelong effects upon hindgut microbiota and its association with bovine growth and immunity. ISME J. (2021) 15:2306–21. doi: 10.1038/s41396-021-00925-x
73. Xue MY, Sun HZ, Wu XH, Liu JX, Guan LL. Multi-omics reveals that the rumen microbiome and its metabolome together with the host metabolome contribute to individualized dairy cow performance. Microbiome. (2020) 8:64. doi: 10.1186/s40168-020-00819-8
74. Volden H. Effects of level of feeding and ruminally undegraded protein on ruminal bacterial protein synthesis, escape of dietary protein, intestinal amino acid profile, and performance of dairy cows. J Anim Sci. (1999) 77:1905–18. doi: 10.2527/1999.7771905x
75. Pillay J, Kamp VM, van Hoffen E, Visser T, Tak T, Lammers JW, et al. A subset of neutrophils in human systemic inflammation inhibits T cell responses through Mac-1. J Clin Invest. (2012) 122:327–36. doi: 10.1172/JCI57990
Keywords: association analysis, SHISA3, RFC3, feed conversion ratio, tissue expression, Hu sheep
Citation: Lin C, Wang W, Zhang D, Huang K, Li X, Zhang Y, Zhao Y, Wang J, Zhou B, Cheng J, Xu D, Li W, Zhao L, Ma Z, Yang X, Huang Y, Cui P, Liu J, Zeng X, Zhai R, Sun L, Weng X, Wu W, Zhang X and Zheng W (2023) Polymorphisms in SHISA3 and RFC3 genes and their association with feed conversion ratio in Hu sheep. Front. Vet. Sci. 9:1010045. doi: 10.3389/fvets.2022.1010045
Received: 02 August 2022; Accepted: 05 December 2022;
Published: 05 January 2023.
Edited by:
Duy Ngoc Do, Dalhousie University, CanadaReviewed by:
Li Li, University of New England, AustraliaCopyright © 2023 Lin, Wang, Zhang, Huang, Li, Zhang, Zhao, Wang, Zhou, Cheng, Xu, Li, Zhao, Ma, Yang, Huang, Cui, Liu, Zeng, Zhai, Sun, Weng, Wu, Zhang and Zheng. This is an open-access article distributed under the terms of the Creative Commons Attribution License (CC BY). The use, distribution or reproduction in other forums is permitted, provided the original author(s) and the copyright owner(s) are credited and that the original publication in this journal is cited, in accordance with accepted academic practice. No use, distribution or reproduction is permitted which does not comply with these terms.
*Correspondence: Xiaoxue Zhang,  emhhbmd4eEBnc2F1LmVkdS5jbg==; Wenxin Zheng, end4MjAyMEAxMjYuY29t
Disclaimer: All claims expressed in this article are solely those of the authors and do not necessarily represent those of their affiliated organizations, or those of the publisher, the editors and the reviewers. Any product that may be evaluated in this article or claim that may be made by its manufacturer is not guaranteed or endorsed by the publisher.
Research integrity at Frontiers
Learn more about the work of our research integrity team to safeguard the quality of each article we publish.