 Desen Li1†
 Min Huang1†Zhanwei Zhuang1
 Rongrong Ding1Ting Gu1
 Linjun Hong1Enqin Zheng1Zicong Li1Gengyuan Cai1
 Zhenfang Wu1,2*
 Jie Yang1*
- 1College of Animal Science and National Engineering Research Center for Breeding Swine Industry, South China Agricultural University, Guangzhou, China
- 2Lingnan Guangdong Laboratory of Modern Agriculture, Guangzhou, China
Duroc pigs are famous for their high growth rate, feed conversion efficiency, and lean meat percentage. Given that they have been subjected to artificial selection and breeding in multiple countries, various lines with obvious differences in production performance have formed. In this study, we genotyped 3,770 American Duroc (AD) pigs and 2,098 Canadian Duroc (CD) pigs using the GeneSeek Porcine SNP50 Beadchip to dissect the genetic differences and potential selection genes of growth traits in these two Duroc pig lines. Population structure detection showed that there were significant genetic differences between the two Duroc pig lines. Hence, we performed FST and cross-population extended haplotype homozygosity (XP-EHH) analyses between the two lines. As a result, we identified 38 annotated genes that were significantly enriched in the gland development pathway in the AD line, and 61 annotated genes that were significantly enriched in the immune-related pathway in the CD line. For three growth traits including backfat thickness (BFT), loin muscle depth (LMD), and loin muscle area (LMA), we then performed selection signature detection at 5 and 10% levels within the line and identified different selected regions and a series of candidate genes that are involved in lipid metabolism and skeletal muscle development or repair, such as IRX3, EBF2, WNT10B, TLR2, PITX3, and SGCD. The differences in selected regions and genes between the two lines may be the cause of the differences in growth traits. Our study suggests significant genetic differences between the AD and CD lines, which provide a theoretical basis for selecting different Duroc lines as sires for different needs.
Introduction
Lean pigs have been selected and bred in various countries for a long time and have formed distinctive lines, such as English Large White and French Large White. Since the 1980s, China introduced Duroc pigs from America (American line), Canada (Canadian line), Denmark (Danish line), China Taiwan (Taiwan line), and Japan (Japanese line). Among these Duroc lines, the Taiwan line has the characteristics of beautiful body shape, rough feeding resistance, and strong disease resistance, but the growth rate is slow during the late fattening period. The American line has a higher growth rate, stress resistance, and lean meat percentage than the Taiwan line. The Canadian line is well-known for its high average daily gain, rich intramuscular fat (IMF) content, and excellent meat quality (1).
Quan et al. assessed the carcass traits of American Duroc × (Landrace × Yorkshire) three-way cross hybrid (ADLY) pigs and Taiwan Duroc × (Landrace × Yorkshire) three-way cross hybrid (TDLY) pigs and found that the lean meat percentage of ADLY pigs was better than that of TDLY pigs (ADLY: 57.39 vs. TDLY: 55.27%) (p < 0.01), while the live mass (ADLY: 104.06 vs. TDLY: 110.02 kg), carcass mass (ADLY: 88.31 vs. TDLY: 94.14 kg), loin muscle depth (LMD) (ADLY: 51.16 vs. TDLY: 54.61 cm), and carcass italic length (ADLY: 84.16 vs. TDLY: 86.01 cm) of TDLY were better than those of ADLY (p < 0.01) (2). Zhuang et al. conducted genome-wide association studies (GWAS) for loin muscle area (LMA) and LMD in American and Canadian Duroc pigs and identified 75 significantly associated SNPs, of which a 283-kb region on chromosome 7 was a pleiotropic quantitative trait loci (QTL) that affected both traits. Among these 75 SNPs, the ALGA0040260 marker was the key SNP for the QTL and explained 1.77 and 2.48% of the phenotypic variance in LMA and LMD, respectively (3). In addition, Zhuang et al. also performed GWAS for teat number in American and Canadian Duroc pigs and detected a QTL on chromosome 7 with marker rs692640845 explaining 8.68% of the phenotypic variance in the Canadian Duroc (4). Although these studies conducted GWAS for different lines of Duroc pigs and identified different candidate genes and QTLs, they did not uncover the genetic differences between different Duroc lines.
For different production needs, different lines of pigs have formed their own characteristics through artificial selection. Animals are usually selected for certain traits, and the internal mechanism is the selection of genes. The selection signature detection can reveal potential selection genes, which is of great significance for understanding the evolution of species and identifying genes for economic traits. Ma et al. performed the cross-population extended haplotype homozygosity (XP-EHH) and FST to detect trait-specific selection signatures by making backfat thickness (BFT) gradient differential population pairs in Yorkshire pigs, and identified that a number of genes were associated with fat metabolism, such as OSBPL8, ASAH2, GBE1, and ABL1 (5). Kim et al. used the Duroc pigs that were sampled from the sixth generation of a selection experiment for IMF to divide the high and low IMF groups and to conduct selection signature detection, and a total of 16 consensus regions were obtained using the three methods [including FST, the integrated haplotype score (IHS), and the standardized score of the ratio of extended haplotype homozygosity (Rsb)] (6). The above studies show the feasibility of dividing the phenotypic gradient groups within the population for selective signature detection, but there is no relevant research on the use of this method in different lines of Duroc.
Therefore, in this study, we used Porcine SNP50 Beadchip to genotype 3,770 America Duroc (AD) and 2,098 Canadian Duroc (CD) pigs and carried out selection signature detection between the two lines. Besides, for the same line, we also performed selection signature detection through dividing extreme phenotypic groups according to the estimated breeding values (EBV) ranking of BFT, LMD, and LMA, and then have identified the selected regions and genes in different lines to reveal the potential genetic mechanisms that caused the differences in growth traits.
Materials and Methods
Ethics Statement
All animals used in this study met the guidelines for the care and use of experimental animals established by the Ministry of Agriculture of China. The whole of this study was approved by the ethics committee of South China Agriculture University (SCAU, Guangzhou, China), and written informed consent was obtained prior to data collection from Wens Foodstuff Group Co., Ltd. (Guangdong, China). There was no use of human participants, data, or tissues.
Sample collection, SNP Genotyping, and Phenotype Detection
A total of 3,770 American Duroc pigs and 2,098 Canadian Duroc pigs were genotyped using the GeneSeek Porcine SNP50 Beadchip in this study. All pigs in the two populations sustained uniform feeding conditions, fine fodder, and consistent management during the fattening period from 30 to 100 kg live weight to minimize the impact of non-genetic factors. The details of sample collection, DNA extraction, SNP genotyping, and recording of LMA and LMD were described by Zhuang et al. (3). In addition, BFT was obtained by measuring the thickness of backfat between the 10th and 11th rib of the pigs at the weight of 100 ± 5 kg using an Aloka 500 V SSD B ultrasound (Corometrics Medical Systems, USA). The three phenotypes were corrected by 100 kg body weight. Quality filtering of genotypes was performed using PLINK v1.9 (7) with the criteria of minor allele frequencies (MAF) >0.01, individual call rate >95%, and SNP call rate >95%. After removing non-autosomal and unmapped SNPs, a total of 39,567 SNPs remained and used in subsequent analyses.
Population Structure and Estimation of Inbreeding Coefficient
Genetic distance among individuals was calculated via an identity-by-state (IBS) similarity matrix by PLINK v1.9. A neighbor-joining relationship tree (NJ-tree) based on the genetic distance was constructed using PHYLP v3.69 (8) and was visualized using Figtree v1.4 (9). We randomly selected 100 individuals from each of the two lines 10 times and used PLINK v1.9 to estimate linkage disequilibrium decay (LD decay) distance. When r2 = 0.3, the physical distance was used to identify the range of the annotated genes (10). Runs of homozygosity (ROH) of the two lines were performed using the consecutiveRUNS.run function of the R detectRUNS package (11). The inbreeding coefficient based on ROH (FROH) was calculated for each individual using the following formula (12):
where LROH is the length of ROH of individual i, and LAUTO is the autosomal genome length covered by the SNPs in this study.
Estimated Breeding Value Calculation
Additive effect (breeding value), dominance effect, and epistatic effect can affect quantitative traits, among which additive effect can be stably inherited by offspring, which means the EBV can be calculated from phenotypes and parentage. In this study, the EBV of BFT, LMD, and LMA were calculated based on the restricted maximum likelihood (REML) method via the dumai model of DMU software (13). The calculation model is as follows:
where y is the vector of phenotypic values, b is the fixed effects vector, including sex, farm, year, season, and parity (Supplementary Table 1), a is the vector of individual random additive effect, e is the vector of random residuals, and X and Z are the structural matrices of a and b, respectively. For BFT, a single-trait animal model was used to obtain the EBV. A multitrait animal model was used in LMD and LMA because of their strong correlation with muscle. As a result, 50% of EBV of the two traits was taken to obtain the total breeding value (TBV) for the two traits.
Selection Signature Detection Between the American Duroc Line and the Canadian Duroc Line
To detect the degree of genetic differentiation between the AD and CD lines, FST between the two lines was performed using VCFtools (14). The XP-EHH was operated using the “–xpehh” function of Selscan (15) based on the haplotypes constructed by Beagle (16). The top 1% values were taken as the significant thresholds of FST and XP-EHH, respectively, and the overlapping SNPs of two methods exceeding the thresholds were considered as the selected markers.
Selection Signature Detection for Genetic Differential in Different Gradients of Growth Traits Within the American Duroc Line and the Canadian Duroc Line
According to the EBV ranking of BFT, LMD, and LMA in the AD and CD lines, the individuals with the top 5% EBV were selected for a group and the bottom 5% of which were selected for the other group, defined as the 5% level. A similar strategy was defined at the 10% level. Then the XP-EHH and the FST were used to detect the selection signature in the two levels for each trait within the two lines. A value of 0.05 was used as the significance threshold for FST, and the top 5% was used as the significance threshold for XP-EHH.
Candidate Gene and Functional Annotation
When r2 = 0.3, the LD decay distances of the two lines were used as the upstream and downstream ranges of the selected markers to determine the selected regions. We then searched the annotated genes from the selected regions and conducted Gene Ontology (GO) and Kyoto Encyclopedia of Genes and Genomes (KEGG) pathway analysis by Metascape (https://metascape.org/) to identify the candidate genes whose functions are associated with growth traits. In addition, the annotated genes were compared with the pig QTL database (https://www.animalgenome.org/) to identify the genes within the QTL regions for growth traits.
Results
Population Structure
Our previous study performed principal component analysis (PCA) between these two Duroc pig populations (3), and the results showed that PC1 divided the AD and CD lines into two obvious groups, and PC2 showed that there was stratification phenomenon in the AD line as well. Then, in this study, the NJ tree showed that the two lines formed two apparently independent branches (Supplementary Figure 1A), and there were multiple lineages within the AD line. PCA and NJ-tree analysis revealed that there was significant genetic differentiation between the AD and CD lines, which implied that there were obvious genetic differences between the two Duroc lines. To avoid the impact of population stratification in the AD line, PCA was conducted for each lineage of the AD line and the CD line according to the NJ tree of the AD line (Supplementary Figure 2). Finally, a total of 1,969 AD line pigs with relatively concentrated clustering and more differentiated with the CD line were selected for subsequent analysis. The results of LD decay analysis showed that the decay rate of the CD line was slower than that of the AD line. When r2 = 0.3, the average LD decay distances in the AD and CD lines were approximately 150 and 202 kb, respectively (Supplementary Figure 1B). Although the same Porcine SNP50 Beadchip data were utilized for LD decay analysis in the study by Zhuang et al. (4), our study had different population size, analysis methods, and threshold line criteria, and therefore, the LD decay analysis was reperformed in this study rather than directly cited. Besides, the average FROH of the AD line was lower than that of the CD line (Supplementary Figure 1C). The results of LD decay and FROH indicated a higher degree of inbreeding in the CD line.
EBV Calculation
We corrected and summarized the statistics for BFT, LMD, and LMA in the AD and CD lines, respectively, and all of these traits were normally distributed as shown in Supplementary Figure 3A. We found that there were significant differences between the two lines in these phenotypes, of which LMD and LMA in the AD line were greater than those in the CD line, while BFT was lower than the latter (Supplementary Figure 3B). Next, the EBV of BFT, LMD, and LMA were calculated separately in the two lines (Supplementary Tables 2, 3).
Selection Signature Detection Between the American Duroc Line and the Canadian Duroc Line
Population structure analysis revealed a large degree of genetic differentiation between the AD and CD lines. Hence, we performed selection signature detection between 1,969 and 2,098 individuals from the AD and CD lines, respectively. In the XP-EHH analysis, the AD line was used as the test population and the CD line as the reference population, which means that the positive values represent recent selection in the AD line, and conversely, the negative values represent that of the CD line (Figure 1B). The top 1% was used as the significant threshold for FST (Figure 1A) and XP-EHH (FSTtop1% = 0.44, XP-EHHAD = 0.12, and XP-EHHCD = −0.14), and the overlapping significant SNPs in the two statistics were defined as the selected markers. A total of 28 selected markers and 38 annotated genes were identified in the AD line from the 300-kb selected region (150 kb upstream and downstream of the selected SNPs), while a total of 30 selected markers and 61 annotated genes were found in the CD line from the 404-kb selected region (202 kb upstream and downstream of the selected SNPs). GO enrichment and KEGG pathway analysis of the annotated genes showed that the genes were significantly enriched in the gland development pathway (GO: 0048732) in the AD line (Figure 1C). For the CD line, the genes were significantly enriched in immune-related pathways (GO: 0048245, GO: 0002366) (Figure 1D; Supplementary Table 4).
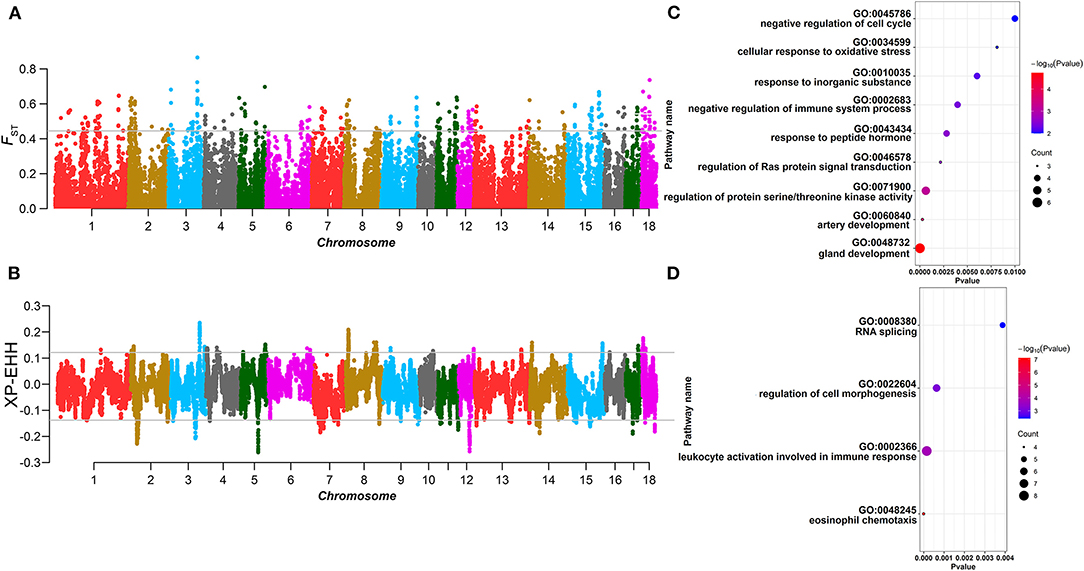
Figure 1. Selection signature detection between the American Duroc (AD) line and the Canadian Duroc (CD) line. (A) Manhattan plot of FST. The gray line denotes threshold line (FSTtop1% = 0.44). (B) Manhattan plot of XP-EHH. The gray lines denote threshold lines (XP-EHHAD = 0.12, XP-EHHCD = −0.14). (C,D) are the bubble chart of Gene Ontology (GO) terms and Kyoto Encyclopedia of Genes and Genomes (KEGG) pathways of the selected genes identified from the AD and CD lines, respectively.
Selection Signature of Backfat Thickness Within the American Duroc line and the Canadian Duroc Line
The 5% Level
For the AD line, according to the EBV ranking of BFT, 98 individuals with the top and the bottom EBV values were selected from 1,969 individuals as two groups to carry out FST and XP-EHH. In XP-EHH, the top 5% group was used as the test population, and the bottom 5% group was used as the reference population. The overlapping SNPs that exceeded the significant threshold in both methods (FST > 0.05, XP-EHHAD = 0.08) were regarded as the selected markers in the AD line. A total of 46 selected markers and 35 annotated genes were identified. GO and KEGG enrichment analysis of the annotated genes (Supplementary Figure 4) revealed that genes such as IRX3 and EBF2 are involved in lipid metabolism. Similarly, 105 individuals with the top and bottom EBV values were selected from the CD line, respectively, as the two groups to detect the selection signature. A total of 131 selected markers exceeded the thresholds in both FST and XP-EHH (XP-EHHCD = 0.05), and 167 annotated genes were identified. We found that SAMD4A, DLGAP5, CTSF, etc. (Figures 2A–D; Table 1) are involved in lipid deposition-related pathways according to GO and KEGG enrichment analysis (Supplementary Figure 5).
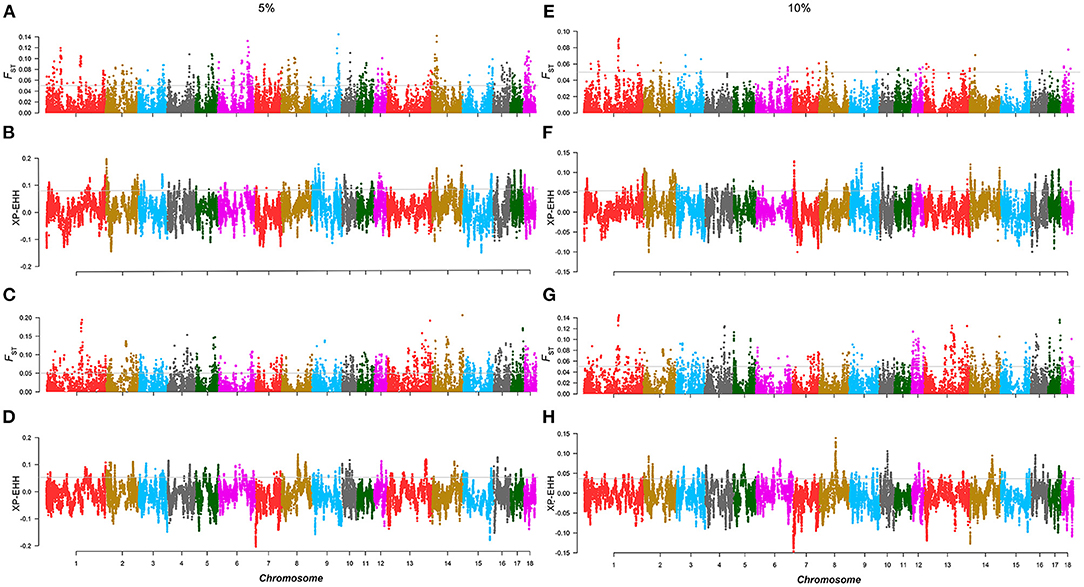
Figure 2. Selection signature detection for backfat thickness (BFT) in the 5 and 10% levels. (A,C,E,G) are the Manhattan plots of FST of the AD and CD lines in the 5 and 10% level. The gray lines denote threshold lines (FST = 0.05). (B), (D,F,H) are the Manhattan plots of XP-EHH of AD and CD lines in the 5 and 10% levels. The gray lines denote threshold lines (XP-EHH5%AD = 0.080, XP-EHH5%CD = 0.053, XP-EHH10%AD = 0.054, XP-EHH10%CD = 0.036).
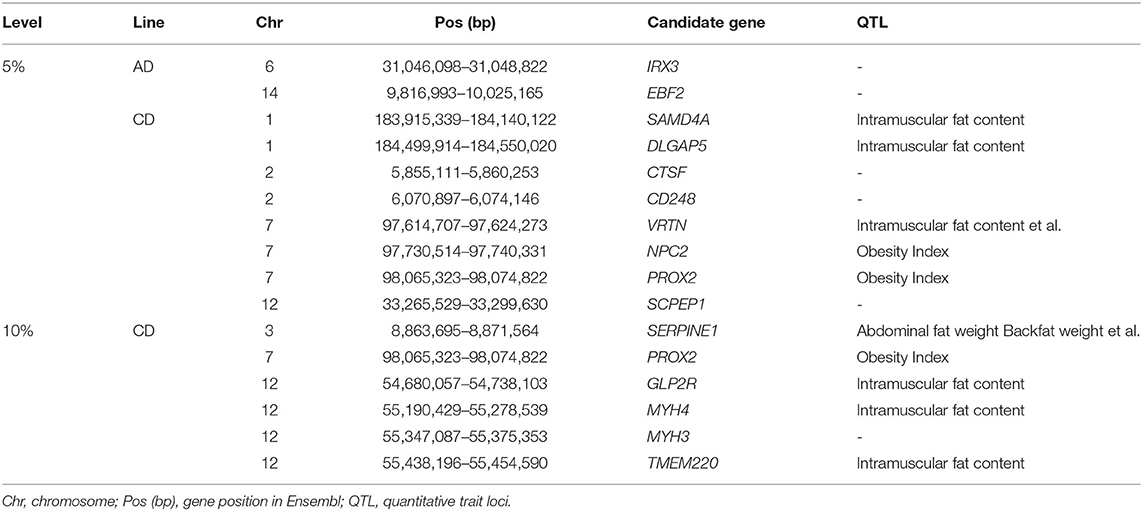
Table 1. Candidate genes for BFT in the 5% level analysis.
The 10% Level
For the AD line, 196 individuals were selected for the top 10% and bottom 10% groups, respectively, and were used to perform selection signature analysis. The results showed that there were differences from the 5% level. Several significantly differentiated areas at the 5% level disappeared at the 10% level, which means that with an increase in the number of selected individuals for the same trait, the selection intensity within the same Duroc line decreased. Five selected markers were identified in the AD line, and seven annotated genes were identified in the selected regions, but there were no genes related to BFT or lipid traits. For the CD line, 210 individuals in the top 10% and bottom 10% groups were selected for analysis, respectively, and a total of 38 selected markers were found, including 72 annotated genes, among which SERPINE1, PROX2, GLP2R, etc., were related to lipid metabolism (Figures 2E–H; Table 1). In addition, in the AD line, two overlapping selected markers and one gene ATP8A1 were identified from both the 5 and 10% levels. ATP8A1 participates in catalyzing the hydrolysis of ATP coupled to the transport of amino phospholipids from the outer to the inner leaflet of various membranes and ensures the maintenance of the asymmetric distribution of phospholipids (17). In the CD line, there were 18 overlapping selected markers and 19 genes from the two levels of which PROX2 was related to the BFT trait and located in the obesity index QTL region (18) (Supplementary Table 5).
Selection Signature of Loin Muscle Depth and Loin Muscle Area Within the American Duroc Line and the Canadian Duroc Line
The 5% Level
Similar to the above strategy, according to the rank of the TBV estimated from LMD and LMA, two 5% level groups were used to detect selection signatures in the two lines, respectively. For the AD line, we found 71 selected markers, and 130 genes were identified. GO and KEGG enrichment analyses were performed for these genes, among which WNT10B, TLR2, PITX3, and SGCD were involved in muscle tissue regulation and muscle development (Supplementary Figure 6). Similarly, the same method was performed in the CD line, and the results showed that 103 selected markers and 97 genes were identified. GO and KEGG enrichment analysis (Supplementary Figure 7) showed that TMOD3, NEGR1, and PITX2 were associated with the trait (Figures 3A–D; Table 2).
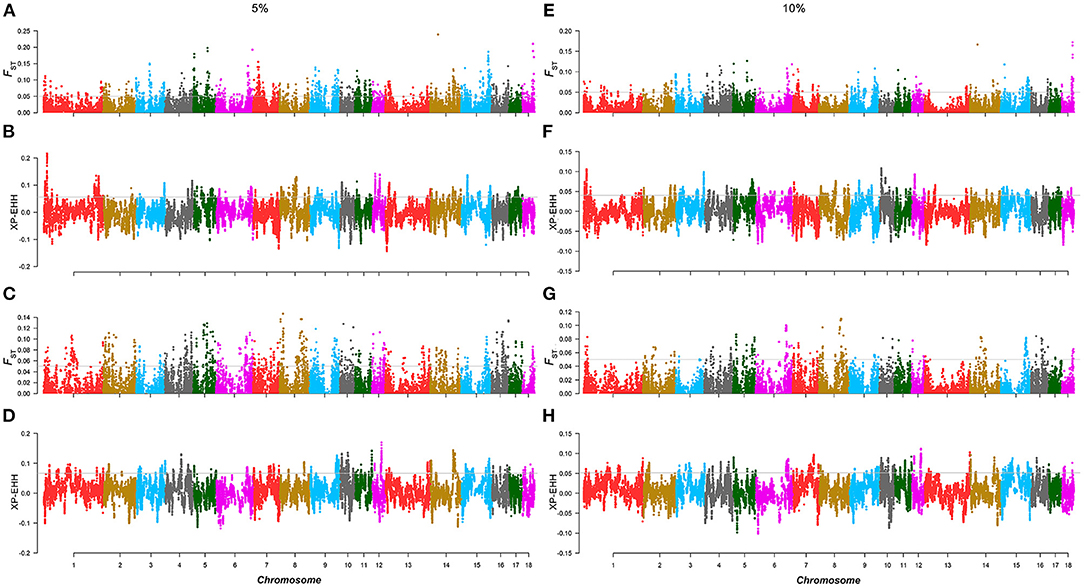
Figure 3. Selection signature detection for LMD and LMA in the 5 and 10% level. (A,C,E,G) are the Manhattans plots of FST of AD and CD lines in the 5 and 10% level. The gray lines denote threshold lines (FST = 0.05). (B,D,F,H) are the Manhattan plots of XP-EHH of AD and CD lines in the 5 and 10% level. The gray lines denote threshold lines (XP-EHH5%AD = 0.057, XPEHH5%CD = 0.067, XP-EHH10%AD = 0.040, XP-EHH10%CD = 0.052).
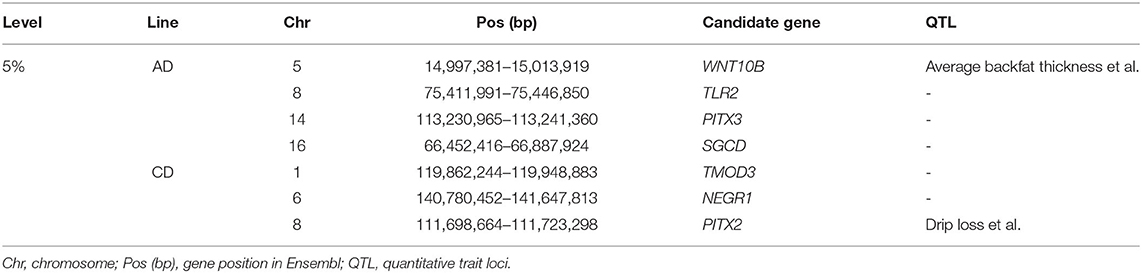
Table 2. Candidate genes for loin muscle depth (LMD) and loin muscle area (LMA) in the 5% level analysis.
The 10% level
Similar to the results of the 10% level analysis in BFT, the regions of significant differentiation in the 5% level analysis of LMD and LMA disappeared in that of the 10% level. For the AD line, a total of 22 selected markers were found, and 30 genes were identified, but none of these genes were related to muscle traits. As for the CD line, 58 selected markers and 23 annotated genes were identified, of which only SLC44A5 was related to muscle development (Figures 3E–H). In addition, in the AD line, 6 overlapping selected markers and eight genes were identified from both the 5 and 10% levels, while a total of 39 overlapping selected markers and eight genes were identified in the CD line (Supplementary Table 6).
Discussion
In this study, we conducted genomic analyses of 3,770 American Duroc pigs and 2,098 Canadian Duroc pigs to dissect the genetic differences and potential selection genes of growth traits in the two Duroc pig populations. Our results showed that the BFT in the CD line was higher than that of the AD line, while the LMD and LMA were lower than those of the AD line, which was consistent with the description of Wang et al. (1). Here, we think that the genetic differences between the two lines account for the differences in these traits. Therefore, we performed PCA (3), NJ-tree analysis, and LD decay analysis in the two lines, and the results showed that the AD and CD lines were clearly divided into two separate groups, with multiple branches within the AD line. The results of LD decay and FROH indicated that the CD line exhibited higher inbreeding. According to the differences in traits, we hypothesized that the genetic differences between the two lines may be caused by a combination of natural selection and artificial selection based on different breeding criteria, which resulted in phenotypic differentiation. Therefore, we performed selection signature analysis to detect the different selected genes in the two lines. The results showed that a series of genes selected in the AD line were enriched in the gland development pathway, while the genes were mainly involved in immune-related pathways in the CD line.
Many effects can affect quantitative traits, among which additive effect can be stably inherited by offspring. The EBV can be used for early selection, and even before the individual is born, the breeding value of the offspring can be predicted according to the performance of the two parents determined by the breeding plan. The AD and CD lines are commercial populations. In response to different breeding needs, selective breeding based on EBV ranking has been widely used in business (19). The individuals with better performance in traits in the same line can be retained; otherwise, they will be eliminated. Therefore, we adopted EBV and divided extreme individuals according to the ranking of EBV for analysis in this study, which is in line with actual production needs and patterns.
To reveal the genetic mechanism of growth traits in different lines, we divided different gradient levels to perform selection signature analysis. For the BFT, IRX3, and EBF2 related to fat metabolism were identified in the AD line at the 5% level. IRX3 is a functional long-range target of obesity-associated variants within FTO, IRX3-deficient mice reduces body weight by reducing fat mass and increasing basal metabolic rate and browning of white adipose tissue (20), and EBF2 promotes the recruitment of beige adipocytes in white adipose tissue and protects animals against obesity (21). Seven genes including SAMD4A, DLGAP5, VRTN, NPC2, PROX2, CD248, and SCPEP1 were identified in the CD line. Among these genes, SAMD4A, DLGAP5, and VRTN located in the IMF content QTL region (22–24), and NPC2, PROX2 located in the obesity index QTL region (18). A missense mutation in the CTSF was significantly associated with average day gain, lean meat percentage, BFT, and feed conversion efficiency according to the study by Russo et al. (25). CD248 is a sensitive marker of adipocyte function, increased expression of which leads to disturbances in glucose metabolism and ectopic deposition of lipids (26). SCPEP1 regulates body fat content and is correlated with IMF deposition in pigs (27). However, at the 10% level, no trait-related genes were identified in the AD line. In contrast, GLP2R, MYH4, TMEM220, SERPINE1, and MYH3 were identified in the CD line. GLP2R, MYH4, and TMEM220 are located within the IMF content QTL region (23, 28), and SERPINE1 is located in the QTL regions of abdominal fat weight, backfat weight, and subcutaneous fat, respectively (29). Besides, MYH3 is a causal gene for the ratio of muscle fiber type, IMF content, and fat formation in pigs and mice (30).
We then performed selection signature analysis for LMD and LMA based on their TBV. At the 5% level, we identified WNT10B, TLR2, PITX3, and SGCD related to skeletal muscle development and repair in the AD line. WNT10B is involved in the Wnt signaling pathway and associated with skeletal muscle developmental regulation and regeneration (31). TLR2 controls skeletal muscle repair mechanisms following different forms of injury (32). PITX3 is widely expressed in skeletal muscles and promotes myogenic differentiation of muscle satellite cells (33). SGCD is a muscular dystrophy protein-related glycoprotein and abundantly expressed in skeletal and cardiac muscles (34). In the CD line, TMOD3, NEGR1, and PITX2 were identified. TMOD3 is involved in the regulation of actin and skeletal muscle contractions (35). NEGR1 mediates neural cell communication and synapse formation, and deletion of this gene leads to increased adiposity and decreased muscle quality in mice (36). PITX2 is involved in the regulation of skeletal muscle tissue development and animal organ morphogenesis (37). However, at the 10% level, we did not find trait-related genes in the AD line, but among the 30 genes obtained from the CD line, SLC44A5 was found and fell within the QTL region of muscle fiber diameter (38).
In conclusion, population genetic analysis based on large samples showed that there was significant genetic differentiation between Duroc pigs with different genetic backgrounds in this study, which was also reflected in traits of different lines, such as the CD line with higher BFT, and the AD line with higher LMA and LMD. Selection signature detection between the AD and CD lines showed that there were different selective regions in the two lines. For the same line, we carried out selection signature detection at different levels based on EBV of BFT, LMD, and LMA phenotypes, and a series of genes associated with the three traits were identified, further illustrating the complexity of the genetic mechanism of quantitative traits. This study reveals the genetic differences between different lines of Duroc pigs after strong artificial selection and provides a reference for selecting different lines of Duroc pigs as sires for different needs.
Data Availability Statement
Publicly available datasets were analyzed in this study. This data can be found here: https://doi.org/10.6084/m9.figshare.8019551.v1.
Ethics Statement
The animal study was reviewed and approved by South China Agriculture University.
Author Contributions
ZW and JY proposed the idea for the study. DL performed the bioinformatics analysis and wrote the paper. MH directed the analyses and revised the article. ZZ, RD, TG, LH, EZ, ZL, and GC collected the samples and recorded the phenotypes. ZW and GC contributed the materials. All authors reviewed and approved the manuscript.
Funding
This study was supported by the National Natural Science Foundation of China (Grant No. 31972540), the Natural Science Foundation of Guangdong Province (Grant Nos. 2018B030313011 and 2020A1515111103), the Local Innovative and Research Teams Project of Guangdong Province (Grant No. 2019BT02N630), and the Guangdong Province Rural Revitalization Strategy Special Project (Grant No. 200-2018-XMZC-0001-107-0145).
Conflict of Interest
The authors declare that the research was conducted in the absence of any commercial or financial relationships that could be construed as a potential conflict of interest.
Publisher's Note
All claims expressed in this article are solely those of the authors and do not necessarily represent those of their affiliated organizations, or those of the publisher, the editors and the reviewers. Any product that may be evaluated in this article, or claim that may be made by its manufacturer, is not guaranteed or endorsed by the publisher.
Acknowledgments
The authors would like to thank all the staff at the pig core breeding farms of Wens Foodstuff Group Co., Ltd. (Guangdong, China) for the help in sample collection.
Supplementary Material
The Supplementary Material for this article can be found online at: https://www.frontiersin.org/articles/10.3389/fvets.2021.725367/full#supplementary-material
References
1. Wang L, Wang A, Wang L, Li K, Yang G, He R, et al. In Animal Genetic Resources in China:Pigs. China National Commission of Animal Genetic Resources, editor. China Agricultural Press (2011).p. 2–16.
2. Quan J, Yang M, Ding R, Yang L, Liu J, Liu J, et al. Genetic comparison of carcass and meat quality traits of different strain Duroc three-way cross hybrid pigs. J South China Agric Univ. (2016) 6:46–51. doi: 10.7671/j.issn.1001-411X.2016.06.007
3. Zhuang Z, Li S, Ding R, Yang M, Zheng E, Yang H, et al. Meta-analysis of genome-wide association studies for loin muscle area and loin muscle depth in two Duroc pig populations. PLoS ONE. (2019) 14:e0218263. doi: 10.1371/journal.pone.0218263
4. Zhuang Z, Ding R, Peng L, Wu J, Ye Y, Zhou S, et al. Genome-wide association analyses identify known and novel loci for teat number in Duroc pigs using single-locus and multi-locus models. BMC Genom. (2020) 21:344. doi: 10.1186/s12864-020-6742-6
5. Ma H, Zhang S, Zhang K, Zhan H, Peng X, Xie S, et al. Identifying selection signatures for backfat thickness in yorkshire pigs highlights new regions affecting fat metabolism. Genes-Basel. (2019) 10:254. doi: 10.3390/genes10040254
6. Kim E, Ros-Freixedes R, Pena RN, Baas TJ, Estany J, Rothschild MF. Identification of signatures of selection for intramuscular fat and backfat thickness in two Duroc populations. J Anim Sci. (2015) 93:3292–302. doi: 10.2527/jas.2015-8879
7. Chang CC, Chow CC, Tellier LC, Vattikuti S, Purcell SM, Lee JJ. Second-generation PLINK:rising to the challenge of larger and richer datasets. Gigascience. (2015) 4:7. doi: 10.1186/s13742-015-0047-8
9. Rambaut A. FigTree v1.4.3 2006–2016. (2006). Available online at: http://tree.bio.ed.ac.uk/software (accessed 2016).
10. Ai H, Huang L, Ren J. Genetic diversity, linkage disequilibrium and selection signatures in chinese and Western pigs revealed by genome-wide SNP markers. PLoS ONE. (2013) 8:e56001. doi: 10.1371/journal.pone.0056001
11. Biscarini F, Cozzi P, Gaspa G, Marras G. detectRUNS:Detect runs of homozygosity and runs of heterozygosity in diploid genomes. R package version 0.9.6 (2019). Available online at: https://CRAN.R-project.org/package=detectRUNS (accessed 2019).
12. McQuillan R, Leutenegger A, Abdel-Rahman R, Franklin CS, Pericic M, Barac-Lauc L, et al. Runs of homozygosity in European populations. Am J Hum Genet. (2008) 83:359–72. doi: 10.1016/j.ajhg.2008.08.007
13. Madsen P, Srensen P, Su G, Damgaard L, Labouriau R. DMU - a package for analyzing multivariate mixed models. In: Proceedings of the 8th World Congress on Genetics Applied to Livestock Production. Belo Horizonte, Minas Gerais, Brazil (2006).p. 27–11.
14. Danecek P, Auton A, Abecasis G, Albers CA, Banks E, DePristo MA, et al. The variant call format and VCFtools. Bioinformatics. (2011) 27:2156–8. doi: 10.1093/bioinformatics/btr330
15. Szpiech ZA, Hernandez RD. selscan:an efficient multithreaded program to perform ehh-based scans for positive selection. Mol Biol Evol. (2014) 31:2824–7. doi: 10.1093/molbev/msu211
16. Browning BL, Browning SR. A unified approach to genotype imputation and haplotype-phase inference for large data sets of trios and unrelated individuals. Am J Hum Genet. (2009) 2:210–23. doi: 10.1016/j.ajhg.2009.01.005
17. Hiraizumi M, Yamashita K, Nishizawa T, Nureki O. Cryo-EM structures capture the transport cycle of the P4-ATPase flippase. Science. (2019) 365:1149–55. doi: 10.1126/science.aay3353
18. Kogelman LJA, Pant SD, Fredholm M, Kadarmideen HN. Systems genetics of obesity in an F2 pig model by genome-wide association, genetic network, and pathway analyses. Front Genet. (2014) 5:214. doi: 10.3389/fgene.2014.00214
19. Newcom DW, Baas TJ, Stalder KJ, Schwab CR. Comparison of three models to estimate breeding values for percentage of loin intramuscular fat in Duroc swine1. J Anim Sci. (2005) 83:750–6. doi: 10.2527/2005.834750x
20. Smemo S, Tena JJ, Kim KH, Gamazon ER, Sakabe NJ, Gomez-Marin C, et al. Obesity-associated variants within FTO form long-range functional connections with IRX3. Nature. (2014) 507:371–5. doi: 10.1038/nature13138
21. Stine RR, Shapira SN, Lim H, Ishibashi J, Harms M, Won K, et al. EBF2 promotes the recruitment of beige adipocytes in white adipose tissue. Mol Metab. (2016) 5:57–65. doi: 10.1016/j.molmet.2015.11.001
22. Duarte DAS, Fortes MRS, Duarte MDS, Guimarães SEF, Verardo LL, Veroneze R, et al. Genome-wide association studies, meta-analyses and derived gene network for meat quality and carcass traits in pigs. Anim Prod Sci. (2018) 58:1100. doi: 10.1071/AN16018
23. Ma J, Yang J, Zhou L, Zhang Z, Ma H, Xie X, et al. Genome-wide association study of meat quality traits in a White DurocxErhualian F2 intercross and Chinese Sutai pigs. PLoS ONE. (2013) 8:e64047. doi: 10.1371/journal.pone.0064047
24. Hirose K, Mikawa S, Okumura N, Noguchi G, Fukawa K, Kanaya N, et al. Association of swine vertnin (VRTN) gene with production traits in Duroc pigs improved using a closed nucleus breeding system. Anim Sci J. (2013) 84:213–21. doi: 10.1111/j.1740-0929.2012.01066.x
25. Russo V, Fontanesi L, Scotti E, Beretti F, Davoli R, Nanni Costa L, et al. Single nucleotide polymorphisms in several porcine cathepsin genes are associated with growth, carcass, and production traits in Italian Large White pigs1. J Anim Sci. (2008) 86:3300–14. doi: 10.2527/jas.2008-0920
26. Petrus P, Fernandez TL, Kwon MM, Huang JL, Lei V, Safikhan NS, et al. Specific loss of adipocyte CD248 improves metabolic health via reduced white adipose tissue hypoxia, fibrosis and inflammation. Ebiomedicine. (2019) 44:489–501. doi: 10.1016/j.ebiom.2019.05.057
27. Davoli R, Luise D, Mingazzini V, Zambonelli P, Braglia S, Serra A, et al. Genome-wide study on intramuscular fat in Italian Large White pig breed using the PorcineSNP60 BeadChip. J Anim Breed Genet. (2016) 133:277–82. doi: 10.1111/jbg.12189
28. Luo W, Cheng D, Chen S, Wang L, Li Y, Ma X, et al. Genome-wide association analysis of meat quality traits in a porcine large white × minzhu intercross population. Int J Biol Sci. (2012) 8:580–95. doi: 10.7150/ijbs.3614
29. Weisz F, Bartenschlager H, Knoll A, Mileham A, Deeb N, Geldermann H, et al. Association analyses of porcine SERPINE1 reveal sex-specific effects on muscling, growth, fat accretion and meat quality. Anim Genet. (2012) 43:614–9. doi: 10.1111/j.1365-2052.2011.02295.x
30. Cho I, Park H, Ahn JS, Han S, Lee J, Lim H, et al. A functional regulatory variant of MYH3 influences muscle fiber-type composition and intramuscular fat content in pigs. PLoS Genet. (2019) 15:e1008279. doi: 10.1371/journal.pgen.1008279
31. Ross SE, Hemati N, Longo KA, Bennett CN, Lucas PC, Erickson RL, et al. Inhibition of adipogenesis by Wnt signaling. Science. (2000) 5481:950–3. doi: 10.1126/science.289.5481.950
32. Mojumdar K, Giordano C, Lemaire C, Liang F, Divangahi M, Qureshi ST, et al. Divergent impact of Toll-like receptor 2 deficiency on repair mechanisms in healthy muscle versus Duchenne muscular dystrophy. J Pathol. (2016) 239:10–22. doi: 10.1002/path.4689
33. Knopp P, Figeac N, Fortier M, Moyle L, Zammit PS. Pitx genes are redeployed in adult myogenesis where they can act to promote myogenic differentiation in muscle satellite cells. Dev Biol. (2013) 377:293–304. doi: 10.1016/j.ydbio.2013.02.011
34. Sabharwal R, Chapleau MW. Autonomic, locomotor and cardiac abnormalities in a mouse model of muscular dystrophy:targeting the renin-angiotensin system. Exp Physiol. (2014) 99:627–31. doi: 10.1113/expphysiol.2013.074336
35. Gokhin DS, Lewis RA, McKeown CR, Nowak RB, Kim NE, Littlefield RS, et al. Tropomodulin isoforms regulate thin filament pointed-end capping and skeletal muscle physiology. J Cell Biol. (2010) 189:95–109. doi: 10.1083/jcb.201001125
36. Joo Y, Kim H, Lee S, Lee S. Neuronal growth regulator 1-deficient mice show increased adiposity and decreased muscle mass. Int J Obesity. (2019) 43:1769–82. doi: 10.1038/s41366-019-0376-2
37. Shih HP, Gross MK, Kioussi C. Cranial muscle defects of Pitx2 mutants result from specification defects in the first branchial arch. Proc Natl Acad Sci USA. (2007) 104:5907–12. doi: 10.1073/pnas.0701122104
Keywords: Duroc, genetic difference, growth trait, FST, XP-EHH
Citation: Li D, Huang M, Zhuang Z, Ding R, Gu T, Hong L, Zheng E, Li Z, Cai G, Wu Z and Yang J (2021) Genomic Analyses Revealed the Genetic Difference and Potential Selection Genes of Growth Traits in Two Duroc Lines. Front. Vet. Sci. 8:725367. doi: 10.3389/fvets.2021.725367
Received: 15 June 2021; Accepted: 03 August 2021;
Published: 07 September 2021.
Edited by:
Hai Xiang, Foshan University, ChinaReviewed by:
Donghyun Shin, Jeonbuk National University, South KoreaSayed Haidar Abbas Raza, Northwest A and F University, China
Copyright © 2021 Li, Huang, Zhuang, Ding, Gu, Hong, Zheng, Li, Cai, Wu and Yang. This is an open-access article distributed under the terms of the Creative Commons Attribution License (CC BY). The use, distribution or reproduction in other forums is permitted, provided the original author(s) and the copyright owner(s) are credited and that the original publication in this journal is cited, in accordance with accepted academic practice. No use, distribution or reproduction is permitted which does not comply with these terms.
*Correspondence: Zhenfang Wu, d3pmZW1haWxAMTYzLmNvbQ==; Jie Yang, amlleWFuZzIwMTJAaG90bWFpbC5jb20=
†These authors have contributed equally to this work