
94% of researchers rate our articles as excellent or good
Learn more about the work of our research integrity team to safeguard the quality of each article we publish.
Find out more
ORIGINAL RESEARCH article
Front. Vet. Sci., 17 May 2021
Sec. Comparative and Clinical Medicine
Volume 8 - 2021 | https://doi.org/10.3389/fvets.2021.666838
This article is part of the Research TopicCanine Osteosarcoma as a Model in Comparative Oncology: Advances and PerspectiveView all 10 articles
 Cecilia Gola1*
 Diana Giannuzzi2
 Andrea Rinaldi3
 Selina Iussich1Paola Modesto4
 Emanuela Morello1
 Paolo Buracco1
 Luca Aresu1†
 Raffaella De Maria1†
Osteosarcoma (OSA) represents the most common primary bone tumor in dogs and is characterized by a highly aggressive behavior. Cell lines represent one of the most suitable and reproducible pre-clinical models, and therefore the knowledge of their molecular landscape is mandatory to investigate oncogenic mechanisms and drug response. The present study aims at determining variants, putative driver genes, and gene expression aberrations by integrating whole-exome and RNA sequencing. For this purpose, eight canine OSA cell lines and one matched pair of primary tumor and normal tissue were analyzed. Overall, cell lines revealed a mean tumor mutational burden of 9.6 mutations/Mb (range 3.9–16.8). Several known oncogenes and tumor suppressor genes, such as ALK, MYC, and MET, were prioritized as having a likely role in canine OSA. Mutations in eight genes, previously described as human OSA drivers and including TP53, PTCH1, MED12, and PI3KCA, were retrieved in our cell lines. When variants were cross-referenced with human OSA driver mutations, the E273K mutation of TP53 was identified in the Wall cell line and tumor sample. The transcriptome profiling detected two possible p53 inactivation mechanisms in the Wall cell line on the one hand, and in D17 and D22 on the other. Moreover, MET overexpression, potentially leading to MAPK/ERK pathway activation, was observed in D17 and D22 cell lines. In conclusion, our data provide the molecular characterization of a large number of canine OSA cell lines, allowing future investigations on potential therapeutic targets and associated biomarkers. Notably, the Wall cell line represents a valuable model to empower prospective in vitro studies both in human and in dogs, since the TP53 driver mutation was maintained during cell line establishment and was widely reported as a mutation hotspot in several human cancers.
Canine osteosarcoma (cOSA) represents the most common primary malignant bone tumor in dogs (1, 2) and is characterized by a natural history of disease and molecular abnormalities similar to human osteosarcoma (hOSA) (3, 4). cOSA is locally aggressive and highly metastatic (5), and despite significant improvements of surgical and chemotherapeutic treatments, most dogs perish within a year from the diagnosis (6), indicating a need for identification of specific tumor targets to develop novel treatment strategies. Recently, two whole-exome sequencing (WES) studies revealed that several pathways and driver genes, such as TP53, RB1, DLG2, PTEN, MYC, and MET, were equally mutated in both cOSA and its human counterpart (7, 8). Moreover, such genes have been previously identified as key players in cOSA pathogenesis (4, 9) and potential therapeutic targets (10–12). Two further studies characterized the genomic profile of several canine cancer cell lines, including cOSA cell lines, and investigated their relevance in comparative oncology (13, 14). Notably, driver mutations in MAPK/ERK and PI3K/AKT signaling pathways were identified in cOSA cell lines, and an anti-proliferative target inhibition using trametinib showed encouraging results, while alterations of the TP53 pathway were detected in non-sensitive cell lines (13).
These data highlight the importance of canine cancer cell lines as effective and reproducible pre-clinical models to provide crucial insights on pathogenetic mechanisms and drug response (14). Even though canine cancer cells have been used in oncologic research over decades, their mutational profiles were never investigated thoroughly (15–17). Consequently, a deep mutational analysis of such in vitro models will allow the identification of new targets and offer valuable tools in translational medicine (18, 19), considering that integration of genomic data with drug screening is fundamental for the development and pre-clinical evaluation of novel treatments that would equally benefit canine and human patients.
The purpose of the current study was to describe the mutational landscape and determine variants and putative driver genes as well as gene expression aberrations by an integrated analysis of whole-exome and RNA sequencing of eight cOSA cell lines and one matched pair of primary OSA and normal tissue.
Eight primary canine OSA cell lines and one matched pair of FFPE primary OSA and normal tissue were analyzed.
Penny, Wall, Desmond, Sky, Lord, and Pedro cell lines were previously established and validated by Maniscalco et al., while D17 (ATCC® CCL-183™) and D22 (ATCC® CRL-6250™) were obtained from American Type Culture Collection.
These were cultured in Dulbecco's modified Eagle's medium (DMEM; D17 and D22) and Iscove's standard medium, supplemented with 10% fetal bovine serum (FBS), 1% glutamine, 100 μg/mL penicillin, and 100 μg/mL streptomycin. Cells were cultured at 37°C in a humidified atmosphere of 5% CO2. The FFPE samples were obtained from the same OSA from which the Wall cell line was established.
Genomic DNA (gDNA) was isolated and purified from cell lines and the FFPE samples (Supplementary Table 1) using DNeasy Blood and Tissue kit (Qiagen, Hilden, Germany) and GeneRead DNA FFPE kit (Qiagen, Hilden, Germany), respectively. gDNA concentration was determined using the Qubit 2.0 Fluorometer (Thermo Fischer, Foster City, CA, USA). Total RNA was extracted from six cell lines (Penny, Wall, Desmond, Sky, D17, and D22; Supplementary Table 1) using QIAzol Lysis reagent (Qiagen, Hilden, Germany) and purified. The total RNA concentration was determined using the NanoDrop ND-1000 UV-Vis spectrophotometer, and its integrity was measured by the Bioanalyzer 2100 instrument (Agilent Technologies, Santa Clara, CA, USA). RNA samples with an RNA integrity number (RIN) ≥8 were considered for the RNA-seq library preparation.
The isolated DNA and RNA were stored at −20 and −80°C, respectively, until further use.
High-quality whole-genome libraries from 10 samples (eight cells lines and two FFPE samples) were prepared using the KAPA HyperPlus Library Preparation Kit (Roche Sequencing and Life Science, Wilmington, MA). Exome capture was executed using Roche's SeqCap EZ Share Prime Developer Kit (Roche Sequencing and Life Science, Wilmington, MA) for non-human genomes following the SeqCap EZ HyperCap Workflow User's Guide. Probes for the exome capture were designed on the target enrichment design of 150 megabases developed by Broeckx et al. (20). The developer's reagent (06684335001) was used in place of COT-1, and index-specific hybridization enhancing oligos were also used. The final concentration and size distribution were tested with the Bioanalyzer 2100 workstation (Agilent Technologies, Santa Clara, CA, USA). The libraries (fragments ranging from 300 to 400 bp) were then sequenced on an Illumina NovaSeq 6000 platform in a paired-end (150 PE) mode. The chosen target sequencing coverage was 200×. Non-normalized libraries for RNA sequencing experiments were prepared using NEBNext® Ultra™ II Directional RNA Library Prep (New England Biolabs) with Sample Purification Beads and NEBNext® Poly(A) mRNA Magnetic Isolation Module (New England Biolabs).
A single-end sequencing (75 SE) was carried out on a NextSeq 500 platform (Illumina Inc., San Diego, CA, USA).
Quality control prior to alignment was performed on output from Illumina software and was processed by FastQC v.0.11.9 (https://www.bioinformatics.babraham.ac.uk/projects/download.html) software. Trimmomatic was used to select high-quality reads and remove adapter sequences.
Filtered reads were mapped to the canine reference genome (CanFam3.1; Broad Institute, release 99) using BWA software (21). To verify coverage in the exonic regions, the resulting BAM files were manually inspected using Integrative Genomic Viewer (IGV) (22). Pre-processing for variant calling was performed following the Genome Analysis Toolkit (GATK) v.4.1 Best Practices (https://gatk.broadinstitute.org/hc/en-us/articles/360035894731-Somatic-short-variant-discovery-SNVs-Indels). Briefly, single-nucleotide variants (SNVs) and small insertion and deletions (indels) were identified with the GATK Mutect2 tool (23) and filtered for standard parameters of a min-alternate-count of 2, a min-alternate-frequency of 0.05, and a read depth > 10. To reduce germline artifacts, a panel of Normals (PON) was built using the GATK CreateSomaticPanelOfNormals tool by downloading public available WES data from 18 non-tumor-bearing and unrelated dogs (normal stroma and blood samples) from the NCBI SRA database (Supplementary Data 1) (13, 24). An additional filter was added to exclude known single-nucleotide polymorphisms as annotated in the dbSNP 146 using the Dog Genome SNP Database (http://dogsd.big.ac.cn/) (25). Distribution and functional consequences of variants were assessed using ANNOVAR. Additionally, missense mutations were categorized according to their pathogenicity using FidoSNP (26).
The detailed WES workflow applied to both canine OSA cell lines and the FPPE samples is summarized in Supplementary Figure 1.
All RNA-seq analyses were performed using conventional RNA-seq analysis tools (27). Detailed information is provided in Supplementary Figure 2. Briefly, post-alignment quality parameters of RNA-seq (insert length, gene-mapping bias, RNA junctions) were evaluated using RSeQC (28) in standard mode. Next, the counts of aligned reads per gene were obtained using htseq-count from the HTSeq (29) software package in single-stranded mode. Only reads that were uniquely aligned were retained. Finally, count filtering and normalization were performed using EdgeR R package (30).
Annotated variants were subjected to three filtering levels with increasing stringency and designated as follows (Figure 1 and Supplementary Data 2).
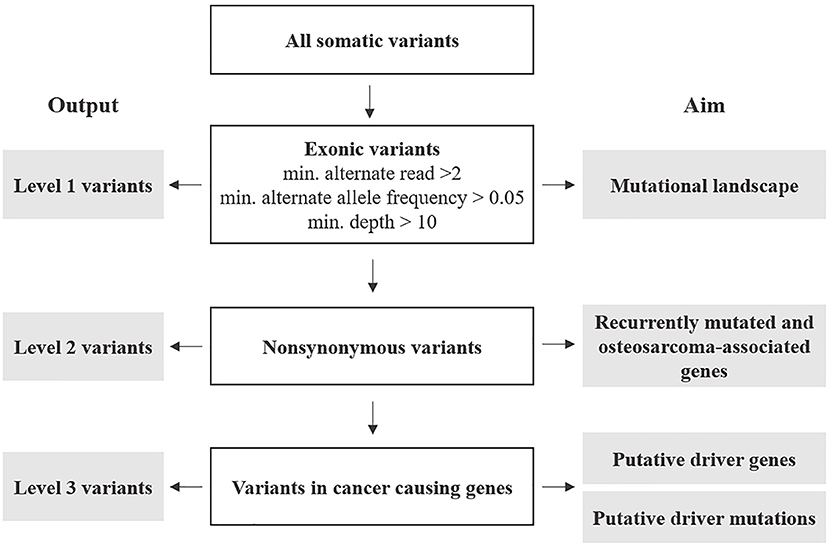
Figure 1. Post-processing of somatic variants: outline of selection criteria, categorization, and analyses.
Level 1: variants included the totality of exonic-only SNV and indels retrieved from the variant call described above. These were further filtered for number of reads (min. 2), alternate allele frequency (min. 0.05), and each variant's depth of coverage (min. 10). The resulting variants were analyzed to describe the mutational profile of cOSA cell lines.
Level 2: these were non-synonymous exonic variants selected from Level 1 to identify recurrently mutated genes having a likely role in cOSA pathogenesis. Furthermore, variants encoding for genes commonly mutated in human and canine OSA were also prioritized (Supplementary Data 3) (7). Level 3: these were selected from Level 2 protein-coding variants of genes listed in COSMIC Cancer Gene Census, (version 92, https://cancer.sanger.ac.uk/census) (31). 5′ UTR and splice site variants COSMIC-listed genes were also included in the analysis due to their potential impact on protein expression and function. These variants were also manually cross-checked against known oncogenic variants in hOSA available on the IntOgen platform (https://www.intogen.org/search?cancer=OS) (32) to identify putative driver mutations.
E273K mutation of TP53 identified in the Wall cell line and FFPE tumor sample was validated by Sanger dideoxy sequencing on Wall samples gDNA and Penny cell line (negative control). Briefly, two primers (sense 3′-ATGAGGGTGGCTAGGAGTCA-5′) and (antisense 5′-CAGTGCTGGGAAAGAGAGGA-3′) spanning the mutated region were designed by PRIMER3 Express software, and PCR on gDNA was performed using HotStar Taq (Qiagen) at 58°C (annealing temperature) for 35 cycles. After evaluation of agarose gel, amplification products were purified by QIAquick PCR Purification Kit (Qiagen).
DNA extracted from eight canine OSA cell lines underwent WES, and an average of 158 million reads per sample (range 143–164) was obtained.
The mean depth of reads mapping to the canine reference genome (CanFam3.1) was 187.7 (range 128–219), with over 99% of the targeted exome uniquely aligned. The optimal coverage was achieved for six out of eight cell lines. For each cell line, all reads passed the quality control (Phred quality score) ≥ 30. The FFPE samples (tumor and matched normal) achieved a mean depth of 54.71.
The median tumor mutational burden of all Level 1 somatic variants was 9.6 mutations/Mb (range 3.9–16.9); in the Wall FFPE sample, the mutational burden reached 17.7 mutations/Mb (Figure 2A). On average, 19.6% (range 13.3–26%) and 17.1% of Level 1 variants of canine OSA cell line and Wall FFPE sample, respectively, were annotated as synonymous and were consequently excluded from downstream analyses.
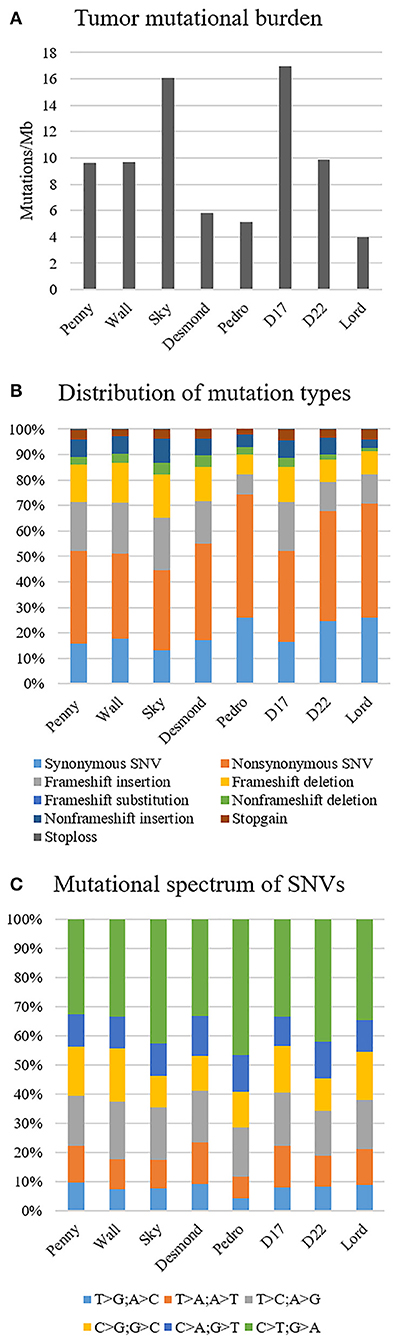
Figure 2. Mutational landscape of canine osteosarcoma cell lines, Level 1 variants. (A) Tumor mutational burden. (B) Distribution of mutation types. (C) Mutational spectrum of single-nucleotide variants.
In all our cell lines, missense mutations were the most frequently represented somatic coding mutation type, accounting for an average of 38.7% across all exonic variants. Frameshift insertion and deletions were 15.8 and 12.5% of the variants, respectively (Figure 2B). In Wall FFPE sample non-synonymous variants, frameshift and non-frameshift deletions were the most represented mutation types (36.3, 20.5, and 10.3%, respectively).
The most common base change identified in all samples was C > T transition (Figure 2C). The analysis of the WES data using Mutect2 revealed a total of 11,554 exonic variants (Level 1); 7,981 of these were identified as non-synonymous (Level 2) and encoded for 4,045 genes (Figure 3). The number of genes in each sample ranged from 318 (Lord) to 1,345 (D17) and reached the maximum of 1,533 genes in the Wall FFPE sample (Figure 4).
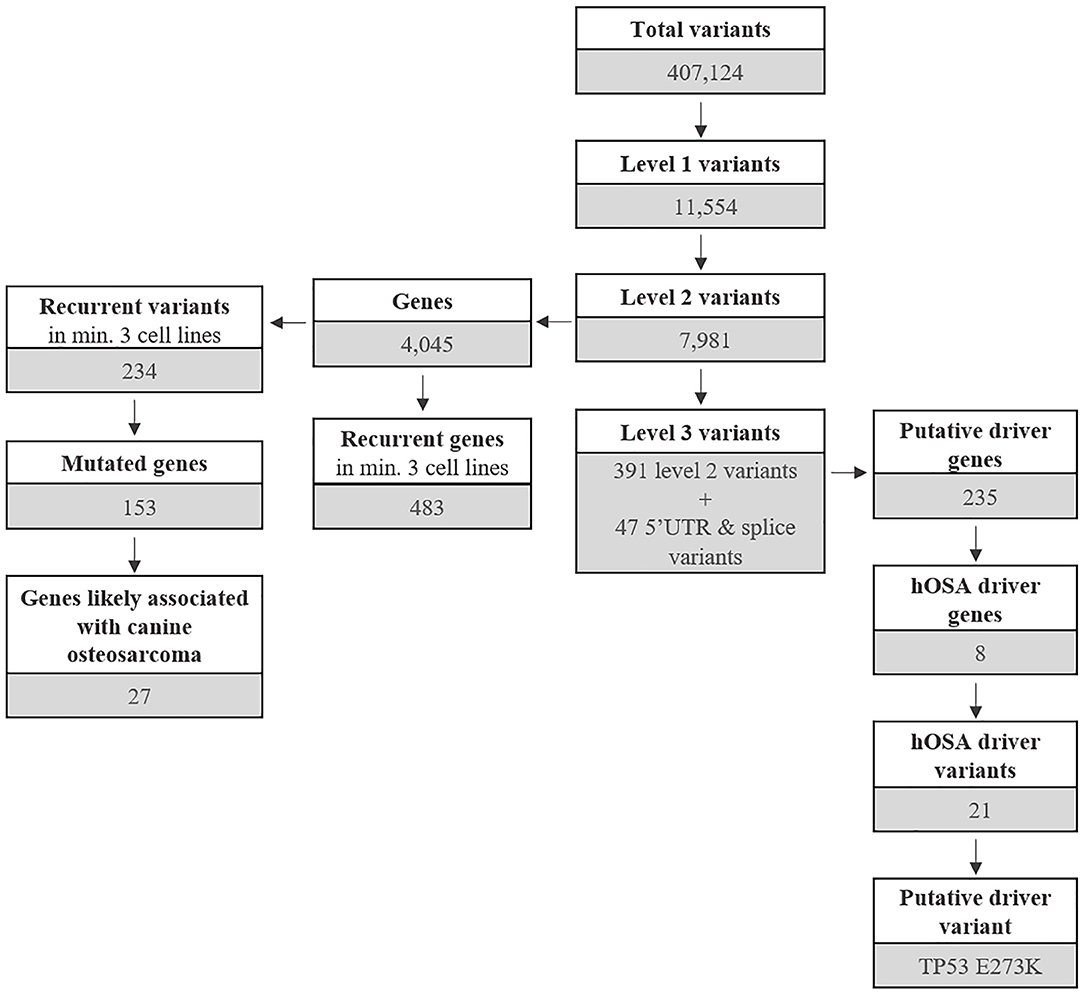
Figure 3. Outline of mutated genes and variants distributed across Level 1, 2, and 3 variants.
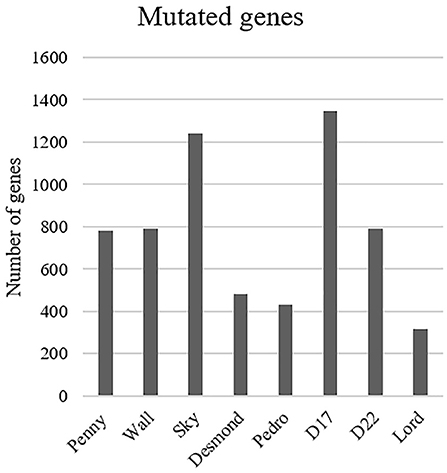
Figure 4. Distribution of the mutated genes across the cell lines.
Using the FidoSNP pathogenicity prediction tool, 50.5% (1,929/3,819 SNVs) of all missense point mutations were categorized as deleterious.
As mentioned above, 4,045 genes with 7,981 protein-modifying variants were identified (Supplementary Data 2). Overall, 483 genes were recurrently mutated in at least three cell lines. Taking into account the recurrent variants across all cell lines, a total of 234 variants were retrieved in three or more samples, and 51.4% of all SNVs (54/105) were categorized as pathogenic. When recurrent variants were collapsed to genes, 153 recurrently mutated genes were identified (Figure 3). In addition, genes were filtered using the list of osteosarcoma-associated genes retrieved from literature. Finally, a total of 27 genes likely implicated in OSA pathogenesis were identified across all our cell lines. Among them, PDGFRB, PTCH1, and WRN were retrieved in at least three cell lines, whereas oncogenes and tumor suppressor genes, such as TP53, ALK, MYC, and MET, were retrieved in only one cell line each (Figure 5).
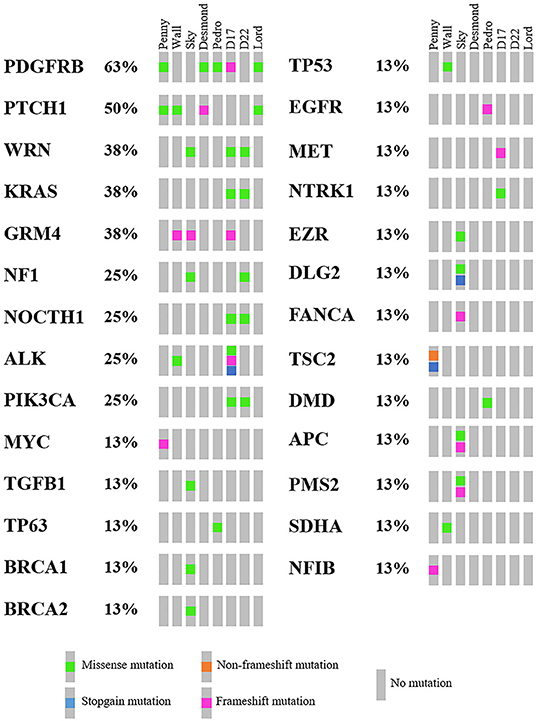
Figure 5. Oncoplot of genes likely involved in canine osteosarcoma pathogenesis retrieved in Level 2 analysis, including the mutational incidence and the mutational type across the cell line panel.
The number of genes ranged from two (Desmond and Lord) to 10 genes (Sky) (Supplementary Figure 3). Overall, these cancer genes were encoded by 51 variants, and 53.3% of all SNVs (16/30) were categorized as pathogenic.
Comparing these 27 genes to the top 20 most frequently mutated genes in human cancers (Cancer Genome Atlas; https://portal.gdc.cancer.gov/), four overlapping genes were identified, namely, PIK3CA, KRAS, APC, and NF1, which ranked 2nd, 6th, 10th, and 13th, respectively. At last, four genes were also identified in the Wall FFPE sample but did not overlap those of the corresponding cell line (Supplementary Table 2).
COSMIC Cancer Gene Census was used to identify candidate driver variants (Level 3) in known cancer-causing genes in humans.
Level 3 included 438 variants coding for 235 genes, regardless of their incidence across the cell line panel (Figure 3 and Supplementary Data 2). A total of 19 genes were uniquely encoded by 5′ UTR or splice variants.
Overall, 190 genes were indicated as having a relevant and documented activity that promotes oncogenic transformation. In particular, 28 were designated as fusion genes, 74 as tumor suppressors, and 63 as oncogenes, and 25 functioned as both. The distribution of putative driver mutations across all cell lines is depicted in Figure 6.
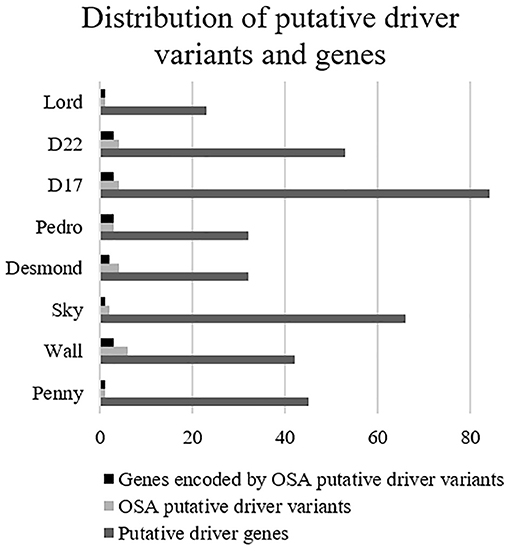
Figure 6. Distribution of putative driver variants and encoded genes across canine osteosarcoma cell lines.
About 88% of the SNVs encoding for these genes were categorized as pathogenic.
When compared to the top 20 cancer driver genes involved in human OSA (COSMIC Cancer Browser), eight genes, encoded by 21 variants, were retrieved in Level 3 genes (Table 1). Among these, well-known oncogenes and tumor suppressor genes, such as TP53, PTCH1, MED12, and PI3KCA, were identified.
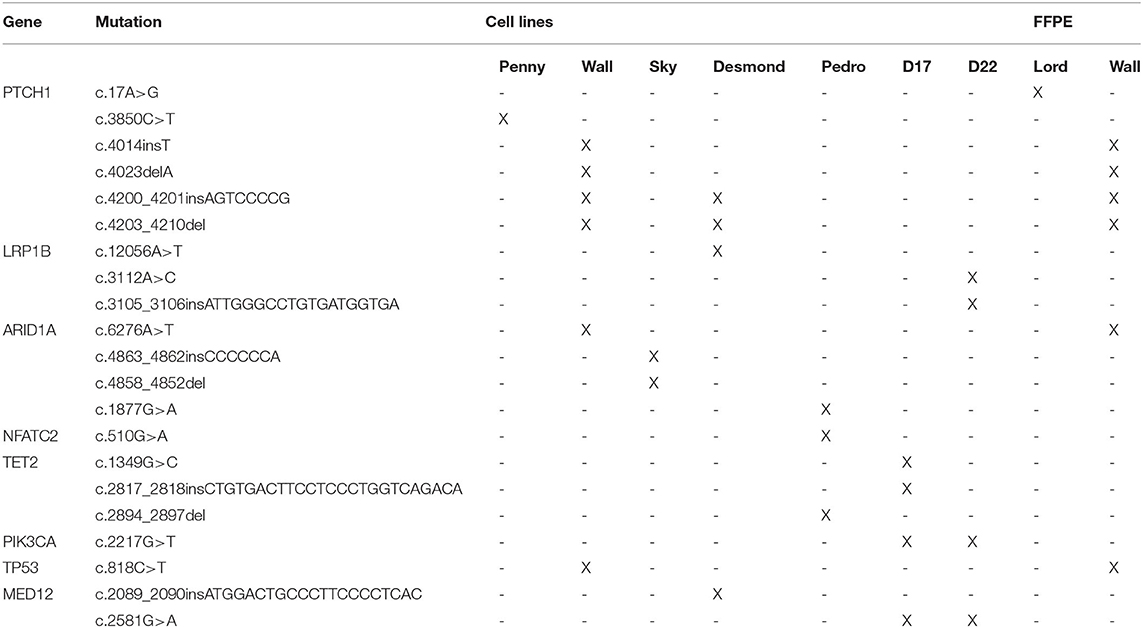
Table 1. List of putative driver genes and variants across all the cell lines.
All putative driver variants were cross-referenced with human OSA driver mutations available on IntOgen. Only the Wall cell line and FFPE tumor sample harbored a putative driver mutation, namely, the TP53E273K mutation (c.818C>T) corresponding to the human TP53E285K mutation hotspot.
This putative driver mutation was further validated in homozygosis in the Wall cell line and tumor sample by Sanger sequencing (Figure 7).
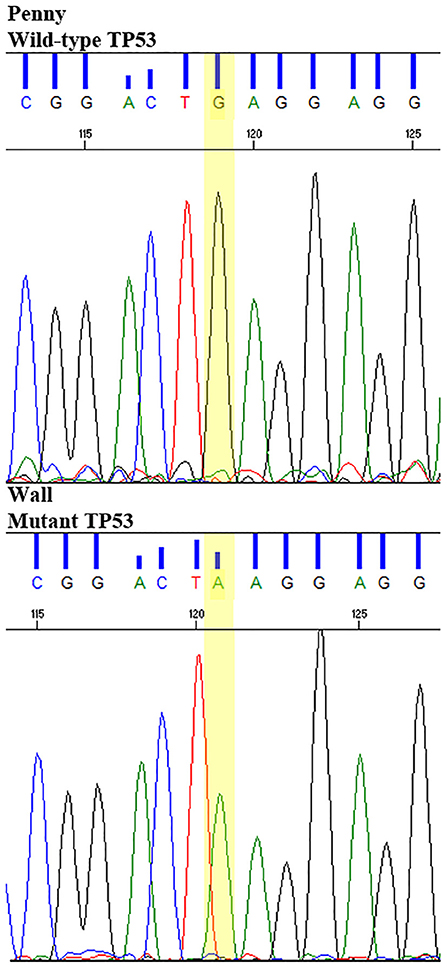
Figure 7. Sanger sequencing of TP53E273K mutation in the Wall cell line and primary FFPE tumor, compared to wild-type TP53 Penny cell line and the reference canine TP53 sequence.
RNA sequencing generated over 10 million reads per sample. Quality control and trimming procedures retained the vast majority of the sequences, and unique alignment to the canine reference genome was successful for 86% of the cleaned reads (Supplementary Table 3).
The normalized gene expression of the osteosarcoma-associated genes described above was then profiled within the same gene across all samples.
In particular, TP53 gene expression was increased in the Wall cell line, which harbored a hotspot mutation, as well as in D17 and D22, which retained a wild-type gene status. Interestingly, D17 and D22 showed a 9-fold and 5.5-fold increase of MDM2 and MDM4 transcript levels, respectively, compared to the other cell lines. Conversely, the MDM2 transcript level was decreased by 2 to 20 times in the Wall cell line compared to the rest of the cell lines.
Transcriptional upregulation of MET by 19-fold was observed in the D17 cell line, which harbored a frameshift insertion on this gene, and to the same extent in D22 which retained a wild-type gene status. Notably, genes involved in the downstream MAPK/ERK pathway, such as MAPK1, MEK, and MYC, showed increased transcript levels, although no mutations were detected in WES analysis.
Conversely, downstream signaling components of mutated cancer-associated genes, such as PTCH1, MED12, PDGFRB, and PIK3CA, did not show any transcript level change.
Cancer cell lines are considered valuable models in basic cancer research, drug discovery, and translational medicine (14, 33, 34).
The recent characterization of a large panel of human cancer cell lines with omics technologies has empowered data-driven precision medicine (34, 35). Despite the substantial number of studies, an analogous dataset modeling canine cancer cell lines is currently unavailable (14).
In the present study, we integrated data from whole-exome and RNA sequencing of eight cOSA cell lines to obtain genomic and molecular data recapitulating in vivo cOSA pathogenesis and identifying suitable targets for drug discovery. To date, this dataset represents one of the largest explored for a single tumor in dogs.
Specifically, two commercial and six primary cOSA cell lines established and validated in our laboratory were analyzed. The assorted cell lines were previously used in several studies to investigate cOSA pathogenetic mechanisms and response to therapies (11, 12, 14, 36–38). So far, only the D17 cell line has been characterized at the genomic level by Das et al. in 2019 (13).
About exome sequencing, variants were analyzed using three levels of increased stringency: first, describing the mutational profile of each cell line; second, identifying recurrently mutated genes; and third, unraveling putative driver genes having a likely role in cOSA pathogenesis.
Overall, the mutational burden in our cOSA cell lines ranged between 3.9 and 16.9 mutations/Mb but was lower than the one described by Das et al. (13). However, the diversity of the cell lines and the differences in library preparation kits, exome capture designs, and downstream stringency filters may have caused this discrepancy.
Consistent with previous reports in cOSA cell lines and hOSA, the mutational type distribution showed a prevalence of missense mutations, and C>T transitions dominated this mutational spectrum (13, 39).
Across genes identified in Level 2 analysis, the two tyrosine kinase receptors PDGFRB and MET were retrieved. Both genes are known to play an important role in the development and progression of many canine cancers and were thoroughly investigated in cOSA as well (4, 11, 36, 40).
In five cell lines, PDGFRB harbored both frameshift and missense mutations, but only Desmond showed an increased gene transcript level. Nevertheless, no overexpression of PDGFRB downstream signaling molecules was detected, suggesting that these mutations did not affect gene transcription in Desmond. Gardner et al. reported previously that PDGFRB loci are affected by copy number gains rather than point mutations; however, no correlation with gene expression was found (7). The MET oncogene was highly expressed in D17 and D22 cell lines but resulted to be mutated only in the D17 cell line. However, the frameshift insertion mutation was unlikely associated with overexpression, since several stop codons were retrieved in the transcript analysis. Nevertheless, MET is regulated by several mechanisms, including amplifications and epigenetic aberrations (41). In D17 and D22 cell lines, overexpression of MET downstream genes, including MAPK1 and MEK, was observed, suggesting a possible activation of the MAPK/ERK pathway (36, 42, 43).
The MYC gene was mutated in the Penny cell line only. However, increased transcript levels were identified in D17 and D22 cell lines and likely related to the aforementioned MET signaling. In hOSA cell lines, MYC overexpression promotes cell invasion via MAPK/ERK signaling and is correlated with a poor prognosis in vivo (44, 45). Such data are currently unavailable in cOSA, but aberrant activations of MYC and MAPK pathway genes have been reported (7, 13).
Mutations of TP53 in Wall and WRN in the Sky, D17, and D22 cell lines were also retrieved. In particular, the putative driver TP53E273K mutation was identified in the Wall cell line and tumor sample and further validated by Sanger sequencing. As most of the TP53 mutations, TP53E273K occurred in the mutational hotspot corresponding to the DNA-binding domain (46) and matched the human pathogenic hotspot mutation E285K (7). Both canine TP53E273K and its human equivalent were previously reported in cOSA and hOSA (7). According to the IARC TP53 database (47), this mutant allele is listed among the top 15 most common mutations in human cancers predicted to disrupt protein structure and function (48). In our experiment, the presence of this mutation in both Wall tumor tissue and the derived cell line demonstrates a genetic fidelity with the primary tumor that remained stable during cell line establishment (34, 49).
Looking at gene expression, the mutant TP53 transcript levels in Wall were twice as high as in Penny, Sky, and Desmond cell lines. This is in accordance with the literature where TP53 missense mutations are reported to moderately affect the transcription but produce a full-length protein with a scarce ability to bind specific DNA sequence motifs and activate downstream target genes (48, 50). Concurrently, MDM2, a well-known TP53 transcriptional target, showed a lower expression in Wall compared with the other wild-type TP53 cell lines. This data suggests that TP53 mutation in the Wall cell line might cause a loss of function rather than an altered mRNA expression (51). Overall, this indicates that TP53E273K is a likely pathogenic driver mutation providing a spontaneously inactivated TP53 in vitro model for specific biological and reactivation assays (52).
Remarkably, D17 and D22 cell lines showed an increase of the TP53 transcript compared to Wall, while retaining a wild-type gene status. In association, MDM2 and MDM4 transcript levels were increased, suggesting that TP53 function might be impaired by their oncogenic and deregulated inhibiting activity in these cell lines (53). In accordance with our findings, TP53 overexpression in D17 was also detected in a recent report by Modesto et al. (38).
Besides TP53, putative driver genes such as PTCH1, MED12, and PIK3CA were identified in Level 3 analysis. PTCH1 was mutated in four out of eight cell lines. Physiologically, Hh ligand binding to the Ptch1 receptor relieves its inhibitory effect on the canonical Hedgehog pathway, whose activation plays a role in both hOSA and cOSA (10, 54). Despite a low PTCH1 transcript level in these cell lines, no constitutive expression of Hedgehog pathway target genes was detected.
Similarly, MED12 and PIK3CA, which are known to contribute to hOSA initiation and progression via the Wnt and PI3K/Akt pathways (55, 56), did not show gene expression aberrations in the mutated cell lines, suggesting a biological irrelevant role in our cell lines.
Contrary to previous reports in dogs, no somatic mutations neither gene expression aberrations affecting CDKN2A and SETD2 were identified (7, 8). Regarding CDKN2A, it is generally affected by germline mutations and copy number variations, which were not investigated here (7, 8, 57), whereas SETD2 mutations were only recently identified in hOSA and cOSA, and their biological role remains to be elucidated (7, 8, 58).
In conclusion, these data provide valuable insights into the molecular mechanisms of a large number of cOSA cell lines, allowing future investigations of their functional implications and drug response. Since similarities were identified with hOSA, these cell lines may also represent excellent translational models. In future, the addition of new primary cOSA cell lines and the integration of new sequencing approaches, such as methylation analysis and single-cell RNA-seq, are needed to provide an accurate characterization of these models and explore the underlying oncogenic mechanisms.
The datasets presented in this study can be found in online repositories. The names of the repository/repositories and accession number(s) can be found here: https://www.ncbi.nlm.nih.gov/, PRJNA701141.
RD and LA contributed conception and design of the study. PB and EM enrolled the canine osteosarcoma cases used for cell line establishment. CG, PM, SI, and RD cultured the cell lines and extracted DNA and RNA from canine osteosarcoma cell lines and FFPE samples. AR performed the NGS sequencing. DG performed the computational analyses. CG performed data post-processing. CG and SI performed data visualization. CG and DG wrote the manuscript. RD edited the manuscript. All authors contributed to the article and approved the submitted version.
This research was funded by IZS PLV 11/17 RC.
The authors declare that the research was conducted in the absence of any commercial or financial relationships that could be construed as a potential conflict of interest.
The Supplementary Material for this article can be found online at: https://www.frontiersin.org/articles/10.3389/fvets.2021.666838/full#supplementary-material
Supplementary Figure 1. Workflow for whole-exome sequencing short variant discovery, sequential use of tools in evaluation of canine osteosarcoma cell lines and FFPE DNA samples.
Supplementary Figure 2. Workflow for RNA sequencing analysis, sequential use of tools in evaluation of canine osteosarcoma cell lines.
Supplementary Figure 3. (A) Distribution of recurrently mutated genes and variants across all the canine osteosarcoma cell lines. (B) Distribution of osteosarcoma-associated genes and corresponding variants across all the canine osteosarcoma cell lines.
Supplementary Table 1. NGS sequencing technologies applied in the analysis of eight canine osteosarcoma cell lines and one matched FFPE tumor sample.
Supplementary Table 2. Variants retrieved in genes likely involved in canine osteosarcoma pathogenesis (n = 27; Level 2 analysis) in Wall cell line and matching FFPE tumor sample.
Supplementary Table 3. RNA sequencing quality control, trimming and alignment data.
Supplementary Data 1. Panel of Normals: public available WES data from 18 non-tumor bearing and unrelated dogs (normal stroma and blood samples) from NCBI SRA database.
Supplementary Data 2. Whole-exome sequencing results of 8 canine osteosarcoma cell lines and one matched FFPE tumor sample: Level 1, Level 2, and Level 3 variants.
Supplementary Data 3. List of known osteosarcoma-associated gene in dogs and humans.
1. Morello E, Martano M, Buracco P. Biology, diagnosis and treatment of canine appendicular osteosarcoma: similarities and differences with human osteosarcoma. Vet J. (2011) 189:268–77. doi: 10.1016/j.tvjl.2010.08.014
2. Simpson S, Dunning MD, de Brot S, Grau-Roma L, Mongan NP, Rutland CS. Comparative review of human and canine osteosarcoma: morphology, epidemiology, prognosis, treatment and genetics. Acta Vet Scand. (2017) 59:71. doi: 10.1186/s13028-017-0341-9
3. Boerman I, Selvarajah GT, Nielen M, Kirpensteijn J. Prognostic factors in canine appendicular osteosarcoma—a meta-analysis. BMC Vet Res. (2012) 8:56. doi: 10.1186/1746-6148-8-56
4. Gustafson DL, Duval DL, Regan DP, Thamm DH. Canine sarcomas as a surrogate for the human disease. Pharmacol Ther. (2018) 188:80–96. doi: 10.1016/j.pharmthera.2018.01.012
5. Schott CR, Tatiersky LJ, Foster RA, Wood GA. Histologic grade does not predict outcome in dogs with appendicular osteosarcoma receiving the standard of care. Vet Pathol. (2018) 55:202–11. doi: 10.1177/0300985817747329
6. Guim TN, Bianchi MV, De Lorenzo C, Gouvêa AS, Gerardi DG, Driemeier D, et al. Relationship between clinicopathological features and prognosis in appendicular osteosarcoma in dogs. J Comp Pathol. (2020) 180:91–9. doi: 10.1016/j.jcpa.2020.09.003
7. Gardner HL, Sivaprakasam K, Briones N, Zismann V, Perdigones N, Drenner K, et al. Canine osteosarcoma genome sequencing identifies recurrent mutations in DMD and the histone methyltransferase gene SETD2. Commun Biol. (2019) 2:266. doi: 10.1038/s42003-019-0487-2
8. Sakthikumar S, Elvers I, Kim J, Arendt ML, Thomas R, Turner-Maier J, et al. SETD2 is recurrently mutated in whole-exome sequenced canine osteosarcoma. Cancer Res. (2018) 78:3421–31. doi: 10.1158/0008-5472.CAN-17-3558
9. Varshney J, Scott MC, Largaespada DA, Subramanian S. Understanding the osteosarcoma pathobiology: a comparative oncology approach. Vet Sci. (2016) 3:3. doi: 10.3390/vetsci3010003
10. Baldanza VE, Rogic A, Yan W, Levine CB, Levine RA, Miller AD, et al. Evaluation of canonical Hedgehog signaling pathway inhibition in canine osteosarcoma. PLoS ONE. (2020) 15:e0231762. doi: 10.1371/journal.pone.0231762
11. Maniscalco L, Iussich S, Morello E, Martano M, Biolatti B, Riondato F, et al. PDGFs and PDGFRs in canine osteosarcoma: new targets for innovative therapeutic strategies in comparative oncology. Vet J. (2013) 195:41–7. doi: 10.1016/j.tvjl.2012.05.003
12. Sánchez-Céspedes R, Accornero P, Miretti S, Martignani E, Gattino F, Maniscalco L, et al. In vitro and in vivo effects of toceranib phosphate on canine osteosarcoma cell lines and xenograft orthotopic models. Vet Comp Oncol. (2020) 18:117–27. doi: 10.1111/vco.12562
13. Das S, Idate R, Cronise KE, Gustafson DL, Duval DL. Identifying candidate druggable targets in canine cancer cell lines using whole-exome sequencing. Mol Cancer Ther. (2019) 18:1460–71. doi: 10.1158/1535-7163.MCT-18-1346
14. Fowles JS, Dailey DD, Gustafson DL, Thamm DH, Duval DL. The flint animal cancer center (FACC) canine tumour cell line panel: a resource for veterinary drug discovery, comparative oncology and translational medicine. Vet Comp Oncol. (2017) 15:481–92. doi: 10.1111/vco.12192
15. Barretina J, Caponigro G, Stransky N, Venkatesan K, Margolin AA, Kim S, et al. Addendum: the cancer cell line encyclopedia enables predictive modelling of anticancer drug sensitivity. Nature. (2019) 565:E5–6. doi: 10.1016/S0959-8049(12)70726-8
16. Sharma SV, Haber DA, Settleman J. Cell line-based platforms to evaluate the therapeutic efficacy of candidate anticancer agents. Nat Rev Cancer. (2010) 10:241–53. doi: 10.1038/nrc2820
17. Yang W, Soares J, Greninger P, Edelman EJ, Lightfoot H, Forbes S, et al. Genomics of drug sensitivity in cancer (GDSC): a resource for therapeutic biomarker discovery in cancer cells. Nucleic Acids Res. (2013) 41:D955–61. doi: 10.1093/nar/gks1111
18. Rowell JL, McCarthy DO, Alvarez CE. Dog models of naturally occurring cancer. Trends Mol Med. (2011) 17:380–8. doi: 10.1016/j.molmed.2011.02.004
19. Riccardo F, Aurisicchio L, Impellizeri JA, Cavallo F. The importance of comparative oncology in translational medicine. Cancer Immunol Immunother. (2015) 64:137–48. doi: 10.1007/s00262-014-1645-5
20. Broeckx BJ, Hitte C, Coopman F, Verhoeven GE, De Keulenaer S, De Meester E, et al. Improved canine exome designs, featuring ncRNAs and increased coverage of protein coding genes. Sci Rep. (2015) 5:12810. doi: 10.1038/srep12810
21. Li H, Durbin R. Fast and accurate short read alignment with Burrows-Wheeler transform. Bioinformatics. (2009) 25:1754–60. doi: 10.1093/bioinformatics/btp324
22. Robinson JT, Thorvaldsdóttir H, Wenger AM, Zehir A, Mesirov JP. Variant review with the integrative genomics viewer. Cancer Res. (2017) 77:e31–4. doi: 10.1158/0008-5472.CAN-17-0337
23. Benjamin D, Sato T, Cibulskis K, Getz G, Stewart C, Lichtenstein L. Calling somatic SNVs and indels with mutect. bioRxiv. (2019) 861054. doi: 10.1101/861054
24. Broeckx BJG, Derrien T, Mottier S, Wucher V, Cadieu E, Hédan B, et al. An exome sequencing based approach for genome-wide association studies in the dog. Sci Rep. (2017) 7:15680. doi: 10.1038/s41598-017-15947-9
25. Bai B, Zhao WM, Tang BX, Wang YQ, Wang L, Zhang Z, et al. DoGSD: the dog and wolf genome SNP database. Nucleic Acids Res. (2015) 43:D777–83. doi: 10.1093/nar/gku1174
26. Capriotti E, Montanucci L, Profiti G, Rossi I, Giannuzzi D, Aresu L, et al. Fido-SNP: the first webserver for scoring the impact of single nucleotide variants in the dog genome. Nucleic Acids Res. (2019) 47:W136–41. doi: 10.1093/nar/gkz420
27. Giannuzzi D, Giudice L, Marconato L, Ferraresso S, Giugno R, Bertoni F, et al. Integrated analysis of transcriptome, methylome and copy number aberrations data of marginal zone lymphoma and follicular lymphoma in dog. Vet Comp Oncol. (2020) 18:645–55. doi: 10.1111/vco.12588
28. Wang L, Wang S, Li W. RSeQC: quality control of RNA-seq experiments. Bioinformatics. (2012) 28:2184–5. doi: 10.1093/bioinformatics/bts356
29. Anders S, Pyl PT, Huber W. HTSeq–a Python framework to work with high-throughput sequencing data. Bioinformatics. (2015) 31:166–9. doi: 10.1093/bioinformatics/btu638
30. Robinson MD, McCarthy DJ, Smyth GK. edgeR: a Bioconductor package for differential expression analysis of digital gene expression data. Bioinformatics. (2010) 26:139–40. doi: 10.1093/bioinformatics/btp616
31. Tate JG, Bamford S, Jubb HC, Sondka Z, Beare DM, Bindal N, et al. COSMIC: the catalogue of somatic mutations in cancer. Nucleic Acids Res. (2019) 47:D941–7. doi: 10.1093/nar/gky1015
32. Martínez-Jiménez F, Muiños F, Sentís I, Deu-Pons J, Reyes-Salazar I, Arnedo-Pac C, et al. A compendium of mutational cancer driver genes. Nat Rev Cancer. (2020) 20:555–72. doi: 10.1038/s41568-020-0290-x
33. Li J, Zhao W, Akbani R, Liu W, Ju Z, Ling S, et al. Characterization of human cancer cell lines by reverse-phase protein arrays. Cancer Cell. (2017) 31:225–39. doi: 10.1016/j.ccell.2017.01.005
34. Mirabelli P, Coppola L, Salvatore M. Cancer cell lines are useful model systems for medical research. Cancers (Basel). (2019) 11:1098. doi: 10.3390/cancers11081098
35. Huang YH, Vakoc CR. A biomarker harvest from one thousand cancer cell lines. Cell. (2016) 166:536–7. doi: 10.1016/j.cell.2016.07.010
36. De Maria R, Miretti S, Iussich S, Olivero M, Morello E, Bertotti A, et al. met oncogene activation qualifies spontaneous canine osteosarcoma as a suitable pre-clinical model of human osteosarcoma. J Pathol. (2009) 218:399–408. doi: 10.1002/path.2549
37. Gola C, Iussich S, Noury S, Martano M, Gattino F, Morello E, et al. Clinical significance and in vitro cellular regulation of hypoxia mimicry on HIF-1α and downstream genes in canine appendicular osteosarcoma. Vet J. (2020) 264:105538. doi: 10.1016/j.tvjl.2020.105538
38. Modesto P, Fernandez JLC, Martini I, Zoccola R, Pugliano MC, Ciucis CG, et al. Characterization of D-17 canine osteosarcoma cell line and evaluation of its ability to response to infective stressor used as alternative anticancer therapy. Animals (Basel). (2020) 10:1981. doi: 10.3390/ani10111981
39. Lawrence MS, Stojanov P, Polak P, Kryukov GV, Cibulskis K, Sivachenko A, et al. Mutational heterogeneity in cancer and the search for new cancer-associated genes. Nature. (2013) 499:214–8. doi: 10.1038/nature12213
40. Takagi S, Takemoto A, Takami M, Oh-Hara T, Fujita N. Platelets promote osteosarcoma cell growth through activation of the platelet-derived growth factor receptor-Akt signaling axis. Cancer Sci. (2014) 105:983–8. doi: 10.1111/cas.12464
41. Zhang J, Babic A. Regulation of the MET oncogene: molecular mechanisms. Carcinogenesis. (2016) 37:345–55. doi: 10.1093/carcin/bgw015
42. Patanè S, Avnet S, Coltella N, Costa B, Sponza S, Olivero M, et al. MET overexpression turns human primary osteoblasts into osteosarcomas. Cancer Res. (2006) 66:4750–7. doi: 10.1158/0008-5472.CAN-05-4422
43. Zhang Y, Xia M, Jin K, Wang S, Wei H, Fan C, et al. Function of the c-Met receptor tyrosine kinase in carcinogenesis and associated therapeutic opportunities. Mol Cancer. (2018) 17:45. doi: 10.1186/s12943-018-0796-y
44. Feng W, Dean DC, Hornicek FJ, Spentzos D, Hoffman RM, Shi H, et al. Myc is a prognostic biomarker and potential therapeutic target in osteosarcoma. Ther Adv Med Oncol. (2020) 12:1758835920922055. doi: 10.1177/1758835920922055
45. Han G, Wang Y, Bi W. C-Myc overexpression promotes osteosarcoma cell invasion via activation of MEK-ERK pathway. Oncol Res. (2012) 20:149–56. doi: 10.3727/096504012X13522227232237
46. Olivier M, Hollstein M, Hainaut P. TP53 mutations in human cancers: origins, consequences, and clinical use. Cold Spring Harb Perspect Biol. (2010) 2:a001008. doi: 10.1101/cshperspect.a001008
47. Bouaoun L, Sonkin D, Ardin M, Hollstein M, Byrnes G, Zavadil J, et al. TP53 variations in human cancers: new lessons from the IARC TP53 database and genomics data. Hum Mutat. (2016) 37:865–76. doi: 10.1002/humu.23035
48. Baugh EH, Ke H, Levine AJ, Bonneau RA, Chan CS. Why are there hotspot mutations in the TP53 gene in human cancers? Cell Death Differ. (2018) 25:154–60. doi: 10.1038/cdd.2017.180
49. Goodspeed A, Heiser LM, Gray JW, Costello JC. Tumor-derived cell lines as molecular models of cancer pharmacogenomics. Mol Cancer Res. (2016) 14:3–13. doi: 10.1158/1541-7786.MCR-15-0189
50. Donehower LA, Soussi T, Korkut A, Liu Y, Schultz A, Cardenas M, et al. Integrated analysis of TP53 gene and pathway alterations in the cancer genome atlas. Cell Rep. (2019) 28:3010. doi: 10.1016/j.celrep.2019.08.061
51. Pfister NT, Prives C. Transcriptional regulation by wild-type and cancer-related mutant forms of p53. Cold Spring Harb Perspect Med. (2017) 7:a026054. doi: 10.1101/cshperspect.a026054
52. Duffy MJ, Synnott NC, Crown J. Mutant p53 as a target for cancer treatment. Eur J Cancer. (2017) 83:258–65. doi: 10.1016/j.ejca.2017.06.023
53. Wade M, Li YC, Wahl GM. MDM2, MDMX and p53 in oncogenesis and cancer therapy. Nat Rev Cancer. (2013) 13:83–96. doi: 10.1038/nrc3430
54. Czarnecka AM, Synoradzki K, Firlej W, Bartnik E, Sobczuk P, Fiedorowicz M, et al. Molecular biology of osteosarcoma. Cancers (Basel). (2020) 12:2130. doi: 10.3390/cancers12082130
55. Matsuoka K, Bakiri L, Wolff LI, Linder M, Mikels-Vigdal A, Patiño-García A, et al. Wnt signaling and Loxl2 promote aggressive osteosarcoma. Cell Res. (2020) 30:885–901. doi: 10.1038/s41422-020-0370-1
56. Zhang J, Yu XH, Yan YG, Wang C, Wang WJ. PI3K/Akt signaling in osteosarcoma. Clin Chim Acta. (2015) 444:182–92. doi: 10.1016/j.cca.2014.12.041
57. Morrow JJ, Khanna C. Osteosarcoma genetics and epigenetics: emerging biology and candidate therapies. Crit Rev Oncog. (2015) 20:173–97. doi: 10.1615/CritRevOncog.2015013713
Keywords: dog, osteosarcoma, cell line, next generation sequencing, whole-exome sequencing, RNA sequencing
Citation: Gola C, Giannuzzi D, Rinaldi A, Iussich S, Modesto P, Morello E, Buracco P, Aresu L and De Maria R (2021) Genomic and Transcriptomic Characterization of Canine Osteosarcoma Cell Lines: A Valuable Resource in Translational Medicine. Front. Vet. Sci. 8:666838. doi: 10.3389/fvets.2021.666838
Received: 11 February 2021; Accepted: 30 March 2021;
Published: 17 May 2021.
Edited by:
Pablo Martín-Vasallo, University of La Laguna, SpainReviewed by:
Fazul Nabi, Lasbela University of Agriculture, Water, and Marine Sciences, PakistanCopyright © 2021 Gola, Giannuzzi, Rinaldi, Iussich, Modesto, Morello, Buracco, Aresu and De Maria. This is an open-access article distributed under the terms of the Creative Commons Attribution License (CC BY). The use, distribution or reproduction in other forums is permitted, provided the original author(s) and the copyright owner(s) are credited and that the original publication in this journal is cited, in accordance with accepted academic practice. No use, distribution or reproduction is permitted which does not comply with these terms.
*Correspondence: Cecilia Gola, Y2VjaWxpYS5nb2xhQHVuaXRvLml0
†These authors have contributed equally to this work and share last authorship
Disclaimer: All claims expressed in this article are solely those of the authors and do not necessarily represent those of their affiliated organizations, or those of the publisher, the editors and the reviewers. Any product that may be evaluated in this article or claim that may be made by its manufacturer is not guaranteed or endorsed by the publisher.
Research integrity at Frontiers
Learn more about the work of our research integrity team to safeguard the quality of each article we publish.