 Kirsten E. McLoughlin1
 Carolina N. Correia1
 John A. Browne1
 David A. Magee1
 Nicolas C. Nalpas1†
 Kevin Rue-Albrecht1†Adam O. Whelan2†Bernardo Villarreal-Ramos2‡
 H. Martin Vordermeier2‡
 Eamonn Gormley3
 Stephen V. Gordon3,4
 David E. MacHugh1,4*
- 1Animal Genomics Laboratory, UCD School of Agriculture and Food Science, UCD College of Health and Agricultural Sciences, University College Dublin, Dublin, Ireland
- 2TB Immunology and Vaccinology Team, Department of Bacteriology, Animal and Plant Health Agency, Weybridge, United Kingdom
- 3UCD School of Veterinary Medicine, UCD College of Health and Agricultural Sciences, University College Dublin, Dublin, Ireland
- 4UCD Conway Institute of Biomolecular and Biomedical Research, University College Dublin, Dublin, Ireland
Bovine tuberculosis, caused by infection with members of the Mycobacterium tuberculosis complex, particularly Mycobacterium bovis, is a major endemic disease affecting cattle populations worldwide, despite the implementation of stringent surveillance and control programs in many countries. The development of high-throughput functional genomics technologies, including RNA sequencing, has enabled detailed analysis of the host transcriptome to M. bovis infection, particularly at the macrophage and peripheral blood level. In the present study, we have analysed the transcriptome of bovine whole peripheral blood samples collected at −1 week pre-infection and +1, +2, +6, +10, and +12 weeks post-infection time points. Differentially expressed genes were catalogued and evaluated at each post-infection time point relative to the −1 week pre-infection time point and used for the identification of putative candidate host transcriptional biomarkers for M. bovis infection. Differentially expressed gene sets were also used for examination of cellular pathways associated with the host response to M. bovis infection, construction of de novo gene interaction networks enriched for host differentially expressed genes, and time-series analyses to identify functionally important groups of genes displaying similar patterns of expression across the infection time course. A notable outcome of these analyses was identification of a 19-gene transcriptional biosignature of infection consisting of genes increased in expression across the time course from +1 week to +12 weeks post-infection.
Introduction
Bovine tuberculosis (BTB) is caused by Mycobacterium bovis and other intracellular bacterial pathogens of the Mycobacterium tuberculosis complex (MTBC), which display 99.9% DNA sequence identity at the genome level (1–3). Each member of the MTBC has a distinctive host spectrum, such that tuberculosis (TB) affects a wide range of mammals including humans (4). In addition, BTB has been classified as the fourth most important disease of livestock in terms of zoonotic and economic impact globally (5, 6). It has also been conservatively estimated that BTB costs $3 billion annually and imposes a large financial burden on farmers with infected herds (7, 8). Furthermore, as a zoonosis, M. bovis infection has important implications for human health; transmission from cattle to humans does occur and is responsible for a small but significant number of human TB cases, particularly in developing countries (9–11).
Tuberculous mycobacteria—primarily M. bovis and M. tuberculosis, the main cause of human TB—are generally inhaled from the environment within aerosol droplets and are phagocytosed by host alveolar macrophages (AMs); therefore, infection is normally initiated within, and restricted to, lung tissues (12–15). Tuberculous mycobacteria have evolved a wide range of mechanisms to modulate, suppress, and manipulate specific host immune mechanisms, including inhibition of phagosomal maturation, detoxification of reactive oxygen and nitrogen species (ROS and RNS), repair of ROS- and RNS-induced cellular damage, resistance to antimicrobial and cytokine defences, modulation of antigen presentation, and induction of cellular necrosis and inhibition of apoptosis (16–19). Tuberculous disease is characterised by lesions located at the site of infection, which are formed when AMs and other immune cells engage and eliminate most of the bacilli. The remaining intact mycobacterial cells are confined in granulomas that act to contain the infection, but may, under certain conditions, actually facilitate expansion and dissemination of mycobacteria to spread infection (20–22).
In Ireland, a test and slaughter policy for BTB was introduced in the early 1950s as part of the national BTB eradication scheme (23, 24). This policy includes compulsory screening of all animals using the single intradermal comparative tuberculin test alone or in conjunction with an in vitro enzyme-linked immunosorbent assay–based interferon γ (IFN-γ) release assay (IGRA) that increases the sensitivity of diagnosis (25). However, limitations of current diagnostic methods prevent early and accurate detection and subsequent removal of all infected animals from a herd, thereby contributing to the ongoing persistence of BTB, which continues to impact cattle production in Ireland, the United Kingdom, and other countries (24, 26). Therefore, the most important objective of an effective BTB control strategy—to identify and remove all infected cattle from a herd regardless of the stage of infection—is substantially hindered by current diagnostic technologies. Novel methods of BTB diagnosis are urgently required to augment current test procedures in conjunction with appropriate wildlife reservoir control measures (27).
In recent years, the availability of a well-annotated bovine genome sequence combined with high-throughput functional genomics technologies has provided an unprecedented opportunity to gain a deeper understanding of host–pathogen interaction, identify blood-derived RNA-based biomarkers, and develop new diagnostic methods for BTB caused by infection with M. bovis (28–33).
Previous transcriptomics studies of the host immune response to M. bovis have been performed using blood-derived RNA obtained from both naturally and experimentally infected animals, as it has been shown that host immune responses occurring in peripheral blood reflect those at the primary site of disease in BTB (34). In this regard, the dynamic transcriptome of circulating blood, which contains a large pool of “biosensors” in the form of RNA transcripts, can reflect physiological and pathological events occurring elsewhere in different tissues and organs, thereby providing a comprehensive overview of the status of the immune system (35, 36). In addition, peripheral blood has provided information on the pathobiology of many diseases; it is accessible and easily collected, making it ideally suited for the development of diagnostic biomarker tests based on transcriptional profiling (37–39).
For the experimental work described here, RNA sequencing (RNA-seq) was used to study the bovine whole peripheral blood transcriptome in response to infection with M. bovis across a large-scale 14-week animal infection time course. The main objectives of the study were to examine the host peripheral blood transcriptional responses across the early stages of M. bovis infection and identify differentially expressed (DE) genes across the infection time course that represent promising candidate biomarkers for BTB. In addition, we aimed to identify host canonical pathways and interaction networks enriched for DE genes, which may shed light on the immunobiology of M. bovis infection in cattle. We also used time-series analysis and Gene Ontology (GO) information to identify functionally important groups of DE genes across the infection time course.
Materials and Methods
Overview of Animal Infection Time Course Experiment
Animal resources for the present study were obtained from a 26-week vaccination and challenge experiment of age- and sex-matched cattle infected with M. bovis (40–44). Ten male age-matched Holstein–Friesian calves (4–6 months old) were sourced from farms known to be free of BTB disease. The animals used for the experimental work described here were the naive control group (non-vaccinated) for a vaccine efficacy study (40). Figure 1 shows the experimental schedule used by Dean et al. (40) and details the sampling time points for the 10 non-vaccinated control cattle used for the research work described here.
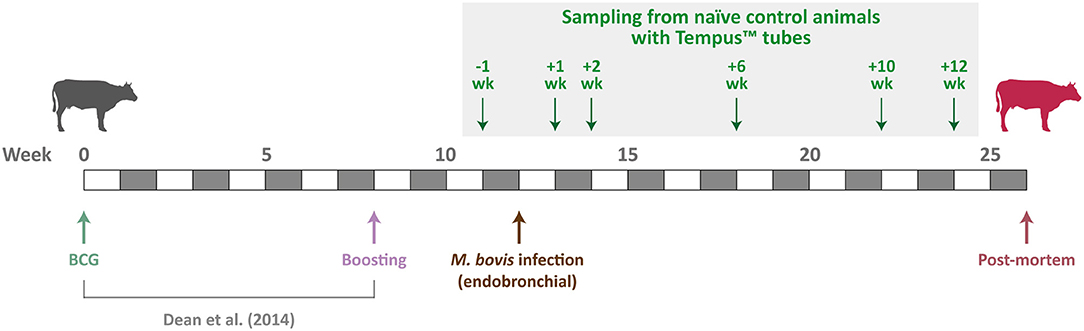
Figure 1. Schedule for the M. bovis infection time-course experiment. Sampling time points for the 10 non-vaccinated control cattle used are indicated by green arrows.
Inoculation With M. bovis Strain AF2122/97
The challenge strain, M. bovis AF2122/97 (2, 45), was delivered endobronchially at 2 × 10³ colony-forming units per animal using the following procedure described by Whelan et al. (46). Prior to endobronchial inoculation animals were sedated with Rompun® (Bayer Animal Health, Newbury, UK) according to the manufacturer's instructions. Following this, an LSVP 22 VGS89x14 endoscope (Veterinary Endoscopy Services, Welshpool, UK) lubricated with Vet-Lubigel (Millpledge Veterinary, Clarborough, UK) was inserted through a nostril into the trachea and placed above the bronchial opening to the cardiac lobe and the main bifurcation between left and right lobes. A cannula of 1.8-mm internal diameter (Veterinary Endoscopy Services) was inserted through the endoscope and used to deliver the M. bovis AF2122/97 inoculum in 2 mL of phosphate-buffered saline (PBS). Following this, an additional 2 mL of PBS was then used to wash the cannula, and the cannula and endoscope were withdrawn. For each individual animal, a new sterile cannula was used, the internal channel of the endoscope, through which the cannula was inserted, was rinsed with 20 mL of PBS, and the outside of the endoscope was cleaned thoroughly with sterilising tissue wipes (Medichem International, Sevenoaks, UK).
Individual responses to infection across the time course and disease pathology for the animals used in this study have been described in detail previously and include whole-blood IFN-γ assay, evaluation of peripheral blood mononuclear cell (PBMC) cytokine responses by intracellular cytokine staining, gross (visible) pathology and histopathology, and evaluation of bacterial load in lymph nodes (40, 41).
Peripheral Blood Collection and Total RNA Extraction
Approximately 3 mL of ex vivo peripheral blood was sampled from all 10 naive control animals at −1 week pre-infection and then at +1, +2, +6, +10, and +12 weeks post-infection (Figure 1). All blood samples were obtained during the morning (between 7:00 and 10:00 A.M.) of each collection day and directly collected into Tempus™ blood RNA tubes (Applied Biosystems®/Thermo Fisher Scientific, Warrington, UK). Immediately after blood collection at each time point, Tempus™ tube samples for each animal were vortexed for ~10 s to ensure complete red blood cell lysis. Tempus™ tube blood lysate samples for animals at each of the nine time points were then stored at −80°C until they were used for total RNA extraction and purification.
The Tempus™ Spin RNA Isolation Kit (Applied Biosystems®/Thermo Fisher Scientific) was used for total RNA extraction and purification using the following protocol provided by the manufacturer. Tempus™ tube blood lysate samples were thawed at room temperature prior to RNA extraction and purification. Once thawed, for each sample, ~3 mL of blood lysate was transferred to a 50-mL plastic centrifuge tube, and PBS was added to a final volume of 12 mL. Each sample was then mixed by vortexing for 30 s and then centrifuged at 3,000 × g for 30 min at 4°C. The supernatant was then removed, and the remaining RNA-containing pellet was resuspended with a brief vortex in 400 μL of the proprietary RNA Purification Resuspension Solution. Following this, the resuspended RNA sample was pipetted into the RNA purification filter inserted into a 1.5-mL microcentrifuge tube for waste collection. The RNA purification filter/microcentrifuge tube was then centrifuged at 16,000 × g for 30 s, and the liquid waste and microcentrifuge tube discarded. The RNA purification filter was then placed in a clean microcentrifuge tube, 500 μL of proprietary RNA Purification Wash Solution 1 was added, followed by another centrifugation step at 16,000 × g for 30 s and disposal of the liquid waste and microcentrifuge tube. This step was then repeated using 500 μL of proprietary RNA Purification Wash Solution 2 with a centrifugation step at 16,000 × g for 30 s. A final wash step was then performed with 500 μL of RNA Purification Wash Solution 2 and centrifugation at 16,000 × g for 30 s followed by disposal of the liquid waste and microcentrifuge tube. The RNA purification filter was then placed in a clean microcentrifuge tube and centrifuged at 16,000 × g for 30 s to dry the membrane. The RNA purification filter was then inserted into a clean RNase-free collection microcentrifuge tube and 100 μL of Nucleic Acid Purification Elution Solution was added and incubated for 2 min followed by centrifugation at 16,000 × g for 30 s; the RNA eluate was then pipetted back onto the filter membrane, and the centrifugation step was repeated. Approximately 90 μL of the final RNA eluate was then pipetted (avoiding particulate material) into a new labelled RNase-free collection microcentrifuge for long-term storage at −80°C.
RNA Quality Checking and Quantification
RNA quantity and quality checking were performed using a NanoDrop™ 1000 spectrophotometer (Thermo Fisher Scientific, Waltham, MA, USA) and an Agilent 2100 Bioanalyzer using an RNA 6000 Nano LabChip kit (Agilent Technologies, Cork, Ireland). The majority of samples displayed a 260/280 ratio >1.8 and RNA integrity numbers >8.0 (Supplementary Table 1 in Supplementary Material 1). RNA quality and quantity checking revealed that three samples did not have measurable quantities of RNA, and these were excluded from downstream RNA-seq library preparation (15, ID 6520, +2 weeks; 21, ID 6522, +2 weeks; and 27, ID 6526, + 2 weeks).
Strand-Specific RNA-Seq Library Preparation and Sequencing
For RNA-seq library preparation, 1 μg of total RNA from each sample was used to prepare individually barcoded strand-specific RNA-seq libraries. Two rounds of poly(A)+ RNA purification were performed for all RNA samples using the Dynabeads® mRNA DIRECT™ Micro Kit (Ambion®/Thermo Fisher Scientific, Austin, TX, USA) according to the manufacturer's instructions. The purified poly(A)+ RNA was then used to generate strand-specific RNA-seq libraries using the ScriptSeq™ v2 RNA-Seq Library Preparation Kit, the ScriptSeq™ Index PCR Primers (sets 1–4), and the FailSafe™ PCR enzyme system (all sourced from Epicentre®/Illumina® Inc., Madison, WI, USA) according to the manufacturer's instructions. RNA-seq libraries were purified using the Agencourt® AMPure® XP system (Beckman Coulter Genomics, Danvers, MA, USA) according to the manufacturer's instructions for double size selection (0.75 × followed by 1.0 × ratio). RNA-seq libraries were quantified using a Qubit® fluorometer and Qubit® dsDNA HS Assay Kit (Invitrogen™/Thermo Fisher Scientific, Carlsbad, CA, USA), whereas library quality cheques were performed using an Agilent 2100 Bioanalyzer and High Sensitivity DNA Kit (Agilent Technologies Ltd.). Individually barcoded RNA-seq libraries were pooled in equimolar quantities, and the quantity and quality of the final pooled libraries (three pools in total) were assessed as described previously. RNA-seq library sample barcode index sequences are detailed in Supplementary Table 1 (Supplementary Material 1).
Prior to high-throughput sequencing, the content of several RNA-seq libraries was validated using conventional Sanger dideoxy sequencing. Library inserts from 16 libraries were cloned using the Zero Blunt® TOPO® PCR Cloning Kit according to the manufacturer's instructions (Invitrogen™/Thermo Fisher Scientific). Sanger sequencing of 36 plasmid inserts from these selected libraries confirmed that the RNA-seq libraries contained inserts derived from bovine mRNA. Plasmid sequencing was outsourced (Source Bioscience Ltd., Dublin, Ireland), and sequences generated were validated using BLAST searching of the DNA sequence database (47). Cluster generation and high-throughput sequencing of the pooled RNA-seq libraries were performed using an Illumina® HiSeq™ 2000 Sequencing System at the MSU Research Technology Support Facility (RTSF) Genomics Core (https://rtsf.natsci.msu.edu/genomics; Michigan State University, MI, USA). Each of the three pooled libraries was sequenced independently on five lanes split across multiple Illumina® flow cells. The pooled libraries were sequenced as paired-end 2 × 100 nucleotide reads using Illumina® version 5.0 sequencing kits. Additionally, after exploratory data analysis (Supplementary Figures 1, 2), it was decided to remove animal ID 6522 completely from the analysis and proceed with 52 RNA-seq sample data sets (Supplementary Table 1 in Supplementary Material 1). All RNA-seq data generated for this study have been deposited in the European Nucleotide database with experiment series accession numbers (PRJEB27764 and PRJEB44470).
Bioinformatics Analyses of RNA-Seq Data
Except where indicated, bioinformatics procedures and analyses were performed on a 32-core Compute Server running Linux Ubuntu (version 12.04.2) hosted at the UCD Research IT Data Centre (stampede.ucd.ie) and administered by the UCD Animal Genomics Group. All of the bioinformatics workflow/pipeline components including Linux Bash, Perl, and R scripts used were deposited in a GitHub repository (https://github.com/kmcloughlin1/RNA-sequencing) and were modified from published methods described by our group (48). Supplementary Figure 3 shows a schematic of the complete RNA-seq bioinformatics workflow and the downstream tools used for time-series analysis and various systems biology methods.
Deconvolution (filtering and segregation of sequence reads based on the unique RNA-seq library barcode index sequences; Supplementary Table 1 in Supplementary Material 1) was performed by the MSU RTSF Genomics Core using a pipeline that simultaneously demultiplexed and converted pooled sequence reads to discrete FASTQ files for each RNA-seq sample with no barcode index mismatches permitted. The RNA-seq FASTQ sequence read data were then downloaded from the MSU RTSF Genomics Core FTP server, and a custom Perl script was used to filter out paired-end reads containing adapter sequence contamination (with up to three mismatches allowed) and to remove poor quality paired-end reads (i.e., one or both reads containing 25% of bases with a Phred quality score <20). The quality of individual RNA-seq sample library files was then reassessed postfiltering using the FastQC software package (version 0.10.1) (49).
Paired-end reads, from each filtered individual library, were aligned to the Bos taurus reference genome (UMD3.1.73) (50) using the STAR aligner software package (version 2.3.0) (51). For each library, raw counts for each gene based on the sense strand data were obtained using the featureCounts software from the Subread package (version 1.3.5-p4) (52). The featureCounts parameters were set to unambiguously assign uniquely aligned paired-end reads in a stranded manner to the exons of genes within the UMD3.1.73 B. taurus reference genome annotation. The gene count outputs were then used to perform differential gene expression analysis using the edgeR Bioconductor package (version 3.2.4) (53) within an R-based pipeline that was customised to perform the following functions:
1. Use biomaRt (54) to generate a detailed bovine gene annotation for downstream analyses, then filter out all bovine rRNA genes.
2. Filter out genes displaying expression levels below a minimal detection threshold of one count per million in at least n = 9 individual libraries (where n = smallest group of biological replicates).
3. Calculate normalisation factors for each library using the trimmed mean of M values method (55).
4. Identify DE genes between the pre-infection animal group (−1 week) and each of the post-infection animal groups (+1, +2, +6, +10, and +12 weeks) using a paired-sample approach with the edgeR package. Differential expression was evaluated by fitting a negative binomial generalised linear model for each gene.
5. Correct for multiple testing using the Benjamini–Hochberg method (56) with a false discovery rate (FDR) threshold of ≤ 0.05.
Systems Analyses of RNA-Seq Gene Expression Data
The Ingenuity® Pathway Analysis (IPA) software package (57) with the Ingenuity® Knowledge Base (Qiagen Corp., Redwood City, CA, USA; release date July 2014; www.ingenuity.com) was used to identify overrepresented (enriched) canonical pathways and construction of biological interaction networks for sets of DE genes at each post-infection time point (+1, +2, +6, +10, and +12 weeks) compared to the pre-infection time point (−1 week). For identification of overrepresented canonical pathways, a multiple testing correction (Benjamini–Hochberg method) was applied with an FDR threshold ≤ 0.05. The IPA Biomarker Filter tool was also used to identify and prioritise molecular biomarker candidates such that only experimentally observed and high-confidence predicted biological relationships were included. All the IPA data sources were used for three mammalian species in the IPA Knowledge Base (Homo sapiens, Mus musculus, Rattus norvegicus). Biological interaction networks were ranked according to Network Score values generated algorithmically by IPA and based on the hypergeometric distribution and calculated with the right-tailed Fisher exact test (58).
Time-Series Analysis of RNA-Seq Gene Expression Data
Time-series analysis of gene expression data from the animal infection time-course experiment was performed using the Short Time-series Expression Miner (STEM) software package (59). The computational procedure for selecting model profiles that are representative and distinct is described by Ernst et al. (60). The software package implements a method for clustering short time-series expression data that can differentiate between real and random patterns of temporal gene expression changes and assigns each gene to the model profile that most closely matches the temporal gene expression profile for that gene as determined by the correlation coefficient. A permutation test is then used to determine which model profiles have a statistically significant number of genes assigned compared to random expectations from the mean number assigned to each profile based on the permuted data (59). STEM also incorporates GO enrichment functionality for biological interpretation of time-series gene expression data.
Results and Discussion
RNA-Seq Summary Statistics
Deconvolution and filtering of sequence reads to remove adaptor-dimer contamination yielded a mean of 20.6 ± 2.0 million reads per individual barcoded RNA-seq sample library (n = 52 libraries and ± SD); this corresponded to a mean of 82% reads that passed this filtering step. These filtered reads were then aligned to the B. taurus UMD3.1.73 genome build. This yielded a mean of 15.4 ± 1.7 million filtered reads (91.5%) that uniquely mapped to this bovine genome build with a mean mapped length of 195.6 ± 0.6 bp; a mean of 0.77 ± 0.19 million reads (4.6%) that mapped to multiple genomic locations and 0.67 ± 0.17 million reads (3.9%) that did not map to any genomic location. Further analysis demonstrated that a mean of 63.1% of the filtered uniquely mapping reads (9.7 ± 1.1 million reads) were assigned to Ensembl gene IDs for the UMD3.1.73 genome build and 36.9% (5.7 ± 0.86 million reads) were ambiguous or could not be assigned to an annotated genomic region. Supplementary Table 2 (Supplementary Material 1) and Supplementary Figure 4 show the RNA-seq summary statistics. Filtering of the RNA-seq data using 52 samples (60 minus the three technical dropouts and the animal ID 6522 samples at −1, +1, +6, +10, and +12 weeks) produced 12,406 genes suitable for downstream differential expression analysis.
Multidimensional scaling plots (Supplementary Figure 5) demonstrated that it was not possible to differentiate the infected animals from non-infected animals during the early stages of the animal infection time course (+1 week post-infection vs. −1 week pre-infection, and +2 weeks vs. −1 week pre-infection). Conversely, discrimination of infected and non-infected animals was partially observed at +6 weeks post-infection and was clearly evident at +10 weeks post-infection, but this pattern of discrimination effectively disappeared by +12 weeks post-infection. Previous work by our group has shown that microarray and RNA-seq gene expression data sets from peripheral blood leukocytes (PBLs) can be used to unambiguously discriminate M. bovis–infected from non-infected control cattle (28, 31). However, it is important to note that the M. bovis–infected animals used for these earlier studies were heavily infected animals, which were maintained for ongoing disease surveillance and potency testing of diagnostic reagents.
Differentiation of M. bovis–Infected and Non-infected Control Groups: Toward the Development of Transcriptomics-Based Biomarkers
The concept and the implications regarding biomarker identification and biosignature development for infectious disease have been explored thoroughly by Chaussabel et al. (36, 61, 62). In particular, these researchers emphasise that leukocytes present in peripheral blood convey valuable information about the status of the immune system that can be translated to biomarkers and onward to sensitive and specific biosignatures of infection. In addition, peripheral blood is easily accessible and can be stabilised and processed for high-throughput transcriptomics analyses using RNA-seq and other massively parallel gene expression technologies such as microarrays. It is also notable that development of transcriptional biomarkers in cattle is relatively straightforward because very low levels of globin gene transcripts (HBA and HBB) are observed in bovine peripheral blood compared to other mammalian species (63, 64).
Statistical analysis of the RNA-seq gene expression data with a B-H FDR adjusted P ≤ 0.05 demonstrated that differential gene expression was evident between each of the five post-infection time points (+1, +2, +6, +10, and +12 weeks) and the −1 week pre-infection time point (Figure 2A). Relatively small numbers of DE genes were detected at +1 week (37 exhibited increased and 20 exhibited decreased expression) and +2 weeks (83 increased and 10 decreased); however, the numbers of DE genes were substantially greater at +6 weeks (415 increased and 272 decreased), +10 weeks (1,278 increased and 1,305 decreased), and +12 weeks (222 increased and 116 decreased). Supplementary Tables 3–7 (Supplementary Material 2) provide detailed information on the differential expression analysis results at each of the five post-infection time points relative to the −1 week pre-infection time point for the complete set of 12,406 filtered genes. Figure 2B also shows a Venn diagram for the significant DE genes at each of the five post-infection time points (relative to the −1 week pre-infection control time point). In addition, Table 1 provides detailed information for 19 genes shown in Figure 3 that were significantly DE across all the five post-infection time points compared to the −1 week pre-infection control time point.
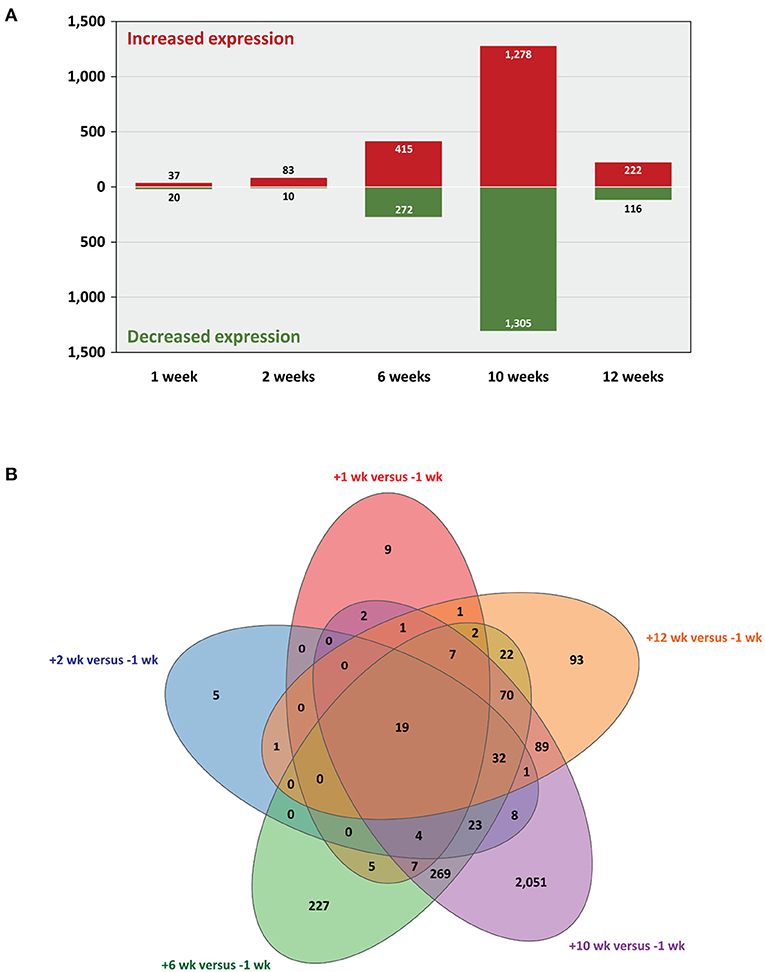
Figure 2. Statistically significant differentially expressed genes. Five post-infection time points are shown relative to the −1 week pre-infection time point (B-H FDR adjusted P ≤ 0.05). (A) Bar graph showing numbers of genes with increased and decreased expression and (B) Venn diagram showing the overlaps of DE genes for every multiple-time-point comparison.
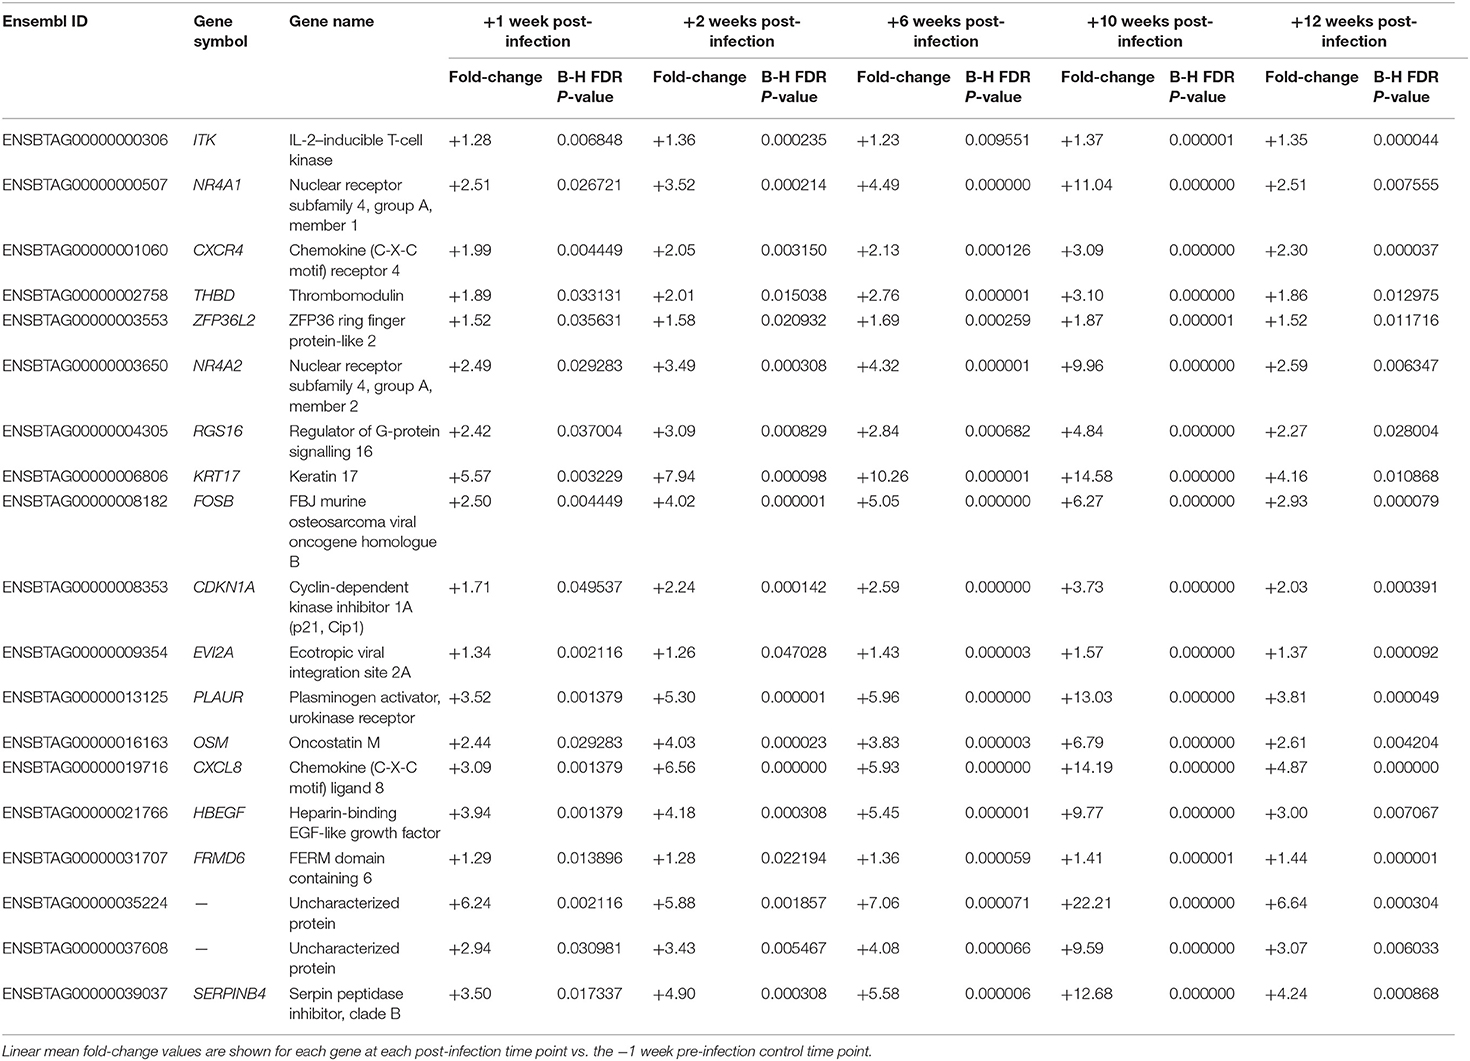
Table 1. Nineteen genes that exhibited statistically significant differential expression for each of the five post-infection time points vs. the −1 week pre-infection control time point.
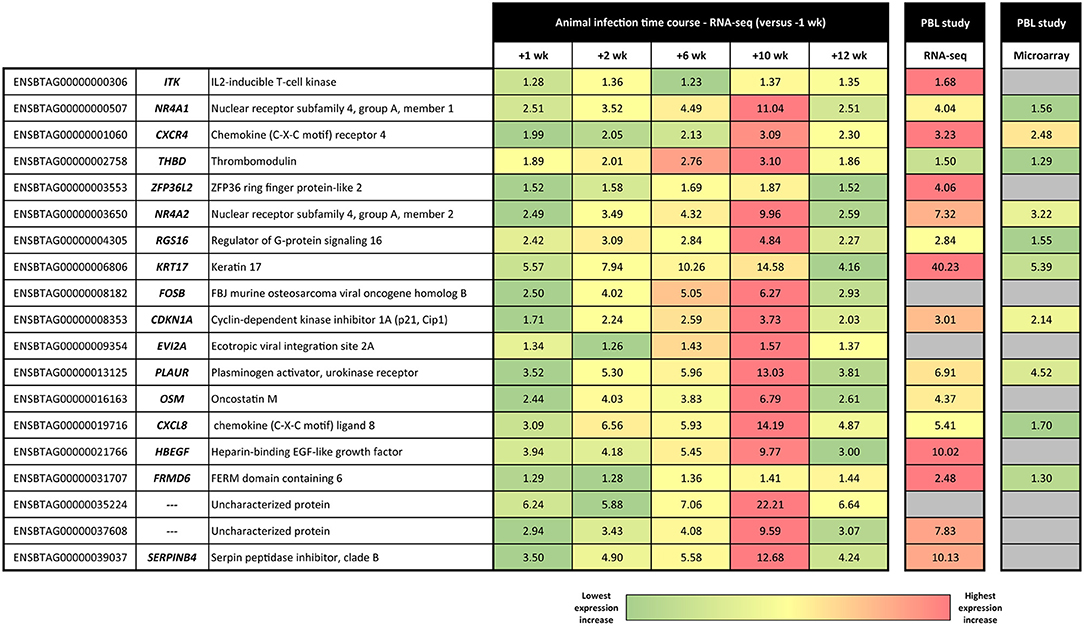
Figure 3. Heat map showing linear fold-change values for the panel of 19 consistently DE genes across the M. bovis infection course. Linear fold-change values for the post-infection time points are shown relative to the −1 week pre-infection time point. Also shown are the equivalent results obtained using RNA-seq and Affymetrix® GeneChip® Bovine Genome Array technologies by McLoughlin et al. (31).
As shown in Figure 3, there is a striking concordance between the patterns of expression for these 19 genes across the infection time course and earlier PBL microarray and RNA-seq studies published by our group (28, 31). These results provide good support for the hypothesis that a biosignature of M. bovis infection can be generated using transcriptomics data from cattle with early- and later-stage BTB. It also provides evidence that putative transcriptional biomarkers, identified using an experimental challenge with a relatively high M. bovis infectious dose, can be translated as diagnostic tools for use in naturally infected animals. Diagnostic biosignature development focusing on smaller panels of transcriptomics-based biomarkers has been used with notable success for human TB. In this case, research work has focused on specificity and differentiating active TB from latent TB and also TB disease from non-infected controls and diseases with similar pathology but distinct aetiology such as sarcoidosis, pneumonia, and lung cancer (35, 39, 65–71).
Previous work on M. tuberculosis and human immunodeficiency virus infection in humans has shown that CXCR4 is upregulated in blood monocytes and bronchoalveolar lavage cells from human patients with pulmonary TB (72–74). In addition, a loss-of-function mutation in the murine Thbd gene that impairs activated protein C production results in uncontrolled lung inflammation in mice infected with M. tuberculosis, highlighting the importance of the THBD gene in mammalian TB disease (75). Galietti et al. have also shown that M. tuberculosis– and M. bovis–infected, but not M. avium–infected, human monocytes showed increased expression of the CDKN1A protein encoded by CDKN1A (76). A range of studies have shown that levels of the protein product of the PLAUR gene are elevated in serum from human patients infected with M. tuberculosis (77–81). Increased expression of the OSM gene and induction of matrix metalloproteinases, which contribute to tissue damage characteristic of TB, have been demonstrated in M. tuberculosis–infected human monocytes (82). High expression of OSM was also observed in the blood transcriptome of patients presenting with high mycobacterial load sputum (83). In addition, the OSM gene is located within a candidate QTL region for TB susceptibility identified using admixture mapping in humans (84).
Ten of the 19 genes that showed consistently increased expression across all post-infection time points were observed to overlap with results from RNA-seq of an in vitro infection time-course experiment using bovine AMs stimulated with M. bovis (48). FOSB and NR4A1 were upregulated in AMs at 2 hpi; CXCL8, NR4A1, PLAUR, and RGS16 were upregulated at 6 hpi; EVI2A, CXCL8, FOSB, HBEGF, OSM, PLAUR, RGS16, and THBD were upregulated at 24 hpi; the eight genes observed at 24 hpi plus the CDKN1A gene were also upregulated at 48 hpi.
One of the most notable putative transcriptional biomarkers represented in the panel of 19 genes and in the independent PBL studies is CXCL8 (previously known as IL8). CXCL8 is a chemokine encoded by the CXCL8 gene, which is a strong neutrophil chemoattractant and also chemotactic for monocytes and T cells (85, 86); it has been observed to exhibit increased expression for different mycobacterial infections in a range of mammalian systems (87–95). CXCL8 enhances killing of mycobacteria by neutrophils and macrophages (96, 97), and these immune cells also secrete CXCL8 when stimulated by M. tuberculosis (98). In this regard, Godaly and Young showed that M. bovis bacillus Calmette–Guérin (BCG) induces CXCL8 secretion by human neutrophils via MyD88-dependent signalling through TLR2 and TLR4 (99). Also, stimulation of human lung fibroblasts in vitro using conditioned medium from M. tuberculosis–infected monocytes caused prolonged expression of CXCL8 mRNA and >10-fold increase in CXCL8 secretion (88).
With regard to the CXCL8 mRNA transcript as a biomarker of infection, Alessandri et al. were able to detect significantly elevated levels of the CXCL8 cytokine in plasma from patients with pulmonary TB (87). More recently, based on reversion of IGRA test results in a Chinese cohort, it has been proposed that decreased serum levels of CXCL8 are associated with clearance of M. tuberculosis infection (100). In addition, using microarray and reverse transcriptase–qualitative polymerase chain reaction technologies, Widdison et al. have shown that M. tuberculosis– and M. bovis–infected bovine AMs express high levels of CXCL8 transcripts compared to non-infected control cells (90). In support of this, using RNA-seq, we have shown that CXCL8 increases in expression in bovine AMs infected with either M. tuberculosis or M. bovis across a 48-h time course (101). CXCL8 has also been shown to be significantly increased in expression after in vitro PPD-b stimulation of PBMCs from cattle infected with M. bovis (102) and bovine monocyte-derived macrophages (103). CXCL8 also exhibited increased expression in PBL (28) but decreased expression in non-stimulated PBMCs from M. bovis–infected cattle (104). Also, Almeida de Souza et al. have shown that antimycobacterial treatment reduces high plasma levels of CXCL8 and other CXC chemokines detected in plasma from human patients with active TB (91), and Huang et al. have also demonstrated that AMs and PBMCs from TB patients express CXCL8 at significantly higher levels than healthy controls (94). Interestingly, the potential specificity of increased CXCL8 gene expression as a biomarker for M. bovis infection in cattle is illustrated by recent results obtained by Alonso-Hearn et al. (105). Using similar RNA-seq methodology, they observed significantly decreased expression of CXCL8 in peripheral blood from cattle infected with M. avium subsp. paratuberculosis, the causative agent of Johne disease. Finally, it is important to note that several primary studies and meta-analyses have provided evidence that a single-nucleotide polymorphism (rs4073) at the human CXCL8 gene locus is associated with resistance/susceptibility to M. tuberculosis infection (106–109).
Functional Biology of Peripheral Blood Gene Expression Across the Infection Time Course
Of the 12,406 genes (50.40% of total B. taurus reference genes) that were suitable for differential expression analysis, 10,703 genes (86.27%) were mapped to molecules in the IPA Knowledge Base. IPA was used to identify overrepresented canonical pathways and construct biological interaction networks for sets of DE genes at each post-infection time point (+1, +2, +6, +10, and +12 weeks) compared to the pre-infection control time point (−1 week). Only DE genes that were significant after a multiple testing correction was applied (Benjamini–Hochberg method, FDR threshold ≤ 0.05) were used. The gene expression data for the panel of 19 genes (Table 1) were also analysed using IPA and to identify enriched canonical pathways and biological interaction networks. However, these analyses did not reveal any notable functionally relevant pathways or networks (results not shown).
+1 Week Post-infection Time Point
Forty-eight of the 57 DE genes detected between sample groups at +1 week post-infection and −1 week pre-infection were mapped to the IPA Knowledge Base (84.21%); however, no statistically significant canonical pathways were detected for this gene expression contrast. Four biological interaction networks were generated from this 57-DE-gene set using the IPA Knowledge Base. Supplementary Figure 6 shows the highest-ranked network, which is associated with embryonic development, organismal development, and reproductive system development and function, and has the ubiquitin C protein encoded by the UBC gene as a central hub.
+2 Weeks Post-infection Time Point
Eighty-one of the 93 DE genes detected between sample groups at +2 weeks post-infection and −1 week pre-infection were mapped to the IPA Knowledge Base (87.10%). Supplementary Table 8 (Supplementary Material 3) details the overrepresented IPA canonical pathways for this DE gene set. The top-ranked canonical pathway at +2 weeks post-infection was the Glucocorticoid Receptor Signalling pathway with eight genes displaying increased expression (CDKN1A, CXCL8, DUSP1, FOS, IL10, PLAUR, PTGS2, and SGK1) out of a total of 275 members of this pathway (P = 1.05 × 10⁻⁵). The main effects of glucocorticoid steroid hormones signalling through the cytosolic nuclear receptor subfamily 3, group C, member 1 (glucocorticoid receptor) (NR3C1) protein on the immune system are to upregulate expression of anti-inflammatory genes and downregulate expression of proinflammatory genes (110, 111). Therefore, glucocorticoid receptor signalling activity evident in the peripheral blood transcriptome during the early stages of M. bovis infection may reflect perturbation of homeostasis (112) and possible modulation of host cellular mechanisms at the site of infection in the lungs.
Nine biological interaction networks were generated from this 81-DE-gene set using the IPA Knowledge Base. Figure 4 shows the highest-ranked network, which was centred on increased expression of the IL10, CXCL2, CXCR4, and CXCR2 genes with Cellular Movement, Haematological System Development and Function, and Immune Cell Trafficking as the top IPA disease and function categories. In this regard, IL-10, an inhibitory and anti-inflammatory pleiotropic cytokine with a major role in suppression of macrophage and dendritic cell functions, has been hypothesised as a target for modulation and manipulation by mycobacterial pathogens (113, 114). Also, IL-10 is linked to chronic mycobacterial infection in the mouse model (115–117). It has been shown that mycobacterial RNA induces IL-10 production in infected cells through TLR3-mediated activation of the PI3K/AKT signalling pathway (118) and that M. tuberculosis infection of THP-1 cells induces IL10 expression through perturbation of the histone deacetylases HDAC6 and HDAC11 (119). In addition, it has been observed that increased levels of IL-10 cytokine in TB patients lead to impaired T-cell function, thereby contributing to an inefficient host immune response (120).
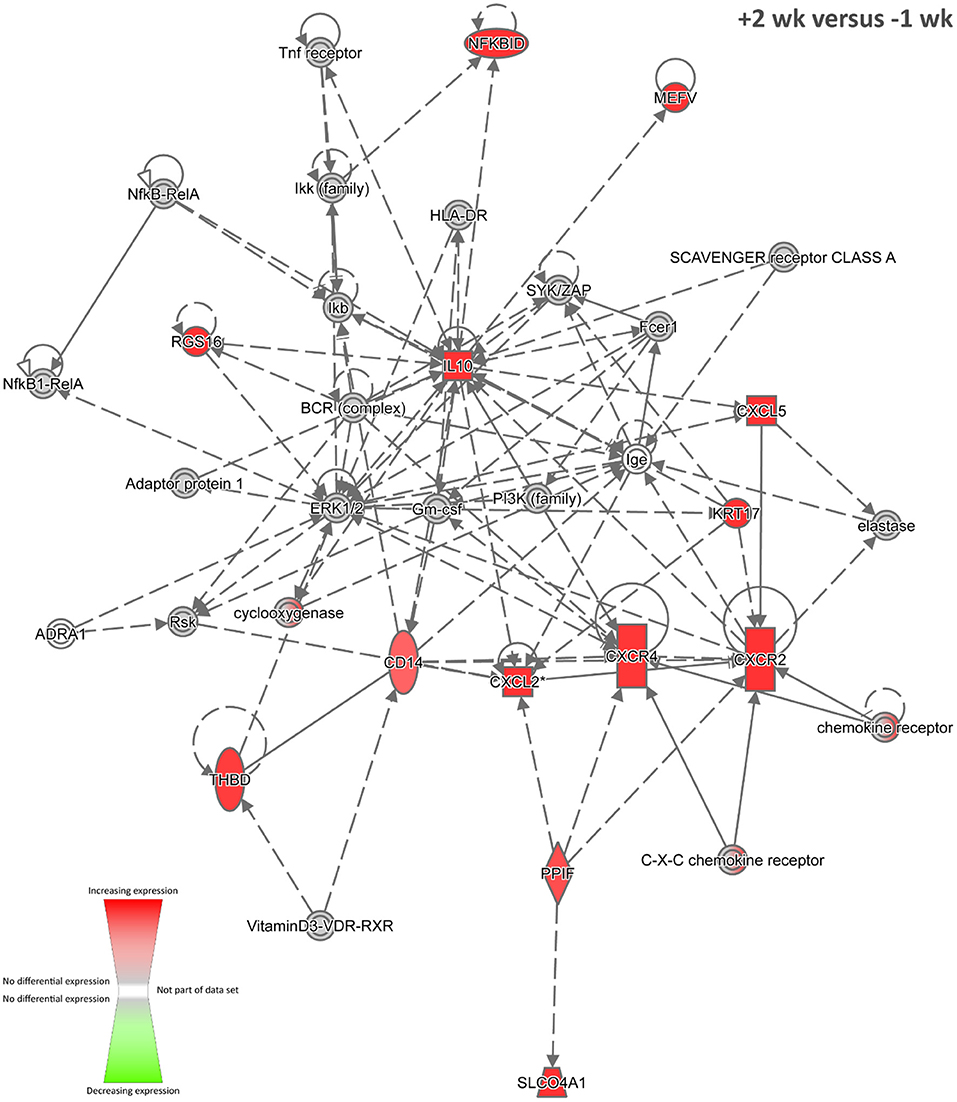
Figure 4. The top-ranked biological interaction network generated using IPA for +2 weeks post-infection. Differential gene expression is represented with a red–green colour scale. This network consisted of 13 focus molecules (IPA Network Score = 24), and the top IPA Disease and Function categories represented were Cellular Movement, Haematological System Development and Function, and Immune Cell Trafficking. A detailed legend for IPA biological interaction networks including a key for node shapes and edge classifications is available at the following link: https://qiagen.secure.force.com/KnowledgeBase/articles/Basic_Technical_Q_A/Legend.
+6 Weeks Post-infection Time Point
Six hundred twenty-six of the 687 DE genes detected between sample groups at +6 weeks post-infection and −1 week pre-infection were mapped to the IPA Knowledge Base (91.12%). Supplementary Table 9 (Supplementary Material 3) details the overrepresented IPA canonical pathways for this DE gene set. Twenty-five biological interaction networks were generated from this 626-DE-gene set using the IPA Knowledge Base, and Supplementary Figure 7 shows the highest-ranked network, which contains mostly down-regulated focus molecules associated with DNA replication, recombination and repair, and control of gene expression and the cell cycle.
+10 Weeks Post-infection Time Point
For the +10 weeks post-infection vs. −1 week pre-infection contrast, 2,247 of the 2,583 DE genes were mapped to the IPA Knowledge Base (86.99%). Supplementary Table 10 (Supplementary Material 3) details the overrepresented IPA canonical pathways for this DE gene set. The top-ranked canonical pathway was the Protein Ubiquitination Pathway, with 40 of 64 entities present in the pathway containing 255 members (P = 1.36 × 10⁻¹¹) exhibiting decreased expression relative to the −1 week pre-infection group. In this regard, it is noteworthy that M. tuberculosis has recently been demonstrated to suppress innate immunity by exploiting the host ubiquitination system (121–124).
Twenty-five biological interaction networks were generated from this 2,247-DE-gene set using the IPA Knowledge Base. Figure 5 shows the highest-ranked network, which was centred on the amyloid β (A4) precursor protein encoded by the APP gene (previously known as ABPP) as a central hub, and the top IPA disease and function categories represented were Antigen Presentation, Carbohydrate Metabolism, and Cardiovascular Disease. Currently, there are few published research works demonstrating differential expression of the APP gene during TB in vertebrates (125, 126); however, the presence of this network at +10 weeks post-infection suggests that the represented genes and gene products may have roles in BTB development and host–pathogen interactions. In addition, using RNA-seq, the APP gene was also significantly increased in expression in PBL from M. bovis–infected cattle compared to non-infected controls (31).
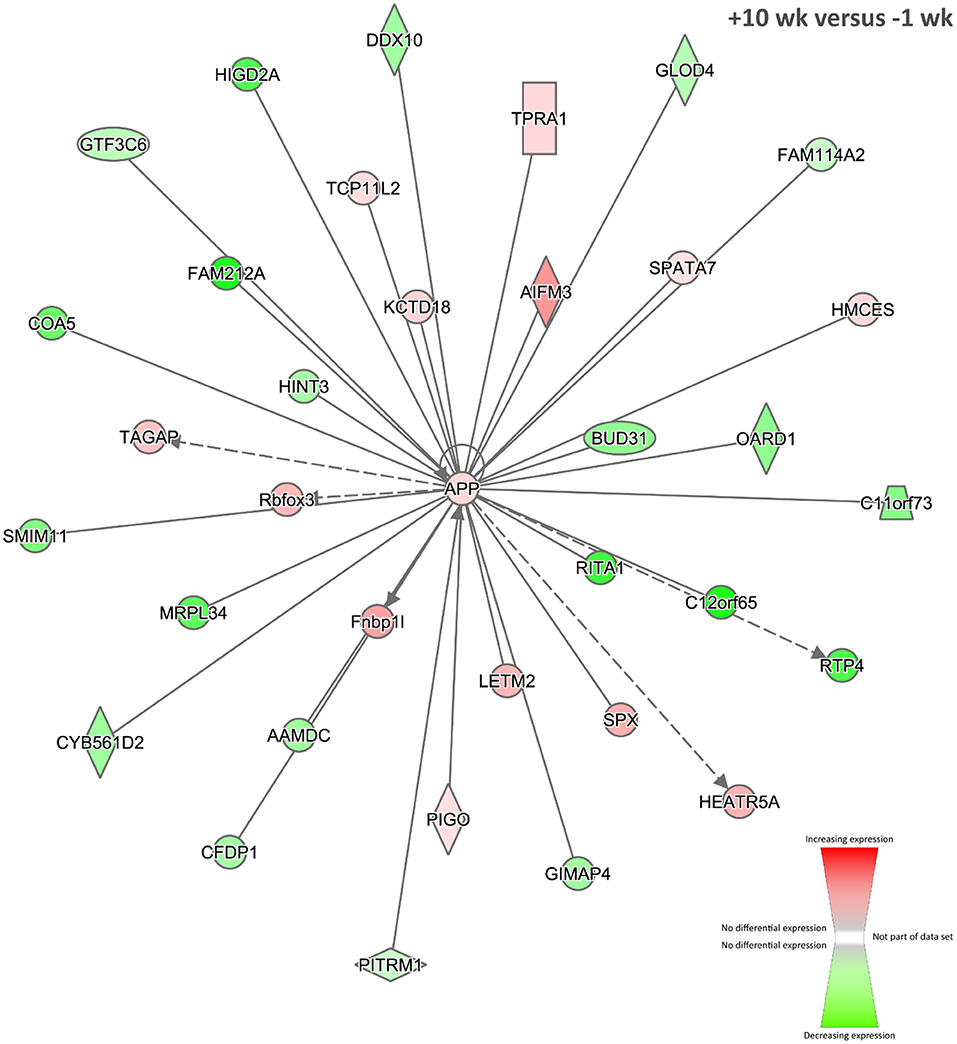
Figure 5. The top-ranked biological interaction network generated using IPA for +10 weeks post-infection. Differential gene expression is represented with a red–green colour scale. This network consisted of 35 focus molecules (IPA Network Score = 39), and the top IPA Disease and Function categories represented were Antigen Presentation, Carbohydrate Metabolism, and Cardiovascular Disease. A detailed legend for IPA biological interaction networks including a key for node shapes and edge classifications is available at the following link: https://qiagen.secure.force.com/KnowledgeBase/articles/Basic_Technical_Q_A/Legend.
+12 Weeks Post-infection Time Point
There was a marked decrease in the number of DE genes at +12 weeks compared to +10 weeks post-infection, which may reflect control of the infection by the immune system at this stage of the time course. Two hundred ninety-three of the 338 DE genes detected between sample groups at +12 weeks post-infection and −1 week pre-infection were mapped to the IPA Knowledge Base (86.69%). Supplementary Table 11 (Supplementary Material 3) details the overrepresented IPA canonical pathways for this DE gene set. The top-ranked canonical pathway was T Cell Receptor Signalling with 12 molecules detected from a total of 97 pathway members (P = 8.96 × 10⁻⁹). These 12 genes (CAMK4, CD247, CD3D, CD3E, CD3G, CD8A, CD8B, FOS, ITK, LCK, PRKCQ, and ZAP70) all displayed increased expression relative to −1 week pre-infection, pointing towards the presence of mycobacterial antigen presentation and T-cell activation via T-cell receptor (TCR) signal transduction (12, 127, 128).
Nineteen biological interaction networks were generated from this 293-DE-gene set using the IPA Knowledge Base, and Figure 6 shows the highest-ranked network, which was centred on increased expression of the CXCR4, PTGS2, and KLF4 proteins, and the top IPA disease and function categories represented were Cellular Development, Haematological System Development and Function, and Cell-mediated Immune Response. As described above, the CXCR4 gene is known to be upregulated in blood monocytes and bronchoalveolar lavage cells from human patients with pulmonary TB (74). In addition, the PTGS2 gene (previously known as COX-2) encodes prostaglandin-endoperoxide synthase 2, a key enzyme in prostaglandin biosynthesis, which is known to be triggered in macrophages—via a TLR2-dependent mechanism—by ESAT-6 proteins secreted by virulent M. tuberculosis and M. bovis (129). In this regard, it has been hypothesised that induction of PTGS2 may facilitate intracellular mycobacterial survival through inhibition of p53-dependent apoptosis (130). Conversely, it has also been shown that PTGS2 enhances bactericidal activity in M. tuberculosis–infected macrophages through promotion of autophagy (131).
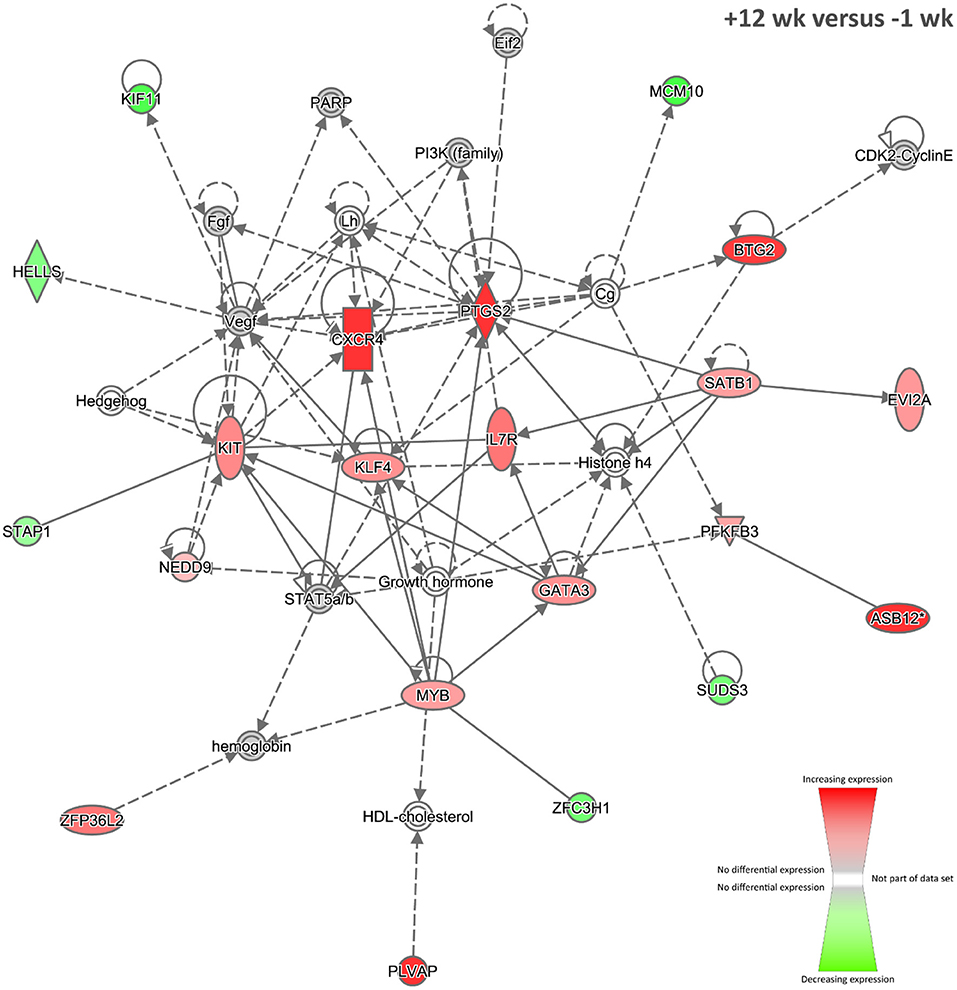
Figure 6. The top-ranked biological interaction network generated using IPA for +12 weeks post-infection. Differential gene expression is represented with a red–green colour scale. This network consisted of 21 focus molecules (IPA Network Score = 33), and the top IPA Disease and Function categories represented were Cellular Development, Haematological System Development and Function, and Cell-mediated Immune Response. A detailed legend for IPA biological interaction networks including a key for node shapes and edge classifications is available at the following link: https://qiagen.secure.force.com/KnowledgeBase/articles/Basic_Technical_Q_A/Legend.
The KLF4 gene encodes a zinc finger–containing transcription factor that regulates macrophage polarisation, displaying increased expression in M2 macrophages and strongly decreased expression in M1 macrophages (132). Integrative network analyses of transcriptome, protein–protein interaction, and transcription factor–binding site data have shown that KLF4 is an important regulator of lung cell gene expression during the early events of M. tuberculosis infection in mice (133). It has also been shown that nitric oxide (NO) and KLF4 epigenetically modify class II transactivator protein causing repression of major histocompatibility complex (MHC) class II expression during M. bovis BCG infection of murine macrophages (134). Furthermore, downregulation of microRNA-26a during M. tuberculosis infection of murine macrophages upregulates KLF4, in turn promoting increased arginase and decreased activity of inducible NO synthase, as well as preventing trafficking of M. tuberculosis to lysosomes (135). Taken together, these results support the hypothesis that increased expression of KLF4 facilitates mycobacterial evasion of host immune surveillance.
Time-Series Analysis
The STEM tool was designed specifically for analyses of short time-series data sets (3–8 time points) (59, 60) similar to the RNA-gene expression data set obtained from the M. bovis animal infection time-course experiment described here. Time-series analysis can be a powerful technique for uncovering networks of coregulated genes in longitudinal time-course experiments (136–138), particularly for gene expression data associated with host immunobiological responses to infection (139–142).
For the present study, STEM time-series analyses of differential gene expression across the M. bovis infection time course demonstrated that large groups of genes exhibited comparable patterns of gene expression across the five post-infection time points (+1, +2, +6, +10, and +12 weeks post-infection) relative to the −1 week pre-infection time point. Two different STEM analyses were performed based on (a) expression data for all detectable expressed genes across the infection time course, which corresponded to 4,103 genes (STEM analysis 1) and (b) the union set of DE genes from all post-infection time points vs. −1 week pre-infection, which corresponded to 2,935 genes (STEM analysis 2). Supplementary Figure 8 shows the top 50 time-series model profiles obtained for STEM analysis 1 and STEM analysis 2.
The top-ranked time-series profiles (by P-value) obtained using the two different STEM analyses were very similar. For example, as shown in Supplementary Table 12 (Supplementary Material 4), the first-ranked STEM model profile for STEM analysis 1 (profile 40; Figure 7) was enriched for the signal transduction, single organism signalling, cell communication, regulation of multicellular organismal process, and cellular response to stimulus GO terms. This profile was also similar to the second-ranked model profile for STEM analysis 2 (profile 40; Supplementary Figure 9), which was enriched for many of the same GO terms (signal transduction, single organism signalling, cell communication; see Supplementary Table 13, Supplementary Material 4). The third-ranked model profile for STEM analysis 1 (profile 23; Supplementary Figure 9) was highly similar to the first-ranked model profile for STEM analysis 2 (profile 23; Figure 7) with exactly the same overrepresented GO terms (mitochondrial inner membrane, organelle inner membrane, mitochondrial part, mitochondrial membrane, mitochondrial envelope; Supplementary Tables 14, 15, Supplementary Material 4).
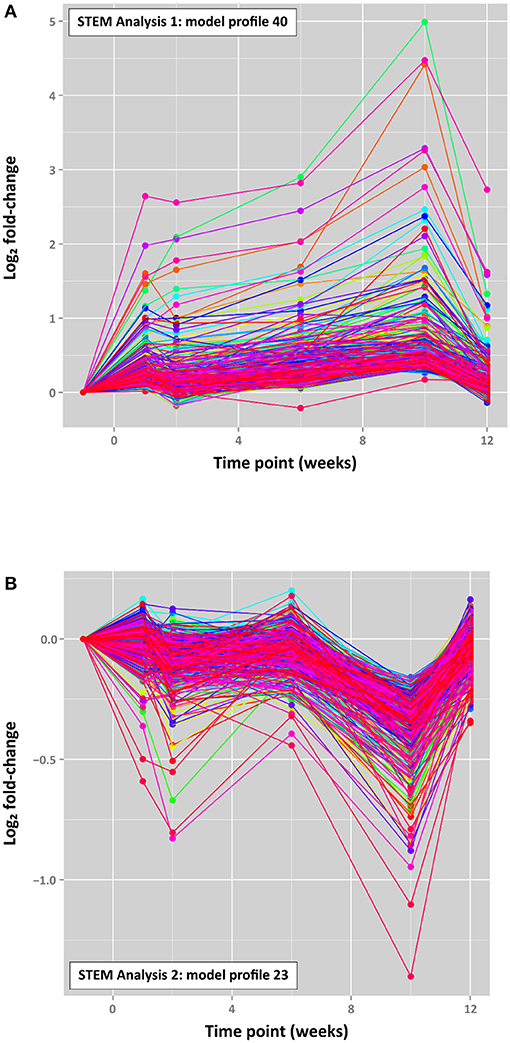
Figure 7. Top-ranked STEM time series profiles. (A) The first-ranked model profile (profile 40) for STEM analysis 1 (4,103 filtered genes) (303 genes assigned; 80.7 genes expected; FDR-adjusted P = 3.2 × 10−99) and (B) the first-ranked model profile (profile 23) for STEM analysis 2 (2,935 filtered genes) (516 genes assigned; 108.9 genes expected; FDR-adjusted P = 1.6 × 10−187). The coloured lines in each model profile represent individual genes.
It is interesting to note that STEM profile 40 in each analysis is characterised by a cluster of ~300 genes associated with cell signalling and cellular response to stimuli, which exhibited increasing expression across the four time points with a peak at +10 weeks, followed by a substantial decrease at +12 weeks (Figure 7). Conversely, STEM profile 23 (516 genes for STEM analysis 2) is characterised by genes associated with mitochondrial components, particularly the mitochondrial membrane, which displayed an oscillating pattern of expression with a marked decrease at +1 week 10 post-infection (Figure 7).
These time-dependent patterns of gene expression in peripheral blood may reflect pathogenesis of early BTB disease during the infection time course with concomitant host cellular responses to M. bovis infection, disruption of homeostasis, and changing cellular, tissue, and organismal energy requirements (143–145). In addition, it is important to note that although these longitudinal patterns of gene expression may be due to coregulation of genes in the same cluster, they are likely to also reflect fluctuations in peripheral blood cell type populations comparable to those previously observed for comparisons of M. bovis–infected and control non-infected cattle (28, 104).
Conclusions
The results presented here provide good support for the hypothesis that the peripheral blood transcriptome constitutes a source of gene expression biomarkers for BTB caused by M. bovis infection in cattle. This is particularly apparent for the panel of 19 genes exhibiting consistently, statistically significantly increased expression across the infection time course, the majority of which (16 genes) were also significantly increased in PBL harvested from an independent cohort of field-infected cattle. However, the sensitivity and specificity of putative transcriptional biosignatures of M. bovis infection will need to be verified and validated using larger panels of cattle naturally infected with M. bovis and also populations of animals infected with a range of viral and bacterial pathogens.
Data Availability Statement
The datasets presented in this study can be found in online repositories. The names of the repository/repositories and accession number(s) can be found at: https://www.ebi.ac.uk/ena, PRJEB27764 and PRJEB44470.
Ethics Statement
The animal study was reviewed and approved by Animal & Plant Health Agency (APHA), Animal Use Ethics Committee (UK Home Office PCD number 70/6905).
Author Contributions
DMac, SG, EG, KM, AW, BV-R, and HV conceived and designed the project and organised bovine sample collection. KM, NN, DMag, and JB performed RNA extraction and RNA-seq library generation. KM, NN, KR-A, CC, and DMac performed the analyses. KM, CC, and DMac wrote the manuscript. All authors reviewed and approved the final manuscript.
Funding
This work was supported by Investigator Grants from Science Foundation Ireland (Nos. SFI/08/IN.1/B2038 and SFI/15/IA/3154), Research Grants from the Department of Agriculture, Food and the Marine (Nos. RSF 06 405 and 17/RD/US-ROI/52), a Department for Environment, Food & Rural Affairs Project Grant (No. SE3224), a European Union Framework 7 Project Grant (No. KBBE-211602-MACROSYS), a Brazilian Science Without Borders—CAPES Grant (No. BEX-13070-13-4), and the UCD Wellcome Trust funded Computational Infection Biology PhD Programme (Grant no. 097429/Z/11/Z).
Conflict of Interest
The authors declare that the research was conducted in the absence of any commercial or financial relationships that could be construed as a potential conflict of interest.
Acknowledgments
The authors would like to thank all members of the Animal Services Unit of the APHA, Weybridge for their exemplary care of the animals used in these experiments.
Supplementary Material
The Supplementary Material for this article can be found online at: https://www.frontiersin.org/articles/10.3389/fvets.2021.662002/full#supplementary-material
References
1. Cole ST, Brosch R, Parkhill J, Garnier T, Churcher C, Harris D, et al. Deciphering the biology of Mycobacterium tuberculosis from the complete genome sequence. Nature. (1998) 393:537–44. doi: 10.1038/31159
2. Garnier T, Eiglmeier K, Camus JC, Medina N, Mansoor H, Pryor M, et al. The complete genome sequence of Mycobacterium bovis. Proc Natl Acad Sci USA. (2003) 100:7877–82. doi: 10.1073/pnas.1130426100
3. Brites D, Loiseau C, Menardo F, Borrell S, Boniotti MB, Warren R, et al. A new phylogenetic framework for the animal-adapted Mycobacterium tuberculosis complex. Front Microbiol. (2018) 9:2820. doi: 10.3389/fmicb.2018.02820
4. Malone KM, Gordon SV. Mycobacterium tuberculosis complex members adapted to wild and domestic animals. Adv Exp Med Biol. (2017) 1019:135–54. doi: 10.1007/978-3-319-64371-7_7
5. Perry BD, Randolph TF, McDermott JJ, Sones KR, Thornton PK. Investing in Animal Health Research to Alleviate Poverty. Nairobi: ILRI (International Livestock Research Institute) (2002).
6. Perry B, Grace D. The impacts of livestock diseases and their control on growth and development processes that are pro-poor. Philos Trans R Soc Lond B Biol Sci. (2009) 364:2643–55. doi: 10.1098/rstb.2009.0097
7. Steele JH. Introduction (Part 2 Regional and Country Status Reports). In: Thoen CO, Steele JH, editors, Mycobacterium bovis Infection in Animals and Humans. Ames, IA: Iowa State University Press (1995). p. 169–72.
8. Waters WR, Palmer MV, Buddle BM, Vordermeier HM. Bovine tuberculosis vaccine research: historical perspectives and recent advances. Vaccine. (2012) 30:2611–22. doi: 10.1016/j.vaccine.2012.02.018
9. Olea-Popelka F, Muwonge A, Perera A, Dean AS, Mumford E, Erlacher-Vindel E, et al. Zoonotic tuberculosis in human beings caused by Mycobacterium bovis – a call for action. Lancet Infect Dis. (2017) 17:e21–e5. doi: 10.1016/S1473-3099(16)30139-6
10. Kanipe C, Palmer MV. Mycobacterium bovis and you: a comprehensive look at the bacteria, its similarities to Mycobacterium tuberculosis, and its relationship with human disease. Tuberculosis. (2020) 125:102006. doi: 10.1016/j.tube.2020.102006
11. Luciano SA, Roess A. Human zoonotic tuberculosis and livestock exposure in low- and middle-income countries: a systematic review identifying challenges in laboratory diagnosis. Zoonoses Public Health. (2020) 67:97–111. doi: 10.1111/zph.12684
12. O'Garra A, Redford PS, McNab FW, Bloom CI, Wilkinson RJ, Berry MP. The immune response in tuberculosis. Annu Rev Immunol. (2013) 31:475–527. doi: 10.1146/annurev-immunol-032712-095939
13. Domingo M, Vidal E, Marco A. Pathology of bovine tuberculosis. Res Vet Sci. (2014) 97:S20–9. doi: 10.1016/j.rvsc.2014.03.017
14. Pai M, Behr MA, Dowdy D, Dheda K, Divangahi M, Boehme CC, et al. Tuberculosis. Nat Rev Dis Primers. (2016) 2:16076. doi: 10.1038/nrdp.2016.76
15. Scriba TJ, Coussens AK, Fletcher HA. Human immunology of tuberculosis. Microbiol Spectr. (2016) 4. doi: 10.1128/9781555819569.ch11
16. de Chastellier C. The many niches and strategies used by pathogenic mycobacteria for survival within host macrophages. Immunobiology. (2009) 214:526–42. doi: 10.1016/j.imbio.2008.12.005
17. Cambier CJ, Falkow S, Ramakrishnan L. Host evasion and exploitation schemes of Mycobacterium tuberculosis. Cell. (2014) 159:1497–509. doi: 10.1016/j.cell.2014.11.024
18. Schorey JS, Schlesinger LS. Innate immune responses to tuberculosis. Microbiol Spectr. (2016) 4. doi: 10.1128/microbiolspec.TBTB2-0010-2016
19. Awuh JA, Flo TH. Molecular basis of mycobacterial survival in macrophages. Cell Mol Life Sci. (2017) 74:1625–48. doi: 10.1007/s00018-016-2422-8
20. Martinot AJ. Microbial offense vs host defense: who controls the TB granuloma? Vet Pathol. (2018) 55:14–26. doi: 10.1177/0300985817705177
21. Pagan AJ, Ramakrishnan L. The formation and function of granulomas. Annu Rev Immunol. (2018) 36:639–65. doi: 10.1146/annurev-immunol-032712-100022
22. Cassidy JP. TB or not TB? The granuloma is the question. Vet Pathol. (2019) 56:508–9. doi: 10.1177/0300985819844815
23. More SJ, Good M. Understanding and managing bTB risk: perspectives from Ireland. Vet Microbiol. (2015) 176:209–18. doi: 10.1016/j.vetmic.2015.01.026
24. More SJ. Can bovine TB be eradicated from the Republic of Ireland? Could this be achieved by 2030? Ir Vet J. (2019) 72:3. doi: 10.1186/s13620-019-0140-x
25. Gormley E, Doyle MB, Fitzsimons T, McGill K, Collins JD. Diagnosis of Mycobacterium bovis infection in cattle by use of the gamma-interferon (Bovigam) assay. Vet Microbiol. (2006) 112:171–9. doi: 10.1016/j.vetmic.2005.11.029
26. Allen AR, Skuce RA, Byrne AW. Bovine tuberculosis in Britain and Ireland - a perfect storm? The confluence of potential ecological and epidemiological impediments to controlling a chronic infectious disease. Front Vet Sci. (2018) 5:109. doi: 10.3389/fvets.2018.00109
27. Vordermeier HM, Jones GJ, Buddle BM, Hewinson RG, Villarreal-Ramos B. Bovine tuberculosis in cattle: vaccines, DIVA tests, and host biomarker discovery. Annu Rev Anim Biosci. (2016) 4:87–109. doi: 10.1146/annurev-animal-021815-111311
28. Killick KE, Browne JA, Park SD, Magee DA, Martin I, Meade KG, et al. Genome-wide transcriptional profiling of peripheral blood leukocytes from cattle infected with Mycobacterium bovis reveals suppression of host immune genes. BMC Genomics. (2011) 12:611. doi: 10.1186/1471-2164-12-611
29. Aranday-Cortes E, Hogarth PJ, Kaveh DA, Whelan AO, Villarreal-Ramos B, Lalvani A, et al. Transcriptional profiling of disease-induced host responses in bovine tuberculosis and the identification of potential diagnostic biomarkers. PLoS ONE. (2012) 7:e30626. doi: 10.1371/journal.pone.0030626
30. Blanco FC, Soria M, Bianco MV, Bigi F. Transcriptional response of peripheral blood mononuclear cells from cattle infected with Mycobacterium bovis. PLoS ONE. (2012) 7:e41066. doi: 10.1371/journal.pone.0041066
31. McLoughlin KE, Nalpas NC, Rue-Albrecht K, Browne JA, Magee DA, Killick KE, et al. RNA-seq transcriptional profiling of peripheral blood leukocytes from cattle infected with Mycobacterium bovis. Front Immunol. (2014) 5:396. doi: 10.3389/fimmu.2014.00396
32. Klepp LI, Eirin ME, Garbaccio S, Soria M, Bigi F, Blanco FC. Identification of bovine tuberculosis biomarkers to detect tuberculin skin test and IFNγ release assay false negative cattle. Res Vet Sci. (2019) 122:7–14. doi: 10.1016/j.rvsc.2018.10.016
33. Wiarda JE, Boggiatto PM, Bayles DO, Waters WR, Thacker TC, Palmer MV. Severity of bovine tuberculosis is associated with innate immune-biased transcriptional signatures of whole blood in early weeks after experimental Mycobacterium bovis infection. PLoS ONE. (2020) 15:e0239938. doi: 10.1371/journal.pone.0239938
34. Rhodes SG, Buddle BM, Hewinson RG, Vordermeier HM. Bovine tuberculosis: immune responses in the peripheral blood and at the site of active disease. Immunology. (2000) 99:195–202. doi: 10.1046/j.1365-2567.2000.00944.x
35. Blankley S, Berry MP, Graham CM, Bloom CI, Lipman M, O'Garra A. The application of transcriptional blood signatures to enhance our understanding of the host response to infection: the example of tuberculosis. Philos Trans R Soc Lond B Biol Sci. (2014) 369:20130427. doi: 10.1098/rstb.2013.0427
36. Chaussabel D. Assessment of immune status using blood transcriptomics and potential implications for global health. Semin Immunol. (2015) 27:58–66. doi: 10.1016/j.smim.2015.03.002
37. Correia CN, Nalpas NC, McLoughlin KE, Browne JA, Gordon SV, MacHugh DE, et al. Circulating microRNAs as potential biomarkers of infectious disease. Front Immunol. (2017) 8:118. doi: 10.3389/fimmu.2017.00118
38. Faherty O'Donnell SL, Correia CN, MacHugh DE. CHAPTER 4: MicroRNAs and mycobacterial infections in humans and domestic animals. In: Peplow PV, Martinez B, Calin GA, Esquela-Kerscher A, editors. MicroRNAs in Diseases and Disorders: Emerging Therapeutic Targets. Cambridge, MK: The Royal Society of Chemistry (2019). p. 105–32. doi: 10.1039/9781788016421-00105
39. Maertzdorf J, McEwen G, Weiner III J, Tian S, Lader E, Schriek U, et al. Concise gene signature for point-of-care classification of tuberculosis. EMBO Mol Med. (2016) 8:86–95. doi: 10.15252/emmm.201505790
40. Dean G, Whelan A, Clifford D, Salguero FJ, Xing Z, Gilbert S, et al. Comparison of the immunogenicity and protection against bovine tuberculosis following immunization by BCG-priming and boosting with adenovirus or protein based vaccines. Vaccine. (2014) 32:1304–10. doi: 10.1016/j.vaccine.2013.11.045
41. Dean GS, Clifford D, Whelan AO, Tchilian EZ, Beverley PC, Salguero FJ, et al. Protection induced by simultaneous subcutaneous and endobronchial vaccination with BCG/BCG and BCG/adenovirus expressing antigen 85A against Mycobacterium bovis in cattle. PLoS ONE. (2015) 10:e0142270. doi: 10.1371/journal.pone.0142270
42. Metcalfe HJ, Steinbach S, Jones GJ, Connelley T, Morrison WI, Vordermeier M, et al. Protection associated with a TB vaccine is linked to increased frequency of Ag85A-specific CD4(+) T cells but no increase in avidity for Ag85A. Vaccine. (2016) 34:4520–5. doi: 10.1016/j.vaccine.2016.07.055
43. Jones GJ, Coad M, Khatri B, Bezos J, Parlane NA, Buddle BM, et al. Tuberculin skin testing boosts interferon gamma responses to DIVA reagents in Mycobacterium bovis-infected cattle. Clin Vaccine Immunol. (2017) 24:e00551–16. doi: 10.1128/CVI.00551-16
44. Salguero FJ, Gibson S, Garcia-Jimenez W, Gough J, Strickland TS, Vordermeier HM, et al. Differential cell composition and cytokine expression within lymph node granulomas from BCG-vaccinated and non-vaccinated cattle experimentally infected with Mycobacterium bovis. Transbound Emerg Dis. (2017) 64:1734–49. doi: 10.1111/tbed.12561
45. Malone KM, Farrell D, Stuber TP, Schubert OT, Aebersold R, Robbe-Austerman S, et al. Updated reference genome sequence and annotation of Mycobacterium bovis AF2122/97. Genome Announc. (2017) 5:e00157–17. doi: 10.1128/genomeA.00157-17
46. Whelan A, Court P, Xing Z, Clifford D, Hogarth PJ, Vordermeier M, et al. Immunogenicity comparison of the intradermal or endobronchial boosting of BCG vaccinates with Ad5-85A. Vaccine. (2012) 30:6294–300. doi: 10.1016/j.vaccine.2012.07.086
47. Johnson M, Zaretskaya I, Raytselis Y, Merezhuk Y, McGinnis S, Madden TL. NCBI BLAST: a better web interface. Nucleic Acids Res. (2008) 36:W5–9. doi: 10.1093/nar/gkn201
48. Nalpas NC, Magee DA, Conlon KM, Browne JA, Healy C, McLoughlin KE, et al. RNA sequencing provides exquisite insight into the manipulation of the alveolar macrophage by tubercle bacilli. Sci Rep. (2015) 5:13629. doi: 10.1038/srep13629
49. Andrews S. FastQC - A Quality Control Tool for High Throughput Sequence Data. (2016). Available online at: http://www.bioinformatics.babraham.ac.uk/projects/fastqc/
50. Zimin AV, Delcher AL, Florea L, Kelley DR, Schatz MC, Puiu D, et al. A whole-genome assembly of the domestic cow, Bos taurus. Genome Biol. (2009) 10:R42. doi: 10.1186/gb-2009-10-4-r42
51. Dobin A, Davis CA, Schlesinger F, Drenkow J, Zaleski C, Jha S, et al. STAR: ultrafast universal RNA-seq aligner. Bioinformatics. (2013) 29:15–21. doi: 10.1093/bioinformatics/bts635
52. Liao Y, Smyth GK, Shi W. featureCounts: an efficient general purpose program for assigning sequence reads to genomic features. Bioinformatics. (2014) 30:923–30. doi: 10.1093/bioinformatics/btt656
53. Robinson MD, McCarthy DJ, Smyth GK. edgeR: a Bioconductor package for differential expression analysis of digital gene expression data. Bioinformatics. (2010) 26:139–40. doi: 10.1093/bioinformatics/btp616
54. Durinck S, Moreau Y, Kasprzyk A, Davis S, De Moor B, Brazma A, et al. BioMart and Bioconductor: a powerful link between biological databases and microarray data analysis. Bioinformatics. (2005) 21:3439–40. doi: 10.1093/bioinformatics/bti525
55. Robinson MD, Oshlack A. A scaling normalization method for differential expression analysis of RNA-seq data. Genome Biol. (2010) 11:R25. doi: 10.1186/gb-2010-11-3-r25
56. Benjamini Y, Hochberg Y. Controlling the false discovery rate - a practical and powerful approach to multiple testing. J R Stat Soc Ser B Methodol. (1995) 57:289–300. doi: 10.1111/j.2517-6161.1995.tb02031.x
57. Kramer A, Green J, Pollard J Jr, Tugendreich S. Causal analysis approaches in ingenuity pathway analysis. Bioinformatics. (2014) 30:523–30. doi: 10.1093/bioinformatics/btt703
58. Agresti A. A survey of exact inference for contingency tables. Statist Sci. (1992) 7:131–53. doi: 10.1214/ss/1177011454
59. Ernst J, Bar-Joseph Z. STEM: a tool for the analysis of short time series gene expression data. BMC Bioinformatics. (2006) 7:191. doi: 10.1186/1471-2105-7-191
60. Ernst J, Nau GJ, Bar-Joseph Z. Clustering short time series gene expression data. Bioinformatics. (2005) 1:i159–68. doi: 10.1093/bioinformatics/bti1022
61. Chaussabel D, Quinn C, Shen J, Patel P, Glaser C, Baldwin N, et al. A modular analysis framework for blood genomics studies: application to systemic lupus erythematosus. Immunity. (2008) 29:150–64. doi: 10.1016/j.immuni.2008.05.012
62. Chaussabel D, Pascual V, Banchereau J. Assessing the human immune system through blood transcriptomics. BMC Biol. (2010) 8:84. doi: 10.1186/1741-7007-8-84
63. Hossain MA, Yamato O, Yamasaki M, Otsuka Y, Maede Y. Relation between reticulocyte count and characteristics of erythrocyte 5'-nucleotidase in dogs, cats, cattle and humans. J Vet Med Sci. (2003) 65:193–197. doi: 10.1292/jvms.65.193
64. Correia CN, McLoughlin KE, Nalpas NC, Magee DA, Browne JA, Rue-Albrecht K, et al. RNA sequencing (RNA-seq) reveals extremely low levels of reticulocyte-derived globin gene transcripts in peripheral blood from horses (Equus caballus) and cattle (Bos taurus). Front Genet. (2018) 9:278. doi: 10.3389/fgene.2018.00278
65. Berry MP, Graham CM, McNab FW, Xu Z, Bloch SA, Oni T, et al. An interferon-inducible neutrophil-driven blood transcriptional signature in human tuberculosis. Nature. (2010) 466:973–7. doi: 10.1038/nature09247
66. Maertzdorf J, Weiner J. III, Mollenkopf HJ, Bornot TB, Network BT, et al. Common patterns and disease-related signatures in tuberculosis and sarcoidosis. Proc Natl Acad Sci USA. (2012) 109:7853–8. doi: 10.1073/pnas.1121072109
67. Cliff JM, Kaufmann SH, McShane H, van Helden P, O'Garra A. The human immune response to tuberculosis and its treatment: a view from the blood. Immunol Rev. (2015) 264:88–102. doi: 10.1111/imr.12269
68. Blankley S, Graham CM, Turner J, Berry MP, Bloom CI, Xu Z, et al. The transcriptional signature of active tuberculosis reflects symptom status in extra-pulmonary and pulmonary tuberculosis. PLoS ONE. (2016) 11:e0162220. doi: 10.1371/journal.pone.0162220
69. Sweeney TE, Braviak L, Tato CM, Khatri P. Genome-wide expression for diagnosis of pulmonary tuberculosis: a multicohort analysis. Lancet Respir Med. (2016) 4:213–24. doi: 10.1016/S2213-2600(16)00048-5
70. Leong S, Zhao Y, Joseph NM, Hochberg NS, Sarkar S, Pleskunas J, et al. Existing blood transcriptional classifiers accurately discriminate active tuberculosis from latent infection in individuals from south India. Tuberculosis. (2018) 109:41–51. doi: 10.1016/j.tube.2018.01.002
71. Estévez O, Anibarro L, Garet E, Pallares Á, Barcia L, Calviño L, et al. An RNA-seq based machine learning approach identifies latent tuberculosis patients with an active tuberculosis profile. Front Immunol. (2020) 11:1470. doi: 10.3389/fimmu.2020.01470
72. Hoshino Y, Tse DB, Rochford G, Prabhakar S, Hoshino S, Chitkara N, et al. Mycobacterium tuberculosis-induced CXCR4 and chemokine expression leads to preferential X4 HIV-1 replication in human macrophages. J Immunol. (2004) 172:6251–8. doi: 10.4049/jimmunol.172.10.6251
73. Rosas-Taraco AG, Arce-Mendoza AY, Caballero-Olin G, Salinas-Carmona MC. Mycobacterium tuberculosis upregulates coreceptors CCR5 and CXCR4 while HIV modulates CD14 favoring concurrent infection. AIDS Res Hum Retroviruses. (2006) 22:45–51. doi: 10.1089/aid.2006.22.45
74. Shankar EM, Vignesh R, Ellegard R, Barathan M, Chong YK, Bador MK, et al. HIV-Mycobacterium tuberculosis co-infection: a 'danger-couple model' of disease pathogenesis. Pathog Dis. (2014) 70:110–8. doi: 10.1111/2049-632X.12108
75. Weijer S, Wieland CW, Florquin S, van der Poll T. A thrombomodulin mutation that impairs activated protein C generation results in uncontrolled lung inflammation during murine tuberculosis. Blood. (2005) 106:2761–8. doi: 10.1182/blood-2004-12-4623
76. Galietti F, Bollo E, Cappia S, Dondo A, Pregel P, Nicali R, et al. p53 expression in cultured blood human monocytes infected with mycobacterial strains. Panminerva Med. (2001) 43:249–55.
77. Juffermans NP, Dekkers PE, Verbon A, Speelman P, van Deventer SJ, van der Poll T. Concurrent upregulation of urokinase plasminogen activator receptor and CD11b during tuberculosis and experimental endotoxemia. Infect Immun. (2001) 69:5182–5. doi: 10.1128/IAI.69.8.5182-5185.2001
78. Eugen-Olsen J, Gustafson P, Sidenius N, Fischer TK, Parner J, Aaby P, et al. The serum level of soluble urokinase receptor is elevated in tuberculosis patients and predicts mortality during treatment: a community study from Guinea-Bissau. Int J Tuberc Lung Dis. (2002) 6:686–92.
79. Ostrowski SR, Ravn P, Hoyer-Hansen G, Ullum H, Andersen AB. Elevated levels of soluble urokinase receptor in serum from mycobacteria infected patients: still looking for a marker of treatment efficacy. Scand J Infect Dis. (2006) 38:1028–32. doi: 10.1080/00365540600868305
80. Djoba Siawaya JF, Bapela NB, Ronacher K, Veenstra H, Kidd M, Gie R, et al. Immune parameters as markers of tuberculosis extent of disease and early prediction of anti-tuberculosis chemotherapy response. J Infect. (2008) 56:340–7. doi: 10.1016/j.jinf.2008.02.007
81. Araujo Z, Macias-Segura N, Lopez-Ramos JE, De Waard JH, Vanegas M, Patarroyo MA, et al. Diagnostic accuracy of combinations of serological biomarkers for identifying clinical tuberculosis. J Infect Dev Ctries. (2018) 12:429–41. doi: 10.3855/jidc.9554
82. O'Kane CM, Elkington PT, Friedland JS. Monocyte-dependent oncostatin M and TNF-alpha synergize to stimulate unopposed matrix metalloproteinase-1/3 secretion from human lung fibroblasts in tuberculosis. Eur J Immunol. (2008) 38:1321–30. doi: 10.1002/eji.200737855
83. Dupnik KM, Bean JM, Lee MH, Jean Juste MA, Skrabanek L, Rivera V, et al. Blood transcriptomic markers of Mycobacterium tuberculosis load in sputum. Int J Tuberc Lung Dis. (2018) 22:950–8. doi: 10.5588/ijtld.17.0855
84. Daya M, van der Merwe L, Gignoux CR, van Helden PD, Moller M, Hoal EG. Using multi-way admixture mapping to elucidate TB susceptibility in the South African Coloured population. BMC Genomics. (2014) 15:1021. doi: 10.1186/1471-2164-15-1021
85. Zhang Y, Broser M, Cohen H, Bodkin M, Law K, Reibman J, et al. Enhanced interleukin-8 release and gene expression in macrophages after exposure to Mycobacterium tuberculosis and its components. J Clin Invest. (1995) 95:586–92. doi: 10.1172/JCI117702
86. Gerszten RE, Garcia-Zepeda EA, Lim YC, Yoshida M, Ding HA, Gimbrone, et al. MCP-1 and IL-8 trigger firm adhesion of monocytes to vascular endothelium under flow conditions. Nature. (1999) 398:718–23. doi: 10.1038/19546
87. Alessandri AL, Souza AL, Oliveira SC, Macedo GC, Teixeira MM, Teixeira AL. Concentrations of CXCL8, CXCL9 and sTNFR1 in plasma of patients with pulmonary tuberculosis undergoing treatment. Inflamm Res. (2006) 55:528–33. doi: 10.1007/s00011-006-5136-9
88. O'Kane CM, Boyle JJ, Horncastle DE, Elkington PT, Friedland JS. Monocyte-dependent fibroblast CXCL8 secretion occurs in tuberculosis and limits survival of mycobacteria within macrophages. J Immunol. (2007) 178:3767–76. doi: 10.4049/jimmunol.178.6.3767
89. Sawant KV, McMurray DN. Guinea pig neutrophils infected with Mycobacterium tuberculosis produce cytokines which activate alveolar macrophages in noncontact cultures. Infect Immun. (2007) 75:1870–7. doi: 10.1128/IAI.00858-06
90. Widdison S, Watson M, Piercy J, Howard C, Coffey TJ. Granulocyte chemotactic properties of M. tuberculosis versus M. bovis-infected bovine alveolar macrophages. Mol Immunol. (2008) 45:740–9. doi: 10.1016/j.molimm.2007.06.357
91. Almeida de Souza C, Abramo C, Alves CC, Mazzoccoli L, Ferreira AP, Teixeira HC. Anti-mycobacterial treatment reduces high plasma levels of CXC-chemokines detected in active tuberculosis by cytometric bead array. Mem Inst Oswaldo Cruz. (2009) 104:1039–41. doi: 10.1590/S0074-02762009000700018
92. Lee HM, Shin DM, Kim KK, Lee JS, Paik TH, Jo EK. Roles of reactive oxygen species in CXCL8 and CCL2 expression in response to the 30-kDa antigen of Mycobacterium tuberculosis. J Clin Immunol. (2009) 29:46–56. doi: 10.1007/s10875-008-9222-3
93. Andersson M, Lutay N, Hallgren O, Westergren-Thorsson G, Svensson M, Godaly G. Mycobacterium bovis bacilli Calmette-Guerin regulates leukocyte recruitment by modulating alveolar inflammatory responses. Innate Immun. (2012) 18:531–40. doi: 10.1177/1753425911426591
94. Huang KH, Wang CH, Lee KY, Lin SM, Lin CH, Kuo HP. NF-kappaB repressing factor inhibits chemokine synthesis by peripheral blood mononuclear cells and alveolar macrophages in active pulmonary tuberculosis. PLoS ONE. (2013) 8:e77789. doi: 10.1371/journal.pone.0077789
95. Domingo-Gonzalez R, Prince O, Cooper A, Khader SA. Cytokines and chemokines in Mycobacterium tuberculosis infection. Microbiol Spectr. (2016) 4. doi: 10.1128/microbiolspec.TBTB2-0018-2016
96. Nibbering PH, Pos O, Stevenhagen A, Van Furth R. Interleukin-8 enhances nonoxidative intracellular killing of Mycobacterium fortuitum by human granulocytes. Infect Immun. (1993) 61:3111–6. doi: 10.1128/IAI.61.8.3111-3116.1993
97. Krupa A, Fol M, Dziadek BR, Kepka E, Wojciechowska D, Brzostek A, et al. Binding of CXCL8/IL-8 to Mycobacterium tuberculosis modulates the innate immune response. Mediators Inflamm. (2015) 2015:124762. doi: 10.1155/2015/124762
98. Kasahara K, Sato I, Ogura K, Takeuchi H, Kobayashi K, Adachi M. Expression of chemokines and induction of rapid cell death in human blood neutrophils by Mycobacterium tuberculosis. J Infect Dis. (1998) 178:127–137. doi: 10.1086/515585
99. Godaly G, Young DB. Mycobacterium bovis bacille Calmette Guerin infection of human neutrophils induces CXCL8 secretion by MyD88-dependent TLR2 and TLR4 activation. Cell Microbiol. (2005) 7:591–601. doi: 10.1111/j.1462-5822.2004.00489.x
100. Xin H, Zhang H, Cao X, Li X, Li M, Feng B, et al. Serum level of IL-8 is associated with reversion of QuantiFERON-TB gold in-tube tests. J Infect. (2019) 78:292–8. doi: 10.1016/j.jinf.2018.08.010
101. Malone KM, Rue-Albrecht K, Magee DA, Conlon K, Schubert OT, Nalpas NC, et al. Comparative 'omics analyses differentiate Mycobacterium tuberculosis and Mycobacterium bovis and reveal distinct macrophage responses to infection with the human and bovine tubercle bacilli. Microb Genom. (2018) 4:e000163. doi: 10.1099/mgen.0.000163
102. Meade KG, Gormley E, O'Farrelly C, Park SD, Costello E, Keane J, et al. Antigen stimulation of peripheral blood mononuclear cells from Mycobacterium bovis infected cattle yields evidence for a novel gene expression program. BMC Genomics. (2008) 9:447. doi: 10.1186/1471-2164-9-447
103. Taraktsoglou M, Szalabska U, Magee DA, Browne JA, Sweeney T, Gormley E, et al. Transcriptional profiling of immune genes in bovine monocyte-derived macrophages exposed to bacterial antigens. Vet Immunol Immunopathol. (2011) 140:130–9. doi: 10.1016/j.vetimm.2010.12.002
104. Meade KG, Gormley E, Doyle MB, Fitzsimons T, O'Farrelly C, Costello E, et al. Innate gene repression associated with Mycobacterium bovis infection in cattle: toward a gene signature of disease. BMC Genomics. (2007) 8:400. doi: 10.1186/1471-2164-8-400
105. Alonso-Hearn M, Canive M, Blanco-Vazquez C, Torremocha R, Balseiro A, Amado J, et al. RNA-Seq analysis of ileocecal valve and peripheral blood from Holstein cattle infected with Mycobacterium avium subsp. paratuberculosis revealed dysregulation of the CXCL8/IL8 signaling pathway. Sci Rep. (2019) 9:14845. doi: 10.1038/s41598-019-51328-0
106. Ma X, Reich RA, Wright JA, Tooker HR, Teeter LD, Musser JM, et al. Association between interleukin-8 gene alleles and human susceptibility to tuberculosis disease. J Infect Dis. (2003) 188:349–55. doi: 10.1086/376559
107. Lindenau JD, Guimarães LS, Friedrich DC, Hurtado AM, Hill KR, Salzano FM, et al. Cytokine gene polymorphisms are associated with susceptibility to tuberculosis in an Amerindian population. Int J Tuberc Lung Dis. (2014) 18:952–7. doi: 10.5588/ijtld.14.0060
108. Yu Z, Wit W, Xiong L, Cheng Y. Associations of six common functional polymorphisms in interleukins with tuberculosis: evidence from a meta-analysis. Pathog Dis. (2019) 77:ftz053. doi: 10.1093/femspd/ftz053
109. Chen J, Ma A. Associations of polymorphisms in interleukins with tuberculosis: evidence from a meta-analysis. Immunol Lett. (2020) 217:1–6. doi: 10.1016/j.imlet.2019.10.012
110. Rogatsky I, Ivashkiv LB. Glucocorticoid modulation of cytokine signaling. Tissue Antigens. (2006) 68:1–12. doi: 10.1111/j.1399-0039.2006.00599.x
111. Busillo JM, Cidlowski JA. The five Rs of glucocorticoid action during inflammation: ready, reinforce, repress, resolve, and restore. Trends Endocrinol Metab. (2013) 24:109–19. doi: 10.1016/j.tem.2012.11.005
112. D'Attilio L, Santucci N, Bongiovanni B, Bay ML, Bottasso O. Tuberculosis, the disrupted immune-endocrine response and the potential thymic repercussion as a contributing factor to disease physiopathology. Front Endocrinol. (2018) 9:214. doi: 10.3389/fendo.2018.00214
113. Redford PS, Murray PJ, O'Garra A. The role of IL-10 in immune regulation during M. tuberculosis infection. Mucosal Immunol. (2011) 4:261–70. doi: 10.1038/mi.2011.7
114. Hmama Z, Pena-Diaz S, Joseph S, Av-Gay Y. Immunoevasion and immunosuppression of the macrophage by Mycobacterium tuberculosis. Immunol Rev. (2015) 264:220–32. doi: 10.1111/imr.12268
115. Turner J, Gonzalez-Juarrero M, Ellis DL, Basaraba RJ, Kipnis A, Orme IM, et al. In vivo IL-10 production reactivates chronic pulmonary tuberculosis in C57BL/6 mice. J Immunol. (2002) 169:6343–51. doi: 10.4049/jimmunol.169.11.6343
116. Huynh JP, Lin CC, Kimmey JM, Jarjour NN, Schwarzkopf EA, Bradstreet TR, et al. Bhlhe40 is an essential repressor of IL-10 during Mycobacterium tuberculosis infection. J Exp Med. (2018) 215:1823–38. doi: 10.1084/jem.20171704
117. Ouyang W, O'Garra A. IL-10 family cytokines IL-10 and IL-22: from basic science to clinical translation. Immunity. (2019) 50:871–91. doi: 10.1016/j.immuni.2019.03.020
118. Bai W, Liu H, Ji Q, Zhou Y, Liang L, Zheng R, et al. TLR3 regulates mycobacterial RNA-induced IL-10 production through the PI3K/AKT signaling pathway. Cell Signal. (2014) 26:942–50. doi: 10.1016/j.cellsig.2014.01.015
119. Wang X, Wu Y, Jiao J, Huang Q. Mycobacterium tuberculosis infection induces IL-10 gene expression by disturbing histone deacetylase 6 and histone deacetylase 11 equilibrium in macrophages. Tuberculosis. (2018) 108:118–23. doi: 10.1016/j.tube.2017.11.008
120. Harling K, Adankwah E, Guler A, Afum-Adjei Awuah A, Adu-Amoah L, Mayatepek E, et al. Constitutive STAT3 phosphorylation and IL-6/IL-10 co-expression are associated with impaired T-cell function in tuberculosis patients. Cell Mol Immunol. (2019) 16:275–87. doi: 10.1038/cmi.2018.5
121. Wang J, Li BX, Ge PP, Li J, Wang Q, Gao GF, et al. Mycobacterium tuberculosis suppresses innate immunity by coopting the host ubiquitin system. Nat Immunol. (2015) 16:237–45. doi: 10.1038/ni.3096
122. Franco LH, Nair VR, Scharn CR, Xavier RJ, Torrealba JR, Shiloh MU, et al. The ubiquitin ligase Smurf1 functions in selective autophagy of Mycobacterium tuberculosis and anti-tuberculous host defense. Cell Host Microbe. (2017) 21:59–72. doi: 10.1016/j.chom.2016.11.002
123. Chai Q, Wang X, Qiang L, Zhang Y, Ge P, Lu Z, et al. A Mycobacterium tuberculosis surface protein recruits ubiquitin to trigger host xenophagy. Nat Commun. (2019) 10:1973. doi: 10.1038/s41467-019-09955-8
124. Chai Q, Wang L, Liu CH, Ge B. New insights into the evasion of host innate immunity by Mycobacterium tuberculosis. Cell Mol Immunol. (2020) 17:901–13. doi: 10.1038/s41423-020-0502-z
125. Wang JP, Rought SE, Corbeil J, Guiney DG. Gene expression profiling detects patterns of human macrophage responses following Mycobacterium tuberculosis infection. FEMS Immunol Med Microbiol. (2003) 39:163–72. doi: 10.1016/S0928-8244(03)00223-2
126. Keller C, Hoffmann R, Lang R, Brandau S, Hermann C, Ehlers S. Genetically determined susceptibility to tuberculosis in mice causally involves accelerated and enhanced recruitment of granulocytes. Infect Immun. (2006) 74:4295–309. doi: 10.1128/IAI.00057-06
127. Harding CV, Boom WH. Regulation of antigen presentation by Mycobacterium tuberculosis: a role for Toll-like receptors. Nat Rev Microbiol. (2010) 8:296–307. doi: 10.1038/nrmicro2321
128. Harriff MJ, Purdy GE, Lewinsohn DM. Escape from the phagosome: the explanation for MHC-I processing of mycobacterial antigens? Front Immunol. (2012) 3:40. doi: 10.3389/fimmu.2012.00040
129. A SK, Bansal K, Holla S, Verma-Kumar S, Sharma P, Balaji KN. ESAT-6 induced COX-2 expression involves coordinated interplay between PI3K and MAPK signaling. Mol Immunol. (2012) 49:655–63. doi: 10.1016/j.molimm.2011.11.011
130. Dutta NK, Mehra S, Martinez AN, Alvarez X, Renner NA, Morici LA, et al. The stress-response factor SigH modulates the interaction between Mycobacterium tuberculosis and host phagocytes. PLoS ONE. (2012) 7:e28958. doi: 10.1371/journal.pone.0028958
131. Xiong W, Wen Q, Du X, Wang J, He W, Wang R, et al. Novel function of cyclooxygenase-2: suppressing mycobacteria by promoting autophagy via the protein kinase B/mammalian target of rapamycin pathway. J Infect Dis. (2018) 217:1267–79. doi: 10.1093/infdis/jiy033
132. Liao X, Sharma N, Kapadia F, Zhou G, Lu Y, Hong H, et al. Kruppel-like factor 4 regulates macrophage polarization. J Clin Invest. (2011) 121:2736–49. doi: 10.1172/JCI45444
133. Yaqubi M, Mohammadnia A, Fallahi H. Transcription factor regulatory network for early lung immune response to tuberculosis in mice. Mol Med Rep. (2015) 12:2865–71. doi: 10.3892/mmr.2015.3721
134. Ghorpade DS, Holla S, Sinha AY, Alagesan SK, Balaji KN. Nitric oxide and KLF4 protein epigenetically modify class II transactivator to repress major histocompatibility complex II expression during Mycobacterium bovis bacillus Calmette-Guerin infection. J Biol Chem. (2013) 288:20592–606. doi: 10.1074/jbc.M113.472183
135. Sahu SK, Kumar M, Chakraborty S, Banerjee SK, Kumar R, Gupta P, et al. MicroRNA 26a (miR-26a)/KLF4 and CREB-C/EBPβ regulate innate immune signaling, the polarization of macrophages and the trafficking of Mycobacterium tuberculosis to lysosomes during infection. PLoS Pathog. (2017) 13:e1006410. doi: 10.1371/journal.ppat.1006410
136. Bar-Joseph Z. Analyzing time series gene expression data. Bioinformatics. (2004) 20:2493–503. doi: 10.1093/bioinformatics/bth283
137. Bar-Joseph Z, Gitter A, Simon I. Studying and modelling dynamic biological processes using time-series gene expression data. Nat Rev Genet. (2012) 13:552–64. doi: 10.1038/nrg3244
138. Oh S, Song S, Dasgupta N, Grabowski G. The analytical landscape of static and temporal dynamics in transcriptome data. Front Genet. (2014) 5:35. doi: 10.3389/fgene.2014.00035
139. Blanc M, Hsieh WY, Robertson KA, Watterson S, Shui G, Lacaze P, et al. Host defense against viral infection involves interferon mediated down-regulation of sterol biosynthesis. PLoS Biol. (2011) 9:e1000598. doi: 10.1371/journal.pbio.1000598
140. Jorgensen HB, Buitenhuis B, Rontved CM, Jiang L, Ingvartsen KL, Sorensen P. Transcriptional profiling of the bovine hepatic response to experimentally induced E. coli mastitis. Physiol Genomics. (2012) 44:595–606. doi: 10.1152/physiolgenomics.00084.2011
141. Dimitrakopoulou K, Vrahatis AG, Wilk E, Tsakalidis AK, Bezerianos A. OLYMPUS: an automated hybrid clustering method in time series gene expression. Case study: host response after Influenza A (H1N1) infection. Comput Methods Programs Biomed. (2013) 111:650–61. doi: 10.1016/j.cmpb.2013.05.025
142. Maslove DM, Wong HR. Gene expression profiling in sepsis: timing, tissue, translational considerations. Trends Mol Med. (2014) 20:204–13. doi: 10.1016/j.molmed.2014.01.006
143. Neill SD, Bryson DG, Pollock JM. Pathogenesis of tuberculosis in cattle. Tuberculosis. (2001) 81:79–86. doi: 10.1054/tube.2000.0279
144. Cassidy JP. The pathogenesis and pathology of bovine tuberculosis with insights from studies of tuberculosis in humans and laboratory animal models. Vet Microbiol. (2006) 112:151–161. doi: 10.1016/j.vetmic.2005.11.031
Keywords: biomarker, cattle, gene expression, host-pathogen interaction, immune response, time series, tuberculosis, Mycobacterium bovis
Citation: McLoughlin KE, Correia CN, Browne JA, Magee DA, Nalpas NC, Rue-Albrecht K, Whelan AO, Villarreal-Ramos B, Vordermeier HM, Gormley E, Gordon SV and MacHugh DE (2021) RNA-Seq Transcriptome Analysis of Peripheral Blood From Cattle Infected With Mycobacterium bovis Across an Experimental Time Course. Front. Vet. Sci. 8:662002. doi: 10.3389/fvets.2021.662002
Received: 31 January 2021; Accepted: 06 April 2021;
Published: 28 May 2021.
Edited by:
Federico Blanco, Institute of Biotechnology, National Institute of Agricultural Technology (INTA), ArgentinaReviewed by:
Marta Alonso-Hearn, Animalien Osasuna, NEIKER-Instituto Vasco de Investigación y Desarrollo Agrario, SpainPaola M. Boggiatto, National Animal Disease Center (USDA ARS), United States
Copyright © 2021 McLoughlin, Correia, Browne, Magee, Nalpas, Rue-Albrecht, Whelan, Villarreal-Ramos, Vordermeier, Gormley, Gordon and MacHugh. This is an open-access article distributed under the terms of the Creative Commons Attribution License (CC BY). The use, distribution or reproduction in other forums is permitted, provided the original author(s) and the copyright owner(s) are credited and that the original publication in this journal is cited, in accordance with accepted academic practice. No use, distribution or reproduction is permitted which does not comply with these terms.
*Correspondence: David E. MacHugh, ZGF2aWQubWFjaHVnaEB1Y2QuaWU=
†Present address: Nicolas C. Nalpas, Quantitative Proteomics and Proteome Centre Tübingen, Interfaculty Institute for Cell Biology, University of Tübingen, Tübingen, Germany
Kevin Rue-Albrecht, MRC WIMM Centre for Computational Biology, University of Oxford, Oxford, United Kingdom
Adam O. Whelan, Biomedical Sciences, Defence Science and Technology Laboratory, Salisbury, United Kingdom
‡Bernardo Villarreal-Ramos and H. Martin Vordermeier have positions as Ser Cymru II Professors of Immunology at the Institute of Biological, Environmental & Rural Sciences, Aberystwyth University, Aberystwyth, United Kingdom