 Manuel Jara
 Rocio Crespo
 David L. Roberts2
 Ashlyn Chapman
 Gustavo Machado
- 1Department of Population Health and Pathobiology, College of Veterinary Medicine, North Carolina State University, Raleigh, NC, United States
- 2Department of Computer Science North Carolina State University, Raleigh, NC, United States
- 3Poultry Research and Diagnostic Laboratory, College of Veterinary Medicine, Mississippi State University, Pearl, MS, United States
Infecting large portions of the global poultry populations, the avian infectious bronchitis virus (IBV) remains a major economic burden in North America. With more than 30 serotypes globally distributed, Arkansas, Connecticut, Delaware, Georgia, and Massachusetts are among the most predominant serotypes in the United States. Even though vaccination is widely used, the high mutation rate exhibited by IBV is continuously triggering the emergence of new viral strains and hindering control and prevention measures. For that reason, targeted strategies based on constantly updated information on the IBV circulation are necessary. Here, we sampled IBV-infected farms from one US state and collected and analyzed 65 genetic sequences coming from three different lineages along with the immunization information of each sampled farm. Phylodynamic analyses showed that IBV dispersal velocity was 12.3 km/year. The majority of IBV infections appeared to have derived from the introduction of the Arkansas DPI serotype, and the Arkansas DPI and Georgia 13 were the predominant serotypes. When analyzed against IBV sequences collected across the United States and deposited in the GenBank database, the most likely viral origin of our sequences was from the states of Alabama, Georgia, and Delaware. Information about vaccination showed that the MILDVAC-MASS+ARK vaccine was applied on 26% of the farms. Using a publicly accessible open-source tool for real-time interactive tracking of pathogen spread and evolution, we analyzed the spatiotemporal spread of IBV and developed an online reporting dashboard. Overall, our work demonstrates how the combination of genetic and spatial information could be used to track the spread and evolution of poultry diseases, providing timely information to the industry. Our results could allow producers and veterinarians to monitor in near-real time the current IBV strain circulating, making it more informative, for example, in vaccination-related decisions.
Introduction
Infectious bronchitis is caused by the worldwide distributed avian gammacoronavirus infectious bronchitis virus (IBV) (1), a highly contagious disease that a?ects the respiratory, renal, and reproductive system of poultry (2). IBV is one of the most acute and highly contagious, most prevalent, and widely disseminated diseases affecting domestic birds (3). IBV is broadly distributed within commercial poultry operations (3), and its global economic impact has been estimated to be second after the highly pathogenic avian influenza (4). This virus circulates in the form of many, ever-changing variants, some of which are globally distributed, while others are found only in specific locations and countries (5). Vaccination for IBV has been shown to produce limited cross-protection among serotypes (6, 7); therefore, it is pivotal to timely monitor IBV strain circulations, while effective vaccination programs are the main control strategy the poultry industry utilizes. The information generated from diagnostic laboratories has been historically used to monitor disease spread on livestock (8, 9), mostly in swine (10–13), cattle (14–16), sheep (17), and goats (18). Likewise, several studies have been focused on studying the extent and prevalence of infectious diseases affecting wild birds, such as influenza A viruses (19–22), West Nile and Usutu virus (23, 24), and Newcastle disease virus (25). However, it has not been utilized to track non-reportable diseases in poultry populations, such as IBV infections. Therefore, sequence data generated from the diagnosis of diseases in poultry populations such as IBV could be used to track its spatial spread and evolution, contributing to the development of more timely and integrative control strategies against IBV. Knowledge about IBV circulation among flocks could help in outbreak investigations and provide relevant information for vaccination strategies (26–28). However, due to the continuous changes in poultry production, improvements in vaccine technologies, or the emergence of novel and recombinant field viruses among others, this information is never static and keeps changing regularly. Therefore, to attain meaningful interpretations and actionable results, there is a need to monitor the dynamics of viral spread. Recently, epidemiological models have been coupled with phylogenetic methods to track the spatial and temporal spread of infectious agents, promoting the development of phylodynamics (29–32). The importance of phylogeography and phylodynamics on characterizing the evolutionary history of IBV has been previously described, pointing out the direct impact of IBV control and poultry production (33–35). These fields have seen the development of analytical methods that now can take advantage of genetic data to characterize the spatiotemporal and evolutionary patterns of infectious diseases by reconstructing how pathogens spread across landscapes (36–39).
The development of modern data visualization platforms such as Nextstrain (40) allows the simultaneous analysis of phylogenetic, epidemiological, and geographic information (41). These tools have gained special importance, allowing us to understand the spread of viral diseases, such as Avian flu H7 (42), and most recently, the pandemic SARS-CoV-2 (43–45).
In this study, we explore the local dispersal of IBV within the poultry farms. We described the spatiotemporal spread and evolution of 132 IBV samples across one state of the United States and additionally built an interactive web visualization dashboard based on the Nextstrain platform. Our derivative of the Nextstrain platform provides a portal for complete phylodynamic analysis by research staff while affording producers' redacted views into the origins, spread, and phylodynamic analysis that preserve anonymity across producers who contribute samples for analysis but enable producers to learn valuable information about their operations.
Methods
Data
We gathered IBV isolates from 2016 to 2019 from 52 poultry farms in North Carolina. Oropharyngeal swab samples of sick birds were tested at the Mississippi Poultry Research and Diagnostic Laboratory (PRDL) (79 samples) or the North Carolina Veterinary Diagnostic Laboratory System (NCVDLS) (53 samples). In all cases, IBV presence was confirmed by real-time reverse transcriptase PCR (RTPCR) (46). From the positive samples, RNA extraction was performed, and the hypervariable region of the S1 gene was amplified and used for phylogenetic studies. For the PRDL samples, the viral RNA extraction and RT-PCR were conducted using the 5X MagMaxTM Pathogen RNA/DNA extraction kit of Applied Biosystems, as previously described (47). The primers used for the S1 gene amplification were NEWS1OLIGO5′ and S1OLIGO3′ that amplify a product ranging between positions 1,730 and 1,750 sequences and between positions 20,300 and 22,041—depending of the sequence (47). For the NCVDLS samples, the RNA was extracted using the Invitrogen TRIzol™ reagent according to the manufacturer guidelines (ThermoFisher Scientific, NY). The RT-PCR was conducted with the High-Capacity RNA-to-cDNA™ kit (ThermoFisher Scientific). The sequences for the RT-PCR were forward primer 5′TGCTTCCTTTATAGGCATCGGT3′ and reverse primer 5′GGAATGATGCCAAAGCACCC3′ that amplifies a 1,099-base sequence between positions 22,778 and 23,779, depending on the sequence. The cycling conditions for both primer sets were as previously described by Jackwood et al. (47). The only exception was that for the primers used for the NCVDLS samples, the annealing temperature was set at 55°C, and the elongation temperature was set at 72°C. The S1 amplicons were gel purified on a 1% agarose gel and sent to GenWiz for sequencing. Additionally, we collected the following information: farm location, serotype to which each sequence belongs, and all applied vaccines (Supplementary Table 1).
Sequences were aligned using Mega X, available at www.megasoftware.net (48). The recombination detection program (RDP) v4 was used to search for evidence of recombination within our dataset (49). The alignment was screened using six different methods (BootScan, Chimaera, MaxChi, RDP, 3Seq, and SiScan). We found four recombinant samples, which were removed from the downstream analysis, from those sequences: two were identified as serotype Georgia 98, and the remaining ones as Georgia 13 and Arkansas DPI. To determine whether there was a sufficient temporal molecular evolutionary signal of the IBV sequences, we used TempEst v1.5 (50). To calculate the P-values associated with the phylogenetic signal analysis, we used the approach described by Murray et al. (51) based on 1,000 random permutations of the sequence sampling dates (52). The relationship found between root-to-tip divergence and sampling dates (years) supported the use of molecular clock analysis in this study. Root-to-tip regression results supported a significant temporal signal (R2 = 0.43, p < 0.05).
To assess how our sequences relate to previously published sequences from other parts of the country, we used 35 IBV S1 gene sequence data from the United States collected from GenBank (53), available at https://www.ncbi.nlm.nih.gov/nucleotide/ (accession numbers found in (Supplementary Table 2).
Phylogeographic Analysis
Phylogenetic trees were estimated by Bayesian inference through Markov chain Monte Carlo (MCMC), implemented in BEAST v2.5.0 (54). By using ModelFinder (55) built into IQ-Tree version 1.6.1 (56), we compared different substitution models to find the one that showed the best fit for our genetic dataset. The marginal likelihood value supported the use of the general time-reversible model (HKY) with gamma-distributed rate heterogeneity plus a proportion of invariable sites (HKY + F + G4) (57) (Supplementary Table 3). Phylogeographic history of IBV dispersal was recovered from the obtained spatiotemporal phylogeny. Phylogenetic trees were generated by a discrete phylogeography estimation by Bayesian inference through Markov chain Monte Carlo (MCMC), implemented in BEAST v2.5.0 (54). Finally, we applied a separate Hasegawa–Kishino–Yano (HKY+G) (58) substitution model with gamma-distributed rate heterogeneity among sites (59).
Phylodynamic Analysis
Following the analytical framework described by Dellicour et al. (60) and using the R package “seraphim” (61), we extracted the spatiotemporal information from 100 input trees sampled at regular intervals from the post-burn-in posterior distribution to account for phylogenetic uncertainty (62, 63). Each phylogenetic branch was then summarized and represented as a distinct vector defined by its start and end location and dates (60, 61), converting each of these branches in a representation of an independent viral lineage dispersal event (62, 64).
To determine the effect of different predictors in the spread of IBV, we collected the outputs generated by the previous continuous phylogeographic analysis, then used the analytical framework developed by Dellicour et al. (60), considering a continuous location approach (based on the geographic coordinate location of each poultry farm) and a random walk diffusion model. Spatiotemporal information was extracted from 100 trees sampled at regular intervals from the posterior distribution (after burn-in) to account for phylogenetic uncertainty. Each phylogenetic branch was considered a vector defined by its start and end location (latitude and longitude), and its start and end dates. Thus, each phylogenetic branch represents a conditionally independent viral lineage dispersal event (64). Statistical significance for the correlation between phylogenetic and predictive factors was tested using 100 trees generated and expressed in the form of Bayes factors (BF) (60). We approximated a BF value for each combination of predictors tested. For the interpretation of BF values, predictive factors were treated either as a conductance (variables that promote the spread of the disease) or a resistance factor (variables that impede its spread), then we used (65) to determine the level of impact of each variable on the spread of IBV. Therefore, BF values between 3 and 20 were considered “positive,” values between 201 and 50 were considered “strong,” and values >150 were considered “very strong” (65). This analysis was performed using the R package “seraphim” version 1.0 (61). Thus, we included the environmental condition of each farm location here represented by the annual temperature, annual precipitation, elevation, runoff (an index of the quantity of water discharged in surface streams), wetness index (commonly used to quantify topographic control on hydrological processes) (66), enhanced vegetation index (EVI) (widely used to quantify vegetation greenness), chicken density, and distance to the main roads (Figure 1 and Supplementary Table 4 for more details). Briefly, the distance between each farm (geographic coordinates) to the nearest main roads was calculated based on the Euclidean distances.
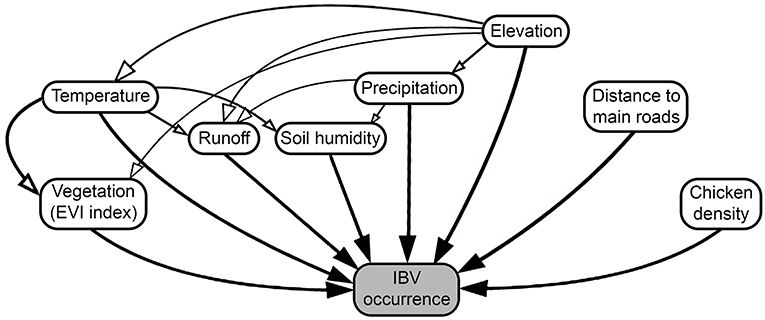
Figure 1. Diagram of factors promoting or restricting infectious bronchitis virus (IBV) between-farm dispersion. Arrows represent the relationship between the predictor and IBV occurrences, where white arrows represent indirect, and black arrows direct relationships.
Near Real-Time Visualization
To visualize the evolution and spread of IBV in an interactive tool that allows for near real-time updates using phylogenetic, spatial, and epidemic information based on outbreak data (Supplementary Table 5), we used Nextstrain (https://nextstrain.org) (40). IBV sequences were processed in Nextstrain's platform using the Augur bioinformatics toolkit (augur) (67) and visualized using Auspice (https://github.com/nextstrain/auspice) (68). Auspice is designed to provide a detailed view of the results of the Augur analysis. This level of detail is appropriate for researchers studying population and geographic trends but may provide more information than producers contributing viral samples are willing to share more broadly. To balance between the needs of detailed analyses and a desire to preserve producers' anonymity, we modified Auspice to automatically redact certain details based on users' access rights we defined (Figure 2).
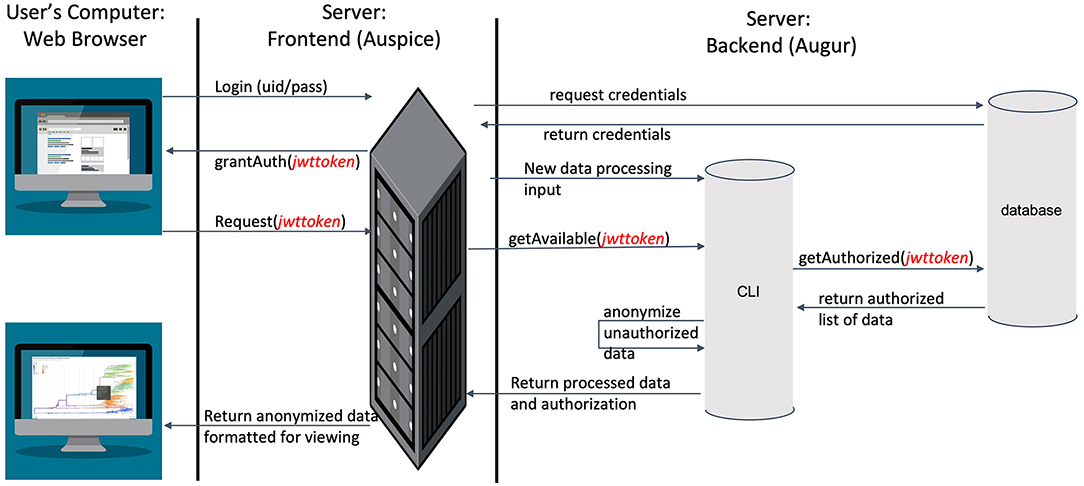
Figure 2. An overview of the modified Nextstrain architecture, leveraging industry-standard SSL encryption, JSON web tokens for identity management, and separate servers for web hosting and data storage to ensure information security.
In the modified dashboard (Figure 2), each dataset has three levels of access. A user has (1) unrestricted access to the data visualization, (2) complete data visualization without location data, and/or (3) no access to the data visualization. After a user registers a new account with the system, the project staff grants full access to the data they provide (level 1), and redacted access to data provided by other producers (level 2) (Figure 3) is an overview of the process by which users' access is verified and data anonymity is ensured. When a user logs in, a set of authorization credentials are retrieved from a database located on a separate server, and a list of available data sets are returned for display in the user's browser. In addition, a JSON Web Token (JWT) (69) is created for the user, which cryptographically encodes their access in a secure data structure and allows the system to verify access.
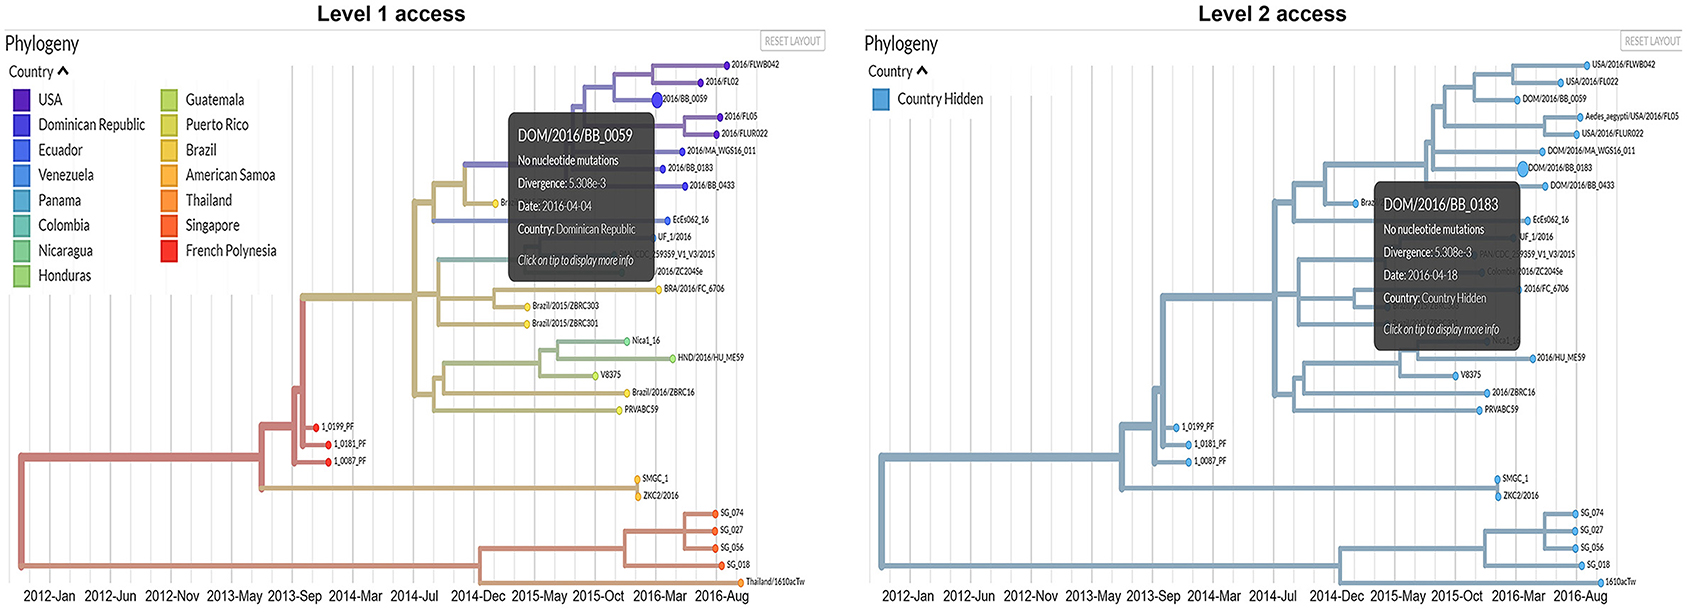
Figure 3. Comparison between the information that will be available for users with level 1 and level 2 access permissions.
The user is then able to request the visualization for any data set they have access to by clicking the link in their browser. The resulting REST API request is made via the Auspice web server, which is then routed to the Auspice CLI backend where the JWT is used as a unique identifier in the database to determine the level of access. For datasets that users have level 2 access to, the backend server redacts all location and sensitive information prior to returning the response to the frontend web server—no sensitive information is allowed to leave the backend server if a user is unauthorized to view it. The visualization information is then returned from the frontend web server to the client where their browser renders it for viewing. Figure 3 below illustrates the difference between levels 1 and 2 access visualizations.
This architecture is designed specifically to enhance data security and preserve anonymity. First, by leveraging industry-standard JWT technology to cryptographically sign identity verification, we can ensure that individuals requesting data are rightfully accessing it. Second, by separating the frontend and backend servers, we are able to leverage strict isolation between the data (which resides on the backend server) and any publically available services (which reside on the frontend server). Strict firewall and access policies ensure the backend server has a far lower attack surface. Furthermore, this separation ensures that when data leaves the backend server, they are already anonymized before going out over the Internet, providing an additional layer of security beyond that provided by SSL encryption for all web traffic.
Results
The results of the phylogeographic analyses estimated the time of the most recent common ancestor for the studied IBV sequences as between 2005 and 2006. The ancestral reconstruction showed that the most likely strain of origin in North Carolina poultry farms was Arkansas DPI, with a root state posterior probability (RSPP) = 0.68, followed by Georgia 13 (RSPP = 0.24), and Georgia 98 (RSPP = 0.09) (Figure 4A). Phylodynamic patterns of IBV spread, visualized through SkyGrid plot, showed a constant decrease in the relative genetic diversity that has been maintained until March 2019 (Figure 4B). Spatiotemporal analysis of the analyzed sequences showed an estimated median value for the mean branch velocity of 12.3 km/year (95% highest posterior density HPD = 2.7–31.1).
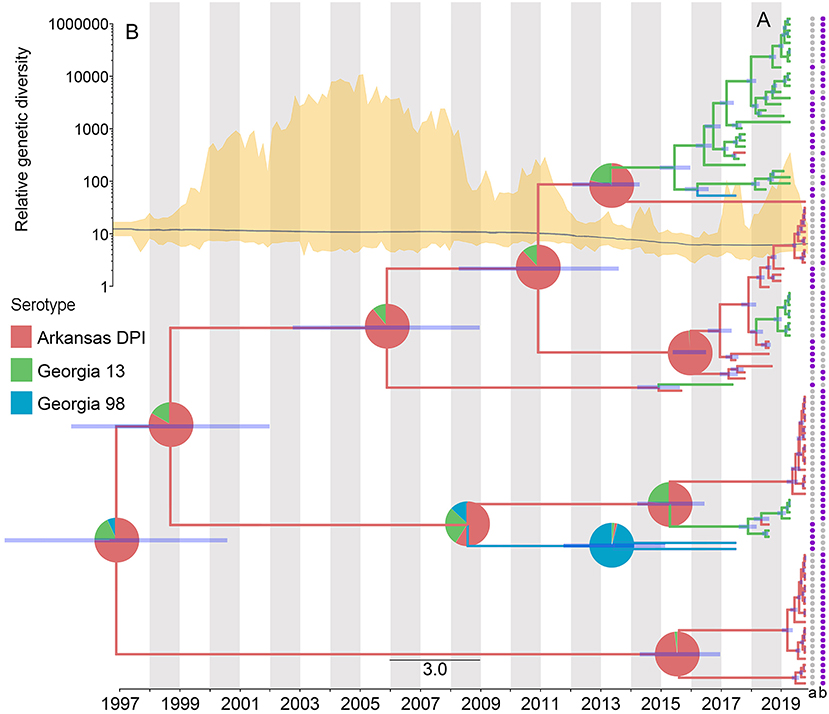
Figure 4. Dispersal history of IBV lineages, as inferred by discrete phylogeographic analysis. (A) Maximum clade credibility phylogeny colored according to the IBV strain to which each sequence belongs. Branch bars represent posterior probabilities of branching events (P > 0.95). The probabilities of ancestral states (inferred from the Bayesian discrete trait analysis) are shown in pie charts on each node, representing the most likely IBV strain. Purple points at the end of the phylogenetic tips represent the applied vaccine on the farm where the sequences were collected, where a = MILDVAC-MASS+ARK, and b = Data not available. (B) Spatiotemporal patterns in the relative genetic diversity represented through the Bayesian SkyGrid plot (yellow); the mean estimate is represented by the dark line, while the shaded light yellow regions correspond to the 95% highest posterior density (HPD), and in the left, the y-axis shows the number of sampled sequences over time.
The vaccination program carried out on the farms was not specified for most of the collected sequences (74.5%). However, from the ones with available information (25.5%), MILDVAC-MASS + ARK was the vaccine that was applied on all farms (Figure 4A).
Phylogeographic Diffusion in a National Context
In addition, we confronted our samples with publicly available S1 gene IBV information nationwide (Figure 5). We found that 67% of our sequences appear widely distributed through the IBV phylogeny, while 43% is divided into three clusters showing a close relationship with sequences coming from Alabama, Georgia, and Delaware IBV sequences. On the other hand, sequences from California were the most genetically distant from the ones generated in this study. Interestingly, sequences previously collected in North Carolina (70) were more similar to sequences from other eastern states than with the sequences analyzed in this study (Figure 5).
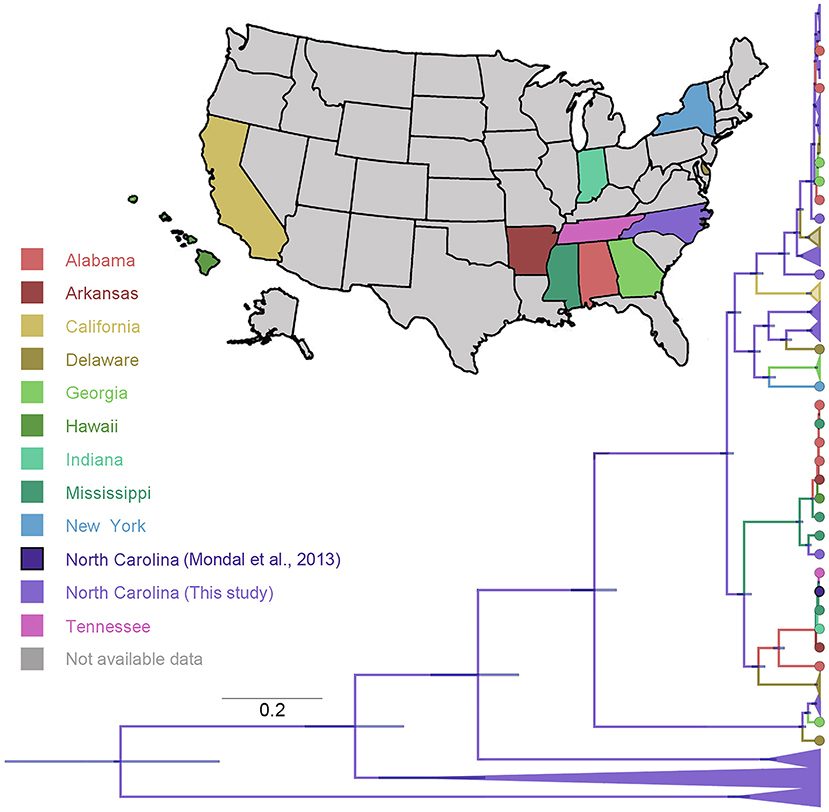
Figure 5. Phylogenetic reconstruction of IBV comparing the data generated in this study with data available of IBV sequences collected in the United States and available in GenBank (53). The maximum clade credibility phylogeny is colored according to the states of origin. Branch bars represent posterior probabilities of branching events (P > 0.95).
Factors Promoting or Restricting Infectious Bronchitis Virus Dissemination
To quantify the impact of the proposed factor on IBV distribution (Figure 1), we calculated the association between lineage duration and each covariate scaled distance through the Q statistic method. Our results showed that two of the variables analyzed, precipitation and runoff, had positive Q values when they were treated as resistance factors. However, they did not show enough predictive Bayes factor support; therefore, these variables should not be considered as good predictors for IBV dissemination (Table 1).
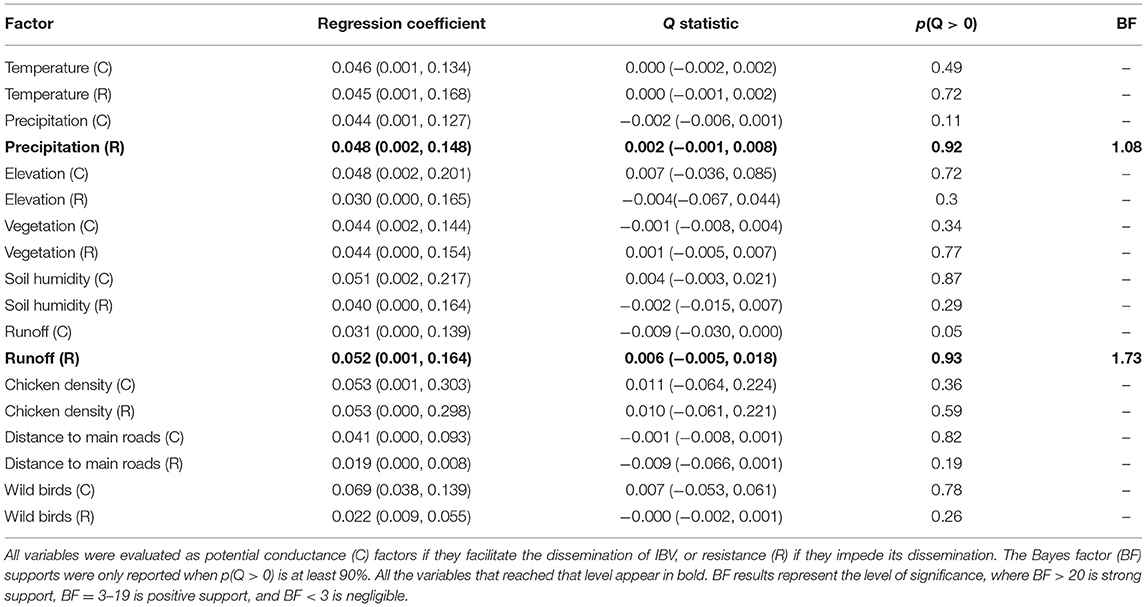
Table 1. List of factors promoting or restricting predictors of infectious bronchitis virus (IBV) dissemination.
Near Real-Time Visualization of Infectious Bronchitis Virus Spread Using the Nextstrain Platform
Nextstrain is a publicly accessible open-source tool that can be used for near real-time interactive tracking of pathogen spread and evolution (40). We utilized the Nextstrain platform to host our previous phylogeographic analysis. Our results, based on 31 sequences, showed that the most likely serotype of origin of IBV was Arkansas DPI, which started its spread from Jacksonville city through the state of North Carolina in all directions. This diffusion has shown to occur mostly through long-distance movements. Our results also evidenced that even when we can observe some clusters of similar serotypes in the evolutionary dimension (left panel), it is not possible to observe a clear pattern in the serotype distribution in the geographic space (right panel) (Figure 6).
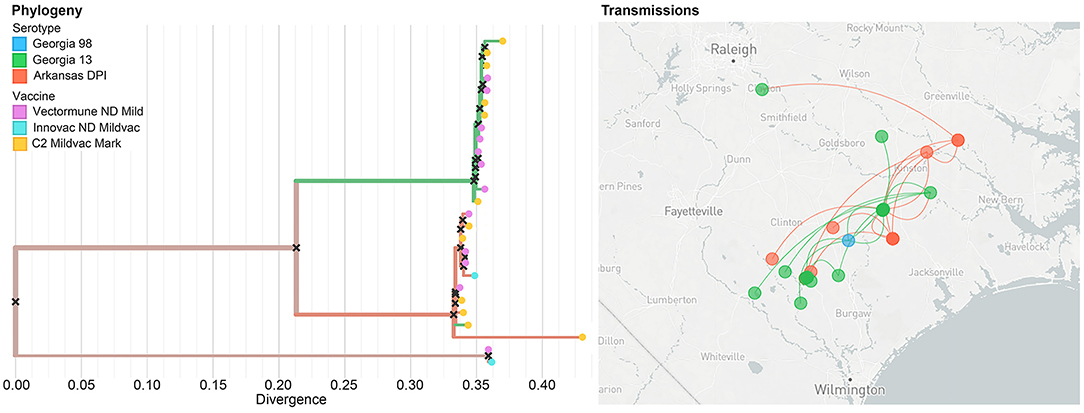
Figure 6. Example of the unrestricted access to the data visualization (level 1) showing the phylogeographic spread of IBV within the study area. The colors of the branches on the phylogenetic tree (left panel), as well as in the points on the map (right panel) represent different strains. In the left panel, dots at the end of the phylogenetic tree represent the vaccine that has been applied in the farms where the IBV has been collected.
Discussion
Several widely distributed IBV serotypes have been identified globally (5, 71). In the United States alone, numerous IBV serotypes have been described after the first report in the early 1930s, such as Georgia, Massachusetts, Arkansas, Connecticut, SE17, and Delaware (47, 70, 72). These studies also demonstrated the existence of a high diversity of IBV strains that were circulating across US farms for more than 60 years (73, 74).
The spike protein, and in particular the S1 subunit, of IBV determines viral tropism. It is the attachment protein that interacts with the receptor molecules on host cells. It is the major viral antigen-stimulating humoral and cell-mediated immunity. It is subject to evolutive changes, and it is highly variable among different serotypes and subtypes. Therefore, most of the genotyping procedures are based on the S1 gene sequencing (71).
Our phylogeographic analysis based on publicly available IBV S1 gene sequences showed that this diversity is mostly concentrated in the eastern part of the United States. Furthermore, this diversity is consistent with the density of poultry farms in the country (75). Likewise, we showed that the most likely ancestral IBV serotype for the studied farms was Arkansas DPI, which has shown to be widely distributed across the study area. This spatial clustering of IBV serotypes evidenced a homogeneous distribution, similar to what was shown by serotype Georgia 13. These broad distributions and continuous presence over time support the hypothesis of Jackwood et al. (76), who proposed that high persistence of Arkansas serotype could be explained by partial protection for that IBV type in the currently used vaccines. This may represent a significant issue since Arkansas type has demonstrated to be quite prone to genetic drift, which could potentially trigger the emergence of unique variants of the IBV virus (77).
Two different primer sets were used for the samples because the S1 gene could not be amplified with the primer set published by Jackwood et al. (47); therefore, a new set of primers was designed. Since two different sets of primers that amplified two non-overlapping segments along the IBV genome were used in this study, the conclusions regarding the phylogenetic analysis should be interpreted considering that the variability provided the different locations of the two sets of amplified segments yield by using two different sets of primers.
One of the main reasons for a pathogen to disseminate through long distances depends directly on its ability to be transported between flocks (78–80). The spread velocity of IBV based on the sequences collected in this study (12.3 km/year) was remarkably lower than that exhibited by other avian diseases, such as highly pathogenic avian influenza virus (HPAIV) subtype H5N1 in Indonesia (325 km/year) (81). These differences in the dissemination of both avian viruses could be related to its mechanisms of transmission, in the case of IBV, mainly mediated by human movement (82, 83), while H5N1 HPAIV avian influenza is mostly triggered by bird migrations (84–87). Previous studies highlighted the importance of airborne spread among nearby farms (88–90); however, more evidence shows that direct contact between birds or with contaminated material and other equipment is common and could indeed be related with between-flock dissemination (91). Further studies are needed to better understand the role of unexplored modes of between-flock transmissions, which also could include indirect contacts among farms, such as the networks formed by food delivery trucks and farm visits, which remains poorly documented (92–94). When we compared sequences from North Carolina to IBV S1 gene sequences collected across the United States for the last 5 years, we observed that 67% of them were genetically related to sequences from other regions such as Alabama, Georgia, and Delaware. The remaining 43% were clustered in three clear groups within North Carolina. Contrasting our results with those of Mondal et al. (70), it is interesting to notice how North Carolina samples from the 1960s are more similar to the sequences found in other states than to the samples sequenced for this study, showing quantitatively IBV genetic variation over time. This variation may be explained by the high accumulation of mutations and recombination events in its viral genome that triggers the emergence of distinct IBV variants (74, 95, 96); however, more studies are needed before better inferences are made.
On the other hand, our phylodynamic model showed no significant covariates for the spread of IBV, which we hypothesized could be directly related to the limited amount of data that was available. This limitation could be surpassed through the collaboration between the poultry industry and researchers to generate more epidemiological and genetic data during future IBV outbreaks.
Near Real-Time Visualization of Infectious Bronchitis Virus
In recent years, phylodynamics has become a useful approach to study pathogen geographic and evolutionary patterns (97, 98). One of the most recent and impactful examples of how such analysis can be applied to monitor the global SARS-CoV-2 pandemic (REF) that has helped to understand and evaluate the velocity of transmission and diversification of a novel virus worldwide due to the update and release of information in the mentioned near real-time format (99–101). This availability of data has not only helped to study and analyze the diversification ability of the virus in a remarkably short period of time but has also been used to understand its transmission patterns and propose potentially control measures accordingly. In the era of data science, changes in the field of epidemiology have promoted the emergence of a new research area known as outbreak analytics (41), which is rapidly increasing the available scientific knowledge about evolution, geographic spread, and epidemic patterns of several well-known pathogens (42, 102–105). Here, we have shown that the Nextstrain platform could be utilized to monitor the spread of IBV, helping to guide control activities in the field such as informing stakeholders about new viral emergence events and correlate current strain to vaccination strategies.
Implications for the Poultry Industry
Historically, the most efficient way to prevent and control IBV relied on the use of both inactivated and attenuated live vaccines, which depends on informed decisions regarding the serotypes that are circulating in the field (27). Interestingly, we found that although IBV showed to be suffering an overall gradual decrease in its relative genetic diversity, and despite the known high variability of IBV serotypes found in the field (91), only a few strains are being used as attenuated live vaccines by the poultry industry (106), with Massachusetts (Mass) as the most widely applied (27), which does not provide the necessary cross-protection against IBV. In North Carolina, the currently applied vaccine is MILDVAC-MASS+ARK, which offers coverage against the IBV serotypes Arkansas and Massachusetts (107, 108). However, based on our study, the currently circulating IBV strains in North Carolina are mostly Arkansas DPI, Georgia 13, and Georgia 98, and therefore, the currently applied vaccine is probably not providing sufficient protection against serotypes Georgia 13 and Georgia 98.
Further comparative residue substitution analyses among vaccine and field-originated strains are warranted to better elucidate protection failure or escape mutants. In this study, a number of sequences were collected; however, comprehensive information about the vaccine strains and vaccination programs is needed, and this kind of analyses were not possible to conduct with the information available. Our analyses provide valuable information on the dynamics of IBV field strains and the protection elicited by commercial vaccines. However, vaccination is the only accurate way to determine the degree of protection induced by vaccines is by conducting vaccination and challenge studies in birds. This will give you a better idea on the real protection.
In this study, we provided the stakeholders with an alternative platform via Nextstrain, which provides updated information about IBV serotype circulation and the needed information to ensure targeted vaccination and efficient protection against current IBV serotypes.
Conclusion
In summary, we have shown an asymmetric pattern in the phylogeographic relationships exhibited by IBV serotypes identified in North Carolina, which imposes a continuous challenge to IBV control. Using the Nextstrain platform, this study provides a near real-time tool for tracking spread in North Carolina, where the collaboration between producers and researchers was the key to gather up-to-date IBV epidemiological information, maintaining the data confidentiality. Thus, accessible visualization tools for the general public represent a powerful tool to ensure adequate stakeholder decision making and government applications to reduce the impact of the disease via targeted control strategies.
Data Availability Statement
The datasets presented in this study can be found in online repositories. The names of the repository/repositories and accession number(s) can be found in the article/supplementary material.
Author Contributions
RC and GM conceived the paper ideas. MJ, RC, and GM participated in the design of the study. RC and AB coordinated the IBV sequence data collection. MJ conducted data processing and cleaning. MJ performed the phylogeographic analysis. DR and AC designed and implemented the different security levels that accompanied Nextstrain visualization. MJ, RC, DR, AC, AB, and GM wrote and edited the manuscript. All authors discussed the results and critically reviewed the manuscript.
Funding
The primary funding support of the project is from the Research and Innovation Seed Funding (RISF) at the North Carolina State University.
Conflict of Interest
The authors declare that the research was conducted in the absence of any commercial or financial relationships that could be construed as a potential conflict of interest.
Acknowledgments
The authors would like to acknowledge participating in poultry production systems and veterinarians. We also acknowledge Dr. David Rasmussen for his help during the design of this project.
Supplementary Material
The Supplementary Material for this article can be found online at: https://www.frontiersin.org/articles/10.3389/fvets.2021.624233/full#supplementary-material
References
1. Van Roekel H, Clarke MK, Bullis KL, Olesiuk OM, Sperling FG. Infectious bronchitis. Am J Vet Res. (1951) 12:140–6.
2. de Wit JJS, Cook JKA. Spotlight on avian pathology: infectious bronchitis virus. Avian Pathol. (2019) 48:393–5. doi: 10.1080/03079457.2019.1617400
3. Cook JKA, Jackwood M, Jones RC. The long view: 40 years of infectious bronchitis research. Avian Pathol. (2012) 41:239–50. doi: 10.1080/03079457.2012.680432
4. World Bank. Livestock Disease Atlas: A Quantitative Analysis of Global Animal Health Data (2006-2009). (2011). Available online at: http://www.oie.int/doc/en_document.php?numrec=4063003 (accessed October 27, 2020).
5. de Wit JJS, Cook JKA, van der Heijden HMJF. Infectious bronchitis virus variants: a review of the history, current situation and control measures. Avian Pathol. (2011) 40:223–35. doi: 10.1080/03079457.2011.566260
6. Jackwood MW. Review of infectious bronchitis virus around the world. Avian Dis. (2012) 56:634–41. doi: 10.1637/10227-043012-Review.1
7. Eldemery F, Li Y, Yu Q, Van Santen VL, Toro H. Infectious bronchitis virus S2 of 4/91 expressed from recombinant virus does not protect against ark-type challenge. Avian Dis. (2017) 61:397–401. doi: 10.1637/11632-032017-ResNoteR
8. Dohoo IR. Monitoring livestock health and production: service-epidemiology's last frontier? Prev Vet Med. (1993) 18:43–52. doi: 10.1016/0167-5877(93)90092-8
9. Greger M. Industrial animal agriculture's role in the emergence and spread of disease. In: D'Silva J, Webster J, editors. The Meat Crisis: Developing More Sustainable and Ethical Production and Consumption, 2nd ed. London: Published by Earthscan LTD. (2010). p. 161–72.
10. Alkhamis MA, Arruda AG, Morrison RB, Perez AM. Novel approaches for spatial and molecular surveillance of Porcine Reproductive and Respiratory Syndrome Virus (PRRSv) in the United States. Sci Rep. (2017) 7:4343. doi: 10.1038/s41598-017-04628-2
11. Arruda AG, Sanhueza J, Corzo C, Vilalta C. Assessment of area spread of porcine reproductive and respiratory syndrome (PRRS) virus in three clusters of swine farms. Transbound Emerg Dis. (2018) 65:1282–9. doi: 10.1111/tbed.12875
12. Machado G, Vilalta C, Recamonde-Mendoza M, Corzo C, Torremorell M, Perez A, et al. Identifying outbreaks of Porcine Epidemic Diarrhea virus through animal movements and spatial neighborhoods. Sci Rep. (2019) 9:457. doi: 10.1038/s41598-018-36934-8
13. Jara M, Rasmussen D, Corzo CA, Machado G. Porcine reproductive and respiratory syndrome virus dissemination across pig production systems in the United States. Transbound Emerg Dis. (2020) 17. doi: 10.1111/tbed.13728. [Epub ahead of print].
14. Ridpath JF, Neill JD, Frey M, Landgraf JG. Phylogenetic, antigenic and clinical characterization of type 2 BVDV from North America. Vet Microbiol. (2000) 145–55. doi: 10.1016/S0378-1135(00)00271-6
15. Bárcenas-Reyes I, Loza-Rubio E, Cantó-Alarcón GJ, Luna-Cozar J, Enríquez-Vázquez A, Barrón-Rodríguez RJ, et al. Whole genome sequence phylogenetic analysis of four Mexican rabies viruses isolated from cattle. Res Vet Sci. (2017) 113:21–4. doi: 10.1016/j.rvsc.2017.08.004
16. Jamal SM, Belsham GJ. Molecular epidemiology, evolution and phylogeny of foot-and-mouth disease virus. Infect Genet Evol. (2018) 59:84–98. doi: 10.1016/j.meegid.2018.01.020
17. Bhanuprakash V, Indrani BK, Hosamani M, Singh RK. The current status of sheep pox disease. Comp Immunol Microbiol Infect Dis. (2006) 29:27–60. doi: 10.1016/j.cimid.2005.12.001
18. Krasteva S, Jara M, Frias-De-Diego A, Machado G. Nairobi Sheep Disease Virus: a historical and epidemiological perspective. Front Vet Sci. (2020) 7:419. doi: 10.3389/fvets.2020.00419
19. Abolnik C. Molecular characterization of H5N2 avian influenza viruses isolated from South African ostriches in 2006. Avian Dis. (2007) 51:873–9. doi: 10.1637/7953-022107-REGR.1
20. Abolnik C, Gerdes GH, Sinclair M, Ganzevoort BW, Kitching JP, Burger CE, et al. Phylogenetic analysis of influenza A viruses (H6N8, H1N8, H4N2, H9N2, H10N7) isolated from wild birds, ducks, and ostriches in South Africa from 2007 to 2009. Avian Dis. (2010) 54:313–22. doi: 10.1637/8781-040109-Reg.1
21. Miller RS, Sweeney SJ, Akkina JE, Saito EK. Potential Intercontinental Movement of Influenza A(H7N9) Virus into North America by Wild Birds: application of a Rapid Assessment Framework. Transbound Emerg Dis. (2015) 62:650–68. doi: 10.1111/tbed.12213
22. Herrick KA. Predictive Modelling of Avian Influenza in Wild Birds. (2013). Available online at: https://scholarworks.alaska.edu/handle/11122/1837 (Accessed October 28, 2020).
23. Reisen W, Lothrop H, Chiles R, Madon M, Cossen C, Woods L, et al. West Nile virus in California. Emerg Infect Dis. (2004) 10:1369–78. doi: 10.3201/eid1008.040077
24. Vilibic-Cavlek T, Savic V, Sabadi D, Peric L, Barbic L, Klobucar A, et al. Prevalence and molecular epidemiology of West Nile and Usutu virus infections in Croatia in the ‘One health’ context, 2018. Transbound Emerg Dis. (2019) 66:1946–57. doi: 10.1111/tbed.13225
25. Hoque MA, Burgess GW, Karo-Karo D, Cheam AL, Skerratt LF. Monitoring of wild birds for Newcastle disease virus in north Queensland, Australia. Prev Vet Med. (2012) 103:49–62. doi: 10.1016/j.prevetmed.2011.08.013
26. Leyson CLM, Jordan BJ, Jackwood MW. Insights from molecular structure predictions of the infectious bronchitis virus S1 spike glycoprotein. Infect Genet Evol. (2016) 46:124–9. doi: 10.1016/j.meegid.2016.11.006
27. Jordan B. Vaccination against infectious bronchitis virus: a continuous challenge. Vet Microbiol. (2017) 206:137–43. doi: 10.1016/j.vetmic.2017.01.002
28. Li J, Helal ZH, Karch CP, Mishra N, Girshick T, Garmendia A, et al. A self-adjuvanted nanoparticle based vaccine against infectious bronchitis virus. PLoS ONE. (2018) 13:e0203771. doi: 10.1371/journal.pone.0203771
29. Volz EM, Ndembi N, Nowak R, Kijak GH, Idoko J, Dakum P, et al. Phylodynamic analysis to inform prevention efforts in mixed HIV epidemics. Virus Evol. (2017) 3:vex014. doi: 10.1093/ve/vex014
30. Rasmussen DA, Wilkinson E, Vandormael A, Tanser F, Pillay D, Stadler T, et al. Tracking external introductions of HIV using phylodynamics reveals a major source of infections in rural KwaZulu-Natal, South Africa. Virus Evol. (2018) 4:vey037. doi: 10.1093/ve/vey037
31. Dellicour S, Troupin C, Jahanbakhsh F, Salama A, Massoudi S, Moghaddam MK, et al. Using phylogeographic approaches to analyse the dispersal history, velocity and direction of viral lineages - application to rabies virus spread in Iran. Mol Ecol. (2019) 28:4335–50. doi: 10.1111/mec.15222
32. Rasmussen DA, Stadler T. Coupling adaptive molecular evolution to phylodynamics using fitness-dependent birth-death models. Elife. (2019) 8:e43533. doi: 10.7554/eLife.45562.014
33. Durães-Carvalho R, Caserta LC, Barnabé ACS, Martini MC, Simas PVM, Santos MMB, et al. Phylogenetic and phylogeographic mapping of the avian coronavirus spike protein-encoding gene in wild and synanthropic birds. Virus Res. (2015) 201:101–12. doi: 10.1016/j.virusres.2015.03.002
34. Franzo G, Massi P, Tucciarone CM, Barbieri I, Tosi G, Fiorentini L, et al. Think globally, act locally: phylodynamic reconstruction of infectious bronchitis virus (IBV) QX genotype (GI-19 lineage) reveals different population dynamics and spreading patterns when evaluated on different epidemiological scales. PLoS ONE. (2017) 12:e0184401. doi: 10.1371/journal.pone.0184401
35. de Fraga AP, Gräf T, Pereira CS, Ikuta N, Fonseca ASK, Lunge VR. Phylodynamic analysis and molecular diversity of the avian infectious bronchitis virus of chickens in Brazil. Infect Genet Evol. (2018) 61:77–83. doi: 10.1016/j.meegid.2018.03.014
36. Galvani AP. Epidemiology meets evolutionary ecology. Trends Ecol Evol. (2003) 18:132–9. doi: 10.1016/S0169-5347(02)00050-2
37. Volz EM, Koelle K, Bedford T. Viral phylodynamics. PLoS Comput Biol. (2013) 9:e1002947. doi: 10.1371/journal.pcbi.1002947
38. Rasmussen DA, Volz EM, Koelle K. Phylodynamic inference for structured epidemiological models. PLoS Comput Biol. (2014) 10:e1003570. doi: 10.1371/journal.pcbi.1003570
39. Biek R, Pybus OG, Lloyd-Smith JO, Didelot X. Measurably evolving pathogens in the genomic era. Trends Ecol Evol. (2015) 30:306–13. doi: 10.1016/j.tree.2015.03.009
40. Hadfield J, Megill C, Bell SM, Huddleston J, Potter B, Callender C, et al. NextStrain: real-time tracking of pathogen evolution. Bioinformatics. (2018) 34:4121–3. doi: 10.1093/bioinformatics/bty407
41. Polonsky JA, Baidjoe A, Kamvar ZN, Cori A, Durski K, John Edmunds W, et al. Outbreak analytics: a developing data science for informing the response to emerging pathogens. Philos Trans R Soc B Biol Sci. (2019) 374:20180276. doi: 10.1098/rstb.2018.0276
42. Naguib MM, Verhagen JH, Mostafa A, Wille M, Li R, Graaf A, et al. Global patterns of avian influenza A (H7): virus evolution and zoonotic threats. FEMS Microbiol Rev. (2019) 43:608–21. doi: 10.1093/femsre/fuz019
43. Brufsky A. Distinct viral clades of SARS-CoV-2: implications for modeling of viral spread. J Med Virol. (2020) 92:1386–90. doi: 10.1002/jmv.25902
44. Korber B, Fischer W, Gnanakaran S, Cell HY. Tracking changes in SARS-CoV-2 spike: evidence that D614G increases infectivity of the COVID-19 virus. Cell. (2020) 182:812–27. doi: 10.1016/j.cell.2020.06.043
45. Laha S, Chakraborty J, Das S, Manna SK, Biswas S, Chatterjee R. Characterizations of SARS-CoV-2 mutational profile, spike protein stability and viral transmission. Infect Genet Evol. (2020) 85:1348–567. doi: 10.1016/j.meegid.2020.104445
46. Callison SA, Hilt DA, Boynton TO, Sample BF, Robison R, Swayne DE, et al. Development and evaluation of a real-time Taqman RT-PCR assay for the detection of infectious bronchitis virus from infected chickens. J Virol Methods. (2006) 138:60–5. doi: 10.1016/j.jviromet.2006.07.018
47. Jackwood MW, Hilt DA, Lee CW, Hyuk MK, Callison SA, Moore KM, et al. Data from 11 years of molecular typing infections bronchitis virus field isolates. Avian Dis. (2005) 49:614–8. doi: 10.1637/7389-052905R.1
48. Kumar S, Stecher G, Li M, Knyaz C, Tamura K. MEGA X: Molecular Evolutionary Genetics Analysis across computing platforms | Molecular Biology and Evolution | Oxford Academic. Mol Biol Evol. (2018) 35:1547–9. doi: 10.1093/molbev/msy096
49. Martin DP, Murrell B, Golden M, Khoosal A, Muhire B. RDP4: detection and analysis of recombination patterns in virus genomes. Virus Evol. (2015) 1:vev003. doi: 10.1093/ve/vev003
50. Rambaut A, Lam T, Max Carvalho L, Pybus O. Exploring the temporal structure of heterochronous sequences using TempEst (formerly Path-O-Gen). Virus Evol. (2016) 2:vew007. doi: 10.1093/ve/vew007
51. Murray GGR, Wang F, Harrison EM, Paterson GK, Mather AE, Harris SR, et al. The effect of genetic structure on molecular dating and tests for temporal signal. Methods Ecol Evol. (2016) 7:80–9. doi: 10.1111/2041-210X.12466
52. Navascués M, Depaulis F, Emerson B. Combining contemporary and ancient DNA in population genetic and phylogeographical studies. Mol Ecol Resour. (2010) 10:760–72. doi: 10.1111/j.1755-0998.2010.02895.x
53. Wheeler DL, Barrett T, Benson DA, Bryant SH, Canese K, Chetvernin V, et al. Database resources of the National Center for Biotechnology Information. Nucleic Acids Res. (2008) 36:13–21. doi: 10.1093/nar/gkm1000
54. Bouckaert R, Heled J, Kühnert D, Vaughan T, Wu CH, Xie D, et al. BEAST 2: a software platform for Bayesian evolutionary analysis. PLoS Comput Biol. (2014) 10:e1003537. doi: 10.1371/journal.pcbi.1003537
55. Kalyaanamoorthy S, Minh BQ, Wong TKF, von Haeseler A, Jermiin LS. ModelFinder: fast model selection for accurate phylogenetic estimates. Nat Methods (2017) 14:587–9. doi: 10.1038/nmeth.4285
56. Nguyen LT, Schmidt HA, Von Haeseler A, Minh BQ. IQ-TREE: a fast and effective stochastic algorithm for estimating maximum-likelihood phylogenies. Mol Biol Evol. (2015) 32:268–74. doi: 10.1093/molbev/msu300
57. Tavaré S. Some probabilistic and statistical problems in the analysis of dna sequences. Lect Math Life Sci. (1986) 17:57–86.
58. Hasegawa M, Kishino H, Yano T. Dating of the human-ape splitting by a molecular clock of mitochondrial DNA. J Mol Evol. (1985) 22:160–74. doi: 10.1007/BF02101694
59. Shapiro B, Rambaut A, Drummond AJ. Choosing appropriate substitution models for the phylogenetic analysis of protein-coding sequences. Academicoupcom. (2006) 23:7–9. doi: 10.1093/molbev/msj021
60. Dellicour S, Rose R, Pybus OG. Explaining the geographic spread of emerging epidemics: a framework for comparing viral phylogenies and environmental landscape data. BMC Bioinformatics. (2016) 17:82. doi: 10.1186/s12859-016-0924-x
61. Dellicour S, Rose R, Faria NR, Lemey P, Pybus OG. SERAPHIM: studying environmental rasters and phylogenetically informed movements. Bioinformatics. (2016) 32:3204–6. doi: 10.1093/bioinformatics/btw384
62. Laenen L, Dellicour S, Vergote V, Nauwelaers I, De Coster S, Verbeeck I, et al. Spatio-temporal analysis of Nova virus, a divergent hantavirus circulating in the European mole in Belgium. Mol Ecol. (2016) 25:5994–6008. doi: 10.1111/mec.13887
63. Dellicour S, Vrancken B, Trovão NS, Fargette D, Lemey P. On the importance of negative controls in viral landscape phylogeography. Virus Evol. (2018) 4:vey023. doi: 10.1093/ve/vey023
64. Pybus O, Suchard M, Lemey P, Bernardin F, Rambaut A, Crawford F, et al. Unifying the spatial epidemiology and molecular evolution of emerging epidemics. Natl Acad Sci. (2012) 109:1–6. doi: 10.1073/pnas.1206598109
65. Kass RE, Raftery AE. Bayes factors. J Am Stat Assoc. (1995) 90:773–95. doi: 10.1080/01621459.1995.10476572
66. Sørensen R, Zinko U, Seibert J. On the Calculation of the Topographic Wetness Index: Evaluation of Different Methods Based on Field Observations On the Calculation of the Topographic Wetness Index: Evaluation of Different Methods Based on Field Observations Evaluation of TWI Calculation. (2005). Available online at: www.copernicus.org/EGU/hess/hessd/ (accessed March 2, 2020).
67. Billion A, Ghai R, Chakraborty T, Hain T. Augur - a computational pipeline for whole genome microbial surface protein prediction and classification. Bioinformatics. (2006) 22:2819–20. doi: 10.1093/bioinformatics/btl466
68. Chiu D, Agrawal G. Auspice: automatic service planning in cloud/grid environments. In: Cafaro M, Aloisio G, editors. Grids, Clouds and Virtualization. London: Springer (2011). p. 93–121.
69. Jones MB. The emerging JSON-based identity protocol suite. In: W3C Work Identity Brows. Louisiana: Louisiana Forest Products Development (2011). 1–3.
70. Mondal S, Chang YF, Balasuriya U. Sequence analysis of infectious bronchitis virus isolates from the 1960s in the United States. Arch Virol. (2013) 158:497–503. doi: 10.1007/s00705-012-1500-y
71. Valastro V, Holmes EC, Britton P, Fusaro A, Jackwood MW, Cattoli G, et al. S1 gene-based phylogeny of infectious bronchitis virus: an attempt to harmonize virus classification. Infect Genet Evol. (2016) 39:349–64. doi: 10.1016/j.meegid.2016.02.015
72. Schalk AF. An apparently new respiratory disease of baby chicks. J Am Vet Med Assoc. (1931) 78:413–23.
73. Jia W, Mondal SP, Naqi SA. Genetic and antigenic diversity in avian infectious bronchitis virus isolates of the 1940s. Avian Dis. (2002) 46:437–41. doi: 10.1637/0005-2086(2002)046[0437:GAADIA]2.0.CO;2
74. Bande F, Arshad SS, Omar AR, Hair-Bejo M, Mahmuda A, Nair V. Global distributions and strain diversity of avian infectious bronchitis virus: a review. Anim Heal Res Rev. (2017) 18:70–83. doi: 10.1017/S1466252317000044
75. Perera R, Perera P, Vlosky RP, Darby P. Potential of Using Poultry Litter as a Feedstock for Energy Production. Louisiana Forest Products Development (2010).
76. Jackwood MW, Hilt DA, McCall AW, Polizzi CN, McKinley ET, Williams SM. Infectious bronchitis virus field vaccination coverage and persistence of Arkansas-type viruses in commercial broilers. Avian Dis. (2009) 53:175–83. doi: 10.1637/8465-090308-Reg.1
77. Lee C. Evolution of avian infectious bronchitis virus: Genetic drift and recombination. Korean J Vet Serv. (2002) 25:97–103.
78. Smith G, Dunipace S. How backyard poultry flocks influence the effort required to curtail avian influenza epidemics in commercial poultry flocks. Epidemics. (2011) 3:71–5. doi: 10.1016/j.epidem.2011.01.003
79. Meyer A, Dinh TX, Nhu T, Van Pham LT, Newman S, Nguyen TTT, et al. Movement and contact patterns of long-distance free-grazing ducks and avian influenza persistence in Vietnam. PLoS ONE. (2017) 12:e0178241. doi: 10.1371/journal.pone.0178241
80. Zhao Y, Richardson B, Takle E, Chai L, Schmitt D, Xin H. Airborne transmission may have played a role in the spread of 2015 highly pathogenic avian influenza outbreaks in the United States. Sci Rep. (2019) 9:11755. doi: 10.1038/s41598-019-47788-z
81. Lam TTY, Hon CC, Lemey P, Pybus OG, Shi M, Tun HM, et al. Phylodynamics of H5N1 avian influenza virus in Indonesia. Mol Ecol. (2012) 21:3062–77. doi: 10.1111/j.1365-294X.2012.05577.x
82. Jackwood MW, de Wit S. Infectious bronchitis. In: Swayne DE, Boulianne M, Logue CM, McDougald LR, Nair V, Suarez DL, de Wit S, Grimes T, Johnson D, Kromm M, Yodiantara Prajitno T, Rubinoff I, Zavala G, editors. Diseases of Poultry. 13th ed. John Wiley & Sons (2017). p. 139–59.
83. Ramakrishnan S, Kappala D. Avian infectious bronchitis virus. In: Singh Malik Y, Singh RK, Yadav MP, editors. Recent Advances in Animal Virology. Singapore: Springer (2019). p. 301–19.
84. Gilbert M, Xiao X, Domenech J, Lubroth J, Martin V, Slingenbergh J. Anatidae migration in the western Palearctic and spread of highly pathogenic avian influenza H5N1 virus. Emerg Infect Dis. (2006) 12:1650–6. doi: 10.3201/eid1211.060223
85. Peiris JSM, De Jong MD, Guan Y. Avian influenza virus (H5N1): a threat to human health. Clin Microbiol Rev. (2007) 20:243–67. doi: 10.1128/CMR.00037-06
86. Takekawa JY, Newman SH, Xiao X, Prosser DJ, Spragens KA, Palm EC, et al. Migration of waterfowl in the east asian flyway and spatial relationship to HPAI H5N1 outbreaks. Avian Dis. (2010) 466–76. doi: 10.1637/8914-043009-Reg.1
87. Tian H, Zhou S, Dong L, Van Boeckel TP, Cui Y, Wu Y, et al. Avian influenza H5N1 viral and bird migration networks in Asia. Proc Natl Acad Sci USA. (2015) 112:172–7. doi: 10.1073/pnas.1405216112
88. Cumming RB. Studies on Australian infectious bronchitis virus. IV Apparent farm-to-farm airborne transmission of infectious bronchitis virus. Avian Dis. (1970) 14:191–5. doi: 10.2307/1588572
90. Franzo G, Tucciarone CM, Moreno A, Legnardi M, Massi P, Tosi G, et al. Phylodynamic analysis and evaluation of the balance between anthropic and environmental factors affecting IBV spreading among Italian poultry farms. Sci Rep. (2020) 10:1–11. doi: 10.1038/s41598-020-64477-4
91. Cavanagh D. Coronavirus avian infectious bronchitis virus. Vet Res. (2007) 38:281–97. doi: 10.1051/vetres:2006055
92. Vieira AR, Hofacre CL, Smith JA, Cole D. Human contacts and potential pathways of disease introduction on Georgia poultry farms. Avian Dis. (2009) 53:55–62. doi: 10.1637/8364-051608-Reg.1
93. Van Steenwinkel S, Ribbens S, Ducheyne E, Goossens E, Dewulf J. Assessing biosecurity practices, movements and densities of poultry sites across Belgium, resulting in different farm risk-groups for infectious disease introduction and spread. Prev Vet Med. (2011) 98:259–70. doi: 10.1016/j.prevetmed.2010.12.004
94. Nickbakhsh S, Matthews L, Dent JE, Innocent GT, Arnold ME, Reid SWJ, et al. Implications of within-farm transmission for network dynamics: consequences for the spread of avian influenza. Epidemics. (2013) 5:67–76. doi: 10.1016/j.epidem.2013.03.001
95. Lin SY, Chen HW. Infectious bronchitis virus variants: molecular analysis and pathogenicity investigation. Int J Mol Sci. (2017) 18:2030. doi: 10.3390/ijms18102030
96. Ennaji Y, Khataby K, Ennaji MM. Infectious bronchitis virus in poultry: molecular epidemiology and factors leading to the emergence and reemergence of novel strains of infectious bronchitis virus. In: Ennaji MM, editor. Emerging and Reemerging Viral Pathogens: Vol. 2: Applied Virology Approaches Related to Human, Animal and Environmental Pathogens. Academic Press (2019). p. 31–44.
97. Holmes EC. Evolutionary history and phylogeography of human viruses. Annu Rev Microbiol. (2008) 62:307–28. doi: 10.1146/annurev.micro.62.081307.162912
98. Faria NR, Suchard MA, Rambaut A, Lemey P. Toward a quantitative understanding of viral phylogeography. Curr Opin Virol. (2011) 1:423–9. doi: 10.1016/j.coviro.2011.10.003
99. Maitra A, Sarkar MC, Raheja H, Biswas NK, Chakraborti S, Singh AK, et al. Mutations in SARS-CoV-2 viral RNA identified in Eastern India: possible implications for the ongoing outbreak in India and impact on viral structure and host susceptibility. J Biosci. (2020) 45:76. doi: 10.1007/s12038-020-00046-1
100. Saha S, Malaker R, Sajib MSI, Hasanuzzaman M, Rahman H, Ahmed ZB, et al. Complete genome sequence of a novel coronavirus (SARS-CoV-2) isolate from Bangladesh. Microbiol Resour Announc. (2020) 9:e00568-20. doi: 10.1128/MRA.00568-20
101. van Dorp L, Acman M, Richard D, Shaw LP, Ford CE, Ormond L, et al. Emergence of genomic diversity and recurrent mutations in SARS-CoV-2. Infect Genet Evol. (2020) 83:104351. doi: 10.1016/j.meegid.2020.104351
102. Estrada-Peña A, Ostfeld RS, Peterson AT, Poulin R, de la Fuente J. Effects of environmental change on zoonotic disease risk: an ecological primer. Trends Parasitol. (2014) 30:205–14. doi: 10.1016/j.pt.2014.02.003
103. Barr I, Deng Y, Grau M, Al E. Intense interseasonal influenza outbreaks, Australia, 2018/19. Eurosurveillance. (2019) 24:1900421. doi: 10.2807/1560-7917.ES.2019.24.33.1900421
104. Theys K, Lemey P, Vandamme AM, Baele G. Advances in visualization tools for phylogenomic and phylodynamic studies of viral diseases. Front Public Heal. (2019) 7:208. doi: 10.3389/fpubh.2019.00208
105. Kalinich CC, Jensen CG, Neugebauer P, Petrone ME, Peña-Hernández M, Ott IM, et al. Real-time public health communication of local SARS-CoV-2 genomic epidemiology. PLoS Biol. (2020) 18:e3000869. doi: 10.1371/journal.pbio.3000869
106. Roh HJ, Hilt DA, Williams SM, Jackwood MW. Evaluation of infectious bronchitis virus Arkansas-type vaccine failure in commercial broilers. Avian Dis. (2013) 57:248–59. doi: 10.1637/10459-112812-Reg.1
107. Alvarado IR, Villegas P, El-Attrache J, Brown TP. Evaluation of the protection conferred by commercial vaccines against the California 99 isolate of Infectious Bronchitis virus. Avian Dis. (2003) 47:1298–304. doi: 10.1637/6040
Keywords: infectious bronchitis, virus evolution, outbreak analytics, avian disease, evolutionary epidemiology
Citation: Jara M, Crespo R, Roberts DL, Chapman A, Banda A and Machado G (2021) Development of a Dissemination Platform for Spatiotemporal and Phylogenetic Analysis of Avian Infectious Bronchitis Virus. Front. Vet. Sci. 8:624233. doi: 10.3389/fvets.2021.624233
Received: 30 October 2020; Accepted: 27 February 2021;
Published: 04 May 2021.
Edited by:
Jesus Hernandez, Centro de Investigación en Alimentación y Desarrollo, MexicoReviewed by:
Mohammed AbdelHameed AboElkhair, University of Sadat City, EgyptMuhammad Zubair Shabbir, University of Veterinary and Animal Sciences, Pakistan
Copyright © 2021 Jara, Crespo, Roberts, Chapman, Banda and Machado. This is an open-access article distributed under the terms of the Creative Commons Attribution License (CC BY). The use, distribution or reproduction in other forums is permitted, provided the original author(s) and the copyright owner(s) are credited and that the original publication in this journal is cited, in accordance with accepted academic practice. No use, distribution or reproduction is permitted which does not comply with these terms.
*Correspondence: Gustavo Machado, Z21hY2hhZEBuY3N1LmVkdQ==; Rocio Crespo, cmNyZXNwb0BuY3N1LmVkdQ==