 John P. Bannantine
 Judith R. Stabel1
 Darrell O. Bayles
 Cyril Conde
 Franck Biet
- 1USDA-Agricultural Research Service, National Animal Disease Center, Ames, IA, United States
- 2INRAE, Université de Tours, ISP, Nouzilly, France
Over a decade ago Mycobacterium avium subspecies paratuberculosis (Map) specific genes were initially identified in a whole genome context by comparing draft genome sequences of Map strain K-10 with Mycobacterium avium subspecies hominissuis (Mah) strain 104. This resulted in identification of 32 Map specific genes, not including repetitive elements, based on the two-genome comparison. The goal of this study was to define a more complete catalog of M. avium subspecies-specific genes. This is important for obtaining additional diagnostic targets for Johne's disease detection and for understanding the unique biology, evolution and niche adaptation of these organisms. There are now over 28 complete genome sequences representing three M. avium subspecies, including avium (Maa), Mah, and Map. We have conducted a comprehensive comparison of these genomes using two independent pan genomic comparison tools, PanOCT and Roary. This has led to the identification of more than 250 subspecies defining genes common to both analyses. The majority of these genes are arranged in clusters called genomic islands. We further reduced the number of diagnostic targets by excluding sequences having high BLAST similarity to other mycobacterial species recently added to the National Center for Biotechnology Information database. Genes identified as diagnostic following these bioinformatic approaches were further tested by DNA amplification PCR on an additional 20 M. avium subspecies strains. This combined approach confirmed 86 genes as Map-specific, seven as Maa-specific and three as Mah-specific. A single-tube PCR reaction was conducted as a proof of concept method to quickly distinguish M. avium subspecies strains. With these novel data, researchers can classify isolates in their freezers, quickly characterize clinical samples, and functionally analyze these unique genes.
Introduction
Accurate diagnosis of mycobacterial infections is important for effective disease management within the livestock production industry. National and state veterinary laboratories are routinely confronted with unresolved cases of non-tuberculous mycobacterial (NTM) infections that are not further delineated due to complicated cross-reactive results as well as a lack of time and funds. However, correct identification of M. avium subspecies is very important because of the divergent, yet prominent, clinical relevance that exists among these strains (1). The Mycobacterium avium subspecies comprise three predominant, closely-related subspecies, M. avium subspecies avium (Maa), M. avium subspecies hominissuis (Mah), and M. avium subspecies paratuberculosis (Map) and their genetic similarity has limited the identification of diagnostic targets that distinguish each subspecies. A forth subspecies has been reported (silvaticum), but the lack of circulating strains and sequences in public databases suggests this subspecies designation may be artifactual (2). Map is the causative agent of Johne's disease, which is a chronic intestinal ailment of ruminants that results in significant economic loss to dairy, meat and wool industries (3, 4). Mah is an opportunistic pathogen of swine and humans that manifests most commonly as a pulmonary infection in humans (5), while Maa is primarily a pathogen of birds (6).
In this report, the terms Map and non-Map are used to divide the M. avium subspecies. This is due to the focus on diagnostic Map sequences, which are major tools for research and surveillance of Johne's disease. Conversely, very few studies have reported sequences that are diagnostic for non-Map subspecies. The only known sequences that are specific for the Maa and Mah subspecies include IS1245 (7) and genes contained within insertions or other genetic rearrangements termed large sequence polymorphisms (LSPs) (8). Whole genome comparative methods are a comprehensive approach for identifying specific genes useful in molecular diagnostic tests. In this approach, genomes from closely related organisms are compared to identify genes uniquely correlated with particular groups. A complicating factor is that M. avium subspecies strains studied thus far all share >98% average nucleotide identity across the entire genome (2). In addition, the core genome appears stable for Map with 80% of the genome sequence comprising genes present in all strains, whereas the core genomes of non-Map subspecies comprise only 40% of genes (2). Despite strong genetic similarity and availability of commonly used diagnostic targets (i.e., IS900), there are still undiscovered and unexplored genetic targets that may be used in diagnostic tests to distinguish the M. avium subspecies. These sequences are also important to understanding the unique biology, evolution and niche adaptation of these strains. A primary goal of this study is to identify genetic targets that can distinguish M. avium subspecies from each other.
Despite high sequence identity among these subspecies, some specific sequences have long been identified and used for diagnostics of Johne's disease. The most commonly used target is the repetitive sequence, IS900, which is present in 16–22 copies in Map. This insertion element was identified as Map-specific long before whole-genome sequences became available (9, 10). Other sequences reported as specific to Map include the single-copy genes hspX (MAP_RS11095; MAP2182c) (11, 12), F57 (MAP_RS22535; MAP_0865) (13), and locus 251 (MAP_RS14130; MAP2765c) (14, 15). Locus 251 was originally identified from shotgun sequence data shortly before the first complete genome of an M. avium subspecies was assembled (15) and later used as a target in commercial PCR assays. F57 was originally identified from a genomic DNA library screen (16) and was later discovered as part of the MAP_0865 coding sequence present on a large sequence polymorphism termed LSP4 (17). This gene has also been a common target in real time PCR assays (13, 18, 19). Thirty-two Map-specific genes were identified by genomic hybridizations to DNA microarrays (20–22), but this approach lacked the resolution and completeness of whole-genome sequences.
To identify all remaining sequences specific for Map and new diagnostic sequences for Maa and Mah, complete genomes from several strains were compared and candidate genes identified. Two independent bioinformatic analyses were first conducted to obtain subspecies specific genes in M. avium. These analyses included Roary (23) and PanOCT (24) pan genome tools, which identify core and accessory genes for a group of closely related organisms. PanOCT works by joining homologous and conserved gene neighborhoods to cluster orthologous proteins while Roary preclusters highly similar protein sequences before BLASTP similarity searching. PanOCT analysis yields a variety of comparative data about the input genomes (24), but one of the more useful outputs are the match tables. These tables list orthologous clusters of genes along with information on the cutoff metrics that would result in genes being declared absent in the match table. Match tables were constructed from PanOCT analysis showing all genomes, including their corresponding genes and percent identity of their gene products. These tools were used previously to determine the core genome of Map and non-Map strains (2). Finally, once specific genes are identified, DNA amplification primers can then be designed for further testing on a panel of organisms representing additional M. avium strains.
Materials and Methods
In silico Identification of Subspecies Specific Genes
PanOCT output includes a match table of all genes in every input genome (Genbank flatfile format) with orthologs arranged in rows and genomes arranged in columns. The input genomes included the 29 M. avium genomes reported in Tables 1, 2 of (2). When orthologs are not present in a genome(s), this is interpreted as one of several possibilities: the amino acid percent identity is <35%, the BLAST E-value was >1 × 10⁻⁵, the minimum percent match length of subject and query (default is 1%) was not met, the frame-shift overlap parameter (default is 1.33) triggered a non-match, there were more than 20 amino acids at the beginning or end of a match that were missing, and finally, there was not at least one match that confirmed a protein fragment/frame-shift. Roary (v3.11.2) was used to define the accessory genome of each subspecies and was launched with –e and –n options to compute rapid core gene alignment. Coding sequences from both analyses were assembled and compared. Only subspecies-specific genes identified by both approaches were analyzed by DNA amplification.
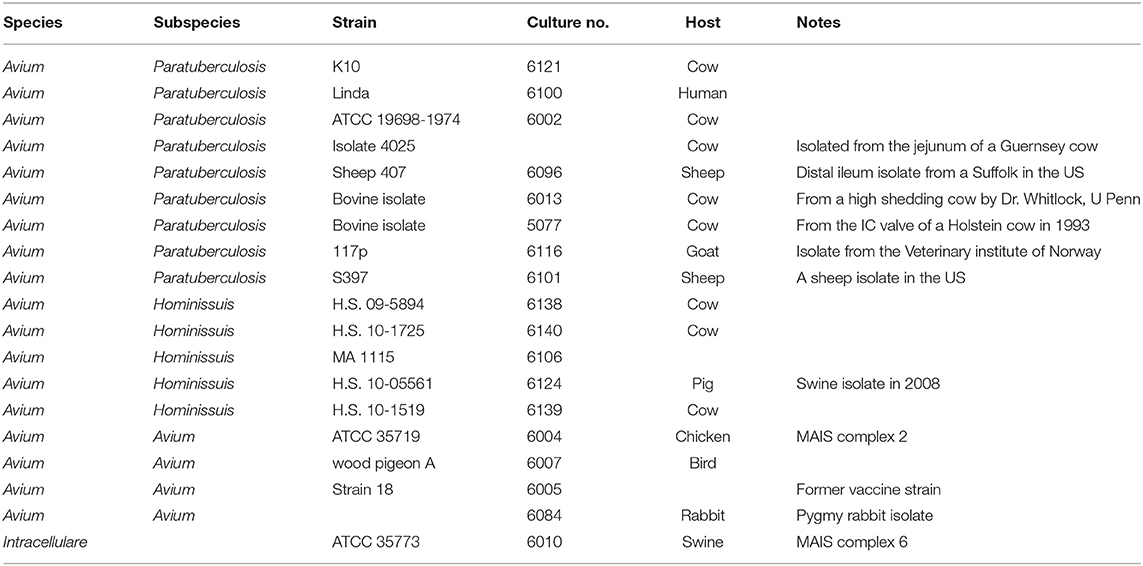
Table 1. Genomic DNA templates used in DNA amplification experiments.
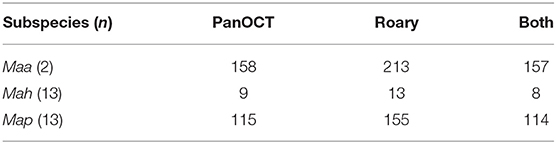
Table 2. Number of M. avium subspecies specific genes identified by each analysis.
Primer Design
Primers were designed using the National Center for Biotechnology Information (NCBI) primer search software (https://www.ncbi.nlm.nih.gov/tools/primer-blast/). Parameters that differed from the defaults included minimum product size of 300 bp, maximum product size of 800 bp, optimal primer melting temperature of 68°C with a max melting temperature of 70°C, and database selection was RefSeq genomes. At least 10 candidate primer pairs obtained from NCBI primer searches were tested on each gene in silico using MacVector version 17.5. Primer pairs were discarded if any bound within the product or if they formed hairpin and self-duplex structures. Only one set of primers was kept for each gene to use in DNA amplification studies. Accepted primer pairs are shown in Supplementary Table 1 for all genes analyzed. If the open reading frames were small and adjacent to each other, a forward primer was designed in one coding sequence and the reverse primer was designed in the neighboring coding sequence. This approach provided more sequence to design optimal primer pairs and lessened the number of PCRs to be conducted. In one case, a primer pair was designed that spanned three small coding sequences, MAP_RS10970, MAP_RS10975, and MAP_RS10980.
Functional Analysis of Genes
All Roary Map-specific protein sequences of each gene (155 total) were extracted using an in-house python script (Supplementary Materials) based on Biopython (https://biopython.org). KEGG orthologs for each protein sequence were assigned using kofamscan tool (https://github.com/takaram/kofam_scan) based on HMM profile search with default parameters. Kofamscan results were parsed using another in-house python script (searchKEGG.py). Briefly, for each gene, we selected the best result based either on the ratio value compute as score / threshold_score where available or on the lower e-value. K numbers were then used to retrieve the complete KEGG hierarchies and functional classes were assigned based on the KEGG hierarchies. For functional analysis using eggNOG, all Roary Map-specific protein sequences were again extracted. Proteins were aligned against the eggNOG database v5.0 using Diamond (https://github.com/bbuchfink/diamond) and functional annotation was assigned to each protein sequence when available using emapper.py python script from eggnog-Mapper tool. Results were parsed using an in-house python script (Supplementary Materials) in order to extract relevant information.
DNA Amplification
Genomic DNA was purified from mycobacterial strains shown in Table 1 using the method described previously (15). Advantage GC-2 (Takara Bio) was used for all amplifications on 100 ng of DNA and 100 μM of each primer. All reactions were repeated twice and if an unexpected result occurred, the reaction was again tested using EconoTaq PLUS GREEN master mix (Lucigen). All amplification reactions were conducted on an Applied Biosystems GeneAmp PCR System 9700 as follows: a single denaturation step at 94°C for 8 min; then 25 cycles of 94°C for 30 s, 70°C for 1 min, 72°C for 1 min; then a final extension at 72°C for 5 min. The single reaction multiplex PCRs were performed using the same conditions above, except three sets of primers (highlighted red in Supplementary Table 1) were included in each reaction. In silico PCR was performed with MacVector 17.5 using the primer test feature and the same primers listed in Supplementary Table 1. DNA templates for in silico PCR consisted of complete genome sequences of Mycobacterium available in public sequence databases.
Data Availability
Raw sequence data supporting the results of this article were deposited in the European Nucleotide Archive (ENA) and NCBI under accession PRJEB2204.
Results
Bioinformatic Analysis of M. avium Subspecies-Specific Genes
Map
The initial number of subspecies-specific gene candidates were obtained by two comparative genomic methods, Roary and PanOCT analysis. The same set of 28 complete genomes that were used in our previous study (2) was included herein. PanOCT analysis revealed a total of 115 genes that are present in all Map genomes, but absent in all non-Map genomes while Roary analysis identified 155 Map-specific genes (Table 2; Supplementary Table 2). The total number of Map-specific genes identified by either Roary or PanOCT analysis was 156 (Supplementary Table 2).
Of the 156 total genes, Roary analysis uncovered 41 genes not found by PanOCT analysis whereas one gene was identified by PanOCT analysis that was not listed by Roary. The reason for this single-gene discrepancy is due to different translational start sites in one of the 13 Map orthologs (EGA31_RS21685 in the Telford strain) encoding an alpha/beta hydrolase, which made this gene appear as though it was not present in all Map strains analyzed (Supplementary Figure 1; Table 3). Thus, it was excluded by Roary analysis. The 41 genes present by Roary analysis but absent by PanOCT is due to the different clustering methods used by these bioinformatic tools. However, it is of interest to further explore this subset of 41 genes to understand which bioinformatic approach might be better for defining these gene targets. BLAST analysis of these 41 genes against the NCBI database showed reasonably strong homologies to other, more distantly related, Mycobacterium species (Supplementary Table 3). These results suggest that PanOCT may be better suited to consider more evolutionarily distant strains than Roary. Nonetheless, 114 Map-specific gene candidates are present in both analyses (Supplementary Table 2). This result excludes Map-specific repetitive sequences, such as IS900, which are not annotated in the E1 and E93 genome sequences (2).
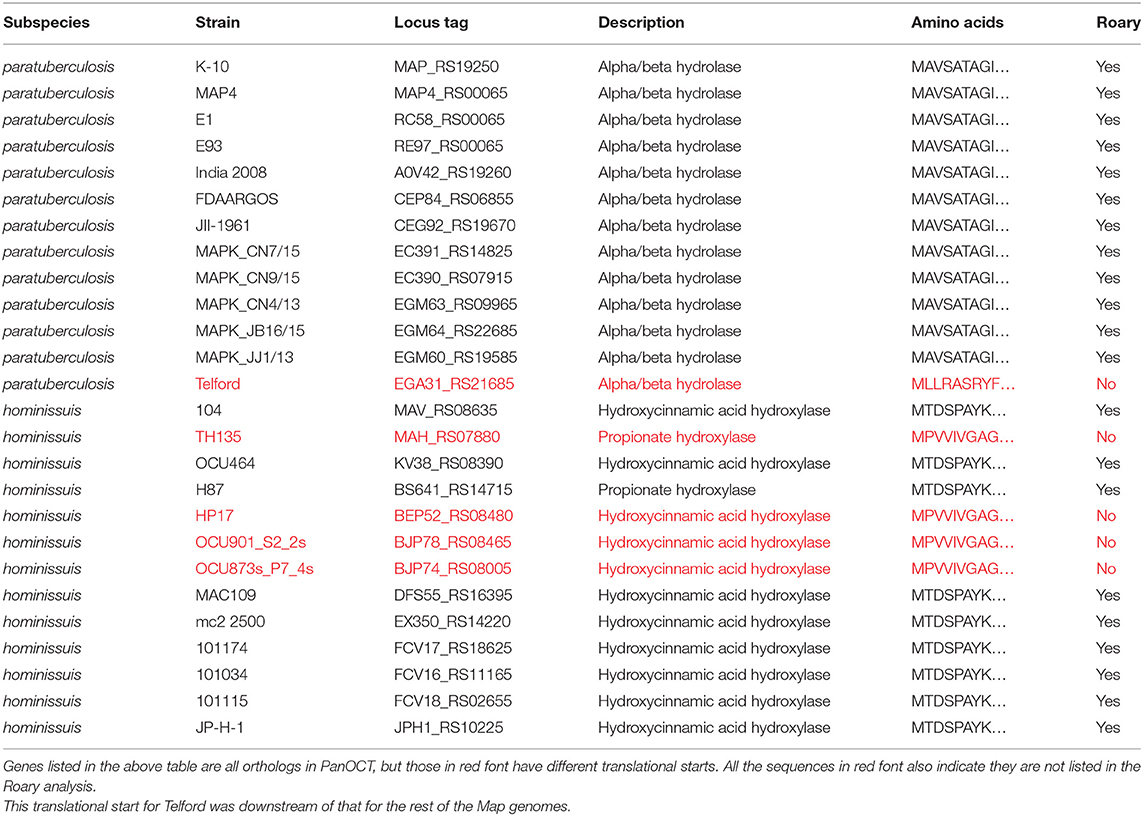
Table 3. M. avium subspecies-specific gene discrepancy in Roary analysis.
Non-map
The Mah-specific and Maa-specific genes were also obtained using similar analyses. There are only nine Mah-specific genes identified by PanOCT and 13 by Roary analysis (Table 2; Supplementary Table 4). Eight of these genes are present in both analyses. One gene, encoding hydroxycinnamic acid hydroxylase (Table 3), that is uniquely present in the PanOCT analysis was due to differences in the clustering of orthologous genes. In this case, the BLAST score ratio, when used alone, would not classify these orthologs as a cluster. Therefore, Roary excluded it. However, when the conserved gene neighborhood is factored in the PanOCT analysis, these genes are found rooted in the same source. This might be what one would expect if there was a single event that introduced an entire cluster followed by divergence of a gene within that cluster. Conversely, there are five Mah genes identified as specific only by Roary analysis. As before, these differences were due to the clustering methods used by these bioinformatic tools (see Discussion). The largest set of subspecies-specific genes were obtained for Maa strains, which included 157 genes identified by both analyses (Table 2; Supplementary Table 5).
Location of M. avium Subspecies-Specific Genes
Subspecies specific genes are not randomly distributed over the entire genome but tend to be organized in clusters, termed large sequence polymorphisms (LSPs) (8, 17). This fact is supported by the results of this study, where several specific genes are contained within LSPs regardless of the subspecies (Figure 1). Maa shows the most clusters (26 total), followed by Map and then Mah, which only has four clusters of eight total genes. For example, the largest genomic island is just over 100 kb in Maa and it contains 97 Maa-specific genes. This island was previously described as LSP1 by Semret et al. (8). The location of LSP1 is at 7 o'clock on the Maa genome map in Figure 1. Likewise, the largest genomic island in Map includes 30 genes spanning 55 kb and was previously named LSPP14 (17). Not all genes within any defined LSP were found specific to a given subspecies in this study.
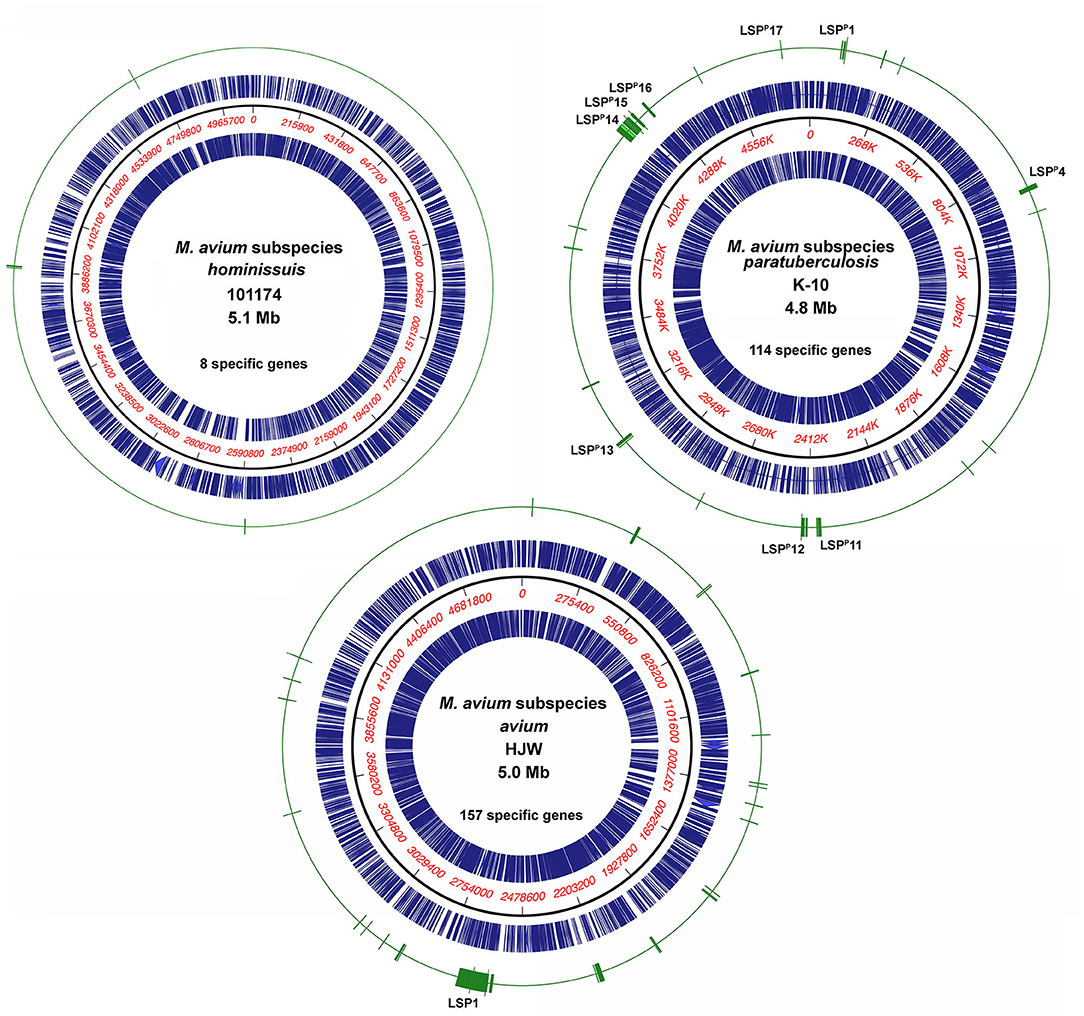
Figure 1. Location of subspecies specific genes on representative M. avium genome maps. Representative genomes from each of the three subspecies are shown with the concentric circles from outer most ring to inner most ring as follows: subspecies-specific genes (green), coding sequences forward strand (blue), nucleotide scale (black line with red numbers), coding sequences reverse strand (blue). All subspecies-specific genes identified by both PanOCT and Roary analyses are shown. The strain and genome size are indicated in the center of the circle along with the number of specific genes for that subspecies. Genome maps were drawn using MacVector 17.5. Map LSPs that correspond to those described by Semret et al. (17) are shown as well as LSP1 in Mah described by Semret et al. (8).
BLAST Similarity and in silico PCR Analysis
The 114 Map-specific genes were next analyzed by similarity searches against other complete mycobacterial genomes including members of the M. tuberculosis complex and non-tuberculosis mycobacteria closely related to the MAC complex (25, 26). Several Map-specific genes showed surprisingly strong similarity to mycobacterial genomes that were recently added to public sequence databases (Supplementary Table 6). These include M. marseillense, M. lepraemurium, M. branderi, and Mycolicibacterium doricum. In silico PCR using primers designed for this study (Supplementary Table 1) were tested on the strongest matching genome sequences obtained from BLAST analysis and amplification products of the correct size were obtained for nine Map genes (Supplementary Table 6). Removing these nine targets reduced the list of Map genes to 104 that are defined as Map-specific following PanOCT, Roary and in silico PCR analysis. Within that group of 104 genes, 54 were highly specific to Map as they had no matches in the NCBI sequence database (indicated by “no result” in Supplementary Table 6). Two additional M. avium genomes, Map DSM 44135 (27) and Maa ATCC 25291 (28), were published after this study began and in silico PCR on those genome sequences shows agreement with subspecies specificity for all genes except FCV17_RS22495, a Mah gene that yielded a correct size product in Maa ATCC 25291 (Supplementary Table 4).
Gene Ontology of Map-Specific Genes
Functional analysis was performed on Map-specific genes using Kyoto Encyclopedia of Genes and Genomes (KEGG) (29) and evolutionary genealogy of genes: Non-supervised Orthologous Groups (eggNOG) (30). These genes were separated into 16 functional classifications by KEGG and 18 by eggNOG (Figure 2). Other than the most predominant unknown function class, KEGG analysis revealed 14 lipid transport system proteins, which likely remodel the cell wall in some way. EggNOG analysis showed the presence of Mce family proteins (n=6), and ABC transporters (n=5), but were predominantly genes of unknown function (n=45). The high number of genes with no assigned function suggests there are a lot of unknowns about what makes Map unique to other bacteria.
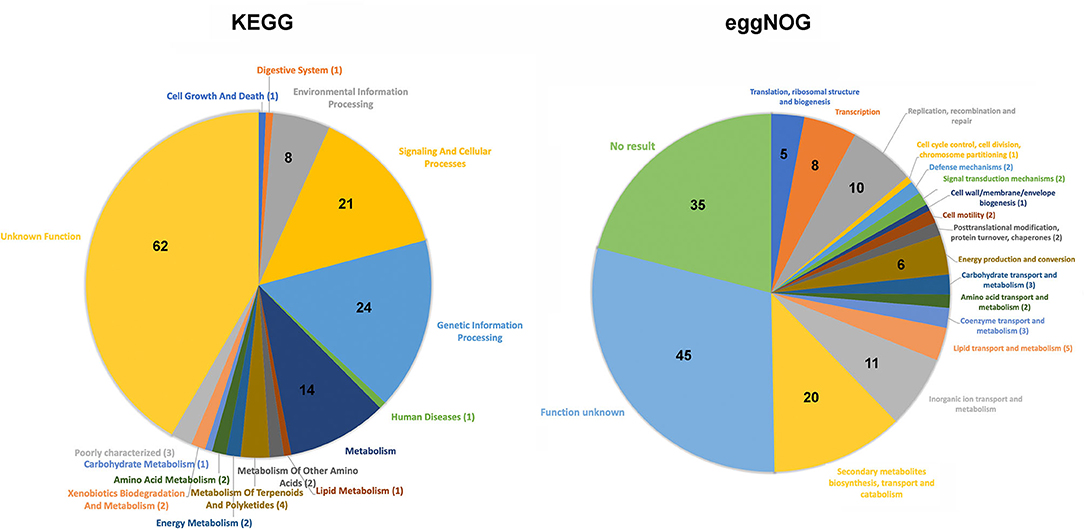
Figure 2. Pie chart distribution of the functional categories obtained for Map-specific genes via KEGG (left chart) and eggnog analysis (right chart). The number of Map-specific genes present in each defined category are indicated. Note that in both analyses the unknown function category contains the largest percentage of genes.
DNA Amplification of Subspecies Specific Genes
Taq polymerase-based DNA amplification of selected genes was performed on purified genomic DNA from 16 additional M. avium subspecies strains and Map K-10 as a control. All 104 Map-specific genes (Supplementary Table 2) and all eight Mah-specific genes (Supplementary Table 4) were tested. In addition, a subset of eight genes from the 157 Maa-specific genes (Supplementary Table 5) were also tested by DNA amplification. IS900 and IS1245 repetitive element targets were included as controls. The results show that 106 of 120 genes tested were confirmed as subspecies-specific (Table 4). A gene was dropped from the subspecies-specific gene list if it failed to amplify in any target strains or if it did amplify in any non-target strains. Such unexpected reactions are highlighted in yellow (if negative) and green (if positive) in Table 4.
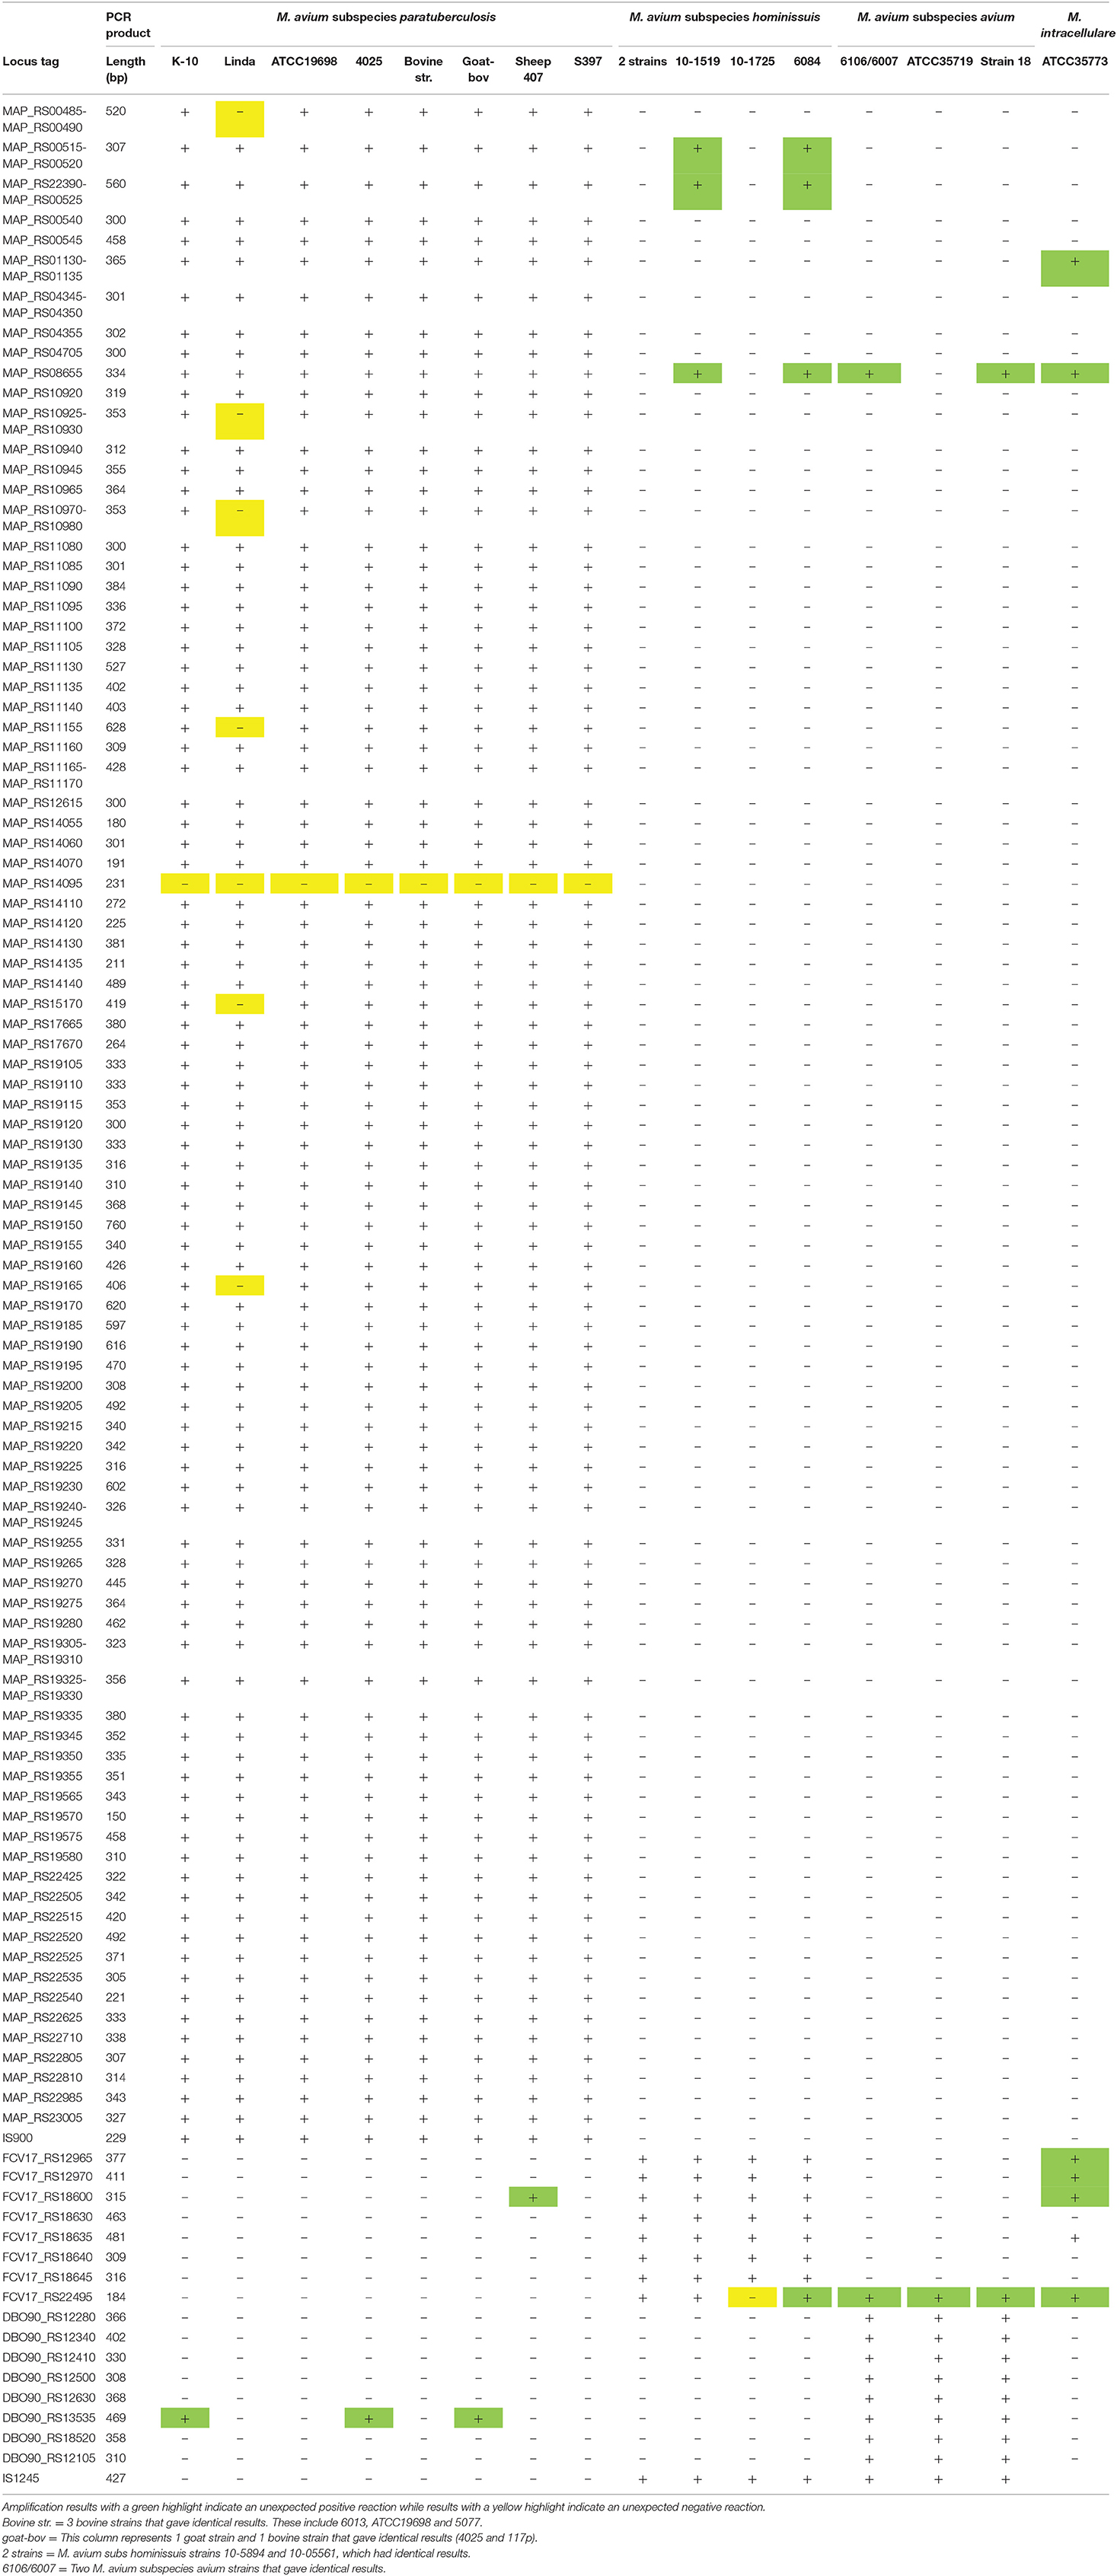
Table 4. DNA amplification of purified genomic DNA from additional M. avium subspecies strains.
Map
Eighty-six genes were confirmed as Map-specific by DNA amplification (Table 4). Conversely, four genes amplified non-Map DNA and thus are no longer considered Map-specific (Table 4). The primers designed from the MAP_RS01130-MAP_RS01135 combination amplified the correct size product in the M. intracellulare strain, but only faintly, perhaps indicating nucleotide mismatches in the primers. Primers to MAP_RS22390-MAP_RS00525 along with MAP_RS00515-MAP_RS00520 are all clustered together in the genome and amplified a correct sized product in two Mah strains (Table 4). MAP_RS08655 was the most conserved gene, amplifying a product in six of the nine non-Map strains tested (Table 4). Conversely, Map strain Linda failed to amplify seven genes, despite testing different Taq enzyme mixtures. A search of sequence read archive data from accession PRJEB2204 suggests all seven genes are present in the Linda strain, similar to all other Map strains. One primer pair designed from MAP_RS14095 failed to amplify DNA from any strain tested.
Non-map
Gene candidates that are diagnostic for Mah are very limited. Among the eight genes identified as specific to Mah by bioinformatic approaches, only three (FCV17_RS18630, FCV17_RS18640, and FCV17_RS18645) remained specific following PCR analysis as the other five genes were amplified a correct sized product from M. intracellulare DNA (Table 4). Of the eight Maa-specific genes selected for PCR analysis, seven were confirmed specific while only one (DBO90_RS13535) showed amplification in three Map strains. However, there are 149 other Maa gene candidates that were not tested, but could be Maa-specific (Supplementary Table 4).
The collective results identified 86 genes that are Map-specific, seven Maa-specific, and three Mah-specific. Thus, a final list of the subspecies-specific genes is included in Table 5. Collectively, these results further extended the number diagnostic targets tested for Johne's disease against 10 additional Map strains and 10 non-Map strains.
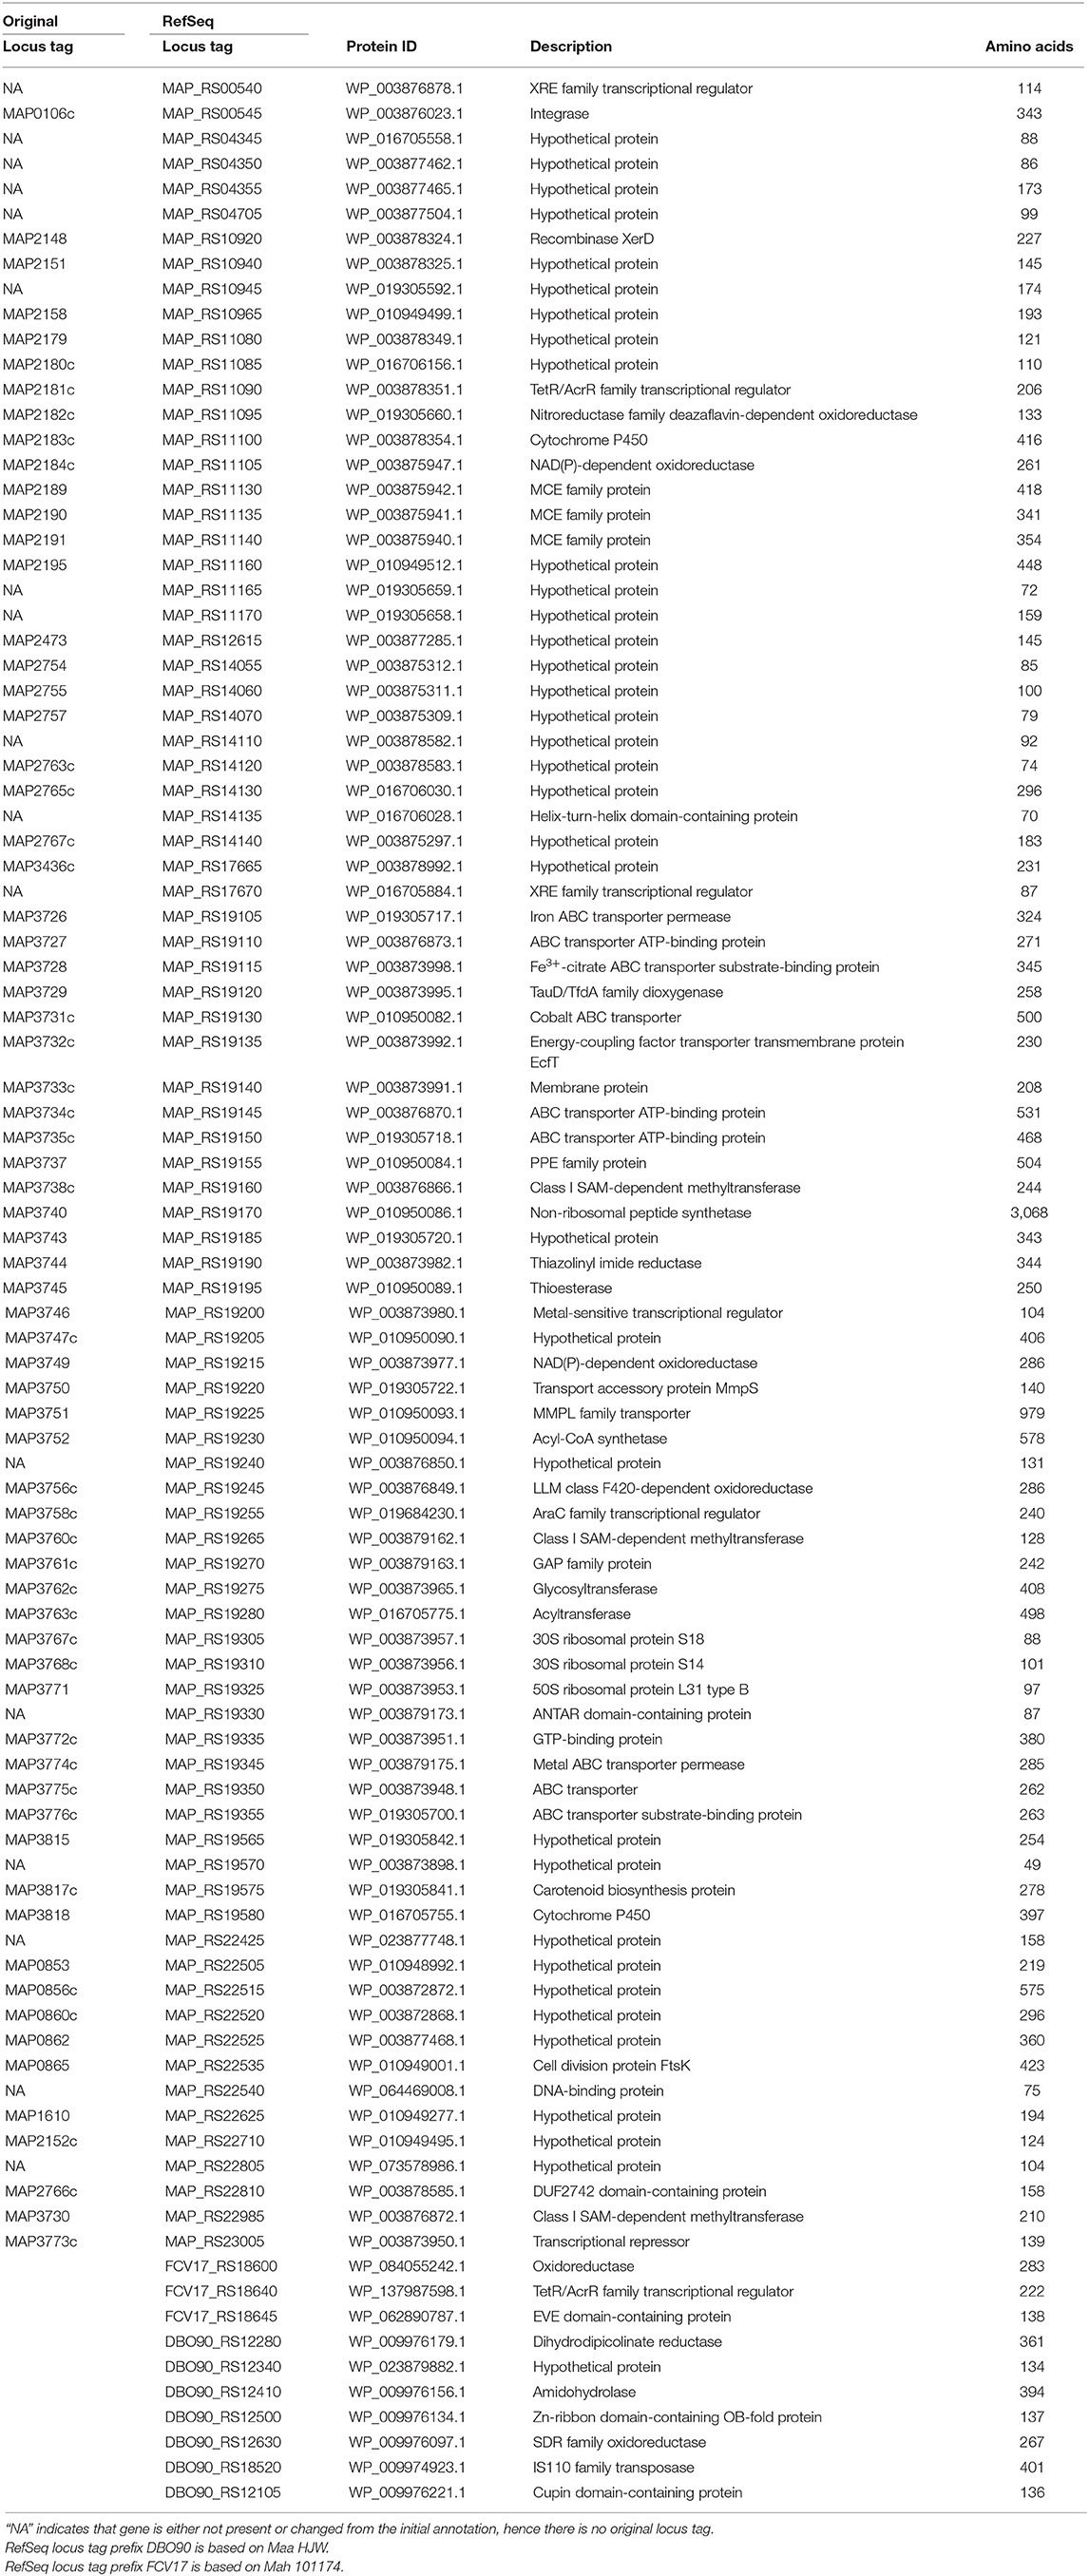
Table 5. M. avium subspecies-specific genes confirmed in this study.
A Single Reaction PCR Distinguishes All M. avium Subspecies
As a proof of concept, primer combinations were tested that can distinguish any M. avium subspecies using a single-tube amplification reaction. Although other PCR reactions have been developed to distinguish M. avium subspecies (31), this approach eliminates the need for three reactions to accomplish the same result. This primer combination was used on selected genomic DNAs from M. avium subspecies. The single DNA amplification was able to distinguish each subspecies on the basis of size by gel electrophoresis (Figure 3), but can also be adapted to real time PCR using different Taqman probes and concentrations (32).
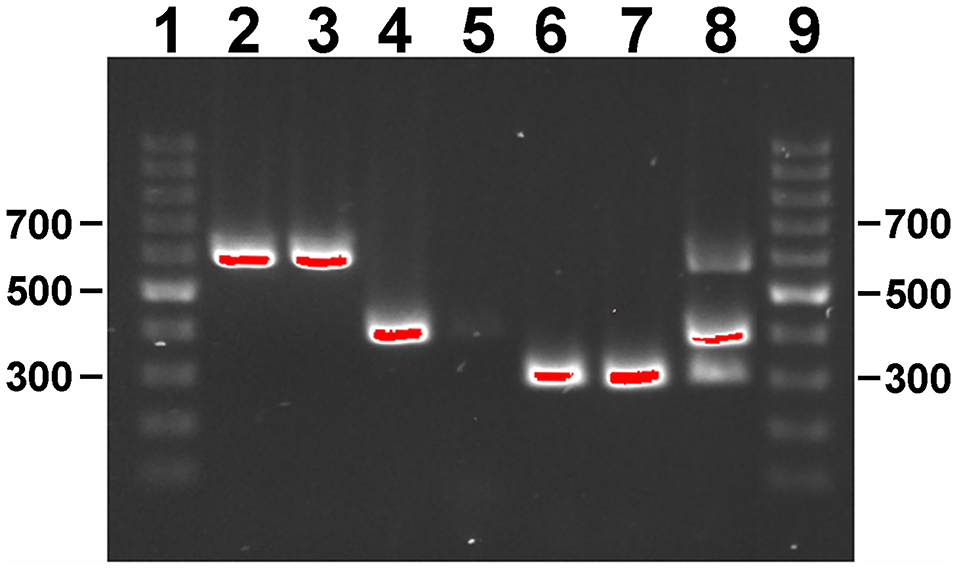
Figure 3. Gel electrophoresis of single-reaction PCR products on a 1% agarose gel stained with ethidium bromide. Lane assignments: 1 and 9 = 100 bp ladder; 2 = Map K-10; 3 = Map ATCC 19698; 4 = Maa Strain 18; 5 = Maa ATCC 35719; 6 = Mah HS 09-5894; 7 = Mah HS 10-1725; 8 = 117p-6084-MA 1115 mixture. Size standards are indicated in the left and right margins. Red indicates DNA band saturation.
Discussion
A total of 32 Map-specific genes were initially identified by comparing Map K-10 with Mah strain 104 (17, 20, 22). These genes have aided the specific detection of Map, but are single-copy genes compared to IS900, a repetitive element that was known to be diagnostic for Map long before whole-genome comparisons were performed (9, 10). Using a comparative genomic approach combined with PCR analysis, this study confirmed 18 of the original 32 genes and identified 68 additional Map-specific genes as diagnostic targets (Table 5) yielding a total of 86 genes. Some genes were initially identified as potentially subspecies specific after PanOCT and Roary analysis, but were subsequently found to be conserved in other mycobacteria after additional strains were tested by in silico PCR or Taq-based PCR analysis. For example, eight Mah-specific genes were identified by bioinformatic analysis, but only three were still deemed Mah-specific following DNA amplification experiments. The number of subspecies-specific genes will likely be further reduced as additional Map and non-Map strains are analyzed. Significantly more genes specific to Map vs. Mah are likely attributed to the closed, stable genome of Map, which increases the chance that specific genes are present in all strains. The opposite is true for Mah, which has a more dynamic, open genome containing a smaller number of core sequences (2) and therefore, the number of specific genes is very small. Maa had the highest number of subspecies specific genes, possibly because only two complete genome sequences were bioinformatically analyzed for members of this subspecies. Only eight of the 157 Maa genes were selected for DNA amplification studies and seven genes remained specific to Maa. Nonetheless, with these novel data, researchers can classify isolates in their freezers, quickly characterize clinical samples, and functionally analyze these unique genes.
A total of 40% of the Map-specific genes and 24% of Maa-specific genes are annotated as hypothetical. This large percentage of Map hypothetical proteins is interesting considering the updated RefSeq annotation has resulted in a significant drop in the overall number of hypothetical proteins, but it suggests how little is known about these novel subspecies-specific genes. Also notable among this group is an operon of genes encoding Mce family proteins (Table 5), some of which are surface exposed and play a role in virulence and lipid transport (33). These proteins are typically conserved among the mycobacteria, and at least one gene this group is no different as in silico PCR analysis showed that the correct sized amplification product is obtained using MAP_RS11145 primers on M. marseillence strains (Supplementary Table 6). This species of Mycobacterium is considered a member of the Mycobacterium avium complex based on 16S rRNA, rpoB, and hsp65 sequence similarity (25).
There are significant differences between PanOCT and Roary analysis in terms of genes assigned to subspecies-specific orthologous clusters. There are 41 genes identified as Map-specific by Roary that are not considered specific by PanOCT analysis. These discrepancies are attributed to differences in the algorithms of these two bioinformatic tools. PanOCT uses a single clustering tool compared to Roary, which uses two clustering mechanisms and then merges the results. In addition, Roary appears more stringent in the gene cluster formation through the use of BLASTP identity thresholds of 95%, which yields more gene clusters. This may explain why the Roary output listed more gene clusters specific to Map than PanOCT. Roary stringency results in more gene clusters overall since Roary will not cluster genes less identical than the threshold. Thus, Roary will generate more groups of subspecies-specific genes than PanOCT causing Roary to estimate a higher number of subspecies-specific genes. On the other hand, PanOCT will group some of the genes because of its lower stringency and the number of specific groups will be lower.
Other discrepancies not related to mechanistic processes used by each tool can be traced to unexpected annotation differences in very similar orthologs. It is important to note that PanOCT is designed to give context to its findings in relation to genome organization and works off annotation data. This may be the reason why there is only one Map-specific gene identified by PanOCT analysis that is not listed by Roary. That one gene, encoding alpha/beta hydrolase (MAP_RS19250 in K-10), has the same translational start for all of the Map strains except Telford, which starts 95 codons downstream of the other strains (Supplementary Figure 1). This prevented its inclusion by Roary, and thus it was not considered a Map-specific gene, but it is indeed Map-specific. The same situation can be applied to the Mah-specific gene (MAV_RS08635 in strain 104), which encodes hydroxycinnamic acid hydroxylase (Table 3). These results pose the question of which bioinformatic approach works better for defining these diagnostic gene targets. Since agreement of both pipelines was required, the more conservative method would drive the final list of targets. Is the conservative assessment by PanOCT too strict or is Roary too liberal? Or is it somewhere in between? The only way to answer the question of whether the conservative nature of PanOCT was warranted would be to test those genes identified only by Roary to determine their diagnostic specificity. When the 41-gene subset from Roary analysis was further analyzed by BLAST against the NCBI database, most of these genes (31 of 41) showed reasonably strong homologies to other, more distantly related, Mycobacterium species (Supplementary Table 3). Therefore, PanOCT might be the better bioinformatic tool to use in this approach.
There are several possible reasons for the non-specific amplification of selected genes that were reported as specific by PanOCT and Roary analysis. First, the region amplified in non-Map strains may not have been called as a protein coding region (pseudogene, intergenic region, or frameshifted protein). Second, the region amplified in non-Map strains may be in a protein coding region that is annotated in a different reading frame compared to Map strains. Third, underlying errors in genomic sequence could produce both these types of annotation deviations or the regions may be near a site where one of the strain clusters is reorganized compared to the other cluster. One example is MAP_RS22905, a gene specific to Map based on PanOCT and Roary, but amplifies a product in non-Map strains by in silico PCR and Taq-based PCR. This gene encodes a hypothetical protein and is immediately upstream of MAP_RS17350 in Map K-10, but with a significant 27-amino acid overlap in these coding sequences. MAP_RS17350 is annotated as a frameshifted non-functional protein that contains several internal stop codons. The primers to this gene were designed such that the forward primer binds within the MAP_RS22905 coding sequence while the reverse primer binds within the coding sequence that overlaps with MAP_RS17350. In the non-Map strains (as well as other Map strains) there is a single protein that is functional and encompasses the sequence that corresponds to MAP_RS22905 and MAP_RS17350. Therefore, it is important to examine the location of predicted amplicons in the genome context to clear up some ambiguities.
While some Taq-based amplification reactions were unexpectedly positive, and thus non-specific, other reactions were unexpectedly negative. One Map-specific gene (MAP_RS14095) did not amplify any of the genomic DNAs using the primer pairs (Table 4). These primers were carefully selected using strict parameters which resulted in a PCR product of the correct size by in silico PCR, but still did not amplify a product using purified genomic DNAs. Therefore, this primer pair was considered bad and MAP_RS14095 has yet to be confirmed as subspecies-specific. An additional six Map-specific genes failed to amplify using only the Map strain Linda template, although all of the other genes were successfully amplified with this genomic DNA sample. It is unclear why these genes did not amplify with this one template, since a search of unfinished contigs for the Linda strain suggests these six genes are indeed present. Nonetheless, these genes were not included among the Map-specific genes because they didn't amplify using two independent commercial recipes.
The insertion sequence IS900 and many other repeat elements were not identified by PanOCT or Roary analysis. This is due to the lack of such elements included in the two Map Egyptian isolates E1 (CP010113.1) and E93 (CP010114.1) (34). Applying the criteria used in this study that the gene must be present in all Map and absent in all non-Map, these sequences do not appear in the E1 and E93 strains for reasons speculated previously (2), and hence they did not make the list. Nonetheless, there is no doubt that these two commonly used repetitive sequences are indeed Map specific and present in all Map strains. Surprisingly, the ISMap02 sequence did show positive PCR reactions with some Mah strains, but not with Maa (data not shown), casting doubt on its diagnostic specificity. Repetitive sequences specific to Mah and Maa were also identified in this study. One example is DBO90_RS18520 (from Maa HJW), an IS110 family transposase that has 14–16 copies in Maa strains.
F57, hspX, and locus 251 have been widely used as diagnostic sequences for Map (11, 13, 18, 35). These genes were checked against the subspecies-specific gene lists obtained from the current analyses. The F57 sequence occurs within MAP_RS22535 (MAP_0865) and was also identified as Map-specific in this study. Likewise, hspX was originally discovered as a Map-specific gene before the whole genome sequence was available (11) and was subsequently shown to be expressed within Map-infected macrophages (12). The locus tag for this sequence is MAP_RS11095 (MAP_2182c) and has been used in studies to determine antigenic reactivity (36). Locus 251 has been tested in a real-time PCR platform and was considered Map-specific in that context (14). All three of these sequences were also identified in this study as Map-specific by Roary, PanOCT, and PCR analysis.
One area where annotations have improved dramatically has been in G+C rich organisms like the mycobacteria. RefSeq annotation has identified new coding sequences that were previously hidden in the same genome because original annotation software either missed them or called distinctly different start sites or reading frames for the same gene. Because of the consistency in the RefSeq annotation pipeline, genomes can now be directly compared at the gene feature level. Several subspecies specific genes identified in this study do not list an outdated locus tag, but only the updated RefSeq locus tag. Among the Map-specific genes, 17 do not have an original locus tag designation (Table 5), representing 20% of the Map-specific genes identified in this study that might have been “missed” or changed significantly from the initial sequence annotation (37). For example, closer inspection of MAP_RS04350, which does not list an original locus tag in Table 5 and is annotated as a hypothetical protein, actually encodes the C-terminal 86 amino acids of MAP_0852 which was previously shown to be Map-specific (22). Other similar examples of shifted coding sequences that result in dropped locus tags from the original annotation exist as well. In our previous studies, we expressed Map-specific coding sequences identified by the original annotation and tested them for antibody reactivity (38). Although specific antigens were identified, additional testing revealed low antibody reactivity to all Map-specific coding sequences known at that time. Now with these updated RefSeq coding sequences identified by the prokaryotic genome annotation pipeline (PGAP), there still remains a possibility to obtain a truly specific and strong antigen for Map. Therefore, these updated RefSeq coding sequences should be recombinantly expressed and examined for antigenicity as has been done with previous Map-specific genes (38).
Data Availability Statement
The original contributions presented in the study are included in the article/Supplementary Materials, further inquiries can be directed to the corresponding author/s.
Author Contributions
JB conceived and designed the study. All authors made substantial contributions to the experimentation, analysis, and writing of the manuscript.
Funding
This work was funded by the USDA Agricultural Research Service.
Conflict of Interest
The authors declare that the research was conducted in the absence of any commercial or financial relationships that could be construed as a potential conflict of interest.
Acknowledgments
We thank Kayla E. Straight for excellent technical support.
Supplementary Material
The Supplementary Material for this article can be found online at: https://www.frontiersin.org/articles/10.3389/fvets.2020.620094/full#supplementary-material
References
1. Biet F, Boschiroli ML. Non-tuberculous mycobacterial infections of veterinary relevance. Res Vet Sci. (2014) 97(Suppl):S69–77. doi: 10.1016/j.rvsc.2014.08.007
2. Bannantine JP, Conde C, Bayles DO, Branger M, Biet F. Genetic diversity among Mycobacterium avium subspecies revealed by analysis of complete genome sequences. Front Microbiol. (2020) 11:1701. doi: 10.3389/fmicb.2020.01701
3. Gautam M, Anderson P, Ridler A, Wilson P, Heuer C. Economic cost of ovine Johne's disease in clinically affected New Zealand flocks and benefit-cost of vaccination. Vet Sci. (2018) 5:16. doi: 10.3390/vetsci5010016
4. Losinger WC. Economic impact of reduced milk production associated with Johne's disease on dairy operations in the USA. J Dairy Res. (2005) 72:425–32. doi: 10.1017/S0022029905001007
5. Tran QT, Han XY. Subspecies identification and significance of 257 clinical strains of Mycobacterium avium. J Clin Microbiol. (2014) 52:1201–6. doi: 10.1128/JCM.03399-13
6. Dhama K, Mahendran M, Tiwari R, Dayal Singh S, Kumar D, Singh S, et al. Tuberculosis in birds: insights into the Mycobacterium avium infections. Vet Med Int. (2011) 2011:712369. doi: 10.4061/2011/712369
7. Johansen TB, Djonne B, Jensen MR, Olsen I. Distribution of IS1311 and IS1245 in Mycobacterium avium subspecies revisited. J Clin Microbiol. (2005) 43:2500–2. doi: 10.1128/JCM.43.5.2500-2502.2005
8. Semret M, Zhai G, Mostowy S, Cleto C, Alexander D, Cangelosi G, et al. Extensive genomic polymorphism within Mycobacterium avium. J Bacteriol. (2004) 186:6332–4. doi: 10.1128/JB.186.18.6332-6334.2004
9. Green EP, Tizard ML, Moss MT, Thompson J, Winterbourne DJ, McFadden JJ, et al. Sequence and characteristics of IS900, an insertion element identified in a human Crohn's disease isolate of Mycobacterium paratuberculosis. Nucleic Acids Res. (1989) 17:9063–73. doi: 10.1093/nar/17.22.9063
10. Collins DM, Gabric DM, De Lisle GW. Identification of a repetitive DNA sequence specific to Mycobacterium paratuberculosis. FEMS Microbiol Lett. (1989) 51:175–8. doi: 10.1111/j.1574-6968.1989.tb03440.x
11. Ellingson JL, Bolin CA, Stabel JR. Identification of a gene unique to Mycobacterium avium subspecies paratuberculosis and application to diagnosis of paratuberculosis. Mol Cell Probes. (1998) 12:133–42. doi: 10.1006/mcpr.1998.0167
12. Bannantine JP, Stabel JR. HspX is present within Mycobacterium paratuberculosis-infected macrophages and is recognized by sera from some infected cattle. Vet Microbiol. (2000) 76:343–58. doi: 10.1016/S0378-1135(00)00247-9
13. Tasara T, Stephan R. Development of an F57 sequence-based real-time PCR assay for detection of Mycobacterium avium subsp. paratuberculosis in milk. Appl Environ Microbiol. (2005) 71:5957–68. doi: 10.1128/AEM.71.10.5957-5968.2005
14. Rajeev S, Zhang Y, Sreevatsan S, Motiwala AS, Byrum B. Evaluation of multiple genomic targets for identification and confirmation of Mycobacterium avium subsp. paratuberculosis isolates using real-time PCR. Vet Microbiol. (2005) 105:215–21. doi: 10.1016/j.vetmic.2004.10.018
15. Bannantine JP, Baechler E, Zhang Q, Li L, Kapur V. Genome scale comparison of Mycobacterium avium subsp. paratuberculosis with Mycobacterium avium subsp. avium reveals potential diagnostic sequences. J Clin Microbiol. (2002) 40:1303–10. doi: 10.1128/JCM.40.4.1303-1310.2002
16. Poupart P, Coene M, Van Heuverswyn H, Cocito C. Preparation of a specific RNA probe for detection of Mycobacterium paratuberculosis and diagnosis of Johne's disease. J Clin Microbiol. (1993) 31:1601–5. doi: 10.1128/JCM.31.6.1601-1605.1993
17. Semret M, Alexander DC, Turenne CY, de Haas P, Overduin P, van Soolingen D, et al. Genomic polymorphisms for Mycobacterium avium subsp. paratuberculosis diagnostics. J Clin Microbiol. (2005) 43:3704–12. doi: 10.1128/JCM.43.8.3704-3712.2005
18. Sidoti F, Banche G, Astegiano S, Allizond V, Cuffini AM, Bergallo M. Validation and standardization of IS900 and F57 real-time quantitative PCR assays for the specific detection and quantification of Mycobacterium avium subsp. paratuberculosis. Can J Microbiol. (2011) 57:347–54. doi: 10.1139/w11-022
19. Slana I, Liapi M, Moravkova M, Kralova A, Pavlik I. Mycobacterium avium subsp. paratuberculosis in cow bulk tank milk in Cyprus detected by culture and quantitative IS900 and F57 real-time PCR. Prev Vet Med. (2009) 89:223–6. doi: 10.1016/j.prevetmed.2009.02.020
20. Paustian ML, Kapur V, Bannantine JP. Comparative genomic hybridizations reveal genetic regions within the Mycobacterium avium complex that are divergent from Mycobacterium avium subsp. paratuberculosis isolates. J Bacteriol. (2005) 187:2406–15. doi: 10.1128/JB.187.7.2406-2415.2005
21. Paustian ML, Zhu X, Sreevatsan S, Robbe-Austerman S, Kapur V, Bannantine JP. Comparative genomic analysis of Mycobacterium avium subspecies obtained from multiple host species. BMC Genomics. (2008) 9:135. doi: 10.1186/1471-2164-9-135
22. Paustian ML, Bannantine JP, Kapur V. Mycobacterium avium subspecies paratuberculosis Genome. In: Behr MA, Collins DM, editors. Paratuberculosis: Organism, Disease, Control. Oxfordshire: CAB International (2010). p. 73–82.
23. Page AJ, Cummins CA, Hunt M, Wong VK, Reuter S, Holden MT, et al. Roary: rapid large-scale prokaryote pan genome analysis. Bioinformatics. (2015) 31:3691–3. doi: 10.1093/bioinformatics/btv421
24. Fouts DE, Brinkac L, Beck E, Inman J, Sutton G. PanOCT: automated clustering of orthologs using conserved gene neighborhood for pan-genomic analysis of bacterial strains and closely related species. Nucleic Acids Res. (2012) 40:e172. doi: 10.1093/nar/gks757
25. Ben Salah I, Cayrou C, Raoult D, Drancourt M. Mycobacterium marseillense sp. nov., Mycobacterium timonense sp. nov. and Mycobacterium bouchedurhonense sp. nov., members of the Mycobacterium avium complex. Int J Syst Evol Microbiol. (2009) 59(Pt 11):2803–8. doi: 10.1099/ijs.0.010637-0
26. Matsumoto Y, Kinjo T, Motooka D, Nabeya D, Jung N, Uechi K, et al. Comprehensive subspecies identification of 175 nontuberculous mycobacteria species based on 7547 genomic profiles. Emerg Microbes Infect. (2019) 8:1043–53. doi: 10.1080/22221751.2019.1637702
27. Goethe R, Basler T, Meissner T, Goethe E, Sproer C, Swiderski J, et al. Complete genome sequence and manual reannotation of Mycobacterium avium subsp. paratuberculosis strain DSM 44135. Microbiol Resour Announc. (2020) 9:e00711–20. doi: 10.1128/MRA.00711-20
28. Goethe R, Laarmann K, Sproer C, Bunk B. Complete genome sequence of Mycobacterium avium subsp. avium Chester (DSM 44156). Microbiol Resour Announc. (2020) 9:e01549–19. doi: 10.1128/MRA.01549-19
29. Kanehisa M, Furumichi M, Tanabe M, Sato Y, Morishima K. KEGG: new perspectives on genomes, pathways, diseases and drugs. Nucleic Acids Res. (2017) 45:D353–61. doi: 10.1093/nar/gkw1092
30. Huerta-Cepas J, Szklarczyk D, Heller D, Hernandez-Plaza A, Forslund SK, Cook H, et al. eggNOG 5.0: a hierarchical, functionally and phylogenetically annotated orthology resource based on 5090 organisms and 2502 viruses. Nucleic Acids Res. (2019) 47:D309–14. doi: 10.1093/nar/gky1085
31. Semret M, Turenne CY, de Haas P, Collins DM, Behr MA. Differentiating host-associated variants of Mycobacterium avium by PCR for detection of large sequence polymorphisms. J Clin Microbiol. (2006) 44:881–7. doi: 10.1128/JCM.44.3.881-887.2006
32. Rajagopal A, Yurk D, Shin C, Menge K, Jacky L, Fraser S, et al. Significant expansion of real-time PCR multiplexing with traditional chemistries using amplitude modulation. Sci Rep. (2019) 9:1053. doi: 10.1038/s41598-018-37732-y
33. Casali N, Riley LW. A phylogenomic analysis of the actinomycetales mce operons. BMC Genomics. (2007) 8:60. doi: 10.1186/1471-2164-8-60
34. Amin AS, Hsu CY, Darwish SF, Ghosh P, AbdEl-Fatah EM, Behour TS, et al. Ecology and genomic features of infection with Mycobacterium avium subspecies paratuberculosis in Egypt. Microbiology. (2015) 161(Pt 4):807–18. doi: 10.1099/mic.0.000051
35. Motiwala AS, Amonsin A, Strother M, Manning EJ, Kapur V, Sreevatsan S. Molecular epidemiology of Mycobacterium avium subsp. paratuberculosis isolates recovered from wild animal species. J Clin Microbiol. (2004) 42:1703–12. doi: 10.1128/JCM.42.4.1703-1712.2004
36. Bannantine JP, Paustian ML, Waters WR, Stabel JR, Palmer MV, Li L, et al. Profiling bovine antibody responses to Mycobacterium avium subsp. paratuberculosis infection by using protein arrays. Infect Immun. (2008) 76:739–49. doi: 10.1128/IAI.00915-07
37. Li L, Bannantine JP, Zhang Q, Amonsin A, May BJ, Alt D, et al. The complete genome sequence of Mycobacterium avium subspecies paratuberculosis. Proc Natl Acad Sci USA. (2005) 102:12344–9. doi: 10.1073/pnas.0505662102
Keywords: M. avium, Mycobacterium, paratuberculosis (Map), whole genome comparison, diagnostics, PCR
Citation: Bannantine JP, Stabel JR, Bayles DO, Conde C and Biet F (2021) Diagnostic Sequences That Distinguish M. avium Subspecies Strains. Front. Vet. Sci. 7:620094. doi: 10.3389/fvets.2020.620094
Received: 21 October 2020; Accepted: 31 December 2020;
Published: 28 January 2021.
Edited by:
Miguel Salgado, Austral University of Chile, ChileReviewed by:
Marta Alonso-Hearn, NEIKER-Instituto Vasco de Investigación y Desarrollo Agrario, SpainMin Yue, Zhejiang University, China
Copyright © 2021 Bannantine, Stabel, Bayles, Conde and Biet. This is an open-access article distributed under the terms of the Creative Commons Attribution License (CC BY). The use, distribution or reproduction in other forums is permitted, provided the original author(s) and the copyright owner(s) are credited and that the original publication in this journal is cited, in accordance with accepted academic practice. No use, distribution or reproduction is permitted which does not comply with these terms.
*Correspondence: John P. Bannantine, am9obi5iYW5uYW50aW5lQHVzZGEuZ292