
94% of researchers rate our articles as excellent or good
Learn more about the work of our research integrity team to safeguard the quality of each article we publish.
Find out more
ORIGINAL RESEARCH article
Front. Tuberc., 02 April 2025
Sec. Pathogen and Host Biology of Tuberculosis
Volume 3 - 2025 | https://doi.org/10.3389/ftubr.2025.1500899
This article is part of the Research TopicRising Stars in Tuberculosis and Mycobacterial Diseases: 2023View all 5 articles
 Ethan Bustad1
 Edson Petry2†Oliver Gu2†
 Braden T. Griebel1,3Tige R. Rustad1
 David R. Sherman4
 Jason H. Yang2,5*
 Shuyi Ma1,3,6,7*
Introduction: Mycobacterium tuberculosis (Mtb) is the causative agent of tuberculosis disease, the greatest source of global mortality by a bacterial pathogen. Mtb adapts and responds to diverse stresses, such as antibiotics, by inducing transcriptional stress response regulatory programs. Understanding how and when mycobacterial regulatory programs are activated could inform novel treatment strategies that hinder stress adaptation and potentiate the efficacy of new and existing drugs. Here, we sought to define and analyze Mtb regulatory programs that modulate bacterial fitness under stress.
Methods: We assembled a large Mtb RNA expression compendium and applied this to infer a comprehensive Mtb transcriptional regulatory network and compute condition-specific transcription factor activity (TFA) profiles. Using transcriptomic and functional genomics data, we trained an interpretable machine learning model that predicts Mtb fitness from TFA profiles.
Results: We demonstrated that a TFA-based model can predict Mtb growth arrest and growth resumption under hypoxia and reaeration using gene expression data alone. This model also directly elucidates the transcriptional programs driving these growth phenotypes.
Discussion: These integrative network modeling and machine learning analyses enable the prediction of mycobacterial fitness across different environmental and genetic contexts with mechanistic detail. We envision these models can inform the future design of prognostic assays and therapeutic interventions that can cripple Mtb growth and survival to cure tuberculosis disease.
Mycobacterium tuberculosis (Mtb) is a highly successful pathogen, infecting 10.6 million people and killing over 1 million people worldwide each year (1). A key factor for Mtb's success is its ability to adapt to a broad range of host-associated and treatment-associated stresses. However, the mechanisms underlying how Mtb dynamically regulates its growth and physiology in response to stress remain incompletely understood. Understanding the gene regulatory activities of transcription factors (TFs) under different environmental or stress conditions could help inform interventions that modulate Mtb growth and survival to cure tuberculosis disease.
Several groups have previously characterized Mtb's transcriptional regulatory network (TRN) using experimental and computational approaches (2–9). These efforts have largely relied on two strategies: (1) detailed profiling of the molecular effects of individual TFs on Mtb physiology using recombinant TF induction and disruption strains, and (2) statistically informed TRN inference using data from large transcriptomic compendia.
In principle, TRNs can be empirically assembled from measurements of TF-DNA binding and gene expression under conditions with known TF perturbations. This approach would be expected to enable the inference of direct regulatory interactions between TFs and their putative target genes, which would be expected to exhibit altered expression in response to TF perturbations and provide evidence of TF binding events proximal to a gene. To leverage this strategy, we previously engineered a library of Mtb recombinant TF induction (TFI) strains (2, 6). We profiled transcriptomes in 208 TFI strains using DNA microarrays [GSE59086, (6, 10)] and detected ~16,000 ChIP-seq binding events for 154 TFs (~80% of all Mtb TFs) and 2,843 genes (~70% of all Mtb genes) (3, 10). While these ChIP-seq and microarray experiments yielded important insights into the regulatory programs active during Mtb broth culture, they also possessed several limitations. For example, our microarray profiling efforts were unable to measure changes in expression for 1,190 genes (~30% of Mtb genes) (6), and our ChIP-seq profiling efforts were unable to detect TF binding for 1,040 genes (~26% of Mtb genes) (3). Moreover, these data were limited to log-phase growth of the Mtb laboratory strain H37Rv in 7H9 media. These excluded condition-specific interactions relevant to other environments or strains. Thus, significant gaps remained in the ability to comprehensively identify TF-gene regulatory interactions using only experimental approaches alone.
Bioinformatic network inference provides a useful complementary strategy for assembling TRNs. These statistically informed approaches utilize large-scale expression compendia (comprising transcriptomic profiles across diverse biological conditions) to enable the inference of regulatory relationships across a multitude of conditions. However, these computational strategies are constrained by two limitations. First, large and biologically diverse gene expression data are needed to enable the identification of high-confidence statistical associations between TFs and their putative target genes (11). Second, network inference algorithms differ in the assumptions made on the training data and on the interpretation of TF-gene associations. Biologically diverse gene expression data may be curated from public microarray (4, 10) or RNA-seq (7, 12, 13) data. However, the statistical assumptions underlying most network inference methods are often biologically inaccurate.
We previously performed computational network inference analyses and were able to infer only 598 clusters of coregulated gene expression for 3,922 genes (4). Others have performed similar analyses and inferred either 80 clusters for 3,906 genes (7) or 560 co-regulated gene modules for 3,912 genes (5). While these studies successfully uncovered novel regulatory interactions underlying Mtb stress adaptation, none of their network models comprehensively revealed transcriptional programs for each of Mtb's 214 TFs, and none directly estimated TF activities [TFAs: the extent of regulation that each TF exerts on its regulon (14)] under different experimental conditions. Network inference studies for other microbes, such as the DREAM5 challenge for E. coli and S. aureus (15), demonstrated that robust TRNs may be assembled by integrating the regulatory relationships inferred by different network inference algorithms. We hypothesized that applying a similar “wisdom of crowds” approach to aggregate complementary TRNs from different inference methods would yield a more comprehensive and higher quality Mtb TRN than from any single method alone.
Here, we assembled a biologically diverse and batch-corrected Mtb RNA-seq gene expression compendium. We integrated this RNA-seq compendium with a perturbative TFI microarray dataset to infer a comprehensive Mtb TRN that included 214 TFs and 3,978 genes. We used this TRN to estimate TFA profiles corresponding to individual RNA expression profiles. We trained an interpretable machine learning regression model using growth phenotypes from a pooled TFI screen (16) and calculated TFAs for individual TFI strains. We demonstrated that this regression model can accurately predict Mtb fitness under stress conditions such as hypoxia.
Microarray expression data corresponding to TFI strains were downloaded from GEO (GSE59086). Experimental group numbers were assigned to each sample based on the identity of each strain. The Rv2160A gene fully encompasses the Rv2160c gene, so the Rv2160A and Rv2160c samples were combined into a single Rv2160 TFI strain group. This resulted in 208 TFI strain groups. These 208 strain groups included Rv0560, Rv3164c, and Rv3692, which were initially considered hypothetical during in TFI strain construction (6) but later determined to not be true Mtb TFs (10). However, for the purpose of the analyses presented here, each of these 208 strains will be referred to as TFs. Smooth quantile normalization (17) was performed using PySNAIL (18) using the assigned group definitions (Supplementary Table 1).
The NCBI Sequence Read Archive (SRA) was queried with “Mycobacterium tuberculosis” for RNA expression samples containing raw FASTQ sequencing reads. Three thousand and ninety eightFASTQ sequencing reads were downloaded and combined with FASTQ sequencing reads from 312 unpublished RNA-seq profiles generated by our labs. We aligned these sequencing reads against the NC_000962.3 Mtb H37Rv reference genome using Bowtie 2 (19). Read counts were compiled using featureCounts (20). Samples with fewer than 400,000 total gene counts and duplicated samples were excluded from further analysis. Sequencing counts were normalized by transcripts per kilobase million (TPM). Group definitions representing unique experimental conditions were assigned to each sample; biological replicates were given the same group definitions. Smooth quantile normalization (17) was performed using PySNAIL (18) using the assigned group definitions (Supplementary Table 2). Quality data, adapter and quality trimming statistics, and alignment and counts metrics were compiled and assessed using MultiQC (21).
RNA expression compendia and TFAs were visualized by Uniform Manifold Approximation & Projection (UMAP) (22). Clusters were estimated by DBSCAN using Euclidean distance with a minimum cluster size of 3 (23). The ε hyperparameter was optimized for each dataset by varying ε across 50 logarithmically distributed values from 0.1 to 10 and selecting the value of the elbow of the ε vs. Number of Outliers plot. This selection delivers the minimum number of clusters that maximizes inclusion of samples without overfitting the data (Supplementary Figure 1). UMAP and DBSCAN analyses were performed in Python using their implementations in umap-learn and scikit-learn (24).
We implemented an ensemble of network inference methods based on a selection of methods featured in the DREAM5 challenge (15), based on diversity in underlying statistical approach, predictive performance reported in the DREAM5 study, and the availability of a working implementation. Our initial selection consisted of ARACNe (25, 26), CLR (27), and GENIE3 (28). We chose an ARACNe implementation that employs adaptive partitioning for more efficient processing (25, 26). We used an R implementation of CLR available on CRAN from the parmigene package (29). We used an R implementation of GENIE3 available on BioConductor (30). To supplement these methods, we incorporated two other recent network inference approaches: cMonkey2 (31, 32) and iModulon (33). We used a docker image containing a Python implementation of cMonkey2, available at https://hub.docker.com/r/weiju/cmonkey2. For iModulon, our desired output was different from the output of this algorithm implemented by the original authors; we created a custom iModulon implementation in Python based on Sastry et al. (34). We implemented an Elastic Net regularization-based network inference approach in Python using scikit-learn (24). Elastic Net is a regularization method that takes advantage of the unique properties of both lasso and ridge regression (35) and performs better than either lasso or ridge regression when predictors are correlated and/or under-determined (36). We modeled each gene individually on the expression of all the TFs, and used the resulting coefficients to both select significant relationships and score those relationships. Descriptions of each inference method and the hyperparameters used are provided in Supplementary Table 3.
Each method was wrapped to produce a ranked list of putative TF regulator-target gene relationships in the order of the inferred strength of the regulatory relationship, from strongest to weakest. Execution was completed using docker images (https://hub.docker.com/repositories/malabcgidr?search=network-inference). Auto-regulatory (self-targeting) relationships were excluded. Hyperparameters were chosen to match either the original publications or the DREAM5 challenge when possible. Execution for each method and optimization of their corresponding hyperparameters were validated by testing against the evaluation scripts provided in the Supplementary material of Marbach et al. (15) and Reiss et al. (32).
A network was generated for each dataset (RNA-seq or TFI microarray) using the 6 inference methods, yielding 12 total constituent networks. Pairwise comparisons between inferred networks were made using rank-biased overlap (RBO) as previously described (37). The base RBO score was calculated with a p-value chosen to yield 50% weight for the first 1,000 relationships (p = 0.9997325) and a depth capped at about 25,000. RBO was performed using a custom Python implementation borrowing heavily from https://github.com/dlukes/rbo.
The 12 constituent networks were combined using Robust Rank Aggregation (RRA) (38). A p-value cutoff was calculated from a Monte Carlo simulation of possible Mtb regulatory network sizes. To compute these network sizes, a range of network out-degree distributions was generated, each conforming to 214 regulators, ~4,000 genes, a power-law exponent from −0.5 to −2, and a power-law multiplier ranging from 10−10 to 1010 on a logarithmic scale. Bounds for the power-law exponent were estimated based on RegulonDB E. coli networks (39) and Bhan et al. (40). For each putative out-degree distribution, the size of the network was calculated, yielding a sample of 175,000 plausible sizes. In the ranked list of edges output by RRA, all edges were kept for which the associated p-value score was less than the empirical probability of a simulated network having a size greater than or equal to the edge's associated network size (i.e., its rank); all remaining edges were discarded (Supplementary Figure 2).
Principal component analysis (PCA) was performed on the inferred networks (after truncating each to the size of the overall aggregate), the dataset-level aggregate networks, and the overall aggregate network, using the 30,912-dimensional space represented by the ranks of edges shared across at least 3 of the truncated inferred networks. All missing edges in each network were assigned a rank of 30,912, the size of the space.
Directionality for TF-gene regulatory interactions was determined using the regression models and measured TFI gene expression values (Supplementary Table 4). Two Elastic Net models and two unpenalized linear models were used to infer direction of regulation based on the sign of the regression coefficients, one of each for each dataset (RNA-seq compendium and TFI microarray profile). We supplemented these regression associations with the directionality of significant differential gene expression (i.e., upregulated vs. downregulated expression) measured from the TFI microarray dataset. Linear models were fit in Python with the statsmodels package. Coefficients with an FDR < 0.05 were selected as evidence. Elastic Net models with an R2 of < 0.8 were excluded; coefficients that were included by the remaining models were selected as evidence. TFI differential expression from the microarray dataset was filtered using an FDR < 0.05 and requiring at least 2-fold change in either direction. Elastic Net models and TFI differential expression were considered strong evidence, whereas the unpenalized linear models were considered weak evidence. A flow chart depicting how the information from these models and differential expression analyses were used to define up vs. down regulation is shown in Supplementary Figure 3.
TRNs were validated by testing against a literature-curated TRN formed via the union of the H37Rv regulatory networks from BioCyc (41) and Sanz et al. (8). Sanz et al. Supplementary Material S1 was filtered for relationships whose supporting evidence included at least one high-confidence physical methodology: LacZ-promoter fusion, GFP-promoter fusion, proteomic studies, electrophoretic mobility shift assays (EMSA), one hybrid reporter system, and chip-on-chip. This yielded a set of 433 high-confidence regulator-target relationships, including 51 regulators and 160 total target genes, that had little to no dependence on the transcriptional information used to build the constituent networks. The BioCyc regulatory network consisted of 1,565 relationships of 102 regulators on 802 unique targets. The union of these two regulatory networks was taken and used to calculate the Matthews correlation coefficient (MCC), as described previously (42, 43), for each network, truncated to the size of the aggregate network to produce comparable results.
Gene ontology enrichment analysis was performed to characterize biological functions for genes associated with each TF (44, 45). For each TF, genes identified as upregulated, downregulated, or regulated in both directions were analyzed for GO enrichment at an FDR < 0.05. All identified GO annotations that had a child annotation also identified for a given TF were removed for simplicity. Results were filtered to TFs receiving at least 3 remaining significant GO enrichments for further manual inspection and analysis (Supplementary Table 5). TFs with an annotated name and considered to have a literature-supported role listed in the Mycobrowser annotation (46) were assessed for network validation (Table 1). GO analysis was performed in Python using the goatools package (47). Gene ontology data was taken from the 2024-06-17 release of go-basic.obo from the Gene Ontology knowledgebase (48) (https://purl.obolibrary.org/obo/go/releases/2024-06-17/go-basic.obo), and mappings to Mtb genes were taken from the European Bioinformatics Institute GOA project, release 20240805 (https://ftp.ebi.ac.uk/pub/databases/GO/goa/proteomes/30.M_tuberculosis_ATCC_25618.goa).
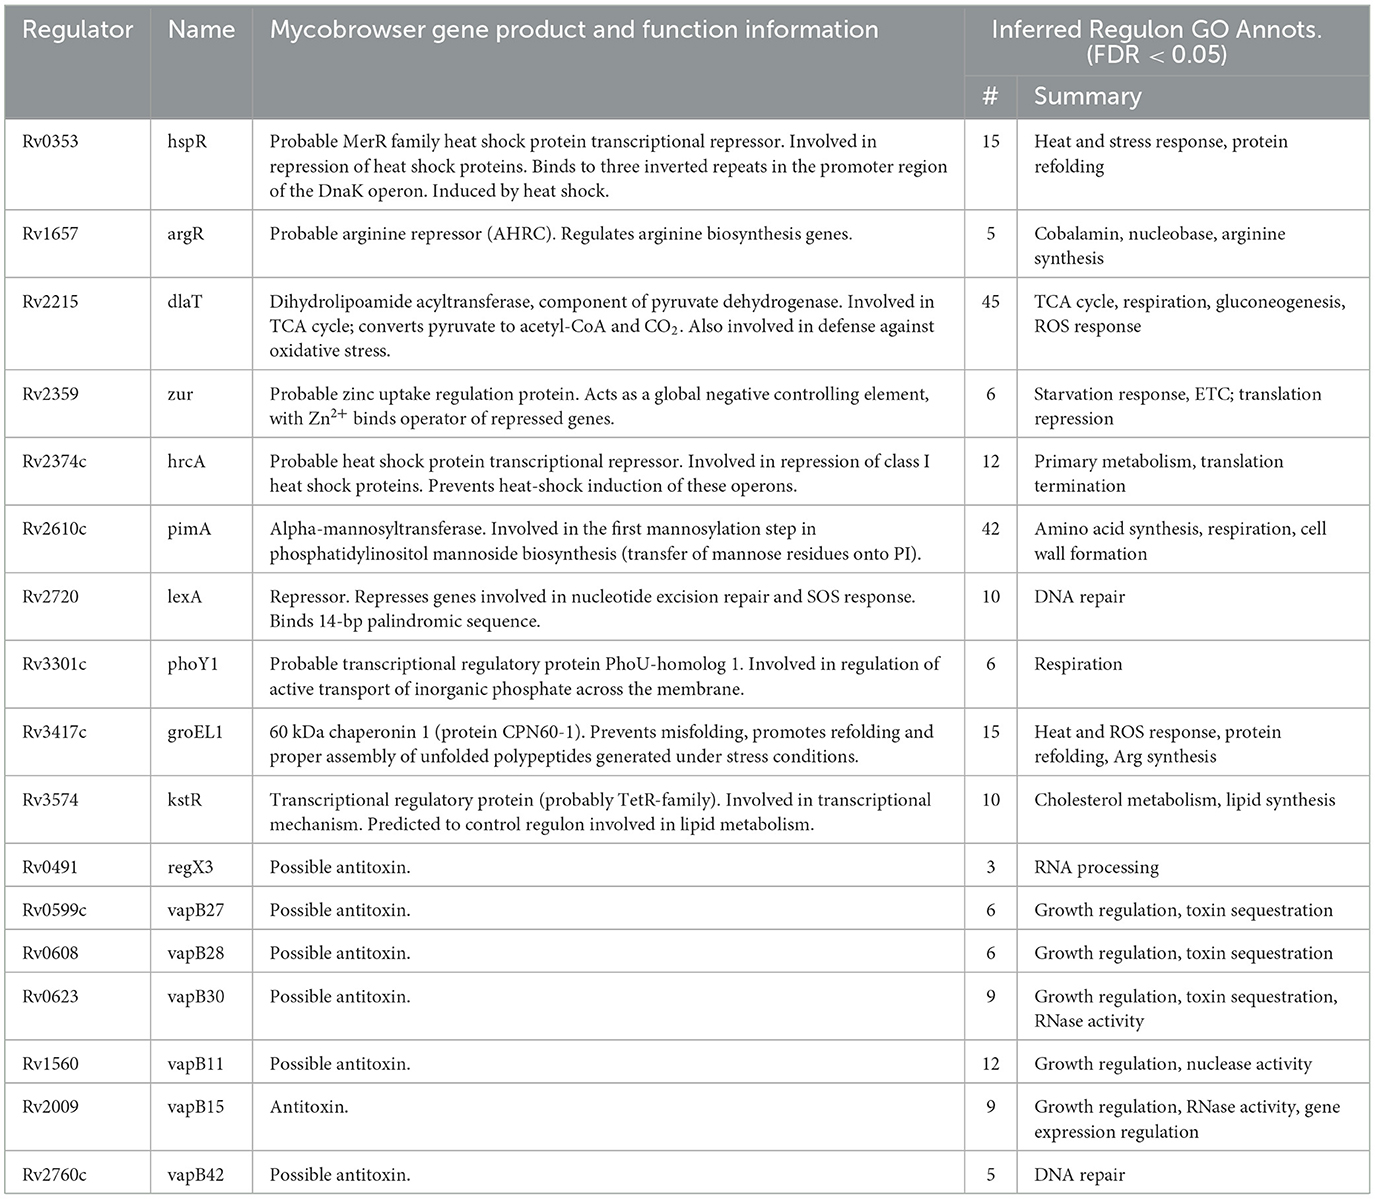
Table 1. Network regulators: annotation vs. gene set enrichment analysis of inferred regulon.
TFAs for each expression profile were computed using Robust Network Component Analysis (ROBNCA) (49). ROBNCA was implemented in Python, using code adapted from https://github.com/CovertLab/WholeCellEcoliRelease/tree/00cf7738cb/reconstruction/ecoli/scripts/nca (50).
We constructed a model associating mycobacterial growth with TFAs estimated from gene expression data. The GSE59086 microarray dataset was again used as a broad measure of TFI conditions, with relative growth data for 194 matching TFI conditions added from Ma et al. Supplementary Table S1 as training data (16). TFAs were computed from log2 fold-change expression using the control strengths calculated by ROBNCA from the aggregate network and RNA-seq compendium. An Elastic Net model was trained to regress growth on TFAs, using a grid search cross-validation scheme to optimize hyperparameters. The model was implemented in Python using the scikit-learn package (24).
Wildtype H37Rv (ATCC 27294) transformed with a control anhydrotetracycline (ATc)-inducible expression vector (H37Rv::pEXCF-empty, which does not induce recombinant gene expression) were cultured under in Middlebrook 7H9 with the oleic acid, bovine albumin, dextrose, and catalase (OADC) supplement (Difco) and with 0.05% Tween 80 at 37°C. H37Rv::pEXCF-empty was grown with the addition of 50 μg/mL hygromycin B to maintain the plasmid and induced with 100 ng/mL ATc 1 day prior to onset of hypoxia. For hypoxia, strains were cultured in oxygen-limited conditions (1% aerobic O2 tension) for 7 days, followed by reaeration on day 7–12, initiated by transferring cultures into continuously rolled bottles with 5:1 head space ratio using methods described previously (2, 51–53). Bacterial survival and growth were enumerated by plating for colony forming units (CFU) on Middlebrook 7H10 solid media plates using standard microbiological methods.
Transcriptomes were generated by RNA-seq from bacterial cultures sampled from the aforementioned conditions using methods described previously (54). Briefly, bacterial pellets suspended in TRIzol were transferred to a tube containing Lysing Matrix B (QBiogene) and vigorously shaken in a homogenizer. The mixture was centrifuged, and RNA was extracted from the supernatant with chloroform, followed by RNA precipitation by isopropanol and high-salt solution (0.8 M Na citrate, 1.2 M NaCl). Total RNA was purified using a RNeasy kit following the manufacturer's recommendations (Qiagen). rRNA was depleted from samples using the RiboZero rRNA removal (bacteria) magnetic kit (Illumina Inc., San Diego, CA). Illumina sequencing libraries were prepared from the resulting samples using the NEBNext Ultra RNA Library Prep kit for Illumina (New England Biolabs, Ipswich, MA) according to the manufacturer's instructions, and using the AMPure XP reagent (Agencourt Bioscience Corporation, Beverly, MA) for size selection and cleanup of adaptor-ligated DNA. We used the NEBNext Multiplex Oligos for Illumina (Dual Index Primers Set 1) to barcode the libraries to enable sample multiplexing per sequencing run. The prepared libraries were quantified using the Kapa quantitative PCR (qPCR) quantification kit and sequenced at the University of Washington Northwest Genomics Center with the Illumina NextSeq 500 High Output v2 kit (Illumina Inc., San Diego, CA). The sequencing run generated an average of 75 million base-pair paired-end raw read counts per library. Read alignment and gene expression estimation was carried out using a custom processing pipeline in R that harnesses the Bowtie 2 utilities (19, 55), which is publicly accessible at https://github.com/robertdouglasmorrison/DuffyTools and https://github.com/robertdouglasmorrison/DuffyNGS.
Corresponding TFAs were estimated by applying the ROBNCA-parameterized TRN to each gene expression profile. These were applied as inputs to the TFA–fitness Elastic Net model to predict relative fitness level at each time point. Predictions were faceted by day and biological replicate. TF expression, activity, and impact (product of respective regression coefficient and TFA) were normalized to z-score across all samples and TFs for comparison. These were then grouped by condition (hypoxic or normoxic), and TFs with mean impact z-score of a greater absolute value than 1.96 were selected for further analysis and visualization.
False discovery rate correction was performed using the two-stage Benjamini-Krieger-Yekutieli method (56).
Our previous efforts to characterize Mtb's TRN relied on microarray expression profiles from recombinant TFI strains as perturbative training data [GSE59086, (6)]. However, while these data enabled some detailed characterization of Mtb's transcriptional programming during log-phase broth culture, they lacked biological diversity. UMAP and DBSCAN analyses reveal that expression profiles from these 698 microarray experiments and 208 TFI conditions formed only 15 unique expression clusters (Figure 1A). This poor biological diversity stems from the original experimental design, in which each TFI strain was grown to log-phase in albumin-dextrose-catalase (ADC)-supplemented 7H9 media before RNA isolation. In addition, microarray technologies possess poor sensitivity and limited dynamic range (57). We found that 101 genes in this dataset did not possess expression measurements >10 log2 units, indicating poor sensitivity (Figure 1B, Supplementary Table 1). Moreover, the median absolute deviation (MAD) was small (< 1) for nearly all genes, indicating limited dynamic range. These limitations motivated the need to assemble a larger and more biologically diverse RNA expression compendium.
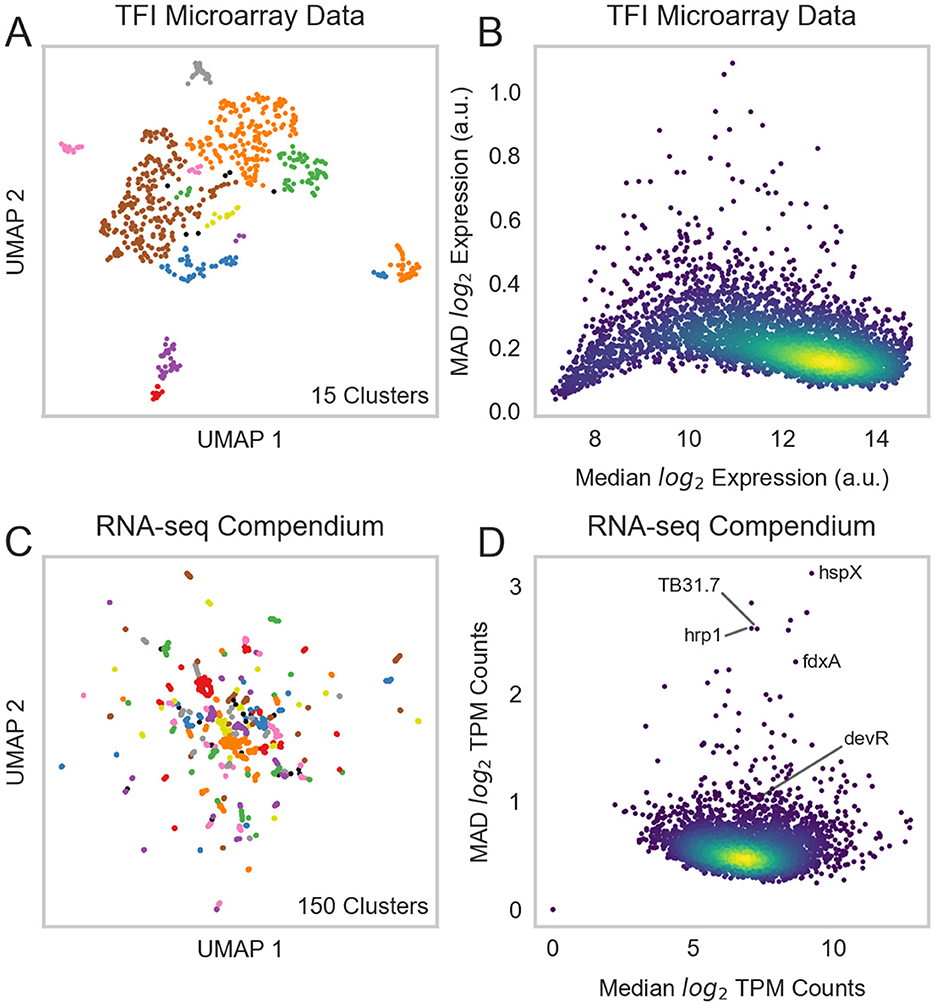
Figure 1. A biologically diverse Mtb RNA expression compendium. (A) UMAP visualization of biological diversity in the TFI microarray data. TFI data were batch-corrected by smooth quantile normalization before computing the UMAP. Density-based spatial clustering (DBSCAN) was performed on the UMAP to identify clusters of samples with similar gene expression. UMAP and DBSCAN analyses revealed 15 total gene expression clusters in the TFI dataset. (B) Median vs. median absolute deviation (MAD) plot of expression for each gene across the TFI dataset. Each point represents a gene. Median expression and MAD were calculated for each gene across the 698 samples. Colors reveal point density (yellow: high density, blue: low density). (C) UMAP visualization of samples from the normalized and batch-corrected RNA-seq compendium determined by gene expression. UMAP and DBSCAN analyses reveal 150 clusters of samples with similar gene expression. (D) Median vs. MAD plot of expression for each gene across the RNA-seq compendium.
Thus, we curated an RNA-seq expression compendium using samples from the NCBI Sequence Read Archive (SRA) and unpublished samples from our own labs. We aligned, filtered, normalized, and batch-corrected these samples to form our final compendium (see Section 2). Batch correction is an important pre-processing step for unifying data from different sources that has been frequently overlooked in previous Mtb RNA expression compendium analyses (4, 7, 12, 13). After performing these pre-processing steps, our final compendium comprised 3,410 RNA-seq samples from 1,422 experimental conditions (Supplementary Table 2). Expression counts for the RNA-seq compendium can be queried at https://tfnetwork.streamlit.app/.
UMAP and DBSCAN analyses validated the biological diversity of our batch-corrected RNA-seq expression compendium (Figure 1C). These analyses identified 150 unique expression clusters. The dynamic range and variation in gene expression was significantly greater in this RNA-seq expression compendium than in the TFI microarray dataset (Figure 1D). Of note, most genes with high variation (high MAD) were well-characterized stress response genes [e.g., Rv2031c (hspX), Rv2626c (hrp1), Rv2623 (TB31.7), and Rv2007c (fdxA)]. Interestingly, many of these genes possessed higher variation than the commonly studied stress response regulator Rv3133c (devR). These overall results are consistent with expectation, as most stress response genes would be expected to only be induced in the presence of their specific stressor.
Network inference studies in other bacteria have shown that aggregate TRNs, formed by integrating regulatory relationships derived from multiple inference algorithms, outperform networks generated by individual methods (15). To comprehensively model Mtb transcriptional regulation, we employed a “wisdom of crowds” ensemble inference approach. Using our RNA-seq compendium, we generated a set of 6 TRNs using different network inference methods (see Section 2). These methods were selected because they have either been shown to be sensitive to distinct types of regulatory relationships (15) or have been previously applied to infer regulatory relationships in Mtb (4, 5, 7). To further diversify the inferred networks, we also applied these methods to the TFI microarray dataset. Collectively, these activities yielded 12 networks that described ~783,400 unique relationships between 214 regulators and 4,029 target genes. Pairwise comparisons revealed that the networks predicted by the different inference methods were mostly dissimilar (Supplementary Figure 4). From these, we constructed aggregate networks for the RNA-seq compendium, TFI microarray dataset, and the combination of both datasets using Robust Rank Aggregation (RRA) (38) (see Section 2). Principal component analysis on the individual and aggregate networks corroborated the substantial diversity derived from the different network inference methods and datasets (Figure 2A).
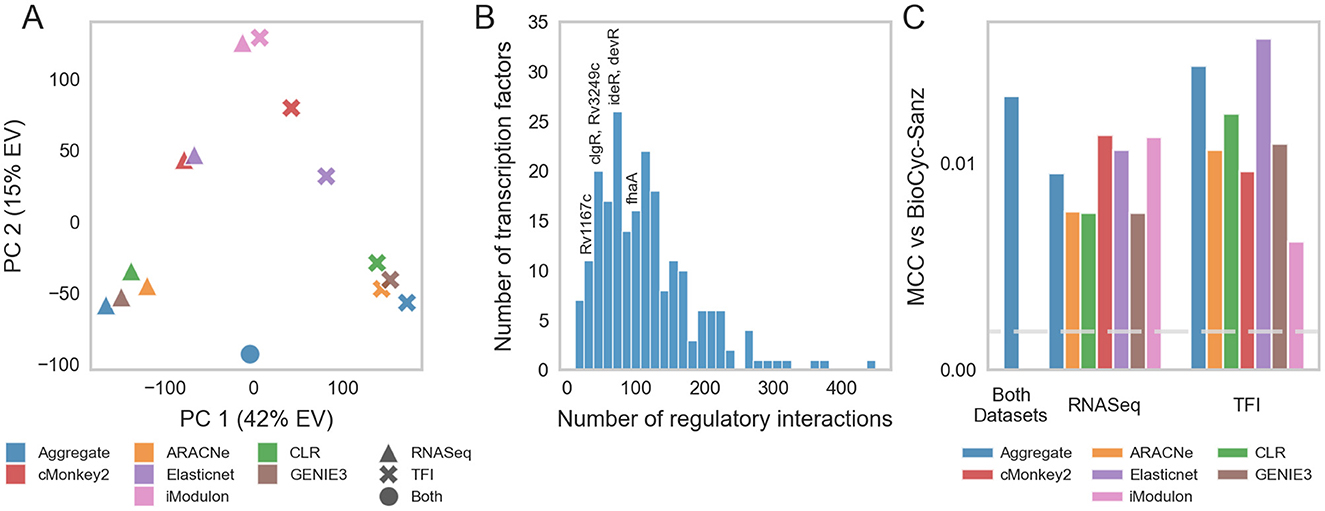
Figure 2. Mtb transcriptional regulatory network. (A) PCA was performed on individual and aggregate TRNs generated by different network inference algorithms. PC1 is highly correlated with the dataset used; PC2 is highly correlated with the method used. (B) Out-degree distribution of TF-gene interactions (edges) from the overall aggregate network. The distribution of transcriptional regulatory programs largely follows the power law. Highly impactful regulators of hypoxia, in addition to the general stress response regulator Rv3133c (devR) are annotated. (C) Validation of each network against literature-curated TRNs. The Matthews correlation coefficient (MCC) was computed between each individual or aggregate TRN and the union of manually curated TRNs by Sanz et al. (8) and BioCyc (41). Blue bars depict the MCC for aggregate networks; the other colors depict the MCC for the individual inferred networks. The horizontal dashed line represents the 95th percentile MCC performance of 1,000 randomly generated networks.
The final overall aggregate network model comprised 24,543 regulatory relationships linking 214 transcriptional regulators with 3,978 target genes. Among these relationships, 16,292 were associated with transcriptional activation, 3,247 with transcriptional repression, 1,093 with context-dependent regulation, and 3,911 with undetermined directionality (Supplementary Table 4). These relationships represent both direct biophysical interactions as well as indirect regulatory relationships mediated through intermediate regulators. The distribution of regulatory relationships for each TF largely followed a power law distribution; this is consistent with the scale-free network architectures found in the transcriptional networks of other bacteria (Figure 2B, Supplementary Figure 2C) (58). The networks are accessible at https://tfnetwork.streamlit.app/. TF-gene relationships are provided in Supplementary Table 4.
To validate our aggregate network, we benchmarked it against previously established regulatory relationships gleaned from the literature (see Section 2). We evaluated the consensus between this high-confidence regulatory interaction dataset and our inferred regulatory networks using the Matthews correlation coefficient (MCC) (42, 43). We found that all of the inferred networks possessed significant MCCs and that the overall aggregate network outperformed most of the networks derived using only one network inference method (Figure 2C).
We also assessed the extent to which the regulatory relationships captured by the aggregate network preserved biologically meaningful functional relationships between TFs and target genes. For well-studied TFs, gene ontologies for their predicted target genes were highly consistent with what has been reported for that TF in the literature (Table 1, Supplementary Table 5A). For example, Rv3574 (kstR) is a TF that has been linked to cholesterol metabolism (59) and the target genes associated with kstR possess gene ontology annotations linked to cholesterol metabolism (Table 1). Additionally, toxin-antitoxin target genes were enriched for growth regulation, highlighting that the regulatory relationships captured by the aggregate network include indirect regulatory interactions. These results suggest that the ontologies and functional annotations predicted for poorly characterized TFs may provide experimentally testable insights on their function. This is one of the major advances from the aggregate network.
Understanding when TFs actively regulate their target genes can reveal mechanistic insights into bacterial physiology and stress response. Network component analysis (NCA) is an efficient way of estimating TFA profiles from expression data by using a TRN to perform matrix decomposition (14). Robust NCA (ROBNCA) is a variant of NCA that improves the performance of NCA calculations on noisy data with outlier measurements (49). We applied ROBNCA to estimate TRN control strengths and TFAs corresponding to each sample in our TFI microarray and RNA-seq compendium.
We applied ROBNCA to our RNA-seq compendium using the aggregate TRN inferred from the RNA-seq compendium and TFI microarray data (Supplementary Table 6). UMAP and DBSCAN analyses revealed less biological diversity in ROBNCA-predicted TFAs than RNA expression profiles alone (67 clusters of TFAs vs. 150 clusters of expression; Figure 3A). Amongst the TFs with the highest level of median activity were the lipid metabolism regulatory Rv3574 (kstR) and sigma factor Rv0182c (sigG) (Figure 3B). Consistent with expectation, the well-characterized stress response regulators Rv0757 (phoP) and Rv1994c (cmtR) were amongst the TFs with the highest TFA MAD.
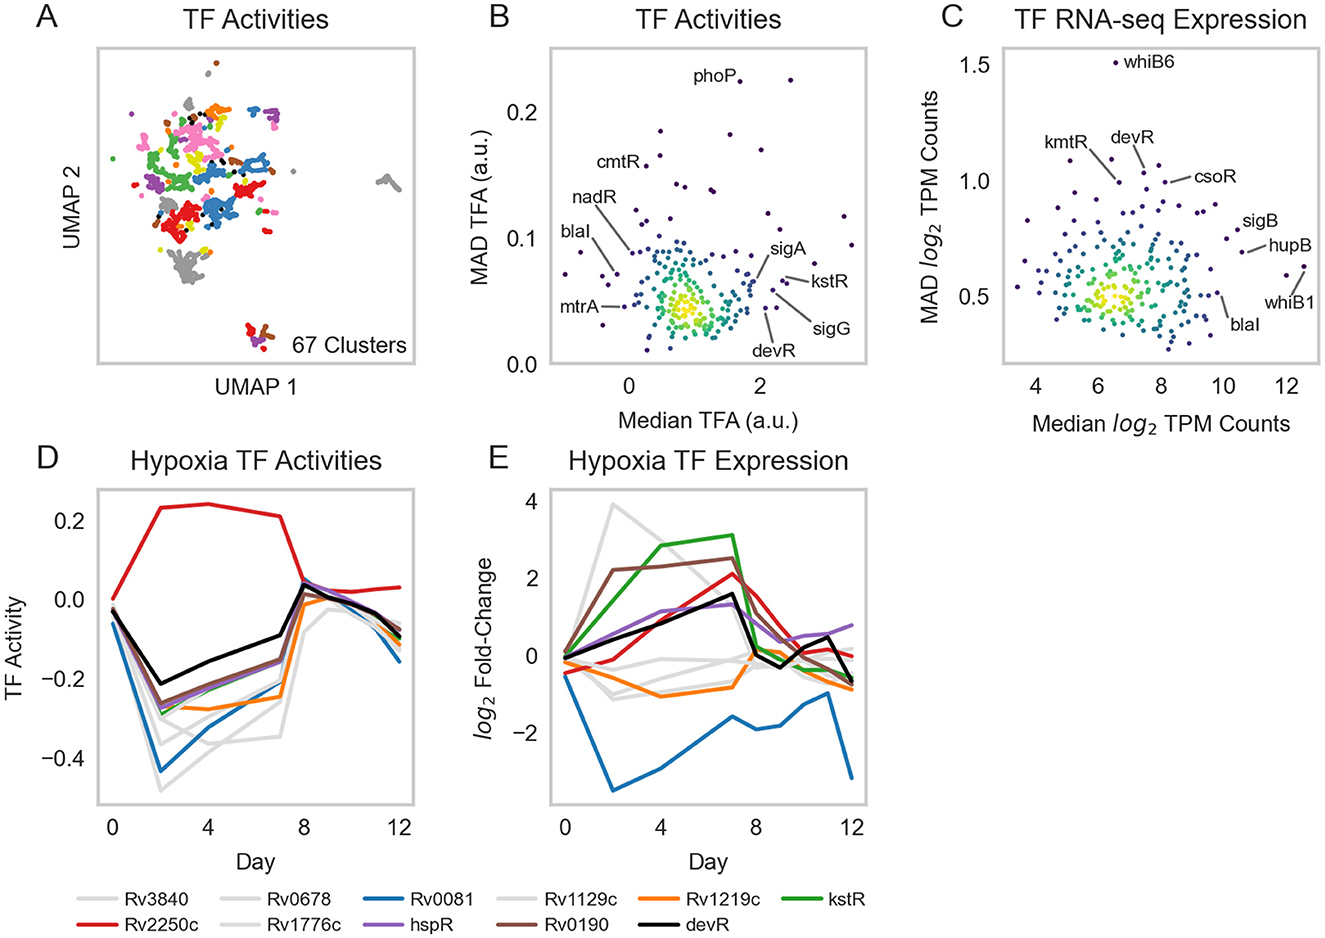
Figure 3. Transcription factor activities. (A) UMAP visualization of samples from the normalized and batch corrected RNA-seq compendium as determined by TFA. UMAP and DBSCAN analyses reveal 67 clusters of samples with similar TFAs. (B) Median vs. MAD plot of activity for each TF across the RNA-seq compendium. (C) Median vs. MAD plot of expression for each TF across the RNA-seq compendium. (D) TFAs highly active under hypoxia, as calculated using control strengths derived from ROBNCA calculation on the RNA-seq compendium, throughout a 12-day hypoxia-reaeration experiment. TFs plotted in color have been previously found to correlate with hypoxia (7, 60–62). (E) Corresponding expression levels of TFs with high activity during hypoxia. Rv3133c (devR) is included as a point of reference.
Interestingly, the distribution of TFAs appeared different from that of TF expression levels measured for each RNA-seq sample across the compendium (Figure 3C). We tested the correlation of expression level vs. activity for each TF across the entire compendium and found that expression and activity were poorly correlated across the dataset (Pearson's r = 0.22 ± 0.23 median ± MAD). Six TFs were strongly correlated (| Pearson's r | ≥ 0.7), 25 TFs were moderately correlated (0.7 > | r | ≥ 0.5), and 60 TFs were weakly correlated (0.5 > | r | ≥ 0.3). These suggest that TF expression is not the key determinant for TFAs for most TFs. Rather, expression and activity convey two distinct but complementary insights into transcriptional regulation, highlighting the importance of accounting for network interactions when investigating transcriptional regulation.
To evaluate the performance of our TRN in predicting TFAs under stress, we performed experiments that profiled Mtb expression during hypoxia and reaeration. We grew the Mtb H37Rv empty vector control strain from our TFI strain library (2, 6) to exponential phase in 7H9 media supplemented with OADC and subjected cells to 7 days hypoxia, followed by 5 days reaeration (see Section 2). We sampled and sequenced RNA at several time points to profile changes in Mtb expression under hypoxia-reaeration stress. We estimated TFAs corresponding to each time point using our ROBNCA-trained TRN and evaluated the TF with the greatest predicted changes in activity during hypoxia (Figure 3D). Our analyses predicted significant changes in activity for several TFs that were previously described in the literature, including the general stress response regulator Rv3133c (devR), Rv0081 (early responder under hypoxia), and Rv2250c (late responder under hypoxia) (7, 60–62). Interestingly, changes in TFA during hypoxia and reaeration were not strongly correlated with changes in expression for these TFs (Figure 3E), further supporting our interpretation that TFA and expression convey different biological insights.
Because transcriptional programs mediate Mtb's response to changing environmental conditions, we asked whether our TRN could predict the Mtb growth fitness under stress. To test this hypothesis, we applied Elastic Net regularization to construct an interpretable machine learning regression model that could predict Mtb fitness from calculated TFA profiles alone. We trained this model using the TFAs computed by ROBNCA for each recombinant TFI strain from the microarray expression profiles and paired with fitness phenotypes that we previously measured in a Transcriptional Regulator Induced Phenotype (TRIP) screen (16). Both of these datasets were measured under log-phase, aerated culture conditions. The resulting TFA–fitness regression model explained ~80% of the observed variation in growth between the TFI strains in the TRIP screen (Supplementary Figure 5).
To determine if this TFA–fitness regression model could predict changes in Mtb fitness in conditions not included in the training data, we predicted the fitness of wildtype H37Rv cells undergoing hypoxia and reaeration stress based on time-varying RNA expression data during stress each phase. From the TFA profiles calculated for hypoxia-exposed cells, the TFA–fitness regression model predicted a significant decrease in growth over the entire hypoxia period (Figure 4A). From the TFA profiles calculated for cells under reaeration, the model predicted a recovery in Mtb growth comparable to log-phase culture. The predicted kinetics of shifts in growth aligned with the experimental measurements of Mtb bacteriostasis during hypoxia and regrowth during reaeration, thus validating the model predictions. Importantly, our TFA–fitness regression model performed better than a regression model trained only on TF expression (Supplementary Figure 6). These results further supported our hypothesis that TFAs more effectively capture condition-specific transcriptional regulation than TF expression alone, thus implying that the activation and regulation of transcriptional programs under hypoxia and reaeration involve non-linear mechanisms.
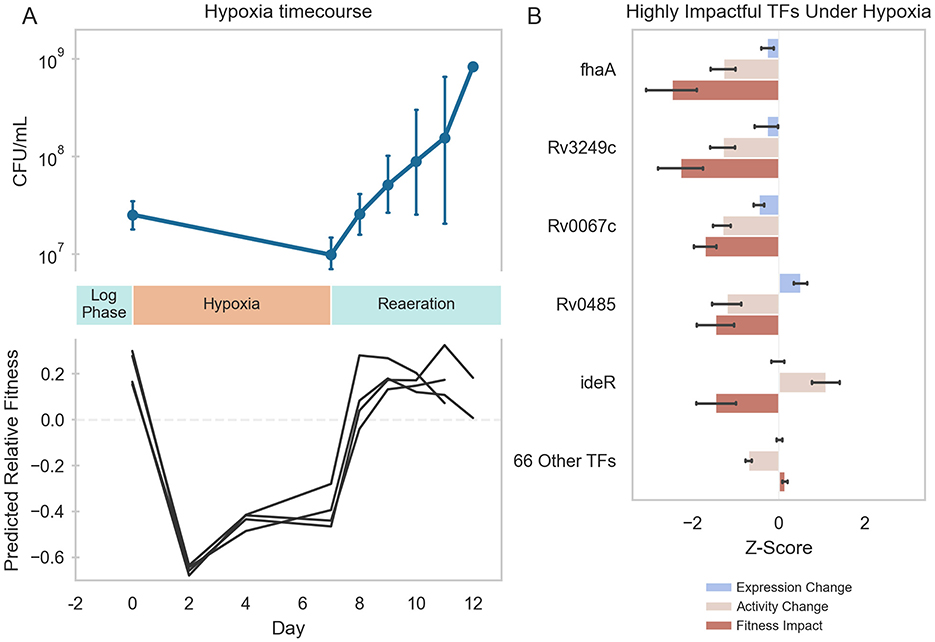
Figure 4. Machine learning predictions of Mtb fitness under hypoxia-reaeration stress. (A) Top: Mtb growth during hypoxia and reaeration. Mtb H37Rv::pEXCF-empty cells were to log-phase in 7H9 medium supplemented with OADC for 2 days (Day 0). Cells were subjected to 7 days hypoxia, followed by 5 days reaeration. Hypoxia induced growth arrest. Reaeration induced resumption of growth. Bottom: Elastic Net model predictions of Mtb fitness during hypoxia and reaeration. TFAs were estimated for each RNA-seq sample collected at different time points during the hypoxia-reaeration experiment. TFAs for each time point were supplied as inputs to the Elastic Net model to predict fitness at each time point. Model predicts decreased fitness during hypoxia and restored fitness during reaeration. Model predictions were made for each biological replicate in the experiment (depicted as separate lines). (B) The Elastic Net-predicted transcriptional regulators of Mtb fitness during hypoxia. Fitness impact scores were computed for each TF using the Elastic Net model. The fitness impact score for each TF is computed from its TFA and the regression coefficient for that TF in the Elastic Net model. Fitness impact scores were averaged over the period of hypoxia (days 2–7). Five TFs were predicted to be highly influential for growth arrest during hypoxia. Depicted is the gene expression, ROBNCA-predicted activity, and Elastic Net-predicted fitness impact for each TF. Error bars represent 95% confidence intervals.
Because the TFA–fitness regression model is directly interpretable, we examined which TFAs most strongly predicted the fitness changes under hypoxia and reaeration. Our TFA–fitness model predicted that growth restriction during hypoxia is primarily driven by 5 TFs whose TFA profiles changed significantly during hypoxia [Rv0020c (fhaA), Rv3249c, Rv0067c, Rv0485, and Rv2711 (ideR)] (Figure 4B). Again, TF activity was a stronger predictor of fitness impact than expression. Importantly, each of these TFs possesses direct or indirect links to hypoxia in the literature (Supplementary Table 7) (9, 60, 83–85). These results validate the ability of our model to directly predict mechanisms underlying Mtb stress response biology.
Understanding the molecular drivers of phenotypic changes in an organism is a fundamental goal in biological research. In this study, we applied machine learning approaches to construct an interpretable TFA–fitness regression model that could predict changes in Mtb growth under stress. Our model builds upon previous experimental profiling and network inference modeling efforts to characterize Mtb's TRN by integrating the data and algorithms from prior studies (2–7, 14, 15, 49). Moreover, by training on Mtb fitness profiles from TRIP screens, our model can directly predict growth phenotypes from condition-specific gene expression profiles alone.
Our “wisdom of crowds” approach for inferring transcriptional regulatory interactions delivered significant enrichment of known regulatory relationships while also broadening the scope of represented experimental conditions. Our resulting TRN is substantially larger than the networks inferred by many individual algorithms and performed better at recovering experimentally validated interactions (Figure 2C). This highlights the utility of ensemble inference algorithms (15).
Importantly, our results demonstrate how network models can generate experimentally testable hypotheses in at least two ways. First, our gene ontology enrichment analysis revealed significant associations between the annotated function of a TF's target genes and the condition-specific regulatory roles of the TF. It is important to note that the regulatory relationships identified by our aggregate TRN include both direct physical interactions between a TF and its putative target gene as well as indirect associations mediated by other factors. Both direct and indirect regulatory associations are important for coordinating changes in bacterial physiology (63), so it is expected that both types of interactions share annotated ontologies. Because ~25% of Mtb genes lack functional annotation (64), we think that the regulatory relationships identified in our TRN can generate hypotheses for the functions of poorly characterized or unknown genes (Supplementary Table 5).
Second, we demonstrate that TFA regression models can be trained to predict Mtb fitness under stress. Notably, we show that our TFA–fitness regression model was able to predict Mtb growth and bacteriostasis under hypoxia and reaeration—environmental conditions not used for training the TFA regression model. Thus, our results suggest that TFAs are a useful determinant of condition-specific changes in bacterial growth. Moreover, we show that TFAs are more predictive of growth phenotypes than TF expression alone (Supplementary Figure 6). This is consistent with expectation as Mtb uses transcriptional regulation to orchestrate behavioral adaptations to varying environments, including growth phenotypes. Our modeling analyses also reveal which TFAs underlie the predicted bacterial fitness outcomes. This directly generates hypotheses for the mechanisms underlying how TFs and their corresponding transcriptional programs are activated (e.g., via allosteric mechanisms and/or network interactions). Thus, our TRN and TFA–fitness models could potentially inform the identification of regulatory mechanisms mediating Mtb response and adaptation to clinically relevant stress conditions where gene expression profiling data are available. The TFs and target genes highlighted by these models may reveal druggable targets for manipulating Mtb's fitness under stress. In light of the growing crisis of antimicrobial resistance (65) and multi- and extensively-drug-resistant tuberculosis (66), we think our approach will be important for curing tuberculosis disease (67).
More broadly, our work demonstrates how network models can be leveraged for biologically meaningful interpretable machine learning applications. A fundamental challenge in machine learning is the difficulty in understanding how a machine learning model makes predictions (68, 69). We previously demonstrated that machine learning regression models can elucidate metabolic mechanisms underlying antibiotic lethality in E. coli (70) as well as predict multidrug interaction outcomes in Mtb (54). Our study here analogously extends this approach by training a regression model on TFAs to predict changes in Mtb growth under stress. The advantage of this strategy over other contemporary machine learning approaches is the explicit utilization of prior knowledge in the form of biological network models, which directly enables the generation of hypotheses for mechanisms linking network interactions to cell phenotypes. These hypotheses can then be experimentally tested (54, 70) and used as the basis for further mechanistic study (71) and investigation of translational potential.
Looking ahead, we envision that our TRN and our TFA–fitness regression model will be useful for several facets of tuberculosis research. We demonstrated that our regression model can predict changes in Mtb fitness under environmental stress from RNA expression profiles alone. Thus, our model may inform on fitness under clinically relevant conditions where standard microbiological tools are unavailable. In addition, there is increasing appreciation that Mtb drug susceptibility is regulated by its environment (72, 73). Our interpretable TFA–fitness regression model can be used to elucidate the molecular mechanisms underlying these phenotypes. Moreover, functional genetic datasets from different technologies are increasingly available (16, 74–79). These data can be applied to train next-generation TFA–fitness regression models with improved predictive power. Finally, detailed characterizations of Mtb clinical strains are now providing significant insights into how mutations and other forms of genomic diversity regulate drug susceptibility in human patients (79–82). We envision the TRN and TFA–fitness regression framework established here can be extended to not only study the mechanisms underlying differences in drug susceptibility amongst clinical isolates but also anticipate drug susceptibility phenotypes of new strains as they are curated.
The original contributions presented in the study are publicly available. These data can be found here: https://www.ncbi.nlm.nih.gov/geo/query/acc.cgi?acc=GSE292331, https://www.ncbi.nlm.nih.gov/geo/query/acc.cgi?acc=GSE292332, https://www.ncbi.nlm.nih.gov/geo/query/acc.cgi?acc=GSE292408, https://www.ncbi.nlm.nih.gov/geo/query/acc.cgi?acc=GSE292409, https://www.ncbi.nlm.nih.gov/geo/query/acc.cgi?acc=GSE292410, https://www.ncbi.nlm.nih.gov/geo/query/acc.cgi?acc=GSE292636, https://www.ncbi.nlm.nih.gov/bioproject/PRJNA1226619, and https://www.ncbi.nlm.nih.gov/bioproject/PRJNA1226648.
EB: Formal analysis, Investigation, Methodology, Software, Validation, Visualization, Writing – original draft, Writing – review & editing. EP: Data curation, Formal analysis, Visualization, Writing – review & editing. OG: Formal analysis, Investigation, Methodology, Software, Validation, Visualization, Writing – review & editing. BG: Data curation, Methodology, Software, Visualization, Writing – review & editing. TR: Investigation, Methodology, Resources, Writing – review & editing. DS: Funding acquisition, Investigation, Methodology, Resources, Supervision, Writing – review & editing. JY: Conceptualization, Formal analysis, Funding acquisition, Investigation, Methodology, Project administration, Resources, Supervision, Validation, Visualization, Writing – original draft, Writing – review & editing. SM: Conceptualization, Formal analysis, Funding acquisition, Investigation, Methodology, Project administration, Resources, Supervision, Visualization, Writing – original draft, Writing – review & editing.
The author(s) declare that financial support was received for the research and/or publication of this article. This work was supported by the Agilent Early Career Professor Award (JY) and National Institutes of Health grants R00-GM118907 (JY); U19-AI162598 and R01-AI146194 (JY, DS, and SM); R01-AI150826 and U19-AI135976 (DS and SM) and DP2-AI164249 (SM).
We thank Research Scientific Computing at Seattle Children's Research Institute for providing HPC resources that have contributed to this investigation. We thank Avi Shah for helpful discussions, and Jessica Assadi and Robert Morrison for technical assistance.
The authors declare that the research was conducted in the absence of any commercial or financial relationships that could be construed as a potential conflict of interest.
The author(s) declared that they were an editorial board member of Frontiers, at the time of submission. This had no impact on the peer review process and the final decision.
All claims expressed in this article are solely those of the authors and do not necessarily represent those of their affiliated organizations, or those of the publisher, the editors and the reviewers. Any product that may be evaluated in this article, or claim that may be made by its manufacturer, is not guaranteed or endorsed by the publisher.
The Supplementary Material for this article can be found online at: https://www.frontiersin.org/articles/10.3389/ftubr.2025.1500899/full#supplementary-material
2. Galagan JE, Minch K, Peterson M, Lyubetskaya A, Azizi E, Sweet L, et al. The Mycobacterium tuberculosis regulatory network and hypoxia. Nature. (2013) 499:178–83. doi: 10.1038/nature12337
3. Minch KJ, Rustad TR, Peterson EJ, Winkler J, Reiss DJ, Ma S, et al. The DNA-binding network of Mycobacterium tuberculosis. Nat Commun. (2015) 6:5829. doi: 10.1038/ncomms6829
4. Peterson EJ, Reiss DJ, Turkarslan S, Minch KJ, Rustad T, Plaisier CL, et al. A high-resolution network model for global gene regulation in Mycobacterium tuberculosis. Nucleic Acids Res. (2014) 42:11291–303. doi: 10.1093/nar/gku777
5. Peterson EJR, Brooks AN, Reiss DJ, Kaur A, Do J, Pan M, et al. MtrA modulates Mycobacterium tuberculosis cell division in host microenvironments to mediate intrinsic resistance and drug tolerance. Cell Rep. (2023) 42:112875. doi: 10.1016/j.celrep.2023.112875
6. Rustad TR, Minch KJ, Ma S, Winkler JK, Hobbs S, Hickey M, et al. Mapping and manipulating the Mycobacterium tuberculosis transcriptome using a transcription factor overexpression-derived regulatory network. Genome Biol. (2014) 15:502. doi: 10.1186/PREACCEPT-1701638048134699
7. Yoo R, Rychel K, Poudel S, Al-Bulushi T, Yuan Y, Chauhan S, et al. Machine learning of all Mycobacterium tuberculosis H37Rv RNA-seq data reveals a structured interplay between metabolism, stress response, and infection. mSphere. (2022) 7:e0003322. doi: 10.1128/msphere.00033-22
8. Sanz J, Navarro J, Arbues A, Martin C, Marijuan PC, Moreno Y. The transcriptional regulatory network of Mycobacterium tuberculosis. PLoS One. (2011) 6:e22178. doi: 10.1371/journal.pone.0022178
9. Balazsi G, Heath AP, Shi L, Gennaro ML. The temporal response of the Mycobacterium tuberculosis gene regulatory network during growth arrest. Mol Syst Biol. (2008) 4:225. doi: 10.1038/msb.2008.63
10. Turkarslan S, Peterson EJR, Rustad TR, Minch KJ, Reiss DJ, Morrison R, et al. A comprehensive map of genome-wide gene regulation in Mycobacterium tuberculosis. Sci Data. (2015) 2:150010. doi: 10.1038/sdata.2015.10
11. Escorcia-Rodriguez JM, Gaytan-Nunez E, Hernandez-Benitez EM, Zorro-Aranda A, Tello-Palencia MA, Freyre-Gonzalez JA. Improving gene regulatory network inference and assessment: the importance of using network structure. Front Genet. (2023) 14:1143382. doi: 10.3389/fgene.2023.1143382
12. Poonawala H, Zhang Y, Kuchibhotla S, Green AG, Cirillo DM, Marco FDi, et al. Transcriptomic responses to antibiotic exposure in Mycobacterium tuberculosis. Antimicrob Agents Chemother. (2024) 68:e0118523. doi: 10.1128/aac.01354-24
13. Bei C, Zhu J, Culviner PH, Gan M, Rubin EJ, Fortune SM, et al. Genetically encoded transcriptional plasticity underlies stress adaptation in Mycobacterium tuberculosis. Nat Commun. (2024) 15:3088. doi: 10.1038/s41467-024-47410-5
14. Liao JC, Boscolo R, Yang YL, Tran LM, Sabatti C, Roychowdhury VP. Network component analysis: reconstruction of regulatory signals in biological systems. Proc Natl Acad Sci U S A. (2003) 100:15522–7. doi: 10.1073/pnas.2136632100
15. Marbach D, Costello JC, Kuffner R, Vega NM, Prill RJ, Camacho DM, et al. Wisdom of crowds for robust gene network inference. Nat Methods. (2012) 9:796–804. doi: 10.1038/nmeth.2016
16. Ma S, Morrison R, Hobbs SJ, Soni V, Farrow-Johnson J, Frando A, et al. Transcriptional regulator-induced phenotype screen reveals drug potentiators in Mycobacterium tuberculosis. Nat Microbiol. (2021) 6:44–50. doi: 10.1038/s41564-020-00810-x
17. Hicks SC, Okrah K, Paulson JN, Quackenbush J, Irizarry RA, Bravo HC. Smooth quantile normalization. Biostatistics. (2018) 19:185–98. doi: 10.1093/biostatistics/kxx028
18. Hsieh PH, Lopes-Ramos CM, Zucknick M, Sandve GK, Glass K, Kuijjer ML. Adjustment of spurious correlations in co-expression measurements from RNA-Sequencing data. Bioinformatics. (2023) 39:btad610. doi: 10.1093/bioinformatics/btad610
19. Langmead B, Salzberg SL. Fast gapped-read alignment with Bowtie 2. Nat Methods. (2012) 9:357–9. doi: 10.1038/nmeth.1923
20. Liao Y, Smyth GK, Shi W. featureCounts: an efficient general purpose program for assigning sequence reads to genomic features. Bioinformatics. (2014) 30:923–30. doi: 10.1093/bioinformatics/btt656
21. Ewels P, Magnusson M, Lundin S, Kaller M. MultiQC: summarize analysis results for multiple tools and samples in a single report. Bioinformatics. (2016) 32:3047–8. doi: 10.1093/bioinformatics/btw354
22. McInnes L, Healy J, Melville J. UMAP: uniform manifold approximation and projection for dimension reduction. (2020) arXiv.1802.03426.
23. Ester M, Kriegel H-P, Sander J, Xu X. A density-based algorithm for discovering clusters in large spatial databases with noise, knowledge discovery and data mining. In: KDD'96: Proceedings of the Second International Conference on Knowledge Discovery and Data Mining (1996). p. 226–231.
24. Pedregosa F, Varoquaux G, Gramfort A, Michel V, Thirion B, Grisel O, et al. Scikit-learn: machine learning in python. J Mach Learn Res. (2011) 12:2825–30.
25. Margolin AA, Nemenman I, Basso K, Wiggins C, Stolovitzky G, Dalla Favera R, et al. ARACNE: an algorithm for the reconstruction of gene regulatory networks in a mammalian cellular context. BMC Bioinform. (2006) 7:S7. doi: 10.1186/1471-2105-7-S1-S7
26. Lachmann A, Giorgi FM, Lopez G, Califano A. ARACNe-AP: gene network reverse engineering through adaptive partitioning inference of mutual information. Bioinformatics. (2016) 32:2233–5. doi: 10.1093/bioinformatics/btw216
27. Faith JJ, Hayete B, Thaden JT, Mogno I, Wierzbowski J, Cottarel G, et al. Large-scale mapping and validation of Escherichia coli transcriptional regulation from a compendium of expression profiles. PLoS Biol. (2007) 5:e8. doi: 10.1371/journal.pbio.0050008
28. Huynh-Thu VA, Irrthum A, Wehenkel L, Geurts P. Inferring regulatory networks from expression data using tree-based methods. PLoS ONE. (2010) 5:e12776. doi: 10.1371/journal.pone.0012776
29. Sales G, Romualdi C. Parmigene–a parallel R package for mutual information estimation and gene network reconstruction. Bioinformatics. (2011) 27:1876–7. doi: 10.1093/bioinformatics/btr274
30. Aibar S, Gonzalez-Blas CB, Moerman T, Huynh-Thu VA, Imrichova H, Hulselmans G, et al. SCENIC: single-cell regulatory network inference and clustering. Nat Methods. (2017) 14:1083–6. doi: 10.1038/nmeth.4463
31. Reiss DJ, Baliga NS, Bonneau R. Integrated biclustering of heterogeneous genome-wide datasets for the inference of global regulatory networks. BMC Bioinformatics. (2006) 7:280. doi: 10.1186/1471-2105-7-280
32. Reiss DJ, Plaisier CL, Wu WJ, Baliga NS. cMonkey2: Automated, systematic, integrated detection of co-regulated gene modules for any organism. Nucleic Acids Res. (2015) 43:e87. doi: 10.1093/nar/gkv300
33. Sastry AV, Gao Y, Szubin R, Hefner Y, Xu S, Kim D, et al. The Escherichia coli transcriptome mostly consists of independently regulated modules. Nat Commun. (2019) 10:5536. doi: 10.1038/s41467-019-13483-w
34. Sastry AV, Yuan Y, Poudel S, Rychel K, Yoo R, Lamoureux CR, et al. iModulonMiner and PyModulon: Software for unsupervised mining of gene expression compendia. PLoS Comput Biol. (2024) 20:e1012546. doi: 10.1371/journal.pcbi.1012546
35. Hastie T, Tibshirani R, Friedman J. The Elements of Statistical Learning: Data Mining, Inference and Prediction. Second Edition, Cham: Springer (2008).
36. Zou H, Hastie T. Regularization and variable selection via the elastic net. J R Stat Soc B. (2005) 67:301–20. doi: 10.1111/j.1467-9868.2005.00503.x
37. Webber W, Moffat A, Zobel J. A similarity measure for indefinite rankings. ACM T Inform Syst. (2010) 28:1852106. doi: 10.1145/1852102.1852106
38. Kolde R, Laur S, Adler P, Vilo J. Robust rank aggregation for gene list integration and meta-analysis. Bioinformatics. (2012) 28:573–80. doi: 10.1093/bioinformatics/btr709
39. Salgado H, Gama-Castro S, Lara P, Mejia-Almonte C, Alarcon-Carranza G, Lopez-Almazo AG, et al. RegulonDB v12.0: a comprehensive resource of transcriptional regulation in E. coli K-12. Nucleic Acids Res. (2024) 52:D255–64. doi: 10.1093/nar/gkad1072
40. Bhan A, Galas DJ, Dewey TG. A duplication growth model of gene expression networks. Bioinformatics. (2002) 18:1486–93. doi: 10.1093/bioinformatics/18.11.1486
41. Karp PD, Billington R, Caspi R, Fulcher CA, Latendresse M, Kothari A, et al. The BioCyc collection of microbial genomes and metabolic pathways. Brief Bioinform. (2019) 20:1085–93. doi: 10.1093/bib/bbx085
42. Chicco D. Ten quick tips for machine learning in computational biology. BioData Min. (2017) 10:35. doi: 10.1186/s13040-017-0155-3
43. Matthews BW. Comparison of the predicted and observed secondary structure of T4 phage lysozyme. Biochim Biophys Acta. (1975) 405:442–51. doi: 10.1016/0005-2795(75)90109-9
44. Ashburner M, Ball CA, Blake JA, Botstein D, Butler H, Cherry JM, et al. Gene ontology: tool for the unification of biology. Gene Ontol Consortium Nat Genet. (2000) 25:25–9. doi: 10.1038/75556
45. Gene Ontology Consortium, Aleksander SA, Balhoff J, Carbon S, Cherry JM, Drabkin HJ, et al. The Gene Ontology knowledgebase in 2023. Genetics. (2023) 224:iyad031. doi: 10.1093/genetics/iyad031
46. Kapopoulou A, Lew JM, Cole ST. The MycoBrowser portal: a comprehensive and manually annotated resource for mycobacterial genomes. Tuberculosis (Edinb). (2011) 91:8–13. doi: 10.1016/j.tube.2010.09.006
47. Klopfenstein DV, Zhang L, Pedersen BS, Ramirez F, Warwick Vesztrocy A, Naldi A, et al. GOATOOLS: A Python library for Gene Ontology analyses. Sci Rep. (2018) 8:10872. doi: 10.1038/s41598-018-28948-z
49. Noor A, Ahmad A, Serpedin E, Nounou M, Nounou H. ROBNCA: robust network component analysis for recovering transcription factor activities. Bioinformatics. (2013) 29:2410–8. doi: 10.1093/bioinformatics/btt433
50. Ahn-Horst TA, Mille LS, Sun G, Morrison JH, Covert MW. An expanded whole-cell model of E. coli links cellular physiology with mechanisms of growth rate control. NPJ Syst Biol Appl. (2022) 8:30. doi: 10.1038/s41540-022-00242-9
51. Sherrid AM, Rustad TR, Cangelosi GA, Sherman DR. Characterization of a Clp protease gene regulator and the reaeration response in Mycobacterium tuberculosis. PLoS ONE. (2010) 5:e11622. doi: 10.1371/journal.pone.0011622
52. Sherman DR, Voskuil M, Schnappinger D, Liao R, Harrell MI, Schoolnik GK. Regulation of the Mycobacterium tuberculosis hypoxic response gene encoding alpha -crystallin. Proc Natl Acad Sci U S A. (2001) 98:7534–9. doi: 10.1073/pnas.121172498
53. Yuan Y, Crane DD, Simpson RM, Zhu YQ, Hickey MJ, Sherman DR, et al. 3rd, The 16-kDa alpha-crystallin (Acr) protein of Mycobacterium tuberculosis is required for growth in macrophages. Proc Natl Acad Sci U S A. (1998) 95:9578–83. doi: 10.1073/pnas.95.16.9578
54. Ma S, Jaipalli S, Larkins-Ford J, Lohmiller J, Aldridge BB, Sherman DR, et al. Transcriptomic signatures predict regulators of drug synergy and clinical regimen efficacy against tuberculosis. MBio. (2019) 10:e02627–19. doi: 10.1128/mBio.02627-19
55. Li H, Handsaker B, Wysoker A, Fennell T, Ruan J, Homer N, et al. The sequence alignment/map format and SAMtools. Bioinformatics. (2009) 25:2078–9. doi: 10.1093/bioinformatics/btp352
56. Benjamini Y, Krieger AM, Yekutieli D. Adaptive linear step-up procedures that control the false discovery rate. Biometrika. (2006) 93:491–507. doi: 10.1093/biomet/93.3.491
57. Wang Z, Gerstein M, Snyder M. RNA-Seq: a revolutionary tool for transcriptomics. Nat Rev Genet. (2009) 10:57–63. doi: 10.1038/nrg2484
58. Balaji S, Babu MM, Aravind L. Interplay between network structures, regulatory modes and sensing mechanisms of transcription factors in the transcriptional regulatory network of E. coli. J Mol Biol. (2007) 372:1108–22. doi: 10.1016/j.jmb.2007.06.084
59. Kendall SL, Burgess P, Balhana R, Withers M, Ten Bokum A, Lott JS, et al. Cholesterol utilization in mycobacteria is controlled by two TetR-type transcriptional regulators: kstR and kstR2. Microbiology. (2010) 156:1362–71. doi: 10.1099/mic.0.034538-0
60. Peterson EJR, Abidi AA, Arrieta-Ortiz ML, Aguilar B, Yurkovich JT, Kaur A, et al. Intricate genetic programs controlling dormancy in Mycobacterium tuberculosis. Cell Rep. (2020) 31:107577. doi: 10.1016/j.celrep.2020.107577
61. Peterson EJ, Bailo R, Rothchild AC, Arrieta-Ortiz ML, Kaur A, Pan M, et al. Path-seq identifies an essential mycolate remodeling program for mycobacterial host adaptation. Mol Syst Biol. (2019) 15:e8584. doi: 10.15252/msb.20188584
62. Rustad TR, Harrell MI, Liao R, Sherman DR. The enduring hypoxic response of Mycobacterium tuberculosis. PLoS ONE. (2008) 3:e1502. doi: 10.1371/journal.pone.0001502
63. Alon U. Network motifs: theory and experimental approaches. Nat Rev Genet. (2007) 8:450–61. doi: 10.1038/nrg2102
64. Modlin SJ, Elghraoui A, Gunasekaran D, Zlotnicki AM, Dillon NA, Dhillon N, et al. Structure-aware Mycobacterium tuberculosis functional annotation uncloaks resistance, metabolic, and virulence genes. mSystems. (2021) 6:e0067321. doi: 10.1128/mSystems.00673-21
65. GBD 2021 Antimicrobial Resistance Collaborators. Global burden of bacterial antimicrobial resistance 1990-2021: a systematic analysis with forecasts to 2050. Lancet. (2024) 404:1199–1226. doi: 10.1016/s0140-6736(24)01867-1
66. Farhat M, Cox H, Ghanem M, Denkinger CM, Rodrigues C, Abd El Aziz MS, et al. Drug-resistant tuberculosis: a persistent global health concern. Nat Rev Microbiol. (2024) 22:617–35. doi: 10.1038/s41579-024-01025-1
67. Anahtar MN, Yang JH, Kanjilal S. Applications of machine learning to the problem of antimicrobial resistance: an emerging model for translational research. J Clin Microbiol. (2021) 59:e0126020. doi: 10.1128/JCM.01260-20
68. Lobentanzer S, Rodriguez-Mier P, Bauer S, Saez-Rodriguez J. Molecular causality in the advent of foundation models. Mol Syst Biol. (2024) 20:848–58. doi: 10.1038/s44320-024-00041-w
69. Chen V, Yang M, Cui W, Kim JS, Talwalkar A, Ma J. Applying interpretable machine learning in computational biology-pitfalls, recommendations and opportunities for new developments. Nat Methods. (2024) 21:1454–61. doi: 10.1038/s41592-024-02359-7
70. Yang JH, Wright SN, Hamblin M, McCloskey D, Alcantar MA, Schrübbers L, et al. A white-box machine learning approach for revealing antibiotic mechanisms of action. Cell. (2019) 177:1649–1661.e9. doi: 10.1016/j.cell.2019.04.016
71. Lopatkin AJ, Yang JH. Digital insights into nucleotide metabolism and antibiotic treatment failure. Front Digit Health. (2021) 3:583468. doi: 10.3389/fdgth.2021.583468
72. Larkins-Ford J, Degefu YN, Van N, Sokolov A, Aldridge BB. Design principles to assemble drug combinations for effective tuberculosis therapy using interpretable pairwise drug response measurements. Cell Rep Med. (2022) 3:100737. doi: 10.1016/j.xcrm.2022.100737
73. Larkins-Ford J, Greenstein T, Van N, Degefu YN, Olson MC, Sokolov A, et al. Systematic measurement of combination-drug landscapes to predict in vivo treatment outcomes for tuberculosis. Cell Syst. (2021) 12:1046–1063.e7. doi: 10.1016/j.cels.2021.08.004
74. DeJesus MA, Gerrick ER, Xu W, Park SW, Long JE, Boutte CC, et al. Comprehensive Essentiality Analysis of the Mycobacterium tuberculosis Genome via Saturating Transposon Mutagenesis. MBio. (2017) 8:e02133–16. doi: 10.1128/mBio.02133-16
75. Bosch B, DeJesus MA, Poulton NC, Zhang W, Engelhart CA, Zaveri A, et al. Genome-wide gene expression tuning reveals diverse vulnerabilities of M. tuberculosis. Cell. (2021) 184:4579–4592.e24. doi: 10.1016/j.cell.2021.06.033
76. Li S, Poulton NC, Chang JS, Azadian ZA, DeJesus MA, Ruecker N, et al. CRISPRi chemical genetics and comparative genomics identify genes mediating drug potency in Mycobacterium tuberculosis. Nat Microbiol. (2022) 7:766–79. doi: 10.1038/s41564-022-01130-y
77. Xu W, DeJesus MA, Rucker N, Engelhart CA, Wright MG, Healy C, et al. Chemical genetic interaction profiling reveals determinants of intrinsic antibiotic resistance in Mycobacterium tuberculosis. Antimicrob Agents Chemother. (2017) 61:e01334–17. doi: 10.1128/AAC.01334-17
78. Oluoch PO, Koh E-I, Proulx MK, Reames CJ, Papavinasasundaram KG, Murphy KC, et al. Chemical genetic interactions elucidate pathways controlling tuberculosis antibiotic efficacy during infection. bioRxiv. (2024) 2024.09.04.609063. doi: 10.1101/2024.09.04.609063
79. Carey AF, Rock JM, Krieger IV, Chase MR, Fernandez-Suarez M, Ioerger TR, et al. TnSeq of Mycobacterium tuberculosis clinical isolates reveals strain-specific antibiotic liabilities. PLoS Pathog. (2018) 14:e1006939. doi: 10.1371/journal.ppat.1006939
80. Hicks ND, Yang J, Zhang X, Zhao B, Grad YH, Liu L, et al. Clinically prevalent mutations in Mycobacterium tuberculosis alter propionate metabolism and mediate multidrug tolerance. Nat Microbiol. (2018) 3:1032–42. doi: 10.1038/s41564-018-0218-3
81. Stanley S, Spaulding CN, Liu Q, Chase MR, Ha DTM, Thai PVK, et al. Identification of bacterial determinants of tuberculosis infection and treatment outcomes: a phenogenomic analysis of clinical strains. Lancet Microbe. (2024) 5:e570–80. doi: 10.1016/S2666-5247(24)00022-3
82. The CRyPTIC Consortium. A data compendium associating the genomes of 12,289 Mycobacterium tuberculosis isolates with quantitative resistance phenotypes to 13 antibiotics. PLoS Biol. (2022) 20:e3001721. doi: 10.1371/journal.pbio.3001721
83. Klinkenberg LG, Sutherland LA, Bishai WR, Karakousis PC. Metronidazole lacks activity against Mycobacterium tuberculosis in an in vivo hypoxic granuloma model of latency. J Infect Dis. (2008) 198:275–83. doi: 10.1086/589515
84. Devasundaram S, Khan I, Kumar N, Das S, Raja A. The influence of reduced oxygen availability on gene expression in laboratory (H37Rv) and clinical strains (S7 and S10) of Mycobacterium tuberculosis. J Biotechnol. (2015) 210:70–80. doi: 10.1016/j.jbiotec.2015.04.017
Keywords: Mycobacterium tuberculosis, transcriptional regulation, network inference, network modeling, interpretable machine learning, growth regulation, stress adaptation, hypoxia
Citation: Bustad E, Petry E, Gu O, Griebel BT, Rustad TR, Sherman DR, Yang JH and Ma S (2025) Predicting fitness in Mycobacterium tuberculosis with transcriptional regulatory network-informed interpretable machine learning. Front. Tuberc. 3:1500899. doi: 10.3389/ftubr.2025.1500899
Received: 24 September 2024; Accepted: 07 March 2025;
Published: 02 April 2025.
Edited by:
Harald Gotten Wiker, University of Bergen, NorwayReviewed by:
Sajan C. Raju, University of Oslo, NorwayCopyright © 2025 Bustad, Petry, Gu, Griebel, Rustad, Sherman, Yang and Ma. This is an open-access article distributed under the terms of the Creative Commons Attribution License (CC BY). The use, distribution or reproduction in other forums is permitted, provided the original author(s) and the copyright owner(s) are credited and that the original publication in this journal is cited, in accordance with accepted academic practice. No use, distribution or reproduction is permitted which does not comply with these terms.
*Correspondence: Shuyi Ma, c2h1eWkubWFAc2VhdHRsZWNoaWxkcmVucy5vcmc=; Jason H. Yang, amFzb24ueUBydXRnZXJzLmVkdQ==
†These authors have contributed equally to this work
Disclaimer: All claims expressed in this article are solely those of the authors and do not necessarily represent those of their affiliated organizations, or those of the publisher, the editors and the reviewers. Any product that may be evaluated in this article or claim that may be made by its manufacturer is not guaranteed or endorsed by the publisher.
Research integrity at Frontiers
Learn more about the work of our research integrity team to safeguard the quality of each article we publish.