
94% of researchers rate our articles as excellent or good
Learn more about the work of our research integrity team to safeguard the quality of each article we publish.
Find out more
ORIGINAL RESEARCH article
Front. Toxicol., 16 May 2024
Sec. Environmental Toxicology
Volume 6 - 2024 | https://doi.org/10.3389/ftox.2024.1298231
This article is part of the Research TopicLegacy & Emerging Contaminants in the Aquatic EnvironmentView all 12 articles
 Aline Arriola1*
 Insam Al Saify2
 Nicholas A. Warner3,4
 Dorte Herzke4Mikael Harju4Per-Arne Amundsen5
 Anita Evenset1Claudia Möckel6
 Ingjerd S. Krogseth4,5
Our understanding of the environmental behavior, bioaccumulation and concentrations of chlorinated paraffins (CPs) and Dechloranes (Dec) in the Arctic environment is still limited, particularly in freshwater ecosystems. In this descriptive study, short chain (SCCPs) and medium chain (MCCPs) CPs, Dechlorane Plus (DP) and analogues, and polychlorinated biphenyls (PCBs) were measured in sediments, benthic organisms, three-spined stickleback (Gasterosteus aculeatus), Arctic char (Salvelinus alpinus) and brown trout (Salmo trutta) in two Sub-Arctic lakes in Northern Norway. Takvannet (TA) is a remote lake, with no known local sources for organic contaminants, while Storvannet (ST) is situated in a populated area. SCCPs and MCCPs were detected in all sediment samples from ST with concentration of 42.26–115.29 ng/g dw and 66.18–136.69 ng/g dw for SCCPs and MCCPs, respectively. Only SCCPs were detected in TA sediments (0.4–5.28 ng/g dw). In biota samples, sticklebacks and benthic organisms showed the highest concentrations of CPs, while concentrations were low or below detection limits in both char and trout. The congener group patterns observed in both lakes showed SCCP profiles dominated by higher chlorinated congener groups while the MCCPs showed consistency in their profiles, with C14 being the most prevalent carbon chain length. Anti- and syn-DP isomers were detected in all sediment, benthic and stickleback samples with higher concentrations in ST than in TA. However, they were only present in a few char and trout samples from ST. Dec 601 and 604 were below detection limits in all samples in both lakes. Dec 603 was detected only in ST sediments, sticklebacks and 2 trout samples, while Dec 602 was the only DP analogue found in all samples from both lakes. While there were clear differences in sediment concentrations of DP and Dec 602 between ST and TA, differences between lakes decreased with increasing δ15N. This pattern was similar to the PCB behavior, suggesting the lake characteristics in ST are playing an important role in the lack of biomagnification of pollutants in this lake. Our results suggest that ST receives pollutants from local sources in addition to atmospheric transport.
Persistent organic pollutants (POPs) are man-made compounds that have been used extensively in agriculture, industrial and manufacturing processes (Markowitz, 2018; Ontiveros-Cuadras et al., 2019). Due to their physicochemical properties, POPs can undergo long-range atmospheric transport (LRAT), which results in a global distribution and lead to POPs being present in regions far from where they are used and released, such as the Arctic (Hageman et al., 2015; Kallenborn et al., 2015). POPs also have long half-lives and are highly resistant to degradation. This makes them highly persistent in ecosystems and increases the risk for biomagnification in food webs, potentially causing adverse effects in top predators, including humans. While many POPs have been recognized as harmful and have been regulated by the Stockholm Convention since 2004 (Fiedler et al., 2019), new chemicals are continuously introduced in industrial applications, in many cases as replacements for regulated compounds. Around 150,000 chemicals are currently in use by the industry, with many more entering the market every year (AMAP, 2016). Many are organic contaminants with similar properties to legacy POPs (persistent, bioaccumulative, toxic and/or with LRAT potential) but their potential role as environmental contaminants remains poorly understood.
Short and medium chain chlorinated paraffins (SCCPs and MCCPs) and Dechlorane plus (DP) and related compounds (Dec 601, 602, 603, and 604) are examples of contaminants that have 1) recently been regulated (SCCPs, DP), 2) are currently under review for regulation (MCCPs) or, 3) are not regulated (Dec 601–604). Chlorinated paraffins (CPs) are polychlorinated n-alkanes, which can be categorized according to their number of carbons: short chain (SCCPs, C10-13), medium chain (MCCPs, C14-17) and long chain (LCCPs, C
SCCPs have been included in several regulatory bodies in the last years. In Norway, production, sales, import or export of products with more than 0.1% by weight of SCCPs was prohibited in 2002 (ECHA, 2008). SCCPs were included in the Stockholm convention of POPs (Annex A—elimination) in 2017 (UNEP, 2017). While MCCPs have not been regulated, they have been proposed for listing under the Stockholm Convention on persistent organic pollutants (UNEP, 2021). As a result of the regulation of SCCPs, there has been an increase in production and use of MCCPs (Glüge et al., 2018). This is already reflected in the environment, with MCCP mass fractions in biota surpassing those of SCCPs (Vorkamp et al., 2019a).
Dechlorane plus has been in use since the 1960s, first as an insecticide to replace Mirex, and later as a flame retardant additive mainly in wire and electronic appliances (Hoh et al., 2006; Guo et al., 2017; Hansen et al., 2020). It is considered a chemical of high production volume in the US and of low production volume in the EU (Tomy et al., 2007; Wang et al., 2016). DP has two stereoisomers, syn-DP and anti-DP that are found in an approximate ratio of 1:3 in commercial products (Wang et al., 2016). The isomer ratio has been used to assess the fate and distribution of DP in the environment and it is normally represented as fanti (fanti = antiDP/(antiDP + synDP). In comparison to DP, information on production and use of the related compounds Dec 602, 603, and 604 is very limited (Shen et al., 2011a; Feo et al., 2012).
CPs, DP and Dec 602, Dec 603 have been found in air, water, sediments, and biota in remote areas such as the Arctic and Antarctic (Möller et al., 2010; Möller et al., 2012; Xiao et al., 2012; Vorkamp and Riget, 2014; Vorkamp et al., 2015; Vorkamp et al., 2019a; Vorkamp et al., 2019b; AMAP, 2017; Gao et al., 2018). These chemicals have been measured in top predators, such as whales and seals, indicating biomagnification in the environment (Simond et al., 2017; Vorkamp et al., 2019a). However, the number of studies in freshwater ecosystems is limited to only a few studies in Canada, Sweden and Norway (Schlabach et al., 2017). A review by Vorkamp et al. (2019a) highlights that only 3 studies include MCCPs in fish from Norwegian and Canadian Arctic lakes. Studies including DP in the Arctic/Sub-Arctic focus mainly on marine and terrestrial environments. Given the small number of studies in freshwater ecosystems and the importance of data from the Arctic documenting the LRAT, bioaccumulation, and persistence of contaminants of emerging concern, the 2017 AMAP assessment on contaminants of emerging concern strongly emphasized the need for more information on levels and better understanding of the sources and distribution of these contaminants. Accordingly, this study aims to provide data for CPs, DP and related compounds in freshwater ecosystems in the Norwegian Sub-Arctic. We specifically address the potential biomagnification by sampling different organisms of the food web, and also evaluate the importance of local sources for these compounds by contrasting a pristine lake assumed only to receive contamination through LRAT, against a lake in an urban area with known local sources of contaminants like PCBs, DDTs, PAHs (polycyclic aromatic hydrocarbons) and cVMS (cyclic volatile methyl siloxanes) (Christensen, 2009; Krogseth et al., 2017a).
Two lakes in Northern Norway were selected for this study: Storvannet (
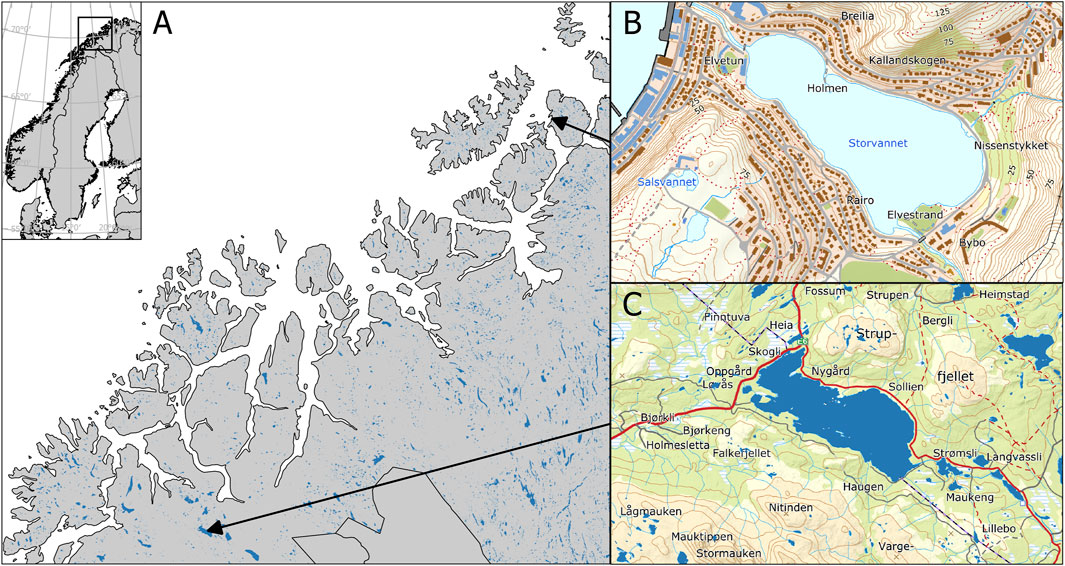
Figure 1. Map of Northern Norway (A) showing the location of Storvannet (B) and Takvannet (C). (B) is based on data from the Norwegian Lake Database, available from The Norwegian Water Resources and Energy Directorate (NVE). Map data in (A, C) are from the Kartdata3 WMS service.
Samples were collected in Storvannet and Takvannet during September and October 2018, respectively. In both lakes, brown trout (Salmo trutta), Arctic char (Salvelinus alpinus), three-spined sticklebacks (Gasterosteus aculeatus), benthic invertebrates and sediments were sampled. Trout and char were caught with multinets (40 m long and 1.5 m high with a mesh size 10, 12.5, 15, 18,5, 22, 26, 35, 45 mm (knot to knot) (Supplementary Table SI.1). Sticklebacks were sampled either by deploying traps baited with shrimp wrapped in fine mesh (so the fish could not eat it) or by electrofishing in the shallow areas of the lakes. Fish were identified and their fork length and body weight measured. Otoliths were removed for age determination in both char and trout. Samples were individually wrapped in double aluminum foil and stored in zip-lock bags. Benthic organisms were collected from sieving sediment obtained with an Ekman grab (area 225 cm2). Organisms were sorted to taxa and stored in glass jars. Sediments were taken with an Ekman grab (area 225 cm2) at 5 different locations in TA and 4 at ST, at water depths between 12 and 16 m in Storvannet and between 18 and 25 m in Takvannet. The top 2 cm of each sediment sample was transferred to glass jars. All samples were stored at −20°C until further sample preparation in the lab.
All dissection and laboratory procedures were performed in an ISO class 6 clean room with both gas and particle filtration to limit the risk of contamination of samples. Detailed quality control procedures are described in SI. Samples were extracted by batches corresponding to a given lake and type of sample (trout, char, sticklebacks, benthic organisms or sediments) to avoid cross-contamination. Three laboratory blanks consisting of sodium sulphate were analyzed for each batch of samples, and one SRM (sample reference material) was analyzed for each sample type. Samples were spiked with isotopic labeled internal standards prior to extraction, and a recovery standard was added just before instrumental analysis (Detail information can be found in the SI).
Extraction and clean-up of tissue samples was performed as described by Herzke et al. (2009) and Bouwman et al. (2008). For trout and char, 2 g of muscle were homogenized by finely chopping the tissue with a scalpel in a petri dish. For sticklebacks, 3 g of whole fish (pooled from 3 to 4 fish of similar size) were homogenized, while for benthos 3–5 g of whole organisms of each taxa were homogenized. Homogenized tissues were then mixed with 1:10 parts of sodium sulfate until they formed a fine powder and left in a freezer (−20°C) overnight. Internal recovery standards (see SI for more details) were added to each sample, before they were extracted for 15 min three times using cyclohexane/acetone (3:1) in an ultrasonic bath. Extracts were transferred to 100 mL glass vials and evaporated to 0.5 mL using a RapidVap (Labconco™ RapidVap™ Vacuum Evaporation System) and then left for evaporation to dryness under loose foil in the cleanroom. Lipid content was determined gravimetrically (Herzke et al., 2009). Samples were reconstituted with 1 mL of n-hexane and transferred to a glass centrifuge tube. Acid clean-up was performed by adding approximately 4–5 mL of concentrated H2SO4 to the sample followed by vortexing. Samples were left overnight in darkness. The following day, samples were centrifuged for 20 min at 2000 rpm. The hexane layer was then transferred to a new glass centrifuge tube, new acid was added, and samples were left for 1 h in darkness. This procedure was repeated 3 times. Further clean-up was performed using a 250 mm Pasteur pipette packed with sodium sulphate and preconditioned with 4 mL of n-hexane. The sample was eluted with 4 mL of n-hexane. The eluate was reduced to 0.5 mL using RapidVap and the solvent changed to isooctane. Samples were then evaporated to a final volume of 0.2 mL and transferred to GC-vials, to which recovery standards were added.
Sediment samples were thawed and spread out in aluminum trays and left to dry in the clean room for 48 h. Extraction of sediments was performed on an ASE Dionex Accelerated Solvent Extraction system (Thermo Fisher Scientific) equipped with 34 mm stainless steel extraction cells and 80 mL collection bottles. The extraction was performed with acetone:hexane (1:1 v/v) solvent at 150°C and 1500Psi. The packing of the cell was as follows: first a celluloce filter was placed into the cell outlet, followed by 5.0 g of silica, another filter, and a mixture of 5 g of dried sediments mixed with diatomaceous earth. All samples were spiked with internal standards before extraction. Extracts were transferred to 100 mL glass vials and evaporated with RapidVap to 1 mL and acid clean-up was performed as described above for fish and benthic organisms. Once the extract was clean, activated copper (−40 + 100 mesh, 99.5%) was added to remove all traces of sulfur. A second clean-up procedure was performed with Silica columns, previously rinsed with 10% dichloromethane in hexane. Samples were eluted with 40 mL of the same solvent and collected in a 100 mL glass vial. Samples were then evaporated to approximately 10 mL before transferring them to 15 mL vials and further reduced to 0.5 mL and then solvent changed to isooctane. Samples were then evaporated to a final 0.2 mL and transferred to GC vials.
Total organic carbon (TOC) was measured in sediment samples following the method DIN19539:2016-12. Biota and sediments from both lakes were analyzed for stable isotopes of carbon and nitrogen, and isotopic ratios were calculated (δ13C and δ15N). Detailed description for both methodologies can be found in the SI. The isotopic ratio of nitrogen (δ15N) was used to investigate the bioaccumulation of the chemicals in the two lakes, by regressing chemical concentrations against δ15N.
PCBs were analyzed on an Agilent Technology 7890 GC and detection on an Agilent Technology 5975 MSD. For more detailed information, please refer to (Herzke et al., 2009).
Dechlorane analysis was performed on a Thermo Scientific Q Exactive Orbitrap GC/HRAM mass spectrometer (Thermo Fisher Scientific, Waltham, MA United States) with 1uL injections into a PTV (program temperature vaporizer) with a deactivated baffled glass liner at 70°C and after 0.1 min ramped to 320°C at 12°C/sec and held for 6 min. Helium was used as carrier gas at 1.4 mL/min in constant flow mode. A Thermo Scientific TG-5SilMS capillary column (15 m x 0.25 mmID, 0.25 um df) was used. The GC oven was programmed from 60°C (2 min) and ramped at 50°C/min to 320°C and held for 6 min with a total runtime of 13.2 min. Transfer line of MS was held at 300°C while ion source was set at 180°C in NCI mode with methane at 1.4 mL/min at 70eV with a mass resolution of 60,000 @ m/z 200, scanning at 250–700 m/z. The dechlorane standard was injected as a single point calibration. Results were processed in Tracefinder 4.1.
The CP calibration standards were prepared in isooctane from the stock solutions and ranged from 0.5 ng/μL to 5 ng/μL with observed linear relationships of R2 = 0.99 (ΣS/MCCPs). The pattern deconvolution approach was used to quantify the CPs (Bogdal et al., 2015). A detailed description of the statistical analysis was reported by Al Saify et al. (2021), using the same commercially available technical formulations with two additional single-chain length standards (C11 60% and C12 70% Cl) to reconstruct the CP sample patterns.
Data are presented on both lipid normalized (lw) and wet weight (ww) basis for biota and normalized for total organic carbon (oc) and dry weight (dw) for sediments. However, statistical analyses were performed on lw and dw. Due to the overall small sample sizes and associated likely deviation from normal distributions, data were summarized using median and range. The median is much less affected by extreme observations in either the upper or lower tails of the distribution (Huston and Juarez-Colunga, 2009) and is therefore often chosen as a more “robust” and better measure of center than the more commonly used mean.
We used the Wilcoxon rank sum test to test differences between lakes for all the morphometrics, lipid percent, isotopes and TOC.
To test for differences in contaminant mass fraction between lakes and compartments, we performed an Aligned Rank Transform two-way factorial ANOVA (Wobbrock et al., 2011), using the ARTool package for R (Elkin et al., 2021). This is a non-parametric equivalent of a normal two-way factorial ANOVA, appropriate for data that cannot be assumed to conform to the requirements for traditional parametric methods. We performed a contrast analysis on the estimated marginal means (a.k.a. The least squares means) from the ART analysis, across the reference grid of predictor variables, using functions available in the emmeans package for R (Russell, 2020). For PCBs the analysis was performed on the ∑7PCBs (28, 52, 101, 118, 138, 153, 180) which is often used for comparison of mass fractions over time or between different locations unless specified otherwise. It is important to highlight that caution should be made in interpreting results due to low sampling numbers, especially for benthic species. For Statistical analyses, values below limit of detection (LOD) were substituted with a value of LOD/2 (Giskeødegård and Lydersen, 2022).
Biota sediment accumulation factor (BSAF) can be used as an approach to estimate the bioaccumulation potential of organic contaminants. BSAFs were calculated as the lipid normalized concentration in biota divided by the mean of the OC- normalized concentration in sediments in the lake (Burkhard et al., 2004) for samples that had values above LOD.
All statistical analyses were performed in R (R Core Team, 2020).
Summary statistics for organism morphometrics (length, weight and age for char and trout), total organic carbon (TOC) in sediments, stable isotopes, and lipid content for samples from both lakes are shown in Supplementary Tables SI.1, SI.2. There were no significant differences in length, weight, age and lipid content between the two lakes for either trout (Wilcoxon rank sum test length: Wx = 58.5, p = 0.83, weight: W = 59, p = 0.81, age: W = 70, p = 0.3, lipid: W = 53, p = 0.92) or char (length: W = 63, p = 0.15, weight: W = 60, p = 0.24, age: W = 59, p = 0.26, lipid: W = 42, p = 0.84). Surface sediment samples from Storvannet had significantly higher proportions of TOC compared to Takvannet (4.3%–6.5% vs 2.0%–2.3%, W = 20, p = 0.015).
Supplementary Figure SI.1 presents the stable isotope ratios in both lakes.
Values of
Overviews of ∑7-PCB and PCB-153 mass fractions in sediments and biota from both lakes are provided in Table 1, Supplementary Table SI.3, and Supplementary Figures SI.2A, B. Mass fractions in sediment were assessed according to the guidelines given by the Norwegian Environment Agency (Miljødirektoratet, 2016) to obtain information on the environmental condition of the lakes. Sediment mass fraction of ∑7-PCB in Storvannet ranged from 21.4 to 65.9 ng/g dw, with a median of 43.9 ng/g dw. This is comparable to those measured in 2006 (range of 54.9–58.4 ng/g dw, Evenset et al., 2006), and corresponds to condition class III (moderately polluted) (Miljødirektoratet, 2016). Storvannet is more polluted than other lakes both on mainland Norway (average ∑7-PCB 1.9 ng/g dw, n = 49) and on Svalbard (average ∑7-PCB 10.1 ng/g dw, n = 5) (Gabrielsen et al., 2011). This, together with its classification as “moderately polluted” corroborates that it receives PCBs from local sources (Christensen, 2009; Krogseth et al., 2017a; Krogseth et al., 2017b). Mass fractions of ∑7-PCB in Takvannet sediments were significantly lower than those in Storvannet (W = 20, p = 0.01), ranging from 0.14 to 0.49 ng/g dw. Mass fractions in Takvannet were also significantly lower than those from Storvannet when normalized to TOC content, despite lower TOC content in Takvannet sediments. The ∑7-PCB in Takvannet correspond to background conditions (Miljødirektoratet, 2016). This suggests that Takvannet mainly receives PCBs through LRAT.
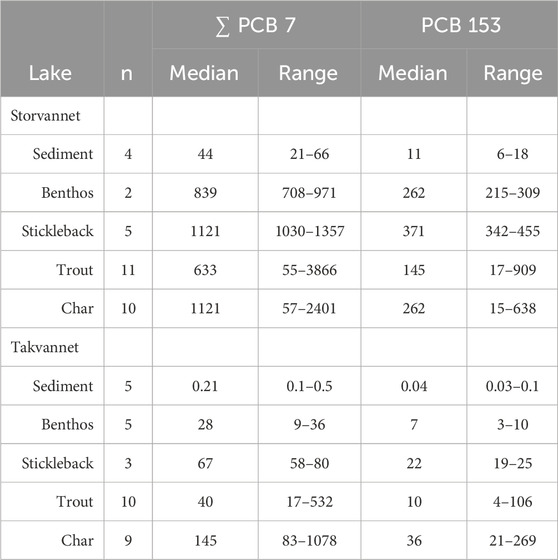
Table 1. Mass fractions of ∑7-PCB and of PCB-153 in sediments (ng/g dw) and biota (ng/g lw) in Storvannet and Takvannet.
Consistent with this, ∑7-PCB mass fractions in biota were higher in Storvannet than in Takvannet for all organisms, except char. This was especially evident at lower trophic levels, where mass fractions could differ by as much as 100-fold, while differences become gradually smaller for species higher up the food chain. As a result, in Takvannet, mass fractions increase considerably with increasing δ15N, while in Storvannet mass fractions do not increase as sharply (Supplementary Figures SI.2A, B, SI.5). The correlation between PCB-153 and
Mass fractions of syn- and anti-DP in sediments and biota of Storvannet and Takvannet are provided in Table 2 and Supplementary Table SI.4. Both DP isomers were detected in all sediment samples. Mass fractions (in ng/g dw and ng/g OC) were higher in Storvannet (syn-DP median: 9.56 ng/g OC range: 3.50–38.0 ng/g OC, n = 4; anti-DP median: 43.6 ng/g OC; range: 9.16–153 ng/g OC, n = 4), than in Takvannet (syn-DP median: 0.26 ng/g OC, range: 0.08–0.41 ng/g OC, n = 5; anti-DP median: 0.86 ng/g OC; range: 0.44–3.72 ng/g OC, n = 5), with consistently higher anti-DP than syn-DP mass fractions in both lakes. Higher mass fractions of ∑DP in Storvannet than in Takvannet indicate that Storvannet also receives DP from local sources around the lake, as it does for other organic contaminants including PCBs and cVMS (Krogseth et al., 2017a; b; Christensen et al., 2009; Christensen, 2009). Mass fraction ranges of the sum of anti-DP and syn -DP (∑DP) in sediment samples from Storvannet were comparable to those found in Lake Erie (0.061–8.62 ng/g dw) (Sverko et al., 2008), but higher than in Lake Huron and Lake Michigan (∑DP 0.87 ng/g dw and 0.55 ng/g dw, respectively) (Shen et al., 2011b). However, in Storvannet, mass fractions were lower than in Lake Ontario (syn-DP median: 30 and 35 ng/g dw; anti-DP median: 115 and 176 ng/g dw, respectively) (Qiu et al., 2007; Tomy et al., 2007), which has elevated ∑DP mass fractions because of its location downstream of a DP manufacturing plant (Shen et al., 2011a). Ranges of ∑DP in sediment samples from Takvannet were comparable to those found in Lake Winnipeg of ∑DP = 0.03 ng/g; syn-DP: 0.011 ng/g dw, anti-DP: 0.018 ng/g dw. Takvannet is considered a remote lake, and the low mass fractions suggest that it only receives DP through LRAT as it was seen in Lake Winnipeg (Qiu et al., 2007; Tomy et al., 2007).
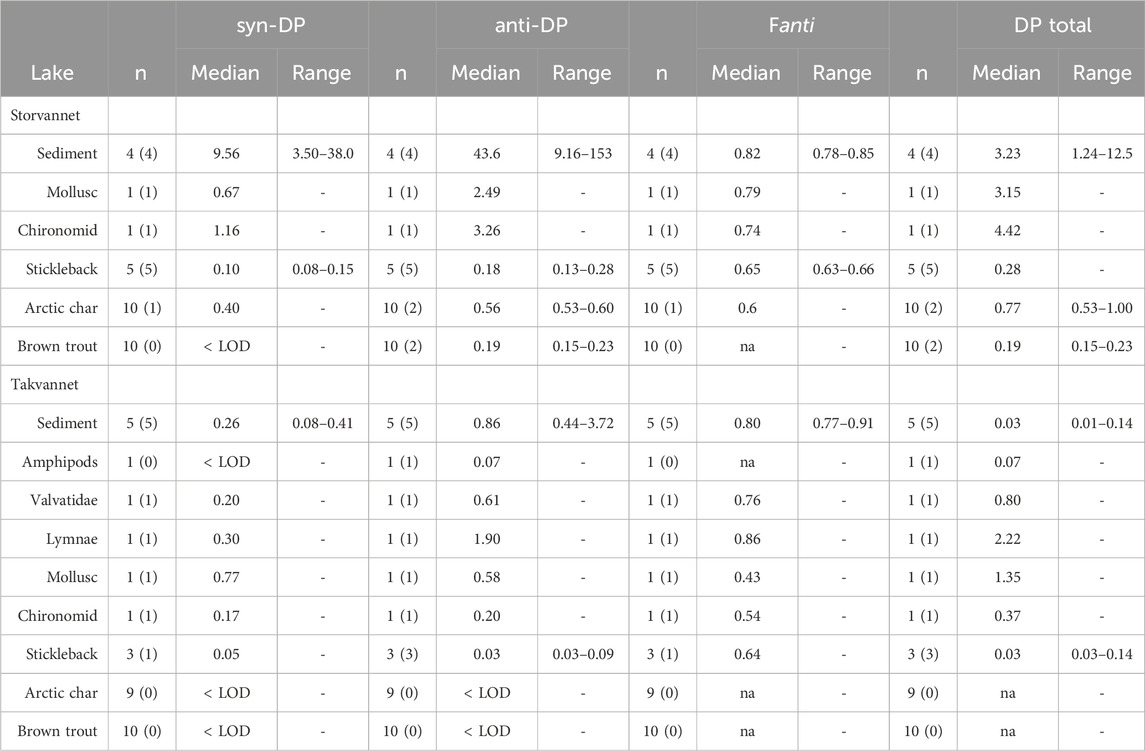
Table 2. Mass fractions of syn-DP, anti-DP, and DP total (syn-DP + anti-DP) measured in sediment (ng/g OC) and biota (ng/g lw) in Storvannet and Takvannet, as well as the calculated fanti fraction. The numbers in parenthesis indicate the number of samples > LOD. Mass fractions < LOD are not included in medians and ranges. “na” indicates that the fanti fraction and DP total concentration was not calculated because none of the DP isomers were detected > LOD.
In biota from Storvannet, syn- and anti-DP were above detection limits in all samples of benthos and sticklebacks. In biota from Takvannet, syn- and anti-DP were above detection limits in most samples of benthos and sticklebacks, but not in any of the char or trout. Like for sediments, mass fractions of both isomers in biota were significantly higher in Storvannet than in Takvannet (Figure 2), and anti-DP were consistently higher than syn-DP mass fractions (Table 2 and Supplementary Table SI.4). Syn-DP and anti-DP in benthos ranged from 0.67 to 1.16 ng/g lw (n = 2) and 2.49–3.26 ng/g lw (n = 2), respectively, in Storvannet. In Takvannet, amphipods were the only benthic sample with mass fractions of syn-DP below LOD. The rest of the benthic samples had syn-DP that ranged from 0.17–0.77 ng/g lw (n = 4) and mass fractions of anti-DP that ranged from 0.07–1.90 ng/g lw (n = 5) with the lowest mass fraction found in amphipods.
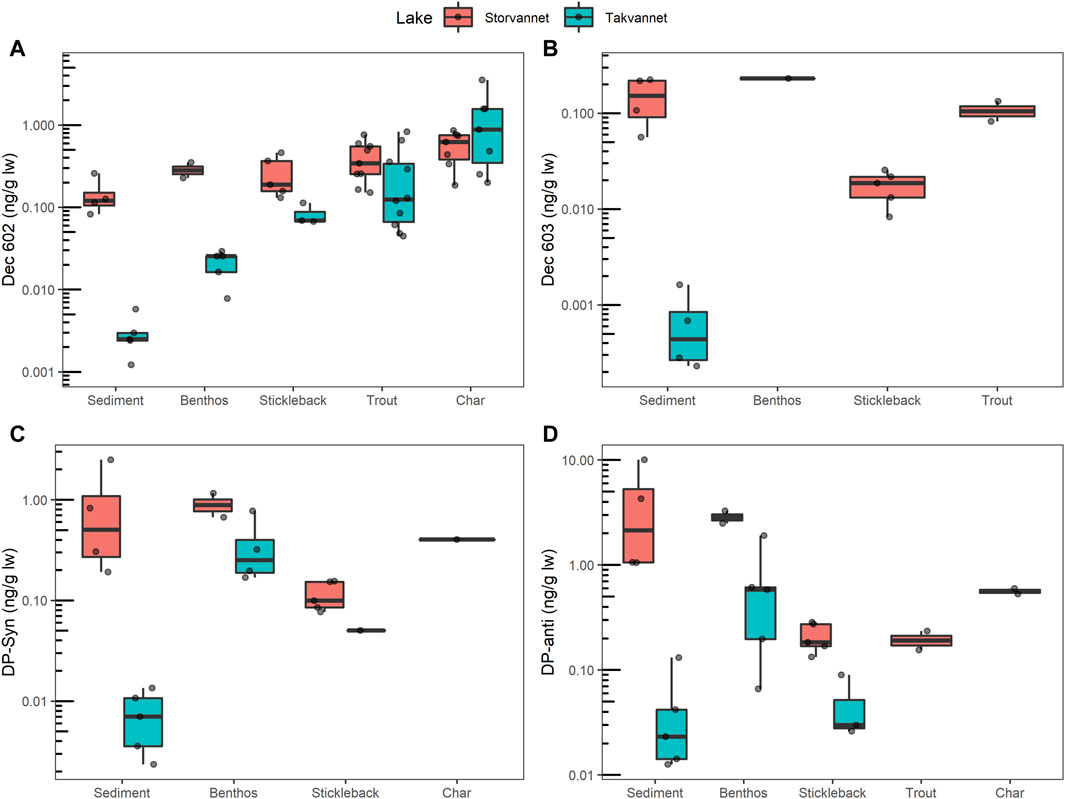
Figure 2. Mass fractions of (A) Dec 602, (B) Dec 603, (C) syn-DP and (D) anti-DP in sediment and biota from Storvannet and Takvannet. Dots represent each sample and black lines inside the boxes represent the median. The box covers the 25th to 75th percentile of the data. The upper whisker extends from the hinge to the largest value no further than 1.5 * IQR from the hinge (where IQR is the interquartile range, or distance between the first and third quartiles). The lower whisker extends from the hinge to the smallest value at most 1.5 * IQR of the hinge. Data beyond the end of the whiskers are “outlying” points and are plotted individually. Values below LOD are not included, thus char and trout are not included in (B, C), respectively.
In Storvannet, mass fractions of syn-DP and anti-DP in sticklebacks ranged from 0.08–0.15 ng/g lw (n = 5) and 0.13–0.28 ng/g lw (n = 5), respectively. In Takvannet, only one stickleback out of three had mass fractions above LOD (0.05 ng/g lw) of syn-DP. In contrast, mass fractions for anti-DP were measured in all three-spined stickleback with ranges of 0.03–0.09 ng/g lw (n = 3). In both lakes there was a decrease in mass fractions from benthic organisms to sticklebacks for both isomers.
In Storvannet, syn-DP was detected in one char (0.40 ng/g lw) and anti-DP was found in two char samples (0.53–0.60 ng/g lw) and two trout samples (0.15–0.23 ng/g lw). The detected mass fractions were comparable to, or higher than, the mass fractions measured in sticklebacks from the same lake. Our results are similar to other studies, where DPs were detected in low mass fractions in fish despite elevated mass fractions in sediments (Guo et al., 2017). In Southern Norway, 95% of DP mass fractions in fish samples were below the limit of quantification in the urban lake Mjøsa and in the pristine lake Femunden with detected ∑DP values ranging between 0.05–0.10 ng/g ww. (Jartun et al., 2020). The few detected syn-DP and anti-DP mass fractions in Storvannet char were slightly higher than in Trout or Walleye from all of the Great Lakes, except for anti-DP in Lake Huron which were higher than in Storvannet (Guo et al., 2017). Moreover, they were also comparable to those in Arctic char from Greenland (Vorkamp et al., 2019b), where syn-DP was not detected, and anti-DP was detected in low mass fractions in 3 out of 6 samples (0.047–0.188 ng/g lw). The trout samples from Storvannet had anti-DP mass fractions that were only slightly higher than those from Lakes Michigan and Superior (Guo et al., 2017). Other studies of trout from the Great Lakes have found higher ∑DP mass fractions with a mean of 0.35 ng/g lw (Kurt-Karakus et al., 2019) and also in a range from 2.3–7.2 ng/g lw (Lake Ontario only) with the highest mass fractions from 1988 (Ismail et al., 2009). In Takvannet neither of the DP isomers were found in char or trout. Supplementary Figure SI.7 shows the PCA biplot for DPs and DP related compounds. The plot highlights a clear separation between compartments and to a lower degree between lakes. The low detection frequency of syn-DP and anti-DP in char and trout species in both Storvannet and Takvannet compared with levels in samples from benthic organisms or stickleback samples in the same lake, indicate a lack of magnification for DP isomers in both lakes. BSAF for both anti and syn DP (Supplementary Figure SI.8) suggest low bioaccumulation potential. In Takvannet, BSAF could only be estimated for benthic organisms (average 1.11 and 0.46 for syn and anti DP) and sticklebacks (average of 0.03 for syn DP and 0.06 for anti DP). In Storvannet, BSAF values were lower than 1 in all organisms, including benthos (0.04 and 0.06 for anti and syn DP), sticklebacks (0.003 and 0.01 for anti and syn DP) and char (0.002 and 0.003 for anti and syn DP). The low BSAF values of both DPs in both lakes indicate a lack of biomagnification. However, these BSAFs should be interpreted with care due to the small sample size. Similar results were observed but with trophic magnification factors (TMFs) in Lake Ontario by Tomy et al. (2007), where low TMF values for syn- and anti-DP indicated a lack of biomagnification. Results from Lake Winnipeg were more ambiguous, with an estimated TMF of 2.5 for anti-DP, but a lack of biomagnification for syn-DP (Tomy et al., 2007). In contrast, Wu et al. (2010) found TMFs of 6.5 and 11.3 for anti-DP and syn-DP, respectively. It has been suggested that the lack of increasing DP with increasing trophic level may be explained by DPs low water solubility and high octanol water partition coefficient (log Kow = 11.3, Shen et al., 2011b). DPs high hydrophobicity means that it binds to organic carbon both in sediments and in the water column and hence is less bioavailable. The high log KOW limits the transfer efficiency across the gastrointestinal tract, hence decreasing the organism’s uptake of DP from the diet (Hoh et al., 2006; Guo et al., 2017). It is also possible that DPs become biotransformed by fish, as has been described by Hoh et al. (2006). Previous studies have concluded that DP bioaccumulation patterns are species-specific rather than simply correlated with general trophic level, and that differences in biomagnification also can be related to differences in ecosystem structure (Tomy et al., 2007; Vorkamp et al., 2015; Schlabach et al., 2017; Vorkamp et al., 2019b). Biomagnification of DP isomers has been detected in freshwater food webs (Tomy et al., 2007; Wu et al., 2010) but also in marine food webs (Peng et al., 2014; Na et al., 2017; Zhang and Kelly, 2018). The reasons why they display biomagnification in certain species/food-webs, but not in others, is not clearly known yet.
The commercial DP products consist of around 65% anti-DP and 35% syn-DP, giving an
The fanti values in benthos were higher in Storvannet than in Takvannet for both mollusks (ST: fanti = 0.79, TA: fanti = 0.43) and chironomids (ST: fanti = 0.74, TA: fanti = 0.54). This indicates a depletion of anti-DP in benthos from Takvannet compared to in Storvannet. It also indicates a depletion of anti-DP in benthos compared to sediments in Takvannet. However, when all benthic samples in Takvannet were considered, the range in fanti was large (0.43–0.86), and it is hard to draw conclusions due to a low number of samples. The median fanti values in sticklebacks were not different between the two lakes (ST: 0.65, TA: 0.64) and were within the range observed for commercial DP products.
Due to low detection frequencies of DP in trout and char, fanti could only be estimated for one char sample from Storvannet (0.60). This value is in the same range as fanti in fish from Lake Ontario (0.65 ± 0.06) (Tomy et al., 2007), Lake Superior (0.63 ± 0.07) and Lake Erie (0.60 ± 0.07) (Guo et al., 2017). As in other studies (Tomy et al., 2007; Shen et al., 2011a), we observed lower fanti values for benthic organisms and fish than in sediments. In the food web from Lake Ontario, the values declined from 0.65 in plankton to 0.51 in trout (Tomy et al., 2007). This might be explained by a stereoselective accumulation of syn-DP, since anti-DP is more reactive and susceptible to photodegradation and biodegradation (Möller et al., 2010; Wang et al., 2015). Experiments have shown that the syn isomer had higher assimilation and lower depuration in rainbow trout than the anti-isomer (Tomy et al., 2008). It is not known if this happens in other organisms to the same extent (Wang et al., 2016).
Dec 601 and 604 were below LOD in all samples in both Storvannet and Takvannet. This is in agreement with findings from the limited number of studies describing the presence of DP related compounds in freshwater ecosystems (Shen et al., 2010; Shen et al., 2011a; 2011b; Jartun et al., 2020). Neither Dec 601 nor 604 were detected in sediments or fish from Lake Mjøsa or Lake Femunden (Jartun et al., 2020), and were also not detected in sediments, fish or birds from the Oslofjord (Ruus et al., 2019). While Dec 604 has been described in sediments and fish samples from the Great Lakes (Sverko et al., 2011) it was only present in the sediment samples from Michigan, Huron, Erie and Ontario lakes and only in four samples from Lake Superior (Shen et al., 2010; Shen et al., 2011a), while in fish samples it was only present in trout from Lake Ontario (Shen et al., 2010). This suggests that the manufacturing plants along the Niagara River were the main sources of the detected Dec 604. Thus, it is not surprising that we did not detect Dec 604 in Storvannet and Takvannet. Moreover, this also agrees with a spatial study of Dechlorane Plus and related compounds in European background air, including Norwegian sites, where Dec 601 and 604 were not detected in air samples (Skogeng et al., 2023).
Dec 603 (Table 3; Supplementary Table SI.5; Figure 2) was detected in all sediment samples from both lakes (ST: 2.54 p/g OC, range: 1.28–3.95 pg/g OC; TA: 0.014 pg/g OC, range: 0.01–0.05 pg/g OC), and in the chironomid sample (0.23 ng/g lw, n = 1), all sticklebacks (0.02 ng/g lw, range: 0.01–0.03 ng/g lw, n = 5) and two trout samples (0.08–0.13 ng/g lw) in Storvannet. Dec 603 was not detected in biota from Takvannet. Similarly low Dec 603 mass fractions were found in sediment in the Oslofjord (average 0.069 ng/g dw (Ruus et al., 2019)) and in two studies in the Great Lakes (0.001–0.6 ng/g dw (Shen et al., 2010) and < LOD–1.1 ng/g dw (Shen et al., 2011b)). The Dec 603 mass fractions measured in Storvannet are in the low range in comparison to measurements in trout from Lake Superior, Huron and Ontario and in whitefish from Lake Erie, with mass fractions ranging from 0.014–0.500 ng/g lw (Shen et al., 2010). There is no clear current point source of Dec 603, thus this compound might enter the lakes mainly through atmospheric transport (Shen et al., 2010). However, Dec 603 was not measured above detection limits in air samples from background regions in Europe (Skogeng et al., 2023).
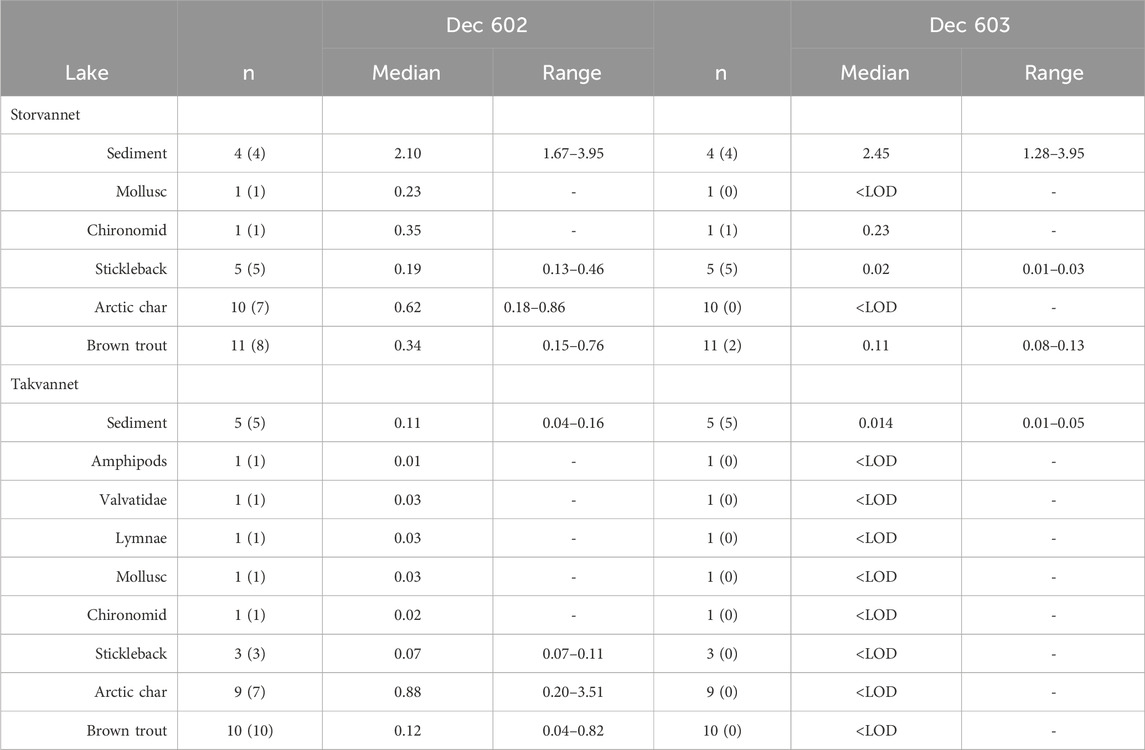
Table 3. Mass fractions of Dec 602 and 603 measured in sediment (pg/g OC) and biota (pg/g ww) in Storvannet and Takvannet. The numbers in parentheses indicate the number of samples > LOD. Mass fractions < LOD are not included in medians and range.
Dec 602 was found in all sediment samples from both lakes, with mass fractions ranging between 1.67–3.95 pg/g OC in Storvannet (median 2.10 pg/g OC), and 0.04–0.16 pg/g OC (median 0.11 pg/g OC) in Takvannet (Figure 2; Table 3; Supplementary Table SI.5). Dec 602 was detected more frequently than Dec 603 in the biota samples. Dec 602 was detected in all benthos and stickleback samples, and in over 70% of trout and char samples, from both lakes. Dec 602 was higher in the single chironomid sample (0.35 ng/g lw) than in the single mollusk sample (0.23 ng/g lw) from Storvannet. Mass fractions in benthic organisms from Takvannet were lower than in Storvannet and ranged between 0.008–0.029 ng/g lw (n = 5). Similarly, Dec 602 in sticklebacks were higher in Storvannet (0.19 ng/g lw (range: 0.13–0.46, n = 5)) than in Takvannet (0.07 ng/g lw (range: 0.07–0.11, n = 3)) (Figure 2). Mass fractions in trout from Storvannet had a median of 0.34 ng/g lw (range: 0.15–0.76 ng/g lw, n = 9) while in Takvannet the median value was 0.12 ng/g lw (range: 0.04–0.82, n = 10). In contrast, char from Takvannet (0.88 ng/g lw, range 0.20–3.51, n = 7) had higher mass fractions than Storvannet char (0.62 ng/g lw, range: 0.18–0.86, n = 7). However, these differences between lakes for char and trout were not significant.
Takvannet had lower Dec 602 mass fractions in sediment than those reported for any of the Great Lakes (Shen et al., 2010), while Dec 602 in Storvannet sediment was higher in all of the Great Lakes except Lake Ontario h (0.160–11 ng/g dw) (Shen et al., 2010). Dec 602 median mass fractions in trout from Takvannet and Storvannet were 61 and 21 times lower, respectively, than those in trout from Lake Ontario (7.38 ng/g lw). Dec 602 mass fractions in char from Storvannet and Takvannet were lower than in char from all the Great Lakes, except Lake Superior.
While there were clear differences in sediment Dec 602 mass fractions between Storvannet and Takvannet, differences between lakes decreased with increasing
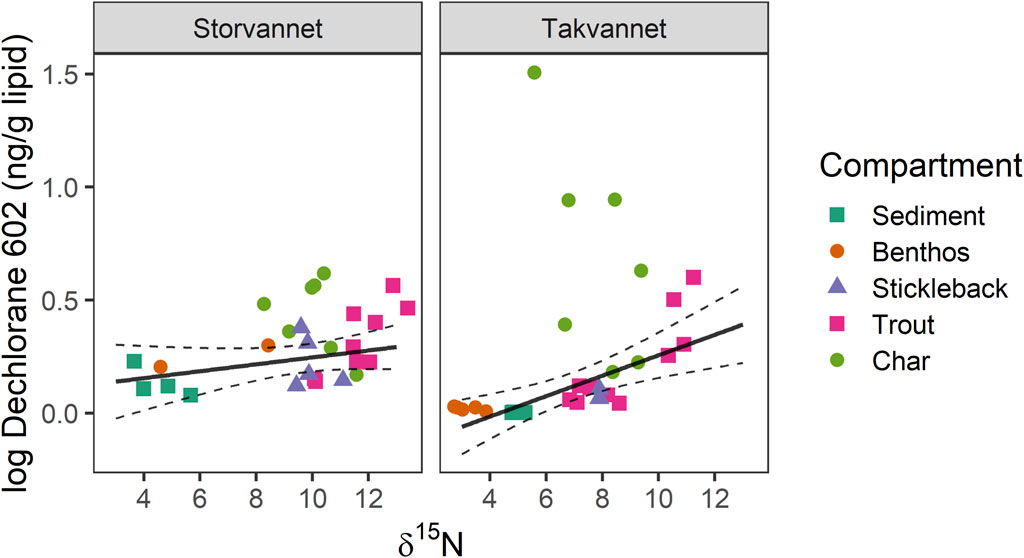
Figure 3. Relationship between
The higher mass fractions of DP, Dec 602 and Dec 603 in Storvannet sediments compared to those in Takvannet suggest that Storvannet may receive not only LRAT input but also contribution from local emissions of these compounds. This is not unexpected, since DP and related compounds have been widely used as flame retardants in industrial applications and household products such as in electrical and electronic equipment (Wang et al., 2016). Production, use, recycling, waste handling, as well as leachate and run-off from landfills, wastewater treatment plants and more, can lead to their release (Wang et al., 2016; Schlabach et al., 2017; Wang and Kelly, 2017). High levels of DPs have been measured in sewage sludge and wastewater treatment plants from urban areas (de la Torre et al., 2012; Barón et al., 2014b; Schlabach et al., 2017), and they have also been found in dust and electronic appliances from residential areas (Newton et al., 2015; Schlabach et al., 2017; Wong et al., 2018; Sørensen and Larsen, 2019). Storvannet has received both intentional and unintentional emissions of untreated wastewater (Krogseth et al., 2017a; Krogseth et al., 2017b), which could potentially be a source of DP and related compounds to Storvannet.
SCCPs and MCCPs are presented in Table 4, Table 5 and Supplementary Table SI.6, 7. Supplementary Figure SI.9 shows a PCA biplot which highlights the difference between MCCPs and SCCPs between compartments and lakes. Although only 57.1% of variation was explained by the first two principal components, the PCA biplot is still useful to identify clusters. Storvannet sediments and sticklebacks and benthic samples from both lakes are more influenced by MCCPs than SCCPs. While trout and char from both Storvannet and Takvannet are more influenced by SCCPs. Both SCCPs and MCCPs were detected in all sediment samples from Storvannet with median mass fractions of 63 ng/g dw (range: 46–115 ng/g dw) and 77 ng/g dw (range of 66–137 ng/g dw) for ΣSCCPs and ΣMCCPs, respectively. Higher mass fractions of MCCPs relative to SCCPs agree with current emission profiles for CPs, where MCCP usage and emissions have increased in recent years due to regulatory scrutiny and regulation of SCCPs. The MCCP:SCCP ratio was relatively consistent, and in most cases >1 (0.9, 1.2, 1.5, and 1.6 in the four samples respectively). Overall, total SCCP tended to be at least one order of magnitude higher in Storvannet than in Takvannet (median: 0.661 ng/g dw, range: 0.399–5.281 ng/g dw), but due to the small sample size, this difference was not statistically significant (Wilcoxon rank sum test, W = 12, p = 0.057). While MCCPs were detected in samples from Storvannet, they were not detected in samples from Takvannet. This may be due to the higher molecular mass and therefore low degree of LRAT of MCCPs (Wu et al., 2019). The presence of MCCPs in Storvannet may therefore be a result of local use of products containing CPs (Li et al., 2021).
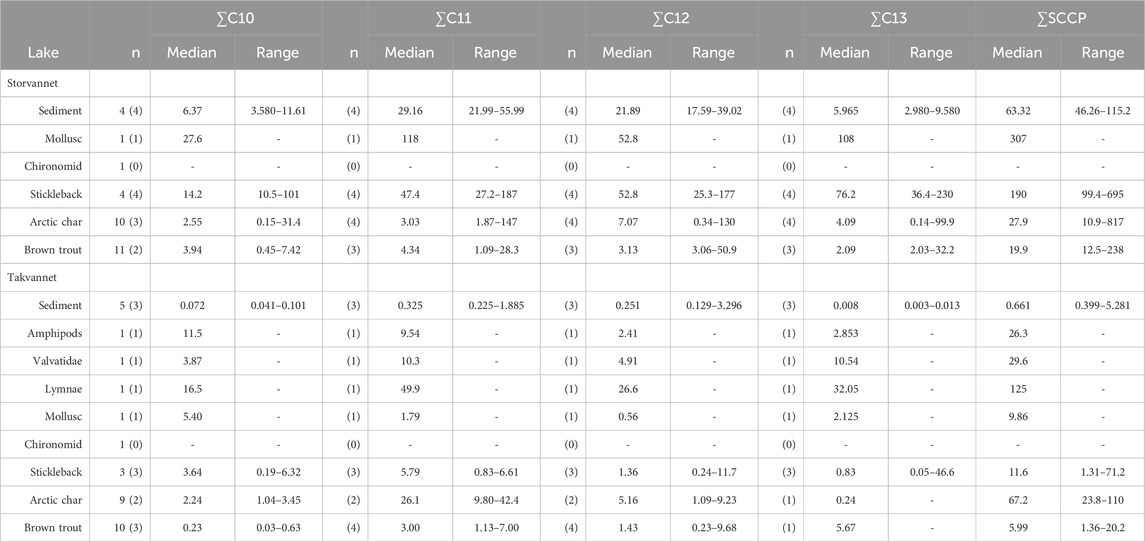
Table 4. Mass fractions of SCCP homologue groups (denoted by the carbon chain length) in sediments (ng/g dw) and biota (ng/g lw) in Storvannet and Takvannet, as well as the ∑SCCPs. N = number of samples analyzed, number between parentheses represents the number of samples that were above LOD. Mass fractions < LOD were not included in the median and ranges.
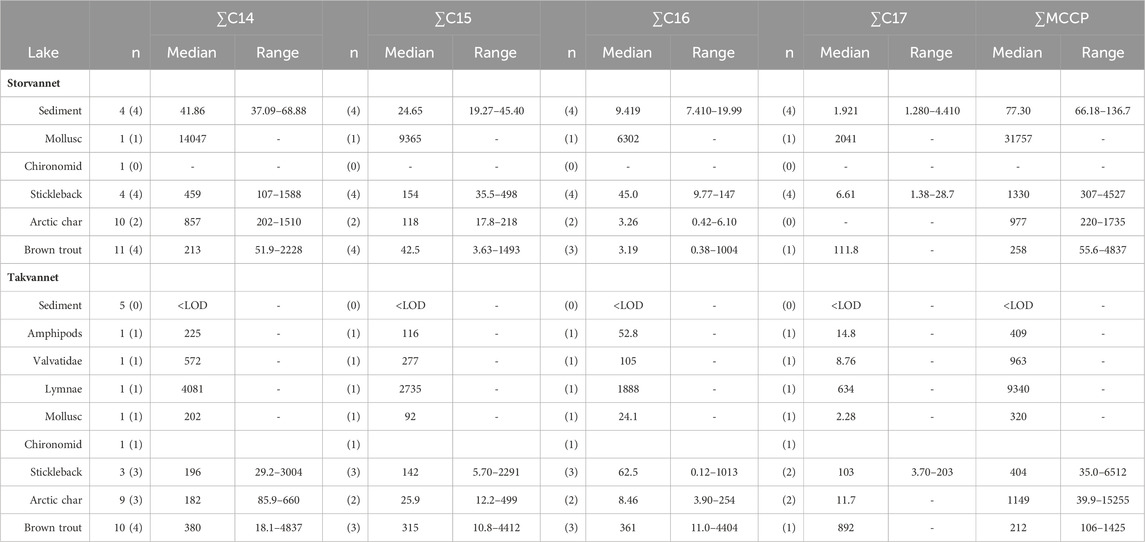
Table 5. Mass fractions of MCCP homologue groups (denoted by the carbon chain length) in sediments (ng/g dw) and biota (ng/g lw) in Storvannet and Takvannet, as well as the ∑MCCPs. N = number of samples analyzed, number between parentheses represents the number of samples that were above LOD. Mass fractions < LOD were not included in the median and ranges.
In Storvannet, CPs were only detected in a mollusk sample with a ∑SCCP 2.41 ng/g ww (307 ng/g lw) and 124 ng/g ww (31757 ng/lw) of ∑MCCPs. In Takvannet SCCPs and MCCPs were measured in 4 benthic organisms, with Lymnae having the highest mass fractions for both CPs (∑SCCPs: 1.38 ng/g ww (125 ng/g lw), ∑MCCPs: 102 ng/g ww (9340 ng/g lw)) > Amphipods (SCCPs: 0.34 ng/g ww (26.3 ng/g lw), MCCPs: 5.27 ng/g ww (409 ng/g lw) > Valvatidae (SCCPs: 0.16 ng/g ww (29.6 ng7g lw), MCCPs: 5.31 ng/g ww (963 ng/g lw)) > Mollusc (SCCPs: 0.05 ng/g ww (9.86 ng/g lw), MCCPs: 1.65 ng/g ww (320 ng/g lw)) (Table 4; Table 5; Supplementary Table SI.6, 7).
∑SCCPs were observed in sticklebacks from both lakes, Storvannet (median: 10.2 ng/g ww, 191 ng/g lw) and Takvannet (median: 0.6 ng/g ww, 11.6 ng/g lw). Interestingly, in Storvannet, mass fractions detected in trout and char were lower than those found in Sticklebacks, while comparable mass fractions were found among all fish in Takvannet. Median mass fractions of ∑MCCPs in sticklebacks were 1331 ng/g lw (range: 308–4528 ng/g lw) in Storvannet and 404 ng/g lw (range: 35.0–6513 ng/g lw) in Takvannet, however they were not significantly different (Wilcoxon, W = 7, p = 0.86). For top predatory fish, the detection frequency for MCCPs was low for both trout (40%) and char (<30%) in both lakes. In Storvannet, ∑MCCPs mass fractions in trout with values above LOD ranged from 56 to 4838 ng/g lw (median: 258 ng/g lw) and in Takvannet they ranged from 106–1425 ng/g lw (median: 212 ng/g lw). These mass fractions were not significantly different between lakes (Wilcoxon, W = 7, p = 0.89). For char, ∑MCCPs in Storvannet ranged from 220 to 1735 ng/g lw (median: 978 ng/g lw), and in Takvannet from 39 to 15255 ng/g lw (median: 1149 ng/g lw). However, this maximum value is from one individual with an extremely low lipid content. Again, mass fractions were not significantly different between lakes (Wilcoxon, W = 5, p = 0.4). Within lakes there were no significant differences between char and trout (Storvannet: W = 3, p = 0.8; Takvannet: W = 8, p = 0.629). Although nonparametric tests were performed, results should be interpreted with caution due to the very small number of samples with values above LOD. Nevertheless, among the small number of fish with mass fractions above LOD, the medians were very similar in the two lakes. This was unexpected due to the proximity of Storvannet to an urban area. Similar to SCCPs, MCCPs did not show an increase in mass fractions with increasing
BSAF values for SCCPs and MCCPs are shown in Supplementary Figures SI.10–12. BSAF values greater than 1 were found for several homologues in Storvannet benthos (C10Cl6, C10Cl7, C11Cl6, C11Cl7, C12Cl5, C12Cl6, C12Cl7, C13Cl6, C13Cl7, C13Cl8) and sticklebacks (C10Cl6, C10Cl7, C11Cl6, C12Cl8, C13Cl7, C13Cl8, C13Cl9), and for only a few homologues in Takvannet benthos (C10Cl9, C11Cl9, C12Cl9, C13Cl10), sticklebacks (C12Cl9, C13Cl10) and char (C10Cl9, C11Cl9, C11Cl10). BSAF for MCCPs could only be estimated for organisms in Storvannet, and the only benthic organism was not included due to its very low lipid content. BSAF values were above 1 also for several MCCP homologues in sticklebacks (C14Cl8, C14Cl9, C14Cl10, C15Cl10, C16Cl10), trout (C14Cl5, C14Cl6, C15Cl5, C15Cl6, C15Cl7, C16Cl5, C16Cl6, C17Cl7) and char (C14Cl8, C14Cl9, C14Cl10). Previous studies have shown a negative correlation between BSAFs and log Kow (Sun et al., 2017; Huang et al., 2019), suggesting that bioaccumulation of SCCPs decreases with increasing log Kow (Sun et al., 2017). While there was no evidence for such a relationship in our study (see Fig SI 10-12), this may be a result of the small sample size.
Although mass fractions of both SCCPs and MCCPs were low in this study, their presence in sub-Arctic lakes reflects that CPs can undergo LRAT (Wu et al., 2019; Jiang et al., 2021). Our results are in agreement with previous studies where higher mass fractions of CPs have been observed close to urban areas with industrial and anthropogenic activity (Li et al., 2021).
The congener group patterns for both SCCPs and MCCPs are provided in Figures 4–8. The patterns observed in both lakes showed SCCP profiles dominated by higher chlorinated congener groups while the MCCPs showed consistency in their profiles with C14 being the prevalent carbon chain length. Within the sediment samples, the C11 and C12 homologues contributed highest to the sum of SCCPs in both Storvannet (47% ± 1.5% and 35% ± 2.5%, respectively) and Takvannet (47% ± 10% and 44% ± 16%, respectively). The most abundant SCCP congener groups in sediment were C11,Cl9-11 and C12,Cl10-12 (Figure 4). This is in good agreement with sediment core samples from a rural lake in Switzerland showing a C11-12 contribution of 66%–87% (mean: 79%) (Iozza et al., 2008). The SCCP profiles we observed are very different compared to those observed in the technical mixtures where congeners with Cl5-8 dominate in the SCCP 51% and 55% Cl and Cl7-10 in the SCCP 63% Cl. Similar findings, i.e., high chlorination (Cl8-11) SCCP profiles, were observed in rubber granulates (Brandsma et al., 2019). This profile is most likely caused by use of different technical CP mixtures available worldwide for use in product manufacturing, in addition to recycling of materials to produce new products containing various technical mixes (Krätschmer and Schächtele, 2019). With adoption of recent regulations on the use of SCCPs under the Stockholm convention, SCCPs present in the environment will represent a very different profile to those observed prior to regulations. This is either as a result of degradation or use/recycling of different technical mixtures for production of products which warrants further investigation.
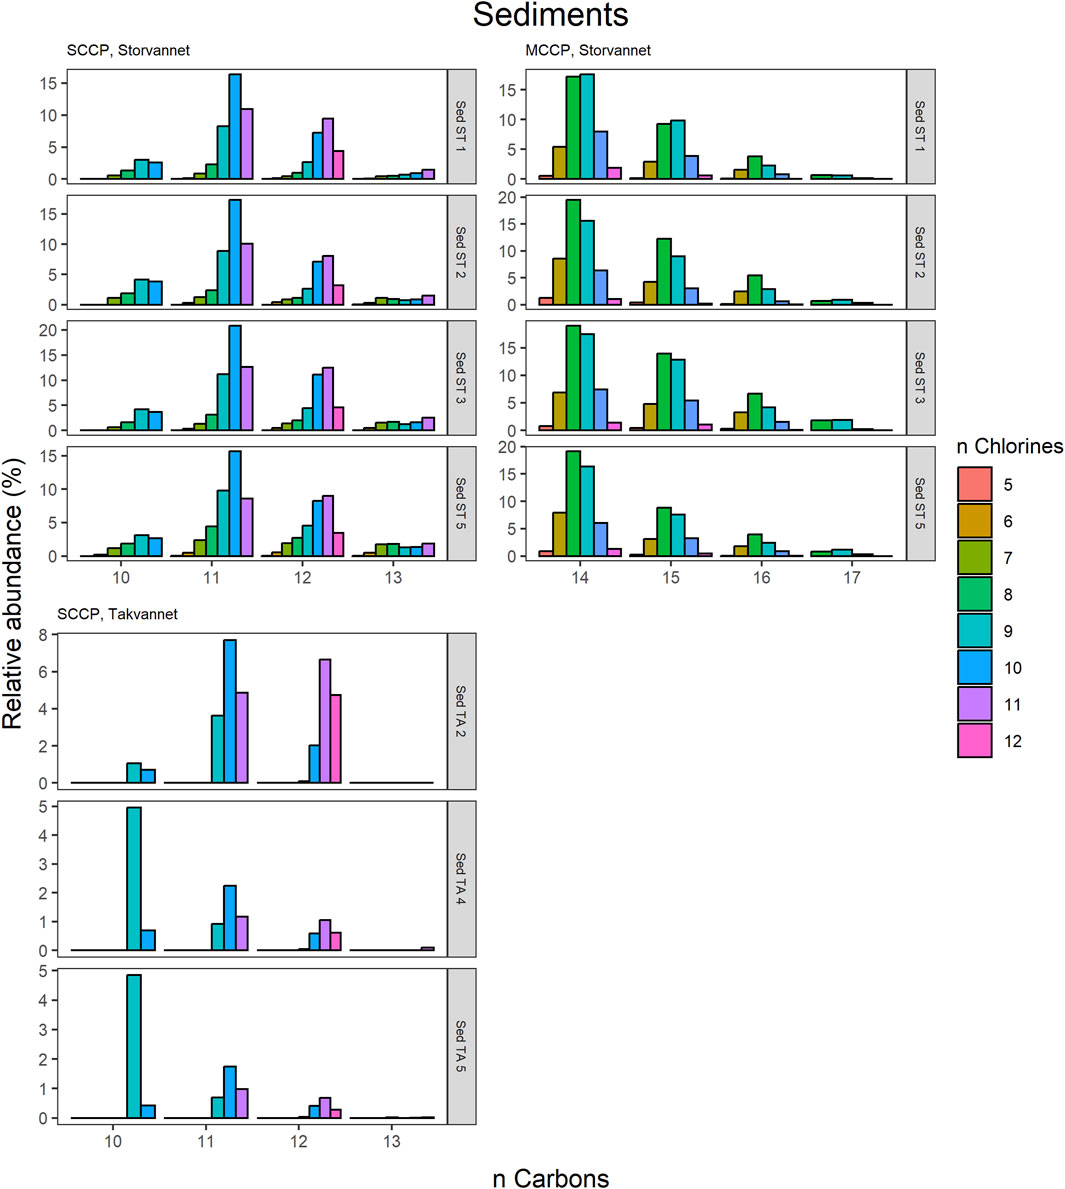
Figure 4. Relative abundance profiles of SCCP and MCCP homologues in sediment samples from Storvannet and Takvannet.
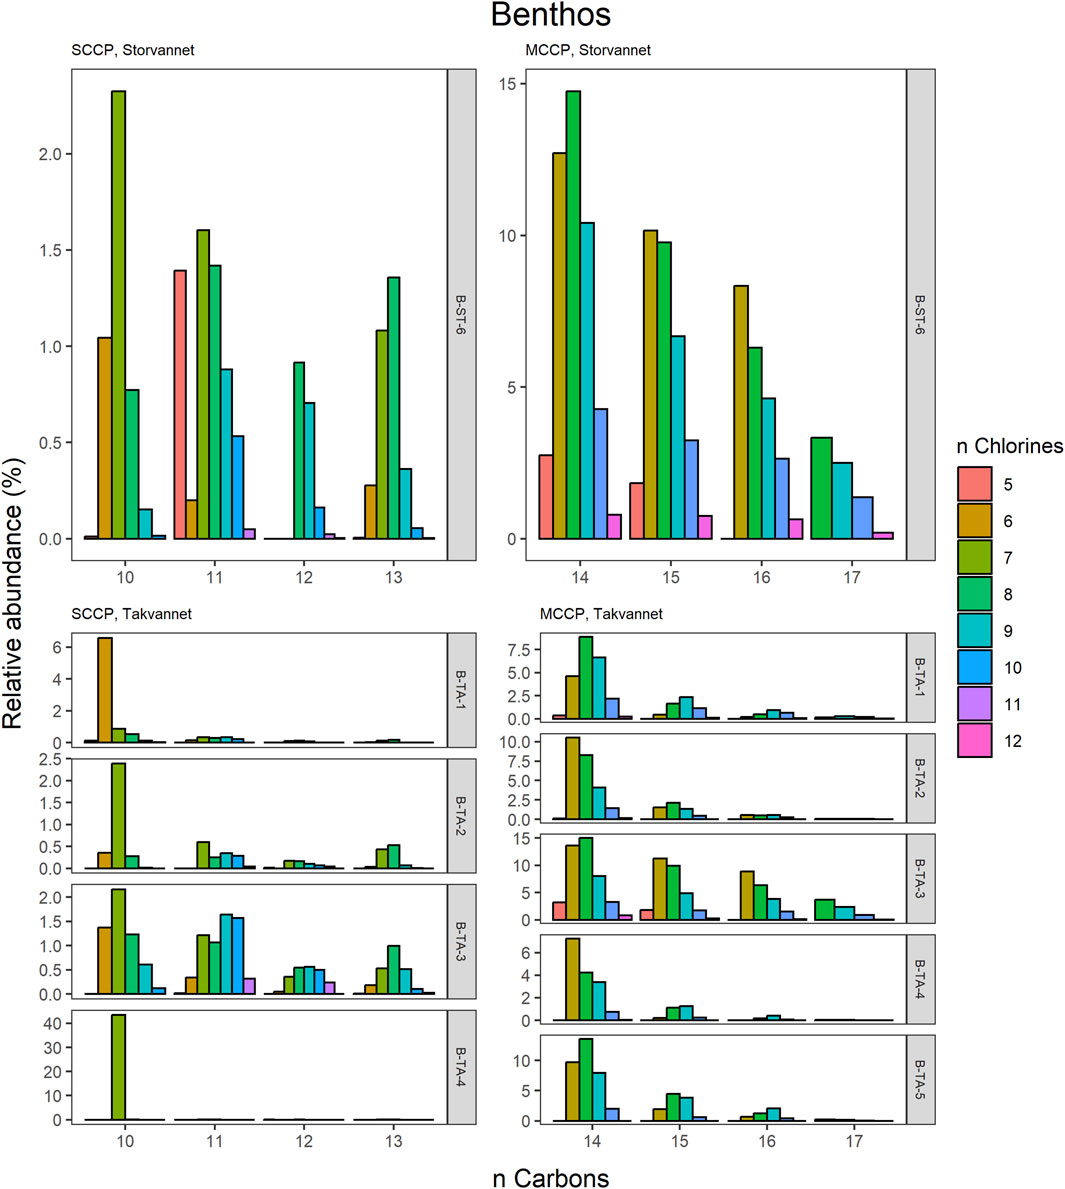
Figure 5. Relative abundance profiles of SCCP and MCCP homologues in benthic samples from Storvannet and Takvannet.
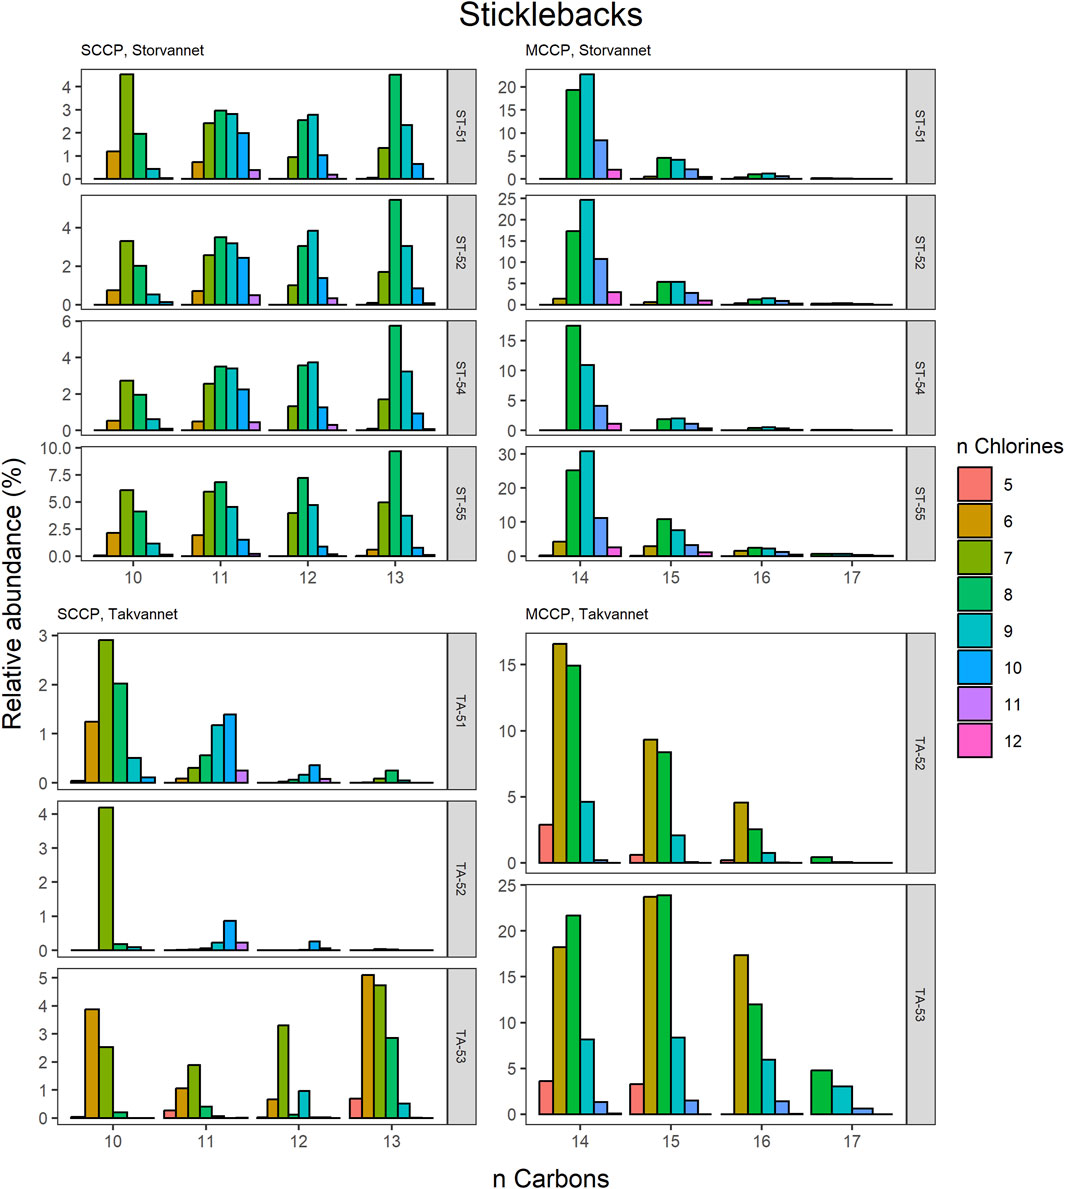
Figure 6. Relative abundance profiles of SCCP and MCCP homologues in three-spined stickleback samples from Storvannet and Takvannet.
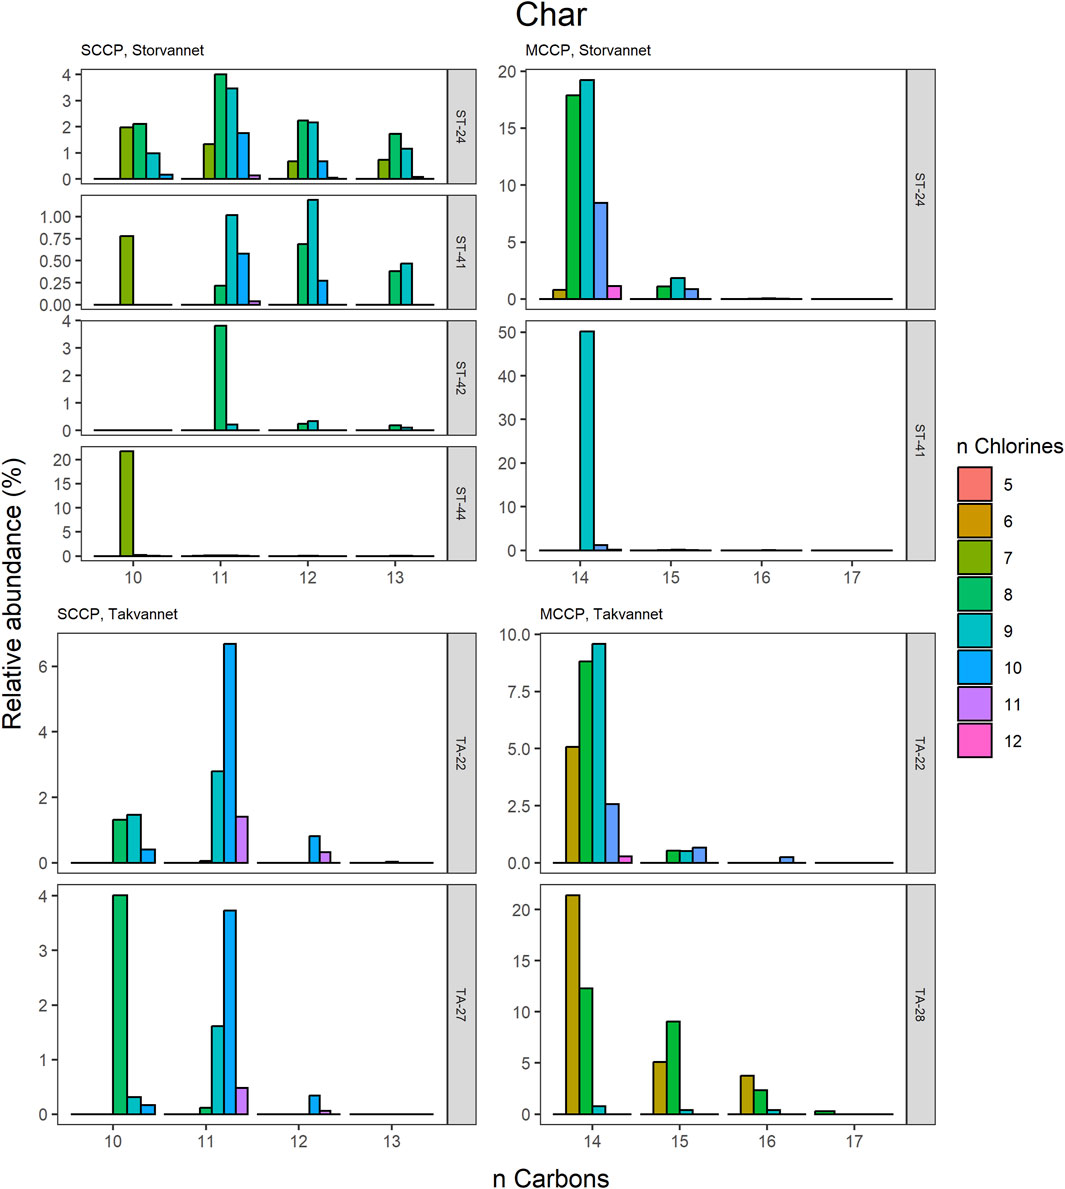
Figure 7. Relative abundance profiles of SCCP and MCCP homologues in Arctic char from Storvannet and Takvannet.
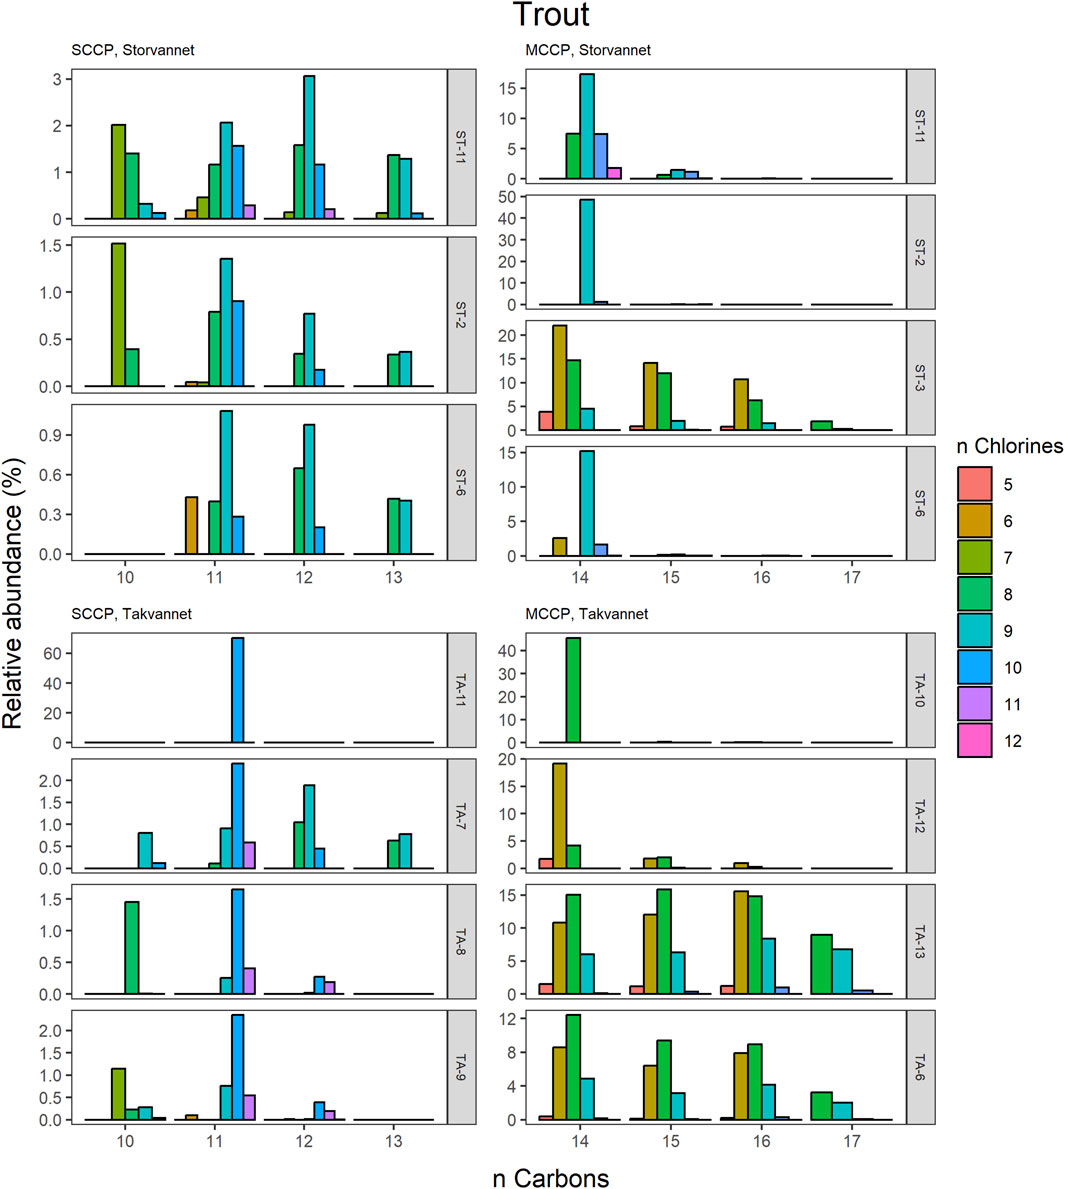
Figure 8. Relative abundance profiles of SCCP and MCCP homologues in Brown trout from Storvannet and Takvannet.
The MCCPs were only detected in sediments from Storvannet (Section 4.2.1) with C14 as the major contributor (54% ± 2.4%), followed by C15, C16 and C17 (32% ± 1.8%, 12% ± 1.0% and 2.6% ± 0.6%, respectively). The MCCP profiles are in good agreement with sediment samples from the North and Baltic Sea (Hüttig and Oehme, 2006) with contributions of 45%–50% and 31%–40% for the C14 and C15 homologues and from Lake Thun in Switzerland (C14; 41%–64%, mean: 48%). The MCCP profiles observed in sediment are almost identical to those in benthic organisms from both Storvannet and Takvannet (52% ± 9.9%, 30% ± 1.4%, 15% ± 6.3% and 3.3% ± 2.8% for C14-17, respectively) (Figure 5), highlighting the importance of organism-sediment coupling in driving food chain exposure to MCCPs. The SCCPs, however, showed differences in profiles between the sediment and benthic organisms. Comparable to the sediment samples, the C11 homologue was found to be the most dominant in almost all organisms (ranging from 18% to 40%) but was followed by the contribution of the C13 homologue (11%–36%) instead of the C12 homologue (9%–21%). The Chironomidae in both lakes showed SCCP profiles deviating from the other organisms with the C13 chain length as major contributor (Storvannet: 95% and Takvannet: 70%).
The high contributions of C13 were also observed in stickleback in Storvannet with profiles very similar between the individuals (Figure 6). The relative proportion increased with increasing carbon length, with C13 being the most dominant group of the SCCPs (18% ± 1.3%). One stickleback sample in Takvannet showed a profile similar to those in Storvannet, while the other two showed profiles comparable to the sediment samples with dominance of the C11 homologue followed by the C12. This could be attributed to the fact that shorter and less chlorinated CPs will have a greater volatility and be more easily transported via LRAT. The MCCP profiles of the sticklebacks in Storvannet showed consistency among all samples with the C14-15 as most abundant homologues (70% ± 0.7% and 23% ± 0.6%, respectively). The composition of the MCCPs in sediment and biota were found to be a combination of the MCCPs with 52% and 57% Cl, implying that their occurrence within the environment is a result from production and use of materials containing these mixtures. There was no significant difference found between the SCCP profiles detected in the top predatory fish in Takvannet (Figure 7; Figure 8). The C11 and C12 homologues were found to be most abundant in the trout and char samples (68% ± 23% and 24% ± 14%, respectively), different from the profiles observed in the biota samples from Storvannet where C13 was observed as greatest contributor. The C10 homologues dominated in both fish, but with a much higher contribution in char (71% ± 20%) than in trout (40% ± 16%). The opposite was observed with C13 homologue, which had higher contribution in trout (6.6% ± 5.7%) than in char (0.3% ± 0.5%). No clear explanation could be found for this occurrence and therefore more research is needed to understand the CP homologue behavior.
In conclusion, we have shown the presence of emerging and legacy pollutants in two lakes in the Norwegian sub-Arctic. Our results confirm higher mass fractions in a lake close to an urbanized area (Storvannet). This suggests that Storvannet may receive not only long-range transport input but in addition has local sources of pollution. This is not unexpected, since these chemicals have been widely used as flame retardants in industrial applications and household products such as in electrical and electronic equipment. The fact that these pollutants were also detected (albeit in low mass fractions) in the pristine Takvannet lake, suggests that this lake receives contaminants via atmospheric transport. Increase in mass fractions with increasing δ15N was only observed for PCBs and Dec 602 in Takvannet. The lack of trophic magnification in Storvannet resembles the previously observed and modelled concentrations of cyclic volatile methyl siloxanes (cVMS) in this lake. This could be explained by the characteristics of both the physical environment and food web structure. Storvannet has a rapid water turnover, causing a non-equilibrium situation between water and sediments, resulting in the highest mass fractions being present in benthic invertebrates. Mass fractions of CPs and DPs were observed in sediments, benthic organisms and sticklebacks but were detected in only few samples in trout and char. Higher mass fractions of MCCPs over SCCPs agrees with current emission profiles for CPs, where MCCP use, and emissions have increased in recent years due to regulatory scrutiny and regulation on SCCPs. These results contribute to our understanding of mass fractions of legacy and emerging contaminants in lake ecosystems and provide evidence of both long-range and locally sourced contamination in the subarctic.
The raw data supporting the conclusion of this article will be made available by the authors, without undue reservation.
Ethical approval was not required as the study was based on dead fish obtained from UiT in Takvannet and with a fishing permit in Storvannet. Fish were sampled in lakes that are open to public fishing.
AA: Conceptualization, Data curation, Formal Analysis, Investigation, Methodology, Software, Validation, Visualization, Writing–original draft, Writing–review and editing. IA: Data curation, Formal Analysis, Investigation, Methodology, Software, Writing–original draft, Writing–review and editing. NW: Data curation, Investigation, Methodology, Software, Writing–review and editing. DH: Data curation, Investigation, Methodology, Writing–review and editing. MH: Data curation, Investigation, Methodology, Writing–review and editing. P-AA: Resources, Writing–review and editing. AE: Writing–review and editing, Conceptualization, Funding acquisition, Project administration. CM: Writing–review and editing, Investigation. IK: Conceptualization, Funding acquisition, Investigation, Methodology, Supervision, Visualization, Writing–review and editing.
The author(s) declare that financial support was received for the research, authorship, and/or publication of this article. This study was funded by the Research Council of Norway (RCN) (#244298, #267574, and #287114) and the FRAM Centre Flagship for Hazardous Substances–effects on ecosystems and human health (#132018).
We thank Guttorm Christensen for field assistance and logistics support and Merete Miøen for advice and assistance in the laboratory.
The authors declare that the research was conducted in the absence of any commercial or financial relationships that could be construed as a potential conflict of interest.
All claims expressed in this article are solely those of the authors and do not necessarily represent those of their affiliated organizations, or those of the publisher, the editors and the reviewers. Any product that may be evaluated in this article, or claim that may be made by its manufacturer, is not guaranteed or endorsed by the publisher.
The Supplementary Material for this article can be found online at: https://www.frontiersin.org/articles/10.3389/ftox.2024.1298231/full#supplementary-material
Al Saify, I., Cioni, L., Van Mourik, L. M., Brandsma, S. H., and Warner, N. A. (2021). Optimization of a low flow sampler for improved assessment of gas and particle bound exposure to chlorinated paraffins. Chemosphere 275, 130066. doi:10.1016/j.chemosphere.2021.130066
AMAP (2016). in AMAP assessment 2016: chemicals of emerging arctic concern. AMAP), A. M. A. A. P. Oslo, Norway.
AMAP (2017). “Chemical of emerging arctic concern. Summary for policy-makers,” in Arctic monitoring and assessment programme (AMAP). Oslo, Norway.
Amundsen, P. A., Knudsen, R., and Klemetsen, A. (2007). Intraspecific competition and density dependence of food consumption and growth in Arctic charr. J. Anim. Ecol. 76, 149–158. doi:10.1111/j.1365-2656.2006.01179.x
Amundsen, P. A., Lafferty, K. D., Knudsen, R., Primicerio, R., Klemetsen, A., and Kuris, A. M. (2009). Food web topology and parasites in the pelagic zone of a subarctic lake. J. Anim. Ecol. 78, 563–572. doi:10.1111/j.1365-2656.2008.01518.x
Amundsen, P.-A., Primicerio, R., Smalås, A., Henriksen, E. H., Knudsen, R., Kristoffersen, R., et al. (2019). Long-term ecological studies in northern lakes—challenges, experiences, and accomplishments. Limnol. Oceanogr. 64, S11–S21. doi:10.1002/lno.10951
Barón, E., Manez, M., Andreu, A. C., Sergio, F., Hiraldo, F., Eljarrat, E., et al. (2014a). Bioaccumulation and biomagnification of emerging and classical flame retardants in bird eggs of 14 species from Donana Natural Space and surrounding areas (South-western Spain). Environ. Int. 68, 118–126. doi:10.1016/j.envint.2014.03.013
Barón, E., Santín, G., Eljarrat, E., and Barceló, D. (2014b). Occurrence of classic and emerging halogenated flame retardants in sediment and sludge from Ebro and Llobregat river basins (Spain). J. Hazard Mater 265, 288–295. doi:10.1016/j.jhazmat.2013.10.069
Basconcillo, L. S., Backus, S. M., Mcgoldrick, D. J., Zaruk, D., Sverko, E., and Muir, D. C. (2015). Current status of short- and medium chain polychlorinated n-alkanes in top predatory fish across Canada. Chemosphere 127, 93–100. doi:10.1016/j.chemosphere.2015.01.016
Bogdal, C., Alsberg, T., Diefenbacher, P. S., Macleod, M., and Berger, U. (2015). Fast quantification of chlorinated paraffins in environmental samples by direct injection high-resolution mass spectrometry with pattern deconvolution. Anal. Chem. 87, 2852–2860. doi:10.1021/ac504444d
Bohlin-Nizzetto, P., and Aas, W. (2014). Monitoring of environmental contaminants in air and precipitation, annual report 2013. Oslo, Norway: Norwegian Institute for Air Research (NILU. I.S., K).
Bouwman, H., Polder, A., Venter, B., and Skaare, J. U. (2008). Organochlorine contaminants in cormorant, darter, egret, and ibis eggs from South Africa. Chemosphere 71, 227–241. doi:10.1016/j.chemosphere.2007.09.057
Brandsma, S. H., Brits, M., Groenewoud, Q. R., Van Velzen, M. J. M., Leonards, P. E. G., and De Boer, J. (2019). Chlorinated paraffins in car tires recycled to rubber granulates and playground tiles. Environ. Sci. Technol. 53, 7595–7603. doi:10.1021/acs.est.9b01835
Burkhard, L. P., Cook, P. M., and Lukasewycz, M. T. (2004). Biota--sediment accumulation factors for polychlorinated biphenyls, dibenzo-p-dioxins, and dibenzofurans in southern Lake Michigan lake trout (Salvelinus namaycush). Environ. Sci. Technol. 38, 5297–5305. doi:10.1021/es035215y
Cabrerizo, A., Muir, D. C. G., Köck, G., Iqaluk, D., and Wang, X. (2018). Climatic influence on temporal trends of polychlorinated biphenyls and organochlorine pesticides in landlocked char from lakes in the Canadian high arctic. Environ. Sci. Technol. 52, 10380–10390. doi:10.1021/acs.est.8b01860
Chen, C., Chen, A., Li, L., Peng, W., Weber, R., and Liu, J. (2021). Distribution and emission estimation of short- and medium-chain chlorinated paraffins in Chinese products through detection-based mass balancing. Environ. Sci. Technol. 55, 7335–7343. doi:10.1021/acs.est.0c07058
Christensen, G. N. (2009). Storvatn, Hammerfest, Undersøkelse av miljøgifter i utløpsvannet. Tromsø, Norway: Akvaplan-niva.
Christensen, G. N., Evenset, A., Dahl-Hansen, G., and GoTsch, A. (2009). Storvatn i Hammerfest kommune. Undersøkelse av miljøgifter i vann, sediment og fisk, 2008. Tromsø, Norway: Akvaplan-niva AS.
De La Torre, A., Alonso, M. B., Martinez, M. A., Sanz, P., Shen, L., Reiner, E. J., et al. (2012). Dechlorane-related compounds in franciscana dolphin (Pontoporia blainvillei) from southeastern and southern coast of Brazil. Environ. Sci. Technol. 46, 12364–12372. doi:10.1021/es302934p
Dick, T. A., Gallagher, C. P., and Tomy, G. T. (2010). Short- and medium-chain chlorinated paraffins in fish, water and soils from the iqaluit, nunavut (Canada), area. World Rev. Sci. Technol. Sustain. Dev. 7, 387–401. doi:10.1504/wrstsd.2010.032747
ECHA (2008). in Data on manufacture, import, export, uses and releases of alkanes, C10-13, chloro, SCCPs.as well as information on potential alternatives to its use. AGENCY, E. C.
Elkin, L., Kay, M., Higgins, J., and Wobbrock, J. (2021). An aligned rank Transform procedure for multifactor contrast test.
Eloranta, A. P., Kahilainen, K. K., Amundsen, P.-A., Knudsen, R., Harrod, C., and Jones, R. I. (2015). Lake size and fish diversity determine resource use and trophic position of a top predator in high-latitude lakes. Ecol. Evol. 5, 1664–1675. doi:10.1002/ece3.1464
Eloranta, P., Knudsen, R., and Amundsen, P. A. (2013). Niche segregation of coexisting Arctic charr (Salvelinus alpinus) and brown trout (Salmo trutta) constrains food web coupling in subarctic lakes. Freshw. Biol. 58, 207–221. doi:10.1111/fwb.12052
Evenset, A., Götsch, A., and Dahl-Hansen, G. (2006). Miljøundersøkelser i Hammerfest havn og Storvatn. Tromsø, Norway: Akvaplan-niva.
Feo, M. L., Baron, E., Eljarrat, E., and Barcelo, D. (2012). Dechlorane Plus and related compounds in aquatic and terrestrial biota: a review. Anal. Bioanal. Chem. 404, 2625–2637. doi:10.1007/s00216-012-6161-x
Fiedler, H., Kallenborn, R., Boer, J. D., and Sydnes, L. K. (2019). The Stockholm Convention: a tool for the global regulation of persistent organic pollutants. Chem. Int. 41, 4–11. doi:10.1515/ci-2019-0202
Gabrielsen, G. W., Evenset, A., Frantzen, S., Gwynn, J., Hallanger, I. G., Kallenborn, R., et al. (2011). MOSJ statusrapport 2011 Miljøgifter. Tromsø, Norway: Norsk Polarinstitutt.
Gao, H., Na, G., Yao, Y., Li, R., Gao, Y., Zhang, Z., et al. (2018). Distribution characteristics and source of dechloranes in soil and lichen of the fildes peninsula (Antarctica). Int. J. Environ. Res. Public Health 15, 2312. doi:10.3390/ijerph15102312
Giskeødegård, GF., and Lydersen, S. (2022). Measurements below the detection limit. Tidsskr Nor Laegeforen. Sep 19;142(13). English, Norwegian. doi:10.4045/tidsskr.22.0439
Glüge, J., Bogdal, C., Scheringer, M., Buser, A., and Hungerbühler, K. (2013). Calculation of physicochemical properties for short- and medium-chain chlorinated paraffins. J. Phys. Chem. Reference Data 42. doi:10.1063/1.4802693
Glüge, J., Schinkel, L., Hungerbuhler, K., Cariou, R., and Bogdal, C. (2018). Environmental risks of medium chain chlorinated paraffins (MCCPs): a review. Environ. Sci. Technol. 52, 6743–6760. doi:10.1021/acs.est.7b06459
Glüge, J., Wang, Z., Bogdal, C., Scheringer, M., and Hungerbuhler, K. (2016). Global production, use, and emission volumes of short-chain chlorinated paraffins - a minimum scenario. Sci. Total Environ. 573, 1132–1146. doi:10.1016/j.scitotenv.2016.08.105
Guildford, S. J., Muir, D. C., Houde, M., Evans, M. S., Kidd, K. A., Whittle, D. M., et al. (2008). PCB concentrations in lake trout (Salvelinus namaycush) are correlated to habitat use and lake characteristics. Environ. Sci. Technol. 42, 8239–8244. doi:10.1021/es801218m
Guo, J., Venier, M., Salamova, A., and Hites, R. A. (2017). Bioaccumulation of Dechloranes, organophosphate esters, and other flame retardants in Great Lakes fish. Sci. Total Environ. 583, 1–9. doi:10.1016/j.scitotenv.2016.11.063
Hageman, K., Bogdal, C., and Scheringer, M. (2015). “Long-range and regional atmospheric transport of POPs and implications for global cycling,” in Persistent organic pollutants (POPs): analytical techniques, environmental fate and biological effects. Editor E. ZENG (Amsterdam, Netherlands: Elsevier).
Hansen, K. M., Fauser, P., Vorkamp, K., and Christensen, J. H. (2020). Global emissions of dechlorane plus. Sci. Total Environ. 742, 140677. doi:10.1016/j.scitotenv.2020.140677
Herzke, D., Nygård, T., Berger, U., Huber, S., and Røv, N. (2009). Perfluorinated and other persistent halogenated organic compounds in European shag (Phalacrocorax aristotelis) and common eider (Somateria mollissima) from Norway: a suburban to remote pollutant gradient. Sci. Total Environ. 408, 340–348. doi:10.1016/j.scitotenv.2009.08.048
Hoh, E., Zhu, , and Hites, R. A. (2006). Dechlorane plus, a chlorinated flame retardant, in the Great lakes. Environ. Sci. Technol. 40, 1184–1189. doi:10.1021/es051911h
Huang, Y., Chen, L., Jiang, G., He, Q., Ren, L., Gao, B., et al. (2019). Bioaccumulation and biomagnification of short-chain chlorinated paraffins in marine organisms from the Pearl River Estuary, South China. Sci. Total Environ. 671, 262–269. doi:10.1016/j.scitotenv.2019.03.346
Huston, C., and Juarez-Colunga, E. (2009). Guidelines for computing summary statistics for datasets containing non-detects, 178. British Columbia, Canada: Bulkley Valley Research Center.
Hüttig, J., and Oehme, M. (2006). Congener group patterns of chloroparaffins in marine sediments obtained by chloride attachment chemical ionization and electron capture negative ionization. Chemosphere 64, 1573–1581. doi:10.1016/j.chemosphere.2005.11.042
Iozza, S., Müller, C. E., Schmid, P., Bogdal, C., and Oehme, M. (2008). Historical profiles of chlorinated paraffins and polychlorinated biphenyls in a dated sediment core from Lake Thun (Switzerland). Environ. Sci. Technol. 42, 1045–1050. doi:10.1021/es702383t
Ismail, N., Gewurtz, S. B., Pleskach, K., Whittle, D. M., Helm, P. A., Marvin, C. H., et al. (2009). Brominated and chlorinated flame retardants in Lake Ontario, Canada, lake trout (Salvelinus namaycush) between 1979 and 2004 and possible influences of food-web changes. Environ. Toxicol. Chem. 28, 910–920. doi:10.1897/08-162.1
Jartun, M., Økelsrud, T. R., Kine, B., Enge, E. K., Halse, A. K., Götsch, A., et al. (2020). Monitoring of environmental contaminants in freshwater ecosystems 2019 – occurrence and biomagnification. Miljødirektoratet M-1805|2020 ISSN 1894-7948.
Jiang, L., Gao, W., Ma, X., Wang, Y., Wang, C., Li, Y., et al. (2021). Long-term investigation of the temporal trends and gas/particle partitioning of short- and medium-chain chlorinated paraffins in ambient air of king george Island, Antarctica. Environ. Sci. Technol. 55, 230–239. doi:10.1021/acs.est.0c05964
Kallenborn, R., Hung, H., and Brorstrom-Lunden, E. (2015). “Atmospheric long range transport of persistent organic pollutants (POPs) into polar regions,” in Persistent organic pollutants (POPs): analytical techniques, environmental fate and biological effect. Editor E. ZENG (Amsterdam, Netherlands: Elsevier).
Karlsson, J., Berggren, M., Ask, J., Byström, P., Jonsson, A., Laudon, H., et al. (2012). Terrestrial organic matter support of lake food webs: evidence from lake metabolism and stable hydrogen isotopes of consumers. Limnol. Oceanogr. 57, 1042–1048. doi:10.4319/lo.2012.57.4.1042
Katsoyiannis, A. (2013). Perfluorinated alkylated substances, brominated flame retardants and chlorinated paraffins in the Norwegian Environment - screening 2013. Oslo, Norway: Norwegian Environment Agency.
Klemetsen, A., Amundsen, P.-A., Dempson, J. B., Jonsson, B., Jonsson, N., O'connell, M. F., et al. (2003). Atlantic salmon Salmo salar L., brown trout Salmo trutta L. and Arctic charr Salvelinus alpinus (L.): a review of aspects of their life histories. Ecol. Freshw. Fish 12, 1–59. doi:10.1034/j.1600-0633.2003.00010.x
Klemetsen, A., Amundsen, P. A., Muladal, H., Rubach, S., and Solbakken, J. I. (1989). Habitat shifts in a dense, resident arctic charr Salvelinus Alpinus population. Physiol. Ecol. Jpn. 1, 187–200.
Krätschmer, K., and Schächtele, A. (2019). Interlaboratory studies on chlorinated paraffins: evaluation of different methods for food matrices. Chemosphere 234, 252–259. doi:10.1016/j.chemosphere.2019.06.022
Krogseth, I. S., Undeman, E., Evenset, A., Christensen, G. N., Whelan, M. J., Breivik, K., et al. (2017a). Elucidating the behavior of cyclic volatile methylsiloxanes in a subarctic freshwater food web: a modeled and measured approach. Environ. Sci. Technol. 51, 12489–12497. doi:10.1021/acs.est.7b03083
Krogseth, I. S., Whelan, M. J., Christensen, G. N., Breivik, K., Evenset, A., and Warner, N. A. (2017b). Understanding of cyclic volatile methyl siloxane fate in a high latitude lake is constrained by uncertainty in organic carbon–water partitioning. Environ. Sci. Technol. 51, 401–409. doi:10.1021/acs.est.6b04828
Kurt-Karakus, P. B., Muir, D. C. G., De Jourdan, B., Teixeira, C., Epp Martindale, J., Embers, H., et al. (2019). Bioaccumulation of selected halogenated organic flame retardants in Lake Ontario. Environ. Toxicol. Chem. 38, 1198–1210. doi:10.1002/etc.4413
Li, F., Shi, R., Wang, Y., He, A., Han, Z., Zheng, X., et al. (2021). The effect of anthropogenic activities on the environmental fate of chlorinated paraffins in surface soil in an urbanized zone of northern China. Environ. Pollut. 288, 117766. doi:10.1016/j.envpol.2021.117766
Markowitz, G. (2018). From industrial toxins to worldwide pollutants: a brief history of polychlorinated biphenyls. Public Health Rep. 133, 721–725. doi:10.1177/0033354918801578
Mc Govern, M., Evenset, A., Borgå, K., De Wit, H. A., Braaten, H. F. V., Hessen, D. O., et al. (2019). Implications of coastal darkening for contaminant transport, bioavailability, and trophic transfer in northern coastal waters. Environ. Sci. Technol. 53, 7180–7182. doi:10.1021/acs.est.9b03093
Miljødirektoratet 2016. Grenseverdier for klassifisering av vann, sediment og biota – revidert 30.10.2020.
Möller, A., Xie, Z., Cai, M., Sturm, R., and Ebinghaus, R. (2012). Brominated flame retardants and dechlorane plus in the marine atmosphere from Southeast Asia toward Antarctica. Environ. Sci. Technol. 46, 3141–3148. doi:10.1021/es300138q
Möller, A., Xie, Z., Sturm, R., and Ebinghaus, R. (2010). Large-scale distribution of dechlorane plus in air and seawater from the Arctic to Antarctica. Environ. Sci. Technol. 44, 8977–8982. doi:10.1021/es103047n
Muir, D., Bennie, D., Teixeira, C., Fisk, A., Tomy, T., Stern, G., et al. (2000). Short chain chlorinated paraffins: are they persistent and bioaccumulative?
Na, G., Yao, Y., Gao, H., Li, R., Ge, L., Titaley, I. A., et al. (2017). Trophic magnification of dechlorane plus in the marine food webs of fildes peninsula in Antarctica. Mar. Pollut. Bull. 117, 456–461. doi:10.1016/j.marpolbul.2017.01.049
Newton, S., Sellstrom, U., and De Wit, C. A. (2015). Emerging flame retardants, PBDEs, and HBCDDs in indoor and outdoor media in Stockholm, Sweden. Environ. Sci. Technol. 49, 2912–2920. doi:10.1021/es505946e
Norwegian Water Resources and Energy Directorate (Nve) (2020). Innsjødatabase. Available at: https://www.nve.no/kart/kartdata/vassdragsdata/innsjodatabase/.
Ontiveros-Cuadras, J. F., Ruiz-Fernández, A. C., Sanchez-Cabeza, J. A., Sericano, J., Pérez-Bernal, L. H., Páez-Osuna, F., et al. (2019). Recent history of persistent organic pollutants (PAHs, PCBs, PBDEs) in sediments from a large tropical lake. J. Hazard Mater 368, 264–273. doi:10.1016/j.jhazmat.2018.11.010
Pellizzato, F., Ricci, M., Held, A., Emons, H., Böhmer, W., Geiss, S., et al. (2009). Laboratory intercomparison study on the analysis of short-chain chlorinated paraffins in an extract of industrial soil. TrAC Trends Anal. Chem. 28, 1029–1035. doi:10.1016/j.trac.2009.05.002
Peng, H., Wan, Y., Zhang, K., Sun, J., and Hu, J. (2014). Trophic transfer of dechloranes in the marine food web of liaodong bay, North China. Environ. Sci. Technol. 48, 5458–5466. doi:10.1021/es500229y
Poste, A. E., Hoel, C. S., Andersen, T., Arts, M. T., Færøvig, P.-J., and Borgå, K. (2019). Terrestrial organic matter increases zooplankton methylmercury accumulation in a brown-water boreal lake. Sci. Total Environ. 674, 9–18. doi:10.1016/j.scitotenv.2019.03.446
Prati, S., Henriksen, E. H., Knudsen, R., and Amundsen, P.-A. (2020). Seasonal dietary shifts enhance parasite transmission to lake salmonids during ice cover. Ecol. Evol. 10, 4031–4043. doi:10.1002/ece3.6173
Prati, S., Henriksen, E. H., Smalås, A., Knudsen, R., Klemetsen, A., Sánchez-Hernández, J., et al. (2021). The effect of inter- and intraspecific competition on individual and population niche widths: a four-decade study on two interacting salmonids. Oikos 130, 1679–1691. doi:10.1111/oik.08375
Qiu, X., Marvin, C. H., and Hites, R. A. (2007). Dechlorane plus and other flame retardants in a sediment core from Lake Ontario. Environ. Sci. Technol. 41, 6014–6019. doi:10.1021/es070810b
Reth, M., Ciric, A., Christensen, G. N., Heimstad, E. S., and Oehme, M. (2006). Short- and medium-chain chlorinated paraffins in biota from the European Arctic -- differences in homologue group patterns. Sci. Total Environ. 367, 252–260. doi:10.1016/j.scitotenv.2005.12.014
Rikardsen, A. H., Amundsen, P.-A., Bjørn, P. A., and Johansen, M. (2000). Comparison of growth, diet and food consumption of sea-run and lake-dwelling Arctic charr. J. Fish Biol. 57, 1172–1188. doi:10.1006/jfbi.2000.1380
Rikardsen, A. H., and Elliott, J. M. (2000). Variations in juvenile growth, energy allocation and life-history strategies of two populations of Arctic charr in North Norway. J. Fish Biol. 56, 328–346. doi:10.1111/j.1095-8649.2000.tb02110.x
Rikardsen, A. H., Svenning, M.-A., and Klemetsen, A. (1997). The relationships between anadromy, sex ratio and parr growth of Arctic charr in a lake in North Norway. J. Fish Biol. 51, 447–461. doi:10.1111/j.1095-8649.1997.tb01503.x
Ruus, A., Bæk, K., Petersen, K., Allan, I., Beylich, B., Schlabach, M., et al. (2019). Environmental contaminants in an urban fjord, 2017. Oslo, Norway: The Norwegian Environment Agency: The Norwegian Environment Agency.
Schlabach, M., Van Bavel, B., Lomba, J. A., Borgen, A., Fjeld, E., Halse, A. K., et al. (2017). Screening programme 2016 - selected compounds with relevance for EU regulation. Oslo, Norway: Norwegian Environment Agency.
Shen, L., Reiner, E. J., Helm, P. A., Marvin, C. H., Hill, B., Zhang, X., et al. (2011a). Historic trends of dechloranes 602, 603, 604, dechlorane plus and other norbornene derivatives and their bioaccumulation potential in Lake Ontario. Environ. Sci. Technol. 45, 3333–3340. doi:10.1021/es104328r
Shen, L., Reiner, E. J., Macpherson, K. A., Kolic, T. M., Helm, P. A., Richman, L. A., et al. (2011b). Dechloranes 602, 603, 604, dechlorane plus, and chlordene plus, a newly detected analogue, in tributary sediments of the laurentian Great lakes. Environ. Sci. Technol. 45, 693–699. doi:10.1021/es1027844
Shen, L., Reiner, E. J., Macpherson, K. A., Kolic, T. M., Sverko, E., Helm, P. A., et al. (2010). Identification and screening analysis of halogenated norbornene flame retardants in the laurentian Great lakes: dechloranes 602, 603, and 604. Environ. Sci. Technol. 44, 760–766. doi:10.1021/es902482b
Simond, A. E., Houde, M., Lesage, V., and Verreault, J. (2017). Temporal trends of PBDEs and emerging flame retardants in belugas from the St. Lawrence Estuary (Canada) and comparisons with minke whales and Canadian Arctic belugas. Environ. Res. 156, 494–504. doi:10.1016/j.envres.2017.03.058
Skogeng, L. P., Lunder Halvorsen, H., Breivik, K., Eckhardt, S., Herzke, D., Moeckel, C., et al. (2023). Spatial distribution of Dechlorane Plus and dechlorane related compounds in European background air. Front. Environ. Sci. 10. doi:10.3389/fenvs.2022.1083011
Sørensen, P., and Larsen, A. K. (2019). Screening survey of hazardous substances in articles. Oslo, Norway: Norwegian Environment Agency.
Sun, R., Luo, X., Tang, B., Chen, L., Liu, Y., and Mai, B. (2017). Bioaccumulation of short chain chlorinated paraffins in a typical freshwater food web contaminated by e-waste in south China: bioaccumulation factors, tissue distribution, and trophic transfer. Environ. Pollut. 222, 165–174. doi:10.1016/j.envpol.2016.12.060
Sverko, E., Tomy, G. T., Marvin, C. H., Zaruk, D., Reiner, E., Helm, P. A., et al. (2008). Dechlorane plus levels in sediment of the lower Great lakes. Environ. Sci. Technol. 42, 361–366. doi:10.1021/es0710104
Sverko, E., Tomy, G. T., Reiner, E. J., Li, Y.-F., Mccarry, B. E., Arnot, J. A., et al. (2011). Dechlorane plus and related compounds in the environment: a review. Environ. Sci. Technol. 45, 5088–5098. doi:10.1021/es2003028
Tomy, G. T., Muir, D. C. G., Stern, G. A., and Westmore, J. B. (2000). Levels of C10−C13 polychloro-n-alkanes in marine mammals from the arctic and the st. Lawrence river estuary. Environ. Sci. Technol. 34, 1615–1619. doi:10.1021/es990976f
Tomy, G. T., Pleskach, K., Ismail, N., Whittle, D. M., Helm, P. A., Sverko, E., et al. (2007). Isomers of dechlorane plus in Lake Winnipeg and Lake Ontario food webs. Environ. Sci. Technol. 41, 2249–2254. doi:10.1021/es062781v
Tomy, G. T., Stern, G. A., Lockhart, W. L., and Muir, D. (1999). Occurrence of C10-C13 polychlorinated n-alkanes in Canadian midlatitude and Arctic lake sediments. Environ. Sci. Technol. 33, 2858–2863. doi:10.1021/es990107q
Tomy, G. T., Thomas, C. R., Zidane, T. M., Murison, K. E., Pleskach, K., Hare, J., et al. (2008). Examination of isomer specific bioaccumulation parameters and potential in vivo hepatic metabolites of syn- and anti-dechlorane plus isomers in juvenile rainbow trout (Oncorhynchus mykiss). Environ. Sci. Technol. 42, 5562–5567. doi:10.1021/es800220y
UNEP (2017). Report of the conference of the parties of the Stockholm convention on persistent organic pollutants on the work of its eighth meeting. Geneva, Switzerland: United Nations.
UNEP (2021). Proposal to list chlorinated paraffins with carbon chain lengths in the range C14-17 and chlorination levels at or exceeding 45 per cent chlorine by weight in Annexes A, B and/or C to the Stockholm Convention on Persistent Organic Pollutants. Persistent Org. Pollut. Rev. Comm.
Van Mourik, L. M., Gaus, C., Leonards, P. E. G., and De Boer, J. (2016). Chlorinated paraffins in the environment: a review on their production, fate, levels and trends between 2010 and 2015. Chemosphere 155, 415–428. doi:10.1016/j.chemosphere.2016.04.037
Van Mourik, L. M., Lava, R., O'brien, J., Leonards, P. E. G., De Boer, J., and Ricci, M. (2020). The underlying challenges that arise when analysing short-chain chlorinated paraffins in environmental matrices. J. Chromatogr. A 1610, 460550. doi:10.1016/j.chroma.2019.460550
Vorkamp, K., Balmer, J., Hung, H., Letcher, R. J., and Rigét, F. F. (2019a). A review of chlorinated paraffin contamination in Arctic ecosystems. Emerg. Contam. 5, 219–231. doi:10.1016/j.emcon.2019.06.001
Vorkamp, K., Bossi, R., Rigét, F. F., Skov, H., Sonne, C., and Dietz, R. (2015). Novel brominated flame retardants and dechlorane plus in Greenland air and biota. Environ. Pollut. 196, 284–291. doi:10.1016/j.envpol.2014.10.007
Vorkamp, K., Rigét, F., Sanderson, H., Bossi, R., Hansen, K. M., and Skov, H. (2019b). POP/PBT characterisation of dechlorane plus and novel brominated flame retardants based on data from Greenland. Scientific Report from DCE – Danish Centre for Environment and Energy No. 339. Denmark; Aarhus: Aarhus University, DCE – Danish Centre for Environment and Energy ©: Aarhus University, Department of Environmental Science.
Vorkamp, K., and Riget, F. F. (2014). A review of new and current-use contaminants in the Arctic environment: evidence of long-range transport and indications of bioaccumulation. Chemosphere 111, 379–395. doi:10.1016/j.chemosphere.2014.04.019
Wang, D., Guo, M.-X., Pei, W., Byer, J. D., and Wang, Z. (2015). Trophic magnification of chlorinated flame retardants and their dechlorinated analogs in a fresh water food web. Chemosphere 118, 293–300. doi:10.1016/j.chemosphere.2014.09.057
Wang, P., Zhang, Q., Zhang, H., Wang, T., Sun, H., Zheng, S., et al. (2016). Sources and environmental behaviors of Dechlorane Plus and related compounds - a review. Environ. Int. 88, 206–220. doi:10.1016/j.envint.2015.12.026
Wang, Q., and Kelly, B. (2017). Occurrence and distribution of halogenated flame retardants in an urban watershed: comparison to polychlorinated biphenyls and organochlorine pesticides. Environ. Pollut. (Barking, Essex 1987) 231, 252–261. doi:10.1016/j.envpol.2017.07.092
Wobbrock, J. O., Findlater, L., Gergle, D., and Higgins, J. J. (2011). “The aligned rank transform for nonparametric factorial analyses using only anova. procedures,” in Proceedings of the SIGCHI Conference on Human Factors in Computing Systems, Vancouver, BC, Canada (Association for Computing Machinery).
Wong, F., De Wit, C. A., and Newton, S. R. (2018). Concentrations and variability of organophosphate esters, halogenated flame retardants, and polybrominated diphenyl ethers in indoor and outdoor air in Stockholm, Sweden. Environ. Pollut. 240, 514–522. doi:10.1016/j.envpol.2018.04.086
Wu, J., Cao, D., Gao, W., Lv, K., Liang, Y., Fu, J., et al. (2019). The atmospheric transport and pattern of Medium chain chlorinated paraffins at Shergyla Mountain on the Tibetan Plateau of China. Environ. Pollut. 245, 46–52. doi:10.1016/j.envpol.2018.10.112
Wu, J.-P., Zhang, Y., Luo, X.-J., Wang, J., Chen, S.-J., Guan, Y.-T., et al. (2010). Isomer-specific bioaccumulation and trophic transfer of dechlorane plus in the freshwater food web from a highly contaminated site, south China. Environ. Sci. Technol. 44, 606–611. doi:10.1021/es902744b
Xian, Q., Siddique, S., Li, T., Feng, Y.-L., Takser, L., and Zhu, J. (2011). Sources and environmental behavior of dechlorane plus — a review. Environ. Int. 37, 1273–1284. doi:10.1016/j.envint.2011.04.016
Xiao, H., Shen, L., Su, Y., Barresi, E., Dejong, M., Hung, H., et al. (2012). Atmospheric concentrations of halogenated flame retardants at two remote locations: the Canadian High Arctic and the Tibetan Plateau. Environ. Pollut. 161, 154–161. doi:10.1016/j.envpol.2011.09.041
Keywords: emerging contaminants, chlorinated paraffins, dechloranes, Lakes, sub-arctic
Citation: Arriola A, Al Saify I, Warner NA, Herzke D, Harju M, Amundsen P-A, Evenset A, Möckel C and Krogseth IS (2024) Dechloranes and chlorinated paraffins in sediments and biota of two subarctic lakes. Front. Toxicol. 6:1298231. doi: 10.3389/ftox.2024.1298231
Received: 21 September 2023; Accepted: 18 April 2024;
Published: 16 May 2024.
Edited by:
Abdul Qadeer, Chinese Research Academy of Environmental Sciences, ChinaReviewed by:
Sisi Liu, South China Normal University, ChinaCopyright © 2024 Arriola, Al Saify, Warner, Herzke, Harju, Amundsen, Evenset, Möckel and Krogseth. This is an open-access article distributed under the terms of the Creative Commons Attribution License (CC BY). The use, distribution or reproduction in other forums is permitted, provided the original author(s) and the copyright owner(s) are credited and that the original publication in this journal is cited, in accordance with accepted academic practice. No use, distribution or reproduction is permitted which does not comply with these terms.
*Correspondence: Aline Arriola, YWFyQGFrdmFwbGFuLm5pdmEubm8=
Disclaimer: All claims expressed in this article are solely those of the authors and do not necessarily represent those of their affiliated organizations, or those of the publisher, the editors and the reviewers. Any product that may be evaluated in this article or claim that may be made by its manufacturer is not guaranteed or endorsed by the publisher.
Research integrity at Frontiers
Learn more about the work of our research integrity team to safeguard the quality of each article we publish.