
94% of researchers rate our articles as excellent or good
Learn more about the work of our research integrity team to safeguard the quality of each article we publish.
Find out more
ORIGINAL RESEARCH article
Front. Therm. Eng., 27 February 2023
Sec. Advancements in Cooling and Heating
Volume 3 - 2023 | https://doi.org/10.3389/fther.2023.1131262
 Anirudh Sharma1†Avesh Avinash Jangam2†Julian Low Yung Shen2Aiman Ahmad2Nageshwar Arepally2Hayden Carlton1
 Robert Ivkov1,3,4*‡Anilchandra Attaluri2‡
Introduction: Magnetic hyperthermia therapy (MHT) is a minimally invasive adjuvant therapy capable of damaging tumors using magnetic nanoparticles exposed radiofrequency alternating magnetic fields. One of the challenges of MHT is thermal dose control and excessive heating in superficial tissues from off target eddy current heating.
Methods: We report the development of a control system to maintain target temperature during MHT with an automatic safety shutoff feature in adherence to FDA Design Control Guidance. A proportional-integral-derivative (PID) control algorithm was designed and implemented in NI LabVIEW®. A standard reference material copper wire was used as the heat source to verify the controller performance in gel phantom experiments. Coupled electromagnetic thermal finite element analysis simulations were used to identify the initial controller gains.
Results: Results showed that the PID controller successfully achieved the target temperature control despite significant perturbations.
Discussion and Conclusion: Feasibility of PID control algorithm to improve efficacy and safety of MHT was demonstrated.
Magnetic hyperthermia therapy (MHT) is a potent cancer therapy that employs heat generated by magnetic nanoparticles (MNPs) embedded within the target tissue when they are exposed to an alternating magnetic field (AMF), at low radiofrequency (RF), typically <300 kHz. In 2010, the European Medicines Agency approved MHT to treat recurrent glioblastoma (GBM) in combination with fractionated radiation therapy (RT). MHT is also being explored as an adjuvant therapy for other solid tumors such as prostate (Johannsen et al., 2007, 2009; Attaluri et al., 2015), pancreas (Maluta et al., 2011; Attaluri et al., 2021; Beola et al., 2021), bone (Matsumine et al., 2011) and liver (Moroz et al., 2002; Sun et al., 2013; Attaluri et al., 2016). To date no clinical trial has been conducted in the United States with automated feedback temperature or thermal dose control for MHT.
MHT requires delivery of MNPs to the tumor and application of AMF to generate local hyperthermia (41°C–46°C) via magnetic hysteresis loss. Heat generated by MNPs can be quantitatively estimated through calorimetric methods and is often expressed as specific loss power (SLP) (Bordelon et al., 2011; Andreu and Natividad, 2013; Dennis and Ivkov, 2013; Dennis et al., 2015; Soetaert et al., 2017). For many MNPs, the SLP exhibits a response that is linear with AMF frequency and non-linear with AMF amplitude (Dennis and Ivkov, 2013; Dennis et al., 2015). This implies that by controlling AMF amplitude at fixed frequency, power deposition and hence temperature within the tumor near the MNPs, can be controlled.
On the other hand, MHT delivery can be challenging because MNP distribution within the tumor is typically variable and heterogeneous, leading to unpredictable temperature variations within the tumor and at tumor margins (Attaluri et al., 2011; Attaluri et al., 2011; LeBrun et al., 2013; Kandala et al., 2018). Heterogeneous MNP distribution within the tumor and the tumor microenvironment (TME) arise from aberrant tumor physiology and physical properties. New approaches are needed to achieve target hyperthermic temperatures within the TME while minimizing locally under-treated and ablative tumor zones, under-treated margins, and inadvertent heating of healthy tissue (Moroz et al., 2002; Kandala et al., 2018; Darvishi et al., 2021; Singh et al., 2021; Tansi et al., 2021).
Computational methods predict improved spatiotemporal control of treatment temperature with AMF amplitude and power modulation (Soetaert et al., 2015, 2020; Kandala et al., 2018; Orrico et al., 2022). Success with these approaches requires real-time temperature monitoring to provide the needed input into a temperature controller device. Among the temperature control methods tested, proportional-integral (PI) or proportional-integral-derivative (PID) control has demonstrated utility in preclinical tests for laser ablation and focused ultrasound hyperthermia (Loulou and Scott, 2002; Hartov et al., 2009; Korganbayev et al., 2020, 2021; Bianchi et al., 2021; Ahmed et al., 2022; Tenorio et al., 2022). However, automated temperature control in clinical hyperthermia systems, particularly for MHT, remains underdeveloped. It is expected that the FDA will classify a feedback temperature controller device for MHT as a significant risk device because it has direct control over energy delivery that has potential to damage tissue. Thus, adherence to FDA’s Design Control Guidance during device design and development is critical to gain regulatory approval for a clinical trial (www.fda.gov) (FDA.gov, 2022). This process facilitates medical device implementation with careful risk management strategies to enable thorough evaluation ensuring safe and reliable performance.
Herein, we document the design process for an experimental PID-controlled automated MHT device that uses fiber-optic temperature data as input to manage power delivered to a custom-designed 20 cm diameter RF coil connected to a 120 kW induction heating power supply. The intended use is treating canine glioblastoma in a future pilot study. We describe here the details of the controller design, its development, and verification of its performance to specified criteria. Device design inputs comprised: (i) AMF power management to achieve user-specified set point temperature quickly; (ii) risk management with user-defined safety temperature thresholds; and, (iii) reliability inputs to manage temperature and controller stability, reproducibility, and robustness. These requirements translated into the following controller device design parameters: (i) rise time (tr) < 1 min and settling time (tss) < 5 min; (ii) initial overshoot (Mp) < 5%, an overriding 0 V signal when safety thresholds are exceeded; and, (iii) choice of PID control for stability and robustness. Temperature thresholds for safety were defined in the controller operation to minimize off-target heating and to prevent tissue ablation. Design input and output definitions, design verification and review conformed to FDA Device Control Guidance for Medical Device Manufacturers (www.fda.gov) (FDA.gov, 2022). Results of trials validating controller performance to its intended end use in a living subject were published elsewhere (Sharma, et al., 2023).
The device was developed in adherence to the US Food and Drug Administration (FDA) Design Control Guidance for Medical Device Manufacturers, Document 21 CFR 820.30 (FDA.gov, 2022). Our approach incorporated the design-review-verification-review-validation approach of design control to assure the device design performs to its intended use. Project team members were divided into two groups, representing a development team and a verification/validation team to provide critical feedback to verify that design outputs met design inputs. Regular formal project meetings were conducted to review design, control design changes, review design results, and discuss potential changes to the device design based on feedback from verification or failure modes and effects analysis (FMEA). Minutes from both device design review meetings and device design change meetings were documented and are incorporated into device design history files for future review by regulatory bodies in anticipation of human clinical product development to ensure device design is correctly translated into production specifications.
The controller design workflow involved defining performance and safety requirements as design inputs, device hardware and software development, verification of controller responses in vitro systems with failure analysis, 3D computational modeling to estimate PID gains, and experimental validation of the feedback control based on computed PID gains (Figure 1A and Supplementary Figure S1).
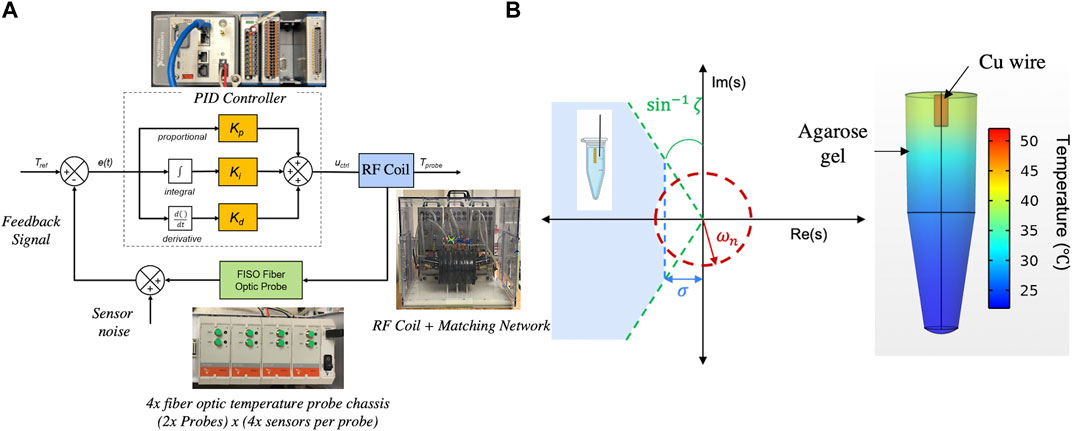
Figure 1. (A) Schematic block diagram of the PID controller depicting the error signal (e(t)) input and control signal (uctrl) generation to minimize the error e(t) using the PID algorithm. Adapted Jangam et al. (2022), with permission from SB3C Foundation, Inc. Reproduced under CC-BY-4.0, Sharma et al (2023). (B) Regions in the s-plane, delineated by transient specifications on controller design, including rise time (ωn, red), overshoot (ζ, green) and settling time (σ, blue). The agarose gel + Cu wire system (inset schematic) must constitute a transfer function with poles in the shaded region to meet design specifications. The 3D temperature color graph indicates the temperature distribution in the sample after 10 min of AMF treatment at 123 Oe (peak), 160 kHz. Reproduced under CC-BY-4.0, Sharma et al (2023).
The design requirements for a temperature feedback controller for MHT include satisfying general hardware and software compatibility, safety requirements, and MHT treatment-specific performance requirements. For the present case, these were:
1) MHT treatment and controller performance criteria:
(a) Capability to maintain temperature at a target set point temperature (Tref) for 15–30 min at a single probe location.
(b) Capability to achieve hyperthermic temperatures (43°C–45°C), and maintain temperature at setpoint (Tref) to attain thermal dose defined by the metric cumulative equivalent minutes at 43°C (CEM43) of 60 ± 5 min within clinically relevant treatment times (15–30 min).
(c) Rise time (tr) to target temperature (Tref) < 60 s.
(d) Overshoot (Mp) = < 5%.
(e) Settling time (tss) within ±0.5°C in <5 min.
2) Safety criteria:
(a) A defined maximum temperature (e.g., 50°C) within the treatment region to limit power to prevent runaway heating at the feedback sensor location.
(b) A safety temperature threshold at a distant location for additional safety monitoring, for example a temperature representing body core temperature.
3) Hardware and software requirements:
(a) Integration with multi-sensor temperature probe to provide temperature readout capability with appropriate sampling interval.
(b) Prevent power fluctuations that might arise from higher-order harmonics generated by the RF power supply that can damage electronics in the 120 kW AMF.
In general, for effective hypothermia treatment (HT), therapeutic heating must be maintained for the duration of treatment, or at least 15–30 min to achieve clinically relevant thermal doses, i.e., CEM43 about 30 to 60 min. An isoeffect thermal dose target of CEM43 greater than 30 min in 90% of the tumor volume i.e., CEM43T90 with HT alone correlates with favorable treatment outcomes for many tumors independent of HT modality, although HT is rarely administered as a single agent therapy (Franckena, M. et al., 2009; Dewey, 2009; Dewhirst, et al., 2003; Maluta, et al., 2011; Rhoon, 2016). In this study, Requirements 1(c)-1(e) were chosen to maximize time at therapeutic temperature CEM43 (Dewey, 2009; Rhoon, 2016). These transient response requirements translated into specifications in the s-domain (Laplace domain) to define the parameter space over which the controller should be stable. The closed-response response for the temperature control process (eventually for MHT) is thus defined by a second-order transfer function (Ebert et al., 2010; Kandala et al., 2018),
which has the poles
ζ, a unitless damping ratio (0 ≤ ζ ≤ 1),
Values representing the poles of the closed-loop transfer function must satisfy these requirements, and therefore must be located in the left-hand side of the s-plane (LHP) as shown in Figure 1B. Full derivation of the second order transfer function is defined by the experimental system, as constrained by the above requirements, and is described in Section 2.5.
To meet requirements 2(a)-(b), a LabVIEW® code (National Instruments, Austin, TX) was developed to include a user-defined safety threshold temperature (Supplementary Figure S1), Tthreshold (°C). If exceeded by the measured temperature at the sensor, T, a 0 V analog signal is sent to the power supply to discontinue heating by reducing current delivered to the AMF coil to 0 A within 0.2 s, until the temperature at the probe satisfied T < Tthreshold. To meet safety requirements at a distant site, additional user-input temperature thresholds were accommodated in the LabVIEW program. The safety temperature probe(s) were connected to a separate FISO TMI4 temperature conditioner (FISO, Quebec, CA) to record the temperature, independent of the controller, as a risk management requirement (in case of feedback sensor damage). Any of these safety probes could be placed by the user (eg. subcutaneous near the skull or rectal temperature) to monitor tissue surface or physiological temperatures, respectively, during a MHT treatment. Finally, the power supply has a manual override emergency stop push-button to immediately discontinue power in case of controller failure or an emergency.
For temperature readout (from the FISO EVO® analog output) and control of the 120 kW AMF, a NI CompactRIO (NI cRIO 9042) (National Instruments, Austin, TX) with the multifunction I/O module (NI9381, with 8 analog inputs and 8 analog outputs) and compatible LabVIEW software interface (National Instruments, Austin, TX) were used. The precision and accuracy of the digitized temperatures measured by the controller were benchmarked against the FISO EVO® SPC-HR reading modules (FISO, Quebec, CA), which were previously calibrated and certified by FISO for meeting QC/QA standards, i.e., S/N ≥ 69 dB. For similar precision and offset <0.3 °C vs. FISO for accuracy, the controller was shielded against RF interference (RFI) and from high frequency noise and DC offsets induced by external electromagnetic interference (EMI) from the RF coil and other external EMI sources. The controller was shielded by enclosing it within a Cu/Ni conductive mesh (Amazon, Seattle, WA), and the entire controller + shield were enclosed in a metallic cabinet (Global Industrial, Port Washington, NY) to shield the system from RFI. Temperature measurements were performed by all four sensors (T1-T4), spaced 2 cm apart)of the FISO EVO probe, in a cylindrical agarose gel sample to measure the increase in temperature from Joule heating at different radial distances from the gel center. All connecting wires were shielded and shielding was electrically grounded to prevent offsets from ground loops.
LabVIEW® controller code was developed to convert measured analog temperatures to digital signals, T(t), that were then used to compute error, e(t), as the difference between user-defined set-point temperature, Tref, and T(t), and then to calculate the new control signal, uctrl(t), using the digital LabVIEW® PID algorithm and user inputs of proportional, integral and derivative gains
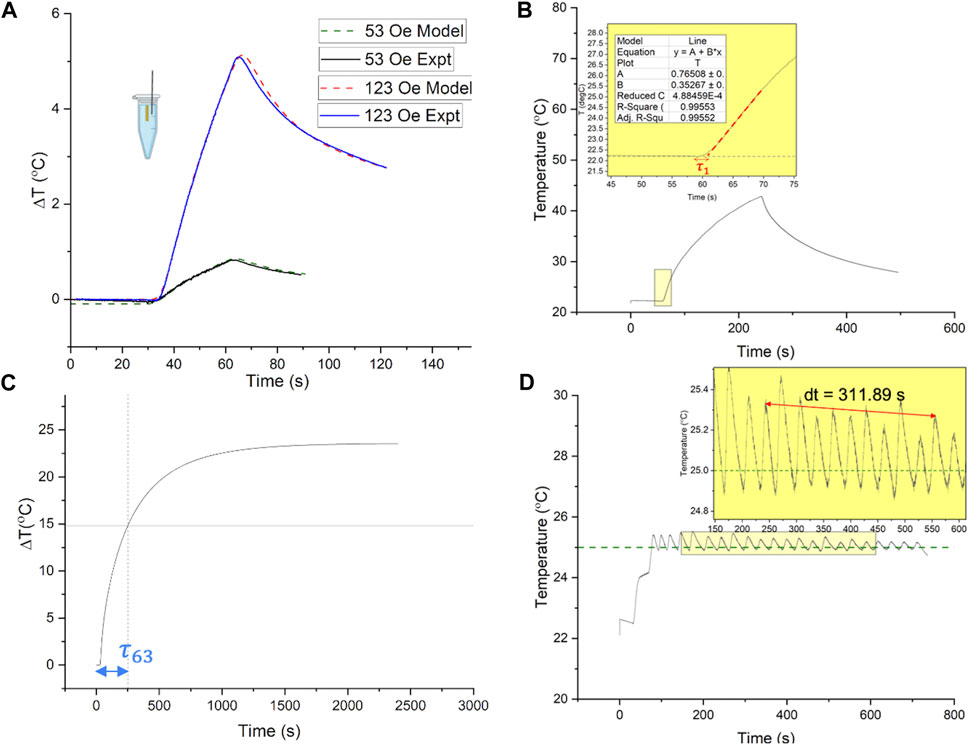
Figure 2. (A) Experimental validation of simulated open loop temperature change vs. time responses in the agarose gel + Cu wire system, to a 30 s AMF pulse. The responses were tested to 30 s AMF pulses of amplitude 4.2 kA/m and 9.8 kA/m peak field (160 kHz), respectively, which define the limits of the AMF field range used in PID control (4.2–9.8 kA/m peak, 160 kHz). Solid lines indicate experimentally measured temperature vs. time curves during heating (AMF ON) and cooling (AMF OFF) at 53 Oe (4.2 kA/m, lower curve) and 123 Oe (9.8 kA/m, upper curve). Dashed lines are obtained from the finite element analysis (FEA) agarose gel + Cu wire model, with the lower dashed curve corresponding to AMF amplitude of 53 Oe (4.2 kA/m) and upper dashed curve corresponding to AMF amplitude of 123 Oe (9.8 kA/m). (B,C) Estimation of heating time constants, from open loop temperature vs. time responses of the agarose gel + Cu wire system, for evaluation of PID gains for feedback control. (D) Closed loop temperature vs. time response of gel + Cu wire system with proportional gain, used to evaluate the undamped natural frequency of the system,
An agarose gel + Cu wire heat source model was prepared for experimental validation by comparison with computational predictions. Briefly, a 1 ml gel model made of 1% agarose powder (Sigma-Aldrich, Burlington, MA) dissolved in 1x phosphate buffered saline (PBS) solution (Corning, Manassas, VA) was prepared in an Eppendorf tube containing a NIST traceable Cu standard wire (ESPI metals) weighing 0.104 g embedded in the center as shown in Figure 1B. PBS based agarose gels have been previously used as tissue mimicking phantoms for various electromagnetic applications. Their physical, electrical and thermal properties are well defined (Baker-Jarvis, J. et al., 2010), and they provide a medium to support the Cu wire heat source.
A Cu wire with known purity, weight and dimensions serves as an excellent standard model for induction heating, as the power deposited for a given AMF having defined frequency and amplitude can be calculated analytically and computationally (Attaluri et al., 2013). Therefore, heat transfer models employing Cu wire as heat sources, exposed to AMF, can be experimentally validated.
The sample holder was a 3D printed polylactic acid (PLA) based platform (Supplementary Figure S2A) that only contacts the Eppendorf tube containing the gel sample at the rim of the tube. The gel sample was otherwise suspended in air with no contact to the sample holder (Supplementary Figures S2B, C). Therefore, heat conduction losses to the sample holder were assumed negligible with the surrounding air assumed to act as an insulator. The temperature probe was placed 1.3 mm from the Cu wire surface.
The agarose gel + Cu wire system was modeled using commercial finite element analysis (FEA) software COMSOL Multiphysics (COMSOL Inc., Burlington, MA) to characterize the open loop temperature vs. time response to a step increase in magnetic field amplitude. Coupled electromagnetic and heat transfer simulations with PID temperature control at the probe location were performed on a model of the gel + Cu wire system using FEA in the following way. The geometry of the Eppendorf tube containing 1% agarose was modeled in a commercial computer aided design software and imported into the FEA software. A cylindrical uniform AMF region, equivalent in dimensions to the 20 cm diameter coil, was designed to enclose the model agarose gel + Cu wire at the center of the model coil. Power deposited in the Cu wire are governed by Maxwell’s electromagnetic wave equations, where the magnetic vector potential, A, is solved in each time step and the electric field intensity and current density are calculated using the following equations:
subject to the initial condition A = 0. J is the current density in A/m,
where T is temperature in K,
Where E is the electric field intensity (V⋅m−1).
The model gel is then subject to the convective cooling boundary condition,
where hconv is the convective heat transfer coefficient in W⋅m−2⋅K−1, and
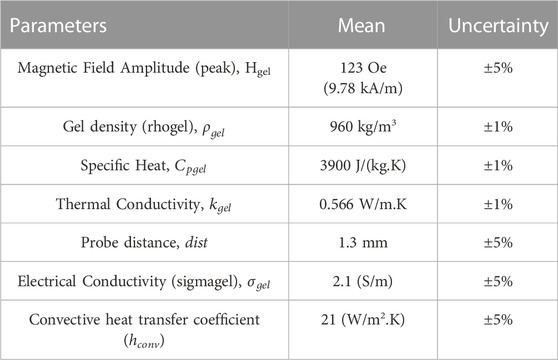
Table 1. Material properties used in FEA simulations for PID temperature feedback control. Data sourced from Sharma et al. (2023).
Sensitivity analysis for the mesh size and time-step discretization was carried out for all models to ensure accurate solutions. For the transient solution, changing the time step from 1 s to 0.5 s had negligible (<1% change) effect on the probe temperature. Increasing the mesh size from 181,133 tetrahedral domain elements to 946, 943 mesh elements resulted in <5% change in the probe temperature but increased the computational time significantly. Therefore, 181,133 tetrahedral domain mesh elements with minimum element size of 4.5 × 10⁻⁴ m were used.
A sensitivity analysis and uncertainty quantification of probe temperature vs. time as a function of various input parameters (applied magnetic field amplitude (Hgel), probe distance from the Cu wire (dist), thermal conductivity (kgel), electrical conductivity of gel (σ), specific heat (Cp), and density (ρgel) was conducted using the uncertainty analysis module in the FEA software. The Morris one-at-a-time (MOAT) (Balesdent et al., 2016) method for qualitative sensitivity screening was used. This sensitivity analysis assigns relative weights, MOAT mean and MOAT standard deviation, to each input parameter based on the variation of the variable of interest, temperature at probe location, to variation in the input parameter, while keeping all other parameters fixed at baseline. A scatter plot of the input parameters, with the MOAT mean as the x-axis and the MOAT standard deviation as y-axis, is generated to compare relative sensitivities.
Sobol and correlation analysis for uncertainty quantification were performed. Uncertainty propagation was evaluated using Monte Carlo simulations on the surrogate model generated by FEA software. The Sobol method quantitates the fractional contribution of each input parameter (and its distribution, e.g., Hgel, dist) to the variance of the probe temperature.
The plant, i.e., the gel + Cu wire system, is defined as a second order transfer function,
where g is the static gain for step input in K⋅V−1, and
The parameters (g,
But for PID control,
Thus,
where
PID gains were calculated for an ideal response assuming a critically damped system with

Table 2. Parameter list used in simulation of PID gains. Data sourced from Sharma et al. (2023).
To simulate the closed-loop performance of the controller in attaining the set point, Tref, for the calculated PID gains, the temperature vs. time responses are simulated for the agarose gel + Cu wire system in FEA software, by designating the probe temperature as the control variable and defining the set point, Tref., as 25°C.
The PID controller can be described by the following equations
where
where Hmax is the upper limit of the AMF (123 Oe peak, 160 kHz). Thus, the time dependent amplitude modulation of the AMF is regulated by the control signal. The AMF amplitude is defined as spatially uniform within the coil geometry. Temperature vs. time responses are simulated for the following (
The goal of treating solid tumors, such as GBM, with MHT is to achieve the minimum effective thermal dose (time at temperature) in a maximum of the tumor volume, while minimizing off-target heating. It is often the case in many clinical scenarios that hyperthermia treatments must be completed within about 30 min. This limit on treatment time, combined with a requirement to achieve hyperthermic temperatures within the tumor that must be maintained for the duration of treatment, places significant performance constraints on both device and operators. Though not often used in cancer therapy devices, automated temperature controllers are an established technology designed to achieve demanding criteria.
The US Food and Drug Administration (FDA) regulates design and development of devices intended for treating cancer in human and veterinary settings. For the design and development of the automated controller described here, we implemented recommendations provided in the FDA Device Control Guidance for Medical Device Manufacturers (www.fda.gov) (FDA.gov, 2022). Here we described results of implementing these in the engineering design of an automated temperature-control MHT device. Full verification and validation in a live canine subject is described elsewhere (Sharma et al., 2023).
For verification testing with gel phantoms, our set point temperature was 25 °C to minimize degradation of the gel phantom. Though this temperature is irrelevant for HT, the objective of these verification trials was to verify PID controller performance to specified criteria. These design constraints included a user-defined set point temperature to be achieved rapidly, with minimum overshoot to prevent hotspots, runaway, and off-target heating; and, the user-defined temperature is to be maintained for a period of time determined by the user.
Figure 1B summarizes the controller transient specifications in the s-plane. The blue shaded region depicts the region in s-space which satisfies these design requirements simultaneously. Design constraints on controller stability mandate that the poles of the transfer function describing the closed-loop system lie on the left-hand side plane of the y-axis (LHP). Figure 1B depicts the simulated temperature distribution in the agarose gel + Cu wire system at 30 min.
Experimental open loop heating and cooling temperature vs. time responses to 30 s AMF pulses of fixed amplitudes (53, 123 Oe at 160 kHz), were obtained within the range used for PID control (53–123 Oe peak) (Figure 2A, solid curves). These experiments were conducted using methods described previously (Attaluri et al., 2013). The experimentally measured temperature difference,
Results of efforts to shield against RF interference are shown in Figure 3. Mechanical shielding of the controller with a Cu/Ni mesh significantly reduced high frequency noise. Digital signal processing performed in LabVIEW using a digital low-pass Butterworth (BW) filter with cutoff frequency of 100 Hz further improved SNR. Controller code was modified to filter <100 Hz, well below the fastest dynamics of the plant to minimize loss of information. Reduction of the effect of sensor noise through tuning the frequency response of the controller ensured that the controller primarily responded to the user-input set-point and any low-frequency plant disturbances only (Figure 3B). The SNR for the temperature signal measured by the controller was comparable to the FISO reference reader (∼69 dB, Figure 3C). The accuracy of the temperature measured by the controller was within 0.3°C of the temperature measured by the FISO reader (Figure 3C dashed lines).
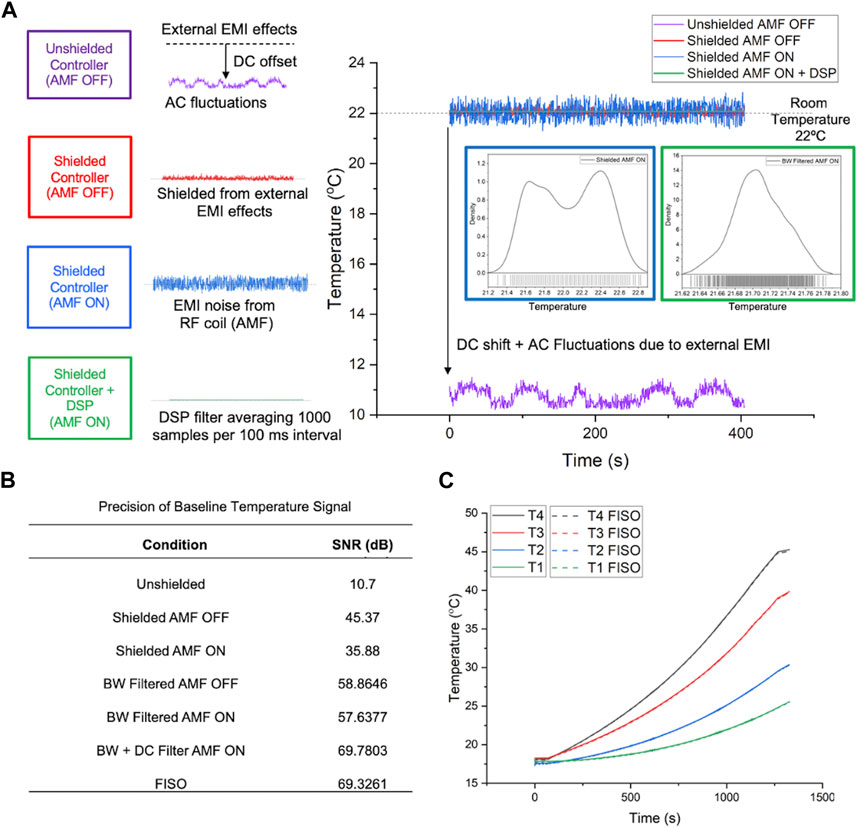
Figure 3. Improvements in precision and accuracy of the digitized probe temperature signal. (A) Improvement in signal SNR through mechanical shielding and application of a digital low pass Butterworth (BW) filter. Inset figures in A and Table B show that the low pass filtering generates a Gaussian signal with an improved SNR. All connecting wires were shielded and shielding was electrically grounded to prevent offsets from ground loops. (B) Summarized signal precision, measured as SNR in dB, following each signal processing step for the digitized temperature signal vs. FISO reference signal. (C) Accuracy of digitized temperature probe signal in the cRIO controller vs. calibrated temperature signal measured by the FISO SPC-HR reading modules, for all four sensors on the FISO EVO probe, over the temperature range of 20°C–45°C. Solid lines represent measurements taken from the cRIO controller and dashed lines show readouts from FISO SPC-HR reference reading modules.
Figure 4A and Table 3 shows the results of MOAT (Balesdent et al., 2016) analysis, a global sensitivity analysis screening method, in a scatter plot summarizing the relative weights of each input based on their relative effects on the temperature at the sensor location. A high value of the MOAT mean (e.g., Hgel) implied that the parameter significantly influenced the temperature. A high value of the MOAT standard deviation implied that the parameter was influential and that it was either strongly interacting with other parameters or that it had a non-linear influence, or both (e.g., Hgel and dist). The temperature at the probe location is a non-linear function of the AMF amplitude and probe distance from the heat source, so a strong dependence of temperature on Hgel and dist was expected and observed. The thermal conductivity of the gel also influences the temperature at the probe location, while the specific heat, density, and electrical conductivity have much less relative influence on the probe temperature. The MOAT plot is replotted in Figure 4C with higher uncertainty (
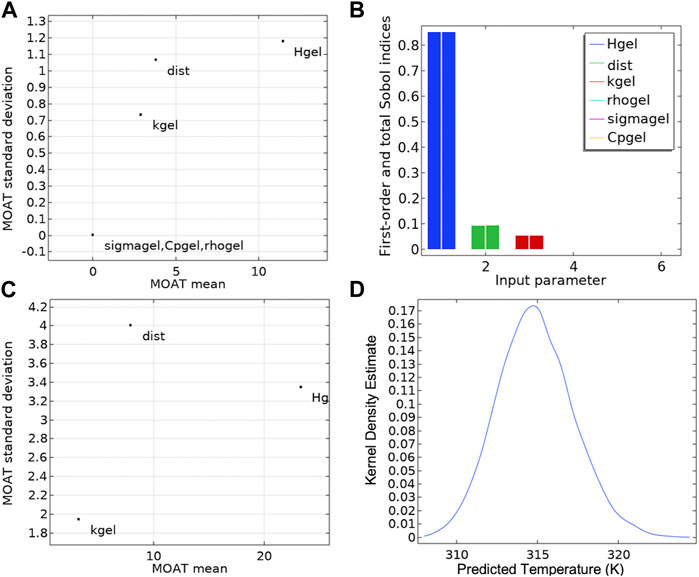
Figure 4. Sensitivity analysis and uncertainty propagation. (A) The Morris one-at-a-time (MOAT) method was applied to each input parameter influencing the probe temperature at steady state (t = 30 min), in the gel + Cu wire experimental setup shown in Figure 1. (B) Sensitivity analysis using the Sobol and correlation methods. The first order Sobol index is depicted as the left bar for each parameter in the histogram plot. The total Sobol index, right bar for each parameter in the histogram plot, shows the variance of the probe temperature attributed to the variance of each input parameters and its interaction with the other input parameters. (C) The MOAT analysis with higher uncertainty (
Table 3. Mesh sensitivity analysis performed on agarose gel + Cu wire system. Data sourced from Sharma et al. (2023).
Figure 4B shows the fractional contribution of each input parameter [Sobol Index (Balesdent et al., 2016)] to the variance of the temperature at the probe location. Sensitivity analysis enabled identification of the set of parameters that most strongly influenced model output. Sobol sensitivity analysis is a global sensitivity analysis method that analyzes and varies all the parameters across their parameter spaces to decompose the model output variance to the relative contributions of individual parameters and their interactions. Sensitivity indices are computed using Monte Carlo methods and this method is excellent for non-linear mathematical models (Sobol, 2001; Zhang, X., et al., 2015).
In our model, the first order Sobol index shows the variance of the probe temperature attributed to each input parameter (Table 4, Table 1) and is depicted as the left bar for each parameter in the histogram plot. Consistent with the MOAT analysis, applied AMF amplitude (Hgel), probe distance from heat source (dist) and thermal conductivity (kgel) were the major contributors to the variance of the probe temperature, with the strongest influence coming from AMF amplitude (85%). The total Sobol index, right bar for each parameter in the histogram plot, shows the variance of the probe temperature attributed to the variance of each input parameter and its interaction with the other input parameters. The difference between the right and left bars for each parameter is a measure of the contribution of the interaction of that parameter with other input parameters, to the total variance of the probe temperature. Contribution to variance of the probe temperature from interactions between parameters was negligible. Sensitivity of temperature at the probe location was greatest with AMF amplitude, confirming our selection of AMF amplitude as the key control variable.
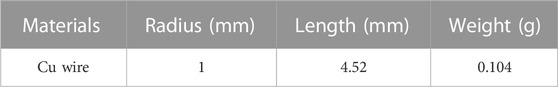
Table 4. Cu wire dimensions used for experimental validation of gel + Cu wire system (Sharma et al., 2023).
Figure 4D shows the Kernel density estimation of the probability distribution function (PDF) of the probe temperature at 1.3 mm from Cu heat source, measured at steady state (t = 30 min). As expected, the PDF exhibits a normal distribution from the uncertainties in input parameters, with a mean temperature change (
To minimize power faults generated by rapid changes in the control signal (dV/dt > 5V/s) and to reduce generation of power system harmonics, a RC circuit with a time constant of 0.2 s (Figure 5) was designed and coupled between the controller output and the analog input terminal of the 120 kW AMF. The PID function was programmed as a lower priority than the safety condition, and therefore, is always over-ridden by the safety sensor condition (AMF ON if T < Tthreshold; AMF OFF if, T > Tthreshold). Figure 5 (bottom right) shows this controller action when the safety threshold temperature was set to 25°C. The controller switched off power when the temperature exceeded 25°C (green dotted line) and resumed power when the temperature dropped below the safety threshold. The repetitive action demonstrated the robustness of the safety feature while the RC circuit prevented power supply faults. In this case, the PID controller was untuned to demonstrate this safety action only. More detailed validation of tuned PID temperature control and safety control in a live subject were demonstrated in Sharma et al., 2023.
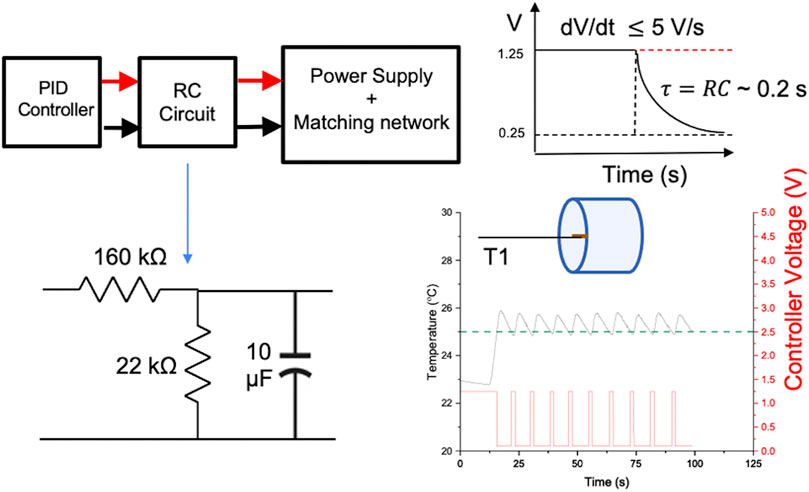
Figure 5. Safety and reliability of the temperature controller. Schematic of RC circuit designed to smooth sharp transitions in voltage. Sharp transitions can induce undesirable power system harmonics that can be damaging to the electronics, or cause power faults. An upper limit to the acceptable rate of change of voltage, dV/dt, was identified as 5 V/s. An RC circuit with a time constant of 0.2 s was sufficient to maintain dV/dt < 5 V/s, for specified upper and lower limits of power supply used for PID control.
The goal of verification experiments described here, and validation experiments described elsewhere (Sharma et al., 2023) was to demonstrate temperature control using the PID controller. For this purpose, any magnetic or metallic material suffices as a heat generator as long as the power deposited with AMF exposure can be calculated or known. NIST traceable Cu wire was chosen as it has defined electrical and thermal properties, and the amount of heat deposited by induction heating can be accurately predicted for a known mass of material and specified AMF conditions (Attaluri, A. et al., 2013). This is impossible for MNPs as no SRM is available for these materials. By way of example for comparison, we demonstrate a calculation based on MNPs in the SM. Experimental demonstration of heating agarose gels with MNPs is also provided in SM (Supplementary Figure S3) showing the heat generated by the Cu wire is relevant for heating with MNPs.
While many studies probe transient characteristics experimentally following controller design (Korganbayev et al., 2020, 2021; Ahmed et al., 2022), in this design we sought to specify target ranges for the transient temperature vs. time characteristics of the controller as design inputs. This was done to exercise greater control of temperature, with a view toward eventual control of the delivered thermal dose, defined using the isoeffect metric CEM43 (Dewey, 2009; Rhoon, 2016), within a defined treatment time (see Supplementary Material S1). The transient characteristics included rise time (tr), settling time (tss) and overshoot (Mp). A short rise time to a hyperthermic set point temperature is desired to optimize time at target temperature in order to achieve the planned thermal dose, i.e., target CEM43. However, power supply faults, causing shutdown, occur if rise time is too short, because high-frequency oscillations of controller voltage (
For many temperature control systems, a slightly underdamped condition (
While the temperature control design parameters were successfully verified here, validation of its performance against intended “end use” criteria was established in a separate series of trials (Sharma et al., 2023). These are briefly summarized here. In vitro closed loop experiments to validate performance of controller temperature response were conducted three times (N = 3, at set point 25°C) with gel phantoms. For ex vivo validation of hyperthermic temperature control using sections of bovine liver, three experiments were conducted for a model of single heat source (N = 3), and distributed heat sources (N = 3). Within each scenario (single or distributed heat source), each of the three experiments tested the controller performance to achieve different set point temperatures, Tref = 44°C, 44.5°C and 45°C, respectively. For in vivo validation, a total of three short duration AMF pulse tests and three longer temperature-control tests were performed in a live canine research subject. Though CEM43 was not a control parameter, it was evaluated at the end of each validation trial summarized above, by using the entire temperature vs. time data from that trial to retrospectively evaluate the potential for therapeutic benefit of the controlled heating against established clinical benchmark. We might consider a potential benefit by including a CEM43 weighting function in the algorithm to ensure HT remains within a user specified CEM43 while staying within specified temperature limits to ensure safety.
Note that modeling and predicting PID gains works well for temperatures for which the temperature-dependent properties of tissue and blood perfusion are documented and reversible, enabling their inclusion in bioheat transfer modelling (Kandala et al., 2021; Uzuka, T. et al., 2009). On the other hand, modeling effects of irreversible changes that occur with other thermal therapies such as tissue ablation is more challenging because such changes may also be difficult to reproduce. In such cases, PID gains predicted by the model would require separate validation and in situ tuning using an adaptive controller that compensates for non-linear and irreversible changes by automatically retuning PID gains or applying a dynamic weighting function to the feedback signal.
We designed, developed, and evaluated a PID controller device for MHT with an intention to enable future treatment of canine GBM. Careful consideration of safety and performance criteria during device design and development enabled us to minimize operational risk. Specifically, our process placed emphasis on the design inputs, design outputs, and verification process as recommended within the FDA’s Design Control Guidance waterfall method to facilitate device evaluation. Our results demonstrated in gel phantom experiments that the device can automatically adjust the AMF amplitude to maintain the temperature within the target range despite significant perturbations. However, for complex clinical scenarios PID gains may require dynamic adjustment by the operator based on an initial pulse test. Future efforts should explore advanced control strategies such as model predictive control (MPC) for multi-input multi-output (MIMO) systems. Clinical translation of such control systems can improve patient safety and quality assurance.
The original contributions presented in the study are included in the article/Supplementary Material, further inquiries can be directed to the corresponding author.
Device design, development, testing: AAA, AS, AJ, ANA, JS, NA, and RI; Device prototyping: AAA, AJ, ANA, and JS. Methodology and validation: AS, ANA, AJ, AAA, JS, and RI; Investigation and Data Curation: AS, AAA, AJ, ANA, and NA; Software: AAA, ANA, AJ, JS, and AS; Formal Analysis: AS, AAA, and RI; Visualization and modeling: AS and AAA; Writing–Original Draft Preparation: AS, AAA, and RI; Device conceptualization: AS, AAA, AJ, ANA, and RI; Resources: RI and AAA; Writing–Review & Editing: AS, AAA, and RI; Supervision, Project Administration and Funding Acquisition, AAA and RI.
The Funding for this project was provided by the National Cancer Institute (1R01CA247290). RI and AAA received additional funding from the National Cancer Institute (1R01 CA257557).
The authors wish to thank Sean Healy for designing and manufacturing (3D printing) the gel sample holder.
RI is an inventor listed on several nanoparticle patents. All patents are assigned to either The Johns Hopkins University or Aduro Biosciences, Inc. RI is a member of the Scientific Advisory Board of Imagion Biosystems. All other authors report no other conflicts of interest.
All claims expressed in this article are solely those of the authors and do not necessarily represent those of their affiliated organizations, or those of the publisher, the editors and the reviewers. Any product that may be evaluated in this article, or claim that may be made by its manufacturer, is not guaranteed or endorsed by the publisher.
The Supplementary Material for this article can be found online at: https://www.frontiersin.org/articles/10.3389/fther.2023.1131262/full#supplementary-material
Ahmed, A., Kim, E., Jeon, S., Kim, J., and Choi, H. (2022). Closed-loop temperature-controlled magnetic hyperthermia therapy with magnetic guidance of superparamagnetic iron-oxide nanoparticles. Adv. Ther. 5, 2100237. doi:10.1002/adtp.202100237
Andreu, I., and Natividad, E. (2013). Accuracy of available methods for quantifying the heat power generation of nanoparticles for magnetic hyperthermia. Int. J. Hyperth. 29 (8), 739–751. doi:10.3109/02656736.2013.826825
Attaluri, A., Kandala, S. K., Wabler, M., Zhou, H., Cornejo, C., Armour, M., et al. (2015). Magnetic nanoparticle hyperthermia enhances radiation therapy: A study in mouse models of human prostate cancer. Int. J. Hyperth. 31 (4), 359–374. doi:10.3109/02656736.2015.1005178
Attaluri, A., Kandala, S. K., Zhou, H., Wabler, M., DeWeese, T. L., and Ivkov, R. (2021). Magnetic nanoparticle hyperthermia for treating locally advanced unresectable and borderline resectable pancreatic cancers: The role of tumor size and eddy-current heating. Int. J. Hyperth. 37 (3), 108–119. doi:10.1080/02656736.2020.1798514
Attaluri, A., Ma, R., Qiu, Y., Li, W., and Zhu, L. (2011). Nanoparticle distribution and temperature elevations in prostatic tumours in mice during magnetic nanoparticle hyperthermia. Int. J. Hyperth. 27 (5), 491–502. doi:10.3109/02656736.2011.584856
Attaluri, A., Nusbaum, C., Wabler, M., and Ivkov, R. (2013). Calibration of a quasi-adiabatic magneto-thermal calorimeter used to characterize magnetic nanoparticle heating. J. Nanotechnol. Eng. Med. 4 (1), 011006. doi:10.1115/1.4024273
Attaluri, A., Seshadri, M., Mirpour, S., Wabler, M., Marinho, T., Furqan, M., et al. (2016). Image-guided thermal therapy with a dual-contrast magnetic nanoparticle formulation: A feasibility study. Int. J. Hyperth. 32 (5), 543–557. doi:10.3109/02656736.2016.1159737
Baker-Jarvis, J., et al. (2010). Characterization of tissue-equivalent materials for high-frequency applications (200 MHz to 20 GHz), technical note (NIST TN). Gaithersburg, MD: National Institute of Standards and Technology (Accessed January 12, 2023).
Balesdent, M., et al. (2016). Estimation of rare event probabilities in complex aerospace and other systems, 109–136. doi:10.1016/b978-0-08-100091-5.00008-3Part Two Pract. Overv. Main Rare Event Estim. Tech.
Beola, L., Grazu, V., Fernandez-Afonso, Y., Fratila, R. M., de las Heras, M., de la Fuente, J. M., et al. (2021). Critical parameters to improve pancreatic cancer treatment using magnetic hyperthermia: Field conditions, immune response, and particle biodistribution. ACS Appl. Mater. Interfaces 13 (11), 12982–12996. doi:10.1021/acsami.1c02338
Bianchi, L., Korganbayev, S., Orrico, A., De Landro, M., and Saccomandi, P. (2021). Quasi-distributed fiber optic sensor-based control system for interstitial laser ablation of tissue: Theoretical and experimental investigations. Biomed. Opt. Express 12 (5), 2841. doi:10.1364/boe.419541
Bordelon, D. E., Cornejo, C., Gruttner, C., Westphal, F., DeWeese, T. L., and Ivkov, R. (2011). Magnetic nanoparticle heating efficiency reveals magneto-structural differences when characterized with wide ranging and high amplitude alternating magnetic fields. J. Appl. Phys. 109 (12), 124904. doi:10.1063/1.3597820
Darvishi, V., Navidbakhsh, M., and Amanpour, S. (2021). Heat and mass transfer in the hyperthermia cancer treatment by magnetic nanoparticles. Heat Mass Transf. 58, 1029–1039. doi:10.1007/s00231-021-03161-3
Dennis, C. L., and Ivkov, R. (2013). Physics of heat generation using magnetic nanoparticles for hyperthermia. Int. J. Hyperth. 29 (8), 715–729. doi:10.3109/02656736.2013.836758
Dennis, C. L., Krycka, K. L., Borchers, J. A., Desautels, R. D., van Lierop, J., Huls, N. F., et al. (2015). Internal magnetic structure of nanoparticles dominates time-dependent relaxation processes in a magnetic field. Adv. Funct. Mater. 25 (27), 4300–4311. doi:10.1002/adfm.201500405
Dewey, W. C. (2009). Arrhenius relationships from the molecule and cell to the clinic. Int. J. Hyperth. 25 (1), 3–20. doi:10.1080/02656730902747919
Dewhirst, M. W., Viglianti, B. L., Lora-Michiels, M., Hanson, M., and Hoopes, P. J. (2003). Basic principles of thermal dosimetry and thermal thresholds for tissue damage from hyperthermia. Int. J. Hyperth. 19 (3), 267–294. doi:10.1080/0265673031000119006
Ebert, J. L., et al. (2010). Model-based temperature control of heated plates,” 2010 18th international Conference on advanced thermal Processing of semiconductors (RTP), 54–60. doi:10.1109/rtp.2010.5623706
FDA.gov (2022). Design control guidance design control guidance for medical device manufacturers. Available at: https://www.fda.gov/regulatory-information/search-fda-guidance-documents/design-control-guidance-medical-device-manufacturers (accessed on Dec 19, 2022).
Franckena, M., Fatehi, D., Bruijne, M. d., Canters, R. A., Norden, Y. v., Mens, J. W., et al. (2009). Hyperthermia dose-effect relationship in 420 patients with cervical cancer treated with combined radiotherapy and hyperthermia. Eur. J. Cancer 45 (11), 1969–1978. doi:10.1016/j.ejca.2009.03.009
Hartov, A., Colacchio, T. A., Strobehn, J. W., Ryan, T. P., and Hoopes, P. J. (2009). Performance of an adaptive MIMO controller for a multiple-element ultrasound hyperthermia system. Int. J. Hyperth. 9 (4), 563–579. doi:10.3109/02656739309005053
Jangam, A., Low, J., Ahmad, A., Sharma, A., Ivkov, R., and Attaluri, A. (2022). “Feedback temperature control for magnetic hyperthermia therapy to treat glioblastoma”, in ASME Summer Biomechanics, Bioengineering and Biotransport Conference, SB3C2022. Cambridge, MD.
Johannsen, M., Gneveckow, U., Eckelt, L., Feussner, A., WaldOFner, N., Scholz, R., et al. (2009). Clinical hyperthermia of prostate cancer using magnetic nanoparticles: Presentation of a new interstitial technique. Int. J. Hyperth. 21 (7), 637–647. doi:10.1080/02656730500158360
Johannsen, M., Gneveckow, U., Thiesen, B., Taymoorian, K., Cho, C. H., Waldofner, N., et al. (2007). Thermotherapy of prostate cancer using magnetic nanoparticles: Feasibility, imaging, and three-dimensional temperature distribution. Eur. Urol. 52 (6), 1653–1662. doi:10.1016/j.eururo.2006.11.023
Kandala, S. K., Liapi, E., Whitcomb, L. L., Attaluri, A., and Ivkov, R. (2018). Temperature-controlled power modulation compensates for heterogeneous nanoparticle distributions: A computational optimization analysis for magnetic hyperthermia. Int. J. Hyperth. 36, 115–129. doi:10.1080/02656736.2018.1538538
Kandala, S. K., Sharma, A., Mirpour, S., Liapi, E., Ivkov, R., and Attaluri, A. (2021). Validation of a coupled electromagnetic and thermal model for estimating temperatures during magnetic nanoparticle hyperthermia. Int. J. Hyperth. 38 (1), 611–622. doi:10.1080/02656736.2021.1913244
Koivo, H. N., Franklin, G. F., and Powell, J. D. (1983). Digital control of dynamic systems. Automatica 19 (4), 457–458. doi:10.1016/0005-1098(83)90065-1
Korganbayev, S., Orrico, A., Bianchi, L., De Landro, M., Wolf, A., Dostovalov, A., et al. (2020). Closed-loop temperature control based on fiber bragg grating sensors for laser ablation of hepatic tissue. Sensors (Basel, Switz. 20 (22), 6496. doi:10.3390/s20226496
Korganbayev, S., Orrico, A., Bianchi, L., Paloschi, D., Wolf, A., Dostovalov, A., et al. (2021). PID controlling approach based on FBG array measurements for laser ablation of pancreatic tissues. IEEE Trans. Instrum. Meas. 70, 1–9. doi:10.1109/tim.2021.3112790
LeBrun, A., Manuchehrabadi, N., Attaluri, A., Wang, F., Ma, R., and Zhu, L. (2013). MicroCT image-generated tumour geometry and SAR distribution for tumour temperature elevation simulations in magnetic nanoparticle hyperthermia. Int. J. Hyperth. 29 (8), 730–738. doi:10.3109/02656736.2013.836757
Loulou, T., and Scott, E. P. (2002). Thermal dose optimization in hyperthermia treatments by using the conjugate gradient method. Numer. Heat. Transf. Part A Appl. 42 (7), 661–683. doi:10.1080/10407780290059756
Maluta, S., Schaffer, M., Pioli, F., Dall’Oglio, S., Pasetto, S., Schaffer, P. M., et al. (2011). Regional hyperthermia combined with chemoradiotherapy in primary or recurrent locally advanced pancreatic cancer. Strahlenther. Onkol. 187 (10), 619–625. doi:10.1007/s00066-011-2226-6
Matsumine, A., Takegami, K., Asanuma, K., Matsubara, T., Nakamura, T., Uchida, A., et al. (2011). A novel hyperthermia treatment for bone metastases using magnetic materials. Int. J. Clin. Oncol. 16 (2), 101–108. doi:10.1007/s10147-011-0217-3
Moroz, P., Pardoe, H., Jones, S. K., Pierre, T. G. S., Song, S., and Gray, B. N. (2002). Arterial embolization hyperthermia: Hepatic iron particle distribution and its potential determination by magnetic resonance imaging. Phys. Med. Biol. 47 (9), 1591–1602. doi:10.1088/0031-9155/47/9/312
Orrico, A., Korganbayev, S., Bianchi, L., De Landro, M., and Saccomandi, P. (2022). Feedback-controlled laser ablation for cancer treatment: Comparison of on-off and PID control strategies<sup/>. Annu. Int. Conf. IEEE Eng. Med. Biol. 2022, 5012–5015. doi:10.1109/embc48229.2022.9871972
Rhoon, G. C. van (2016). Is CEM43 still a relevant thermal dose parameter for hyperthermia treatment monitoring? Int. J. Hyperth. 32 (1), 50–62. doi:10.3109/02656736.2015.1114153
Sharma, A., Jangam, A., Shen, J. L. Y., Ahmad, A., Arepally, N., Rodriguez, B., et al. (2023). Validation of a temperature-feedback controlled automated magnetic hyperthermia therapy device. Cancers 15, 327. doi:10.3390/cancers15020327
Singh, M., Ma, R., and Zhu, L. (2021). Quantitative evaluation of effects of coupled temperature elevation, thermal damage, and enlarged porosity on nanoparticle migration in tumors during magnetic nanoparticle hyperthermia. Int. Commun. Heat Mass Transf. 126, 105393. doi:10.1016/j.icheatmasstransfer.2021.105393
Sobol′, I. M. (2001). Global sensitivity indices for nonlinear mathematical models and their Monte Carlo estimates. Math. Comput. Simulat 55, 271–280. doi:10.1016/s0378-4754(00)00270-6
Soetaert, F., Dupre, L., Ivkov, R., and Crevecoeur, G. (2015). Computational evaluation of amplitude modulation for enhanced magnetic nanoparticle hyperthermia. Biomed. Eng./Biomed. Tech. 60 (5), 491–504. doi:10.1515/bmt-2015-0046
Soetaert, F., Kandala, S. K., Bakuzis, A., and Ivkov, R. (2017). Experimental estimation and analysis of variance of the measured loss power of magnetic nanoparticles. Sci. Rep. 7 (1), 6661. doi:10.1038/s41598-017-07088-w
Soetaert, F., Korangath, P., Serantes, D., Fiering, S., and Ivkov, R. (2020). Cancer therapy with iron oxide nanoparticles: Agents of thermal and immune therapies. Adv. Drug Deliv. Rev. 163–164, 65–83. doi:10.1016/j.addr.2020.06.025
Sun, H., Xu, L., Fan, T., Zhang, H., Wang, X., Zhou, Y., et al. (2013). Targeted hyperthermia after selective embolization with ferromagnetic nanoparticles in a VX2 rabbit liver tumor model. Int. J. Nanomedicine 8 (1), 3795–3804. doi:10.2147/ijn.s50373
Tansi, F. L., Maduabuchi, W. O., Hirsch, M., Southern, P., Hattersley, S., Quaas, R., et al. (2021). Deep-tissue localization of magnetic field hyperthermia using pulse sequencing. Int. J. Hyperth. 38 (1), 743–754. doi:10.1080/02656736.2021.1912412
Tenorio, C., Wattson Sanchez, C. A., and Dumani, D. S. (2022). Tissue damage-tracking control system for image-guided photothermal therapy of cancer. Front. Therm. Eng. 2. doi:10.3389/fther.2022.1005117
Uzuka, T., et al. (2009). Planning of hyperthermic treatment for malignant glioma using computer simulation. Int. J. Hyperth. 17 (2), 114–122. doi:10.1080/02656730010010676
Keywords: magnetic hyperthermia therapy, temperature control, proportional-integral-derivative (PID) control, verification, finite element analysis, safety, FDA-food and drug administration
Citation: Sharma A, Jangam AA, Yung Shen JL, Ahmad A, Arepally N, Carlton H, Ivkov R and Attaluri A (2023) Design of a temperature-feedback controlled automated magnetic hyperthermia therapy device. Front. Therm. Eng. 3:1131262. doi: 10.3389/fther.2023.1131262
Received: 24 December 2022; Accepted: 08 February 2023;
Published: 27 February 2023.
Edited by:
Yuko Ichiyanagi, Yokohama National University, JapanReviewed by:
Marcello Iasiello, Università degli Studi di Napoli Federico II, ItalyCopyright © 2023 Sharma, Jangam, Yung Shen, Ahmad, Arepally, Carlton, Ivkov and Attaluri. This is an open-access article distributed under the terms of the Creative Commons Attribution License (CC BY). The use, distribution or reproduction in other forums is permitted, provided the original author(s) and the copyright owner(s) are credited and that the original publication in this journal is cited, in accordance with accepted academic practice. No use, distribution or reproduction is permitted which does not comply with these terms.
*Correspondence: Robert Ivkov, cml2a292MUBqaG1pLmVkdQ==
†These authors have contributed equally to this work and share first authorship
‡These authors have contributed equally to this work and share senior authorship
Disclaimer: All claims expressed in this article are solely those of the authors and do not necessarily represent those of their affiliated organizations, or those of the publisher, the editors and the reviewers. Any product that may be evaluated in this article or claim that may be made by its manufacturer is not guaranteed or endorsed by the publisher.
Research integrity at Frontiers
Learn more about the work of our research integrity team to safeguard the quality of each article we publish.