 Christian T. Michael
 Sayed Ahmad Almohri
 Jennifer J. Linderman
 Denise E. Kirschner
- 1Department of Microbiology and Immunology, University of Michigan–Michigan Medicine, Ann Arbor, MI, United States
- 2Department of Chemical Engineering, University of Michigan, Ann Arbor, MI, United States
Computational models of disease progression have been constructed for a myriad of pathologies. Typically, the conceptual implementation for pathology-related in silico intervention studies has been ad hoc and similar in design to experimental studies. We introduce a multi-scale interventional design (MID) framework toward two key goals: tracking of disease dynamics from within-body to patient to population scale; and tracking impact(s) of interventions across these same spatial scales. Our MID framework prioritizes investigation of impact on individual patients within virtual pre-clinical trials, instead of replicating the design of experimental studies. We apply a MID framework to develop, organize, and analyze a cohort of virtual patients for the study of tuberculosis (TB) as an example disease. For this study, we use HostSim: our next-generation whole patient-scale computational model of individuals infected with Mycobacterium tuberculosis. HostSim captures infection within lungs by tracking multiple granulomas, together with dynamics occurring with blood and lymph node compartments, the compartments involved during pulmonary TB. We extend HostSim to include a simple drug intervention as an example of our approach and use our MID framework to quantify the impact of treatment at cellular and tissue (granuloma), patient (lungs, lymph nodes and blood), and population scales. Sensitivity analyses allow us to determine which features of virtual patients are the strongest predictors of intervention efficacy across scales. These insights allow us to identify patient-heterogeneous mechanisms that drive outcomes across scales.
1 Introduction
Understanding the effectiveness of intervention measures in the context of patient-to-patient variability is a challenge in both drug and vaccine studies. Diseases such as cancer and infections such as COVID-19 and tuberculosis (TB) show patient variation in both infection outcomes and intervention efficacies. Actionable data–data that may help us determine efficacious interventions as well as understand patient variability–is limited by the frequency of patient visits, the quantity and quality of patient data, monitoring procedures, and resources.
Computational models are an additional approach toward gaining valuable insights into disease and accompanying interventions. Models applied in biomedicine have been used to disentangle the multitude of interconnected components of large complex systems such as cancer, HIV-1/AIDS, influenza and TB. Many modeling studies seek to: i) replicate experimental in vivo, in vitro, or in situ studies by using in silico experiments while maintaining experimental design, such as experimental interventional studies (Aggarwal and Ranganathan, 2019); ii) determine mechanistic impacts of model components and perturbations/treatments/interventions on output, e.g., by using sensitivity analyses; and/or iii) develop model extensions or reductions to determine the relative importance of detailed components (Kirschner et al., 2014).
In order for a model to credibly perform credible in silico experiments requires rigorous validation against available data (Tatka et al., 2023). The precision and rigor required are system-specific and adapted to the expected use of the model’s output (Fogarty et al., 2022), and consequences of incorrect model predictions (Aldieri et al., 2023). Various standards exist to codify model validation (Fogarty et al., 2022; Tatka et al., 2023); including the ten rules for model credibility developed by the Multi-scale Modeling Consortium (Erdemir et al., 2020; Fogarty et al., 2022; Nanda et al., 2023; Tatka et al., 2023) for systems biology approaches, as well as the ASME VandV40 standards (ASME, 2018; Aldieri et al., 2023; Tatka et al., 2023), and NASA standards for models and simulation (NASA, 2016; Tatka et al., 2023). Each of these standards establishes a series of assessments by which we can establish the appropriateness of a model to address a given question of interest relative to the model’s context of use. Here we describe a framework for using a validated computational model, for example, in a virtual clinical trial.
When we design virtual clinical trials from computational models, we find one luxury in that the definition of a “virtual patient” is flexible. For example, if a pharmacokinetic-pharmacodynamic (PK-PD) model is being implemented, then a patient’s pharmacokinetic identity is entirely defined by a set of PK-PD parameters. In many individual-scale computational approaches, every population generated by a model is independent, which reflects the design that motivates experimental interventional studies. However, that same virtual patient can serve in multiple “what-if” scenarios, such as determining effects of model stochasticity or perturbed biological influences or as a negative control (no drug treatment). The experimental analogue to this approach would be tantamount to running different experimental interventions on the same patient under the same conditions and scenarios.
With our ability to select amongst many types of models that can credibly represent the same system, we need a methodology to compare models in an implementation-agnostic way. We have seen a recent push to standardize modeling approaches with modeling ecosystems such as CompuCell3D (Poplawski et al., 2008; Shirinifard et al., 2009), VCell (Blinov et al., 2008; Schaff et al., 2016), PhysiCell (Ghaffarizadeh et al., 2018), as well as standardized language for ODE model implementation such as SBML (Keating et al., 2020), SED-ML (Bergmann et al., 2017; Smith et al., 2021), COMBINE, OMEX (Bergmann et al., 2014; Neal et al., 2020), and others (Tatka et al., 2023). With this variety of platforms, software, computational frameworks, and databases available (computational models, medical digital twins, etc.), it is likely impossible to develop a single computational package to automate analysis or comparison methodologies that account for the myriad of modeling approaches possible without overly constraining their use context. One component common to all models is the representation a real patient by a virtual one (with varying degrees of accuracy and refinement), hence we can create a broadly-applicable methodological framework to perform model-to-model comparisons.
In this work we propose a generally applicable methodological framework, which we refer to as a multi-scale interventional design (MID) framework: a method of developing a cohort of virtual patients that we use to examine impacts of interventions on each virtual patient within a virtual cohort by tracking dynamics across physiological scales, from within-patient, through whole-patient, and up to the population scale (Figure 1A). Using a MID framework requires three key components: i) a cohort of virtual patients, along with a biological justification as to why the same virtual patient is able to be represented in multiple models; ii) a set of two related and validated model versions, such as a control model and an experimental model if representing, for example, a treatment intervention; and iii) an impact quantification method by which the outcomes of both model versions can be meaningfully compared.
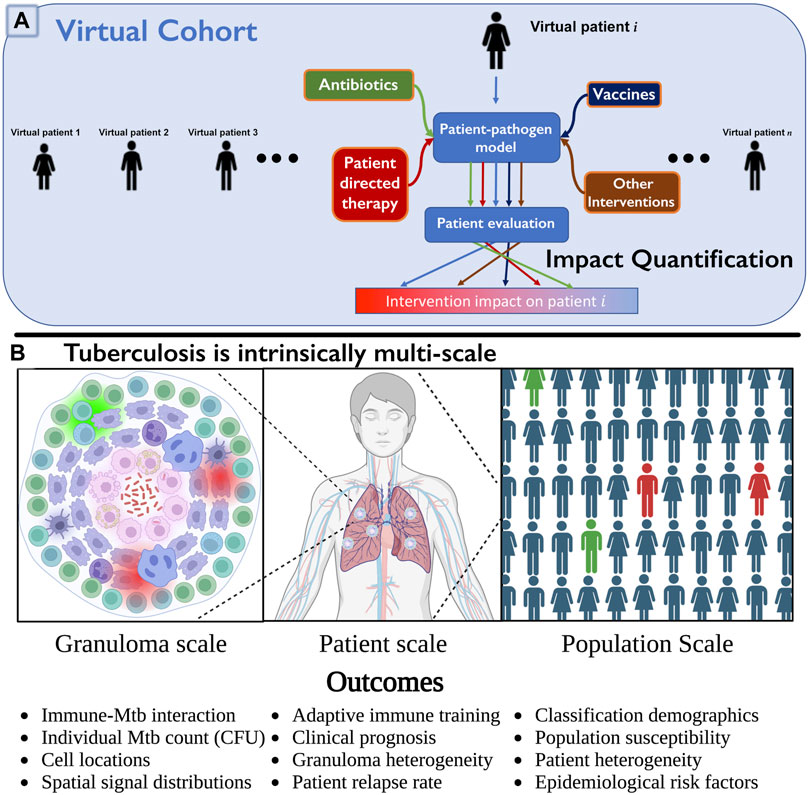
FIGURE 1. (A) Multi-scale intervention design to study over three physiological scales. We include a collection of virtual patients, a virtual cohort, that can each be represented by a control model or represented under various interventions applied (e.g., HostSim and a perturbed version, such as with drugs or vaccines). The virtual patient can be evaluated in each scenario, and impact level quantified by observing differences in specific patient outcomes. This can be quickly repeated for many patients in parallel to determine an overall population-scale impact (cohort effect), or to examine which subpopulations respond to interventions. (B) We illustrate three of the operative scales critical to understand TB. Lung granulomas encompass the complex dynamics of Mycobacterium tuberculosis (Mtb) populations and their interactions with various lymphocyte populations. Clinical classification of the patient (active or latent disease) is determined by multiple granulomas interacting with the patient’s lymphatic system. At the population scale, patients within a cohort vary in their susceptibility to infection and response to treatment, complicating our understanding and prediction of the demographic of clinical classifications. Note: we created Panel (B) using BioRender.com.
Consider TB, a disease caused by an infectious bacterium Mycobacterium tuberculosis (Mtb) that has infected one-fourth of the current world’s population (WHO, 2022). In 2020, TB had a comparable annual death-toll to COVID-19 (WHO, 2020), and concurrent infection with COVID-19 or HIV has increased mortality for TB patients (WHO, 2022). Patients infected with Mtb may eliminate infection, control infection (resulting in latent TB disease) or fail to control infection (resulting in active TB disease), yet the factors determining those outcomes are not fully understood. Note, it is important to distinguish that Mtb are the bacteria that cause infection, whereas tuberculosis (TB) is the disease that results from infection. Data for analysis of Mtb infection progression typically comes from low-resolution measurements in patients (e.g., sputum analysis (Portevin et al., 2014; Guzzetta et al., 2015; Esmail et al., 2016)) or at necropsy when studying non-human primates (NHPs) or other animal models (Barry et al., 2009; Martin et al., 2017; Lin and Flynn, 2018; Wong et al., 2020; Grant et al., 2022). As a result, deriving mechanistic insights to time-evolution of Mtb infections and its interplay with patient heterogeneity across populations is a crucial step in improving our ability to study TB as well as other diseases.
Pulmonary TB, the most common form of the disease, is a highly complex disease with multiple interacting systems determining patient fate (note that we will also refer to patients as hosts as this is common terminology for an infectious disease). There is heterogeneity in lung granulomas, the focal structures of Mtb-host interaction, within individual TB hosts that is critical to prediction of host outcomes (Cadena et al., 2017; Lyadova, 2017; Cicchese et al., 2020). Host-scale dynamics are also heterogeneous and fall into at least three groups that exist on a spectrum: hosts that will clear the infection, control the infection, or fail to control infection and thus suffer active disease (Lin and Flynn, 2018). The dynamics of Mtb infected cohorts are also heterogeneous, e.g., some hosts improve with drug treatment rapidly while others do not. Thus to understand host infection progression and treatment, it is imperative to study TB at multiple scales and decipher how small-scale interactions influence large-scale findings (Figure 1B), making it an ideal candidate to test the MID framework.
To demonstrate our ability to study virtual cohorts using a MID framework, we implemented and tested our framework on multiple versions of HostSim, our next-generation, within-host to whole-host scale computational model of Mtb infection. These versions include a negative control version of HostSim, wherein infection of virtual TB hosts is left untreated, as well as three simple drug intervention versions for comparison. We implemented and tested these drug interventions in our virtual cohort and demonstrated that MID is an effective framework type to yield multi-scale virtual patient insights on complex biological problems that both include and explain patient heterogeneity at each scale.
2 Methods
Creating a MID framework requires three interconnected components: 1) a virtual cohort
2.1 Creating the virtual cohort - a collection of 500 virtual hosts,
In our virtual cohort, each virtual host represents a typical host infected with Mtb with no comorbidities, and our virtual cohort will be generated to well-represent the demographic range of untreated patient outcomes observed in the biological context. We give our virtual hosts as an infection inoculum, 13 founding Mtb and one to five resting macrophages on day 0. Our virtual hosts represent Mtb infection progression in individuals up to 400 days post-infection, tracking granuloma cellular and bacterial composition once per day. In practice, each virtual host (
2.2 TB virtual host model: HostSim as
Briefly, the HostSim model is based on known biology of pulmonary TB. When inhaled, Mtb is phagocytosed by macrophages. These inactive macrophages are unable to fully digest Mtb, which slowly replicates inside of them. Eventually, the macrophage bursts after reaching a carrying capacity of internal Mtb, and the cycle continues. In part due to the slow Mtb replication rate, inflammatory signals and antigen presentation occurs more slowly - and in NHPs, the lymph nodes (LNs) show no metabolic activity until 2–4 weeks post-infection (Coleman et al., 2014; Ganchua et al., 2018; Ganchua et al., 2020). Multiple granulomas form, typically one for each Mtb colony forming unit (CFU) (i.e., an individual Mtb bacterium) that lands within the lung (Martin et al., 2017). Mtb-specific T-cells arrive from LNs to activate macrophages and allow them to destroy intracellular Mtb and induce apoptosis of infected macrophages. These dynamics result in the development of a complex structure called a granuloma that comprises Mtb, live immune cells, and dead tissue (caseum).
HostSim, our untreated virtual host model, is a multi-scale computational model of an individual host that represents both the tissue-scale and whole-host scale response to pulmonary Mtb infection (Joslyn et al., 2022a; Joslyn et al., 2022b). We created a next-generation version of HostSim herein to include additional biological features and better capture Mtb infection immunobiology (see Supplementary Material S1 Section 2 for model updates, and Supplementary Material S2 for a complete model description and list of equations). We represent three physiological compartments in our hybrid computational model HostSim: lungs, LNs, and blood. The lung compartment captures a collection of lung granulomas represented as agents in an agent-based model. Each agent is itself comprised of a system of 22 nonlinear ordinary differential equations (ODEs) describing interactions between macrophages, three subpopulations of Mtb - intracellular, extracellular, and non-replicating; cytokine signals (e.g., IL-4, IL-10, IL-12, and TNF-
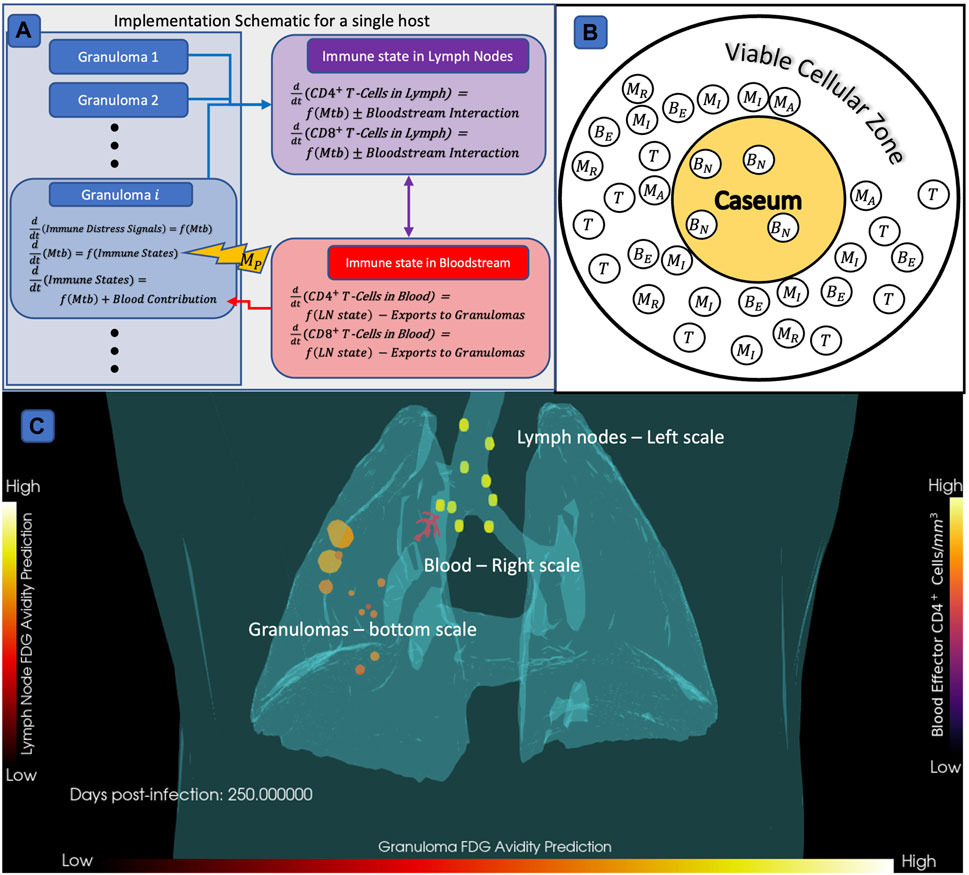
FIGURE 2. Diagram of HostSim model construction,
When running simulations, cytokine signals and antigen presenting cells circulate to a virtual host’s LN compartment, which selectively clones Mtb-specific CD4+ and CD8+ T-cells. We have newly-calibrated parameter ranges to a variety of data from both NHPs (Gideon et al., 2015; Marino et al., 2016; Cadena et al., 2018; Darrah et al., 2019) and our fine-grained model of a single granuloma, GranSim, to capture the heterogeneity both between hosts and between granulomas within a single host (see Section 2.3).
2.3 Calibrating the virtual cohort
We first need to calibrate HostSim in order for it to be a credible
Briefly, CaliPro is a calibration method that incorporates a broad range of model parameters and multiple and varied datasets. Using LHS, we choose a stratified collection of parameter values out of a broad parameter (Marino et al., 2008). CaliPro evaluates the model at each of these parameter values and determines whether the outputs are sufficiently close to the given dataset(s) to be admitted to a “pass set”, i.e., meeting heuristic criteria that suggest that model output is biologically relevant. CaliPro then shrinks the parameter ranges to exclusively capture the pass set while still covering the broadest possible set of parameters. This process is iterated multiple times. After calibration, 90% of granulomas “passed” all tests against calibration criteria, which are described in Supplementary Material S1 Section 2.2. Our calibrated parameter ranges are listed in Supplementary Material S2 Section 5.
2.4 Validation that our virtual cohort hosts capture population demographics for TB
Our goal is to use HostSim simulations to determine, on 3 physiological scales: population-scale, host-scale, and granuloma-scale, which features drive both granuloma and whole host infection outcomes. As such, our virtual cohort should reflect epidemiological contexts for TB (Joslyn et al., 2022b; WHO, 2022), and our use case of HostSim is to generate a collection of virtual hosts whose trajectories agree with distributions of available global data on humans for TB. To do this, we define virtual host classifications in a clinically interpretable way. For studying TB, our classifications are clinically latent, bacteria sterilizing, and active disease. We classify virtual hosts as having active TB if either 1) they have higher total lung CFU than an active-host cutoff of
2.5 Developing intervention models
Our goal is to create a cohort that we can test different model perturbations such as antibiotic treatment, vaccines, or other interventions. To do this, our goal is to build versions of our model that represent a control version
We represent dosing our virtual hosts by modifying the equations governing bacterial growth with the following unitless treatment values
where our control model
2.6 Impact quantification method for our MID framework
The final component of our MID framework is an impact quantification method that directly quantifies and compares the impact of the intervention model versions
In this way, hosts with
2.7 Sensitivity analyses
As an additional form of impact quantification in a MID framework, we can also evaluate the impact of
3 Results
3.1 Constructing a MID framework
If we run thousands of simulations, allowing for patient-to-patient variability and representation of each virtual host with and without interventions, we refer to our collection as a virtual cohort. We introduce our MID framework, our goal for which is to create an easily implementable layer for most computational modeling systems that represent individual patient dynamics. MID is a framework for making meaningful comparisons between the outcomes of individual virtual patients’ outcomes in between a negative control model
To be specific, we require three interconnected components to create our MID framework, and they are: 1) a virtual cohort
Lastly, an impact quantification method should be specified that compares trajectories of individual virtual hosts represented in both the
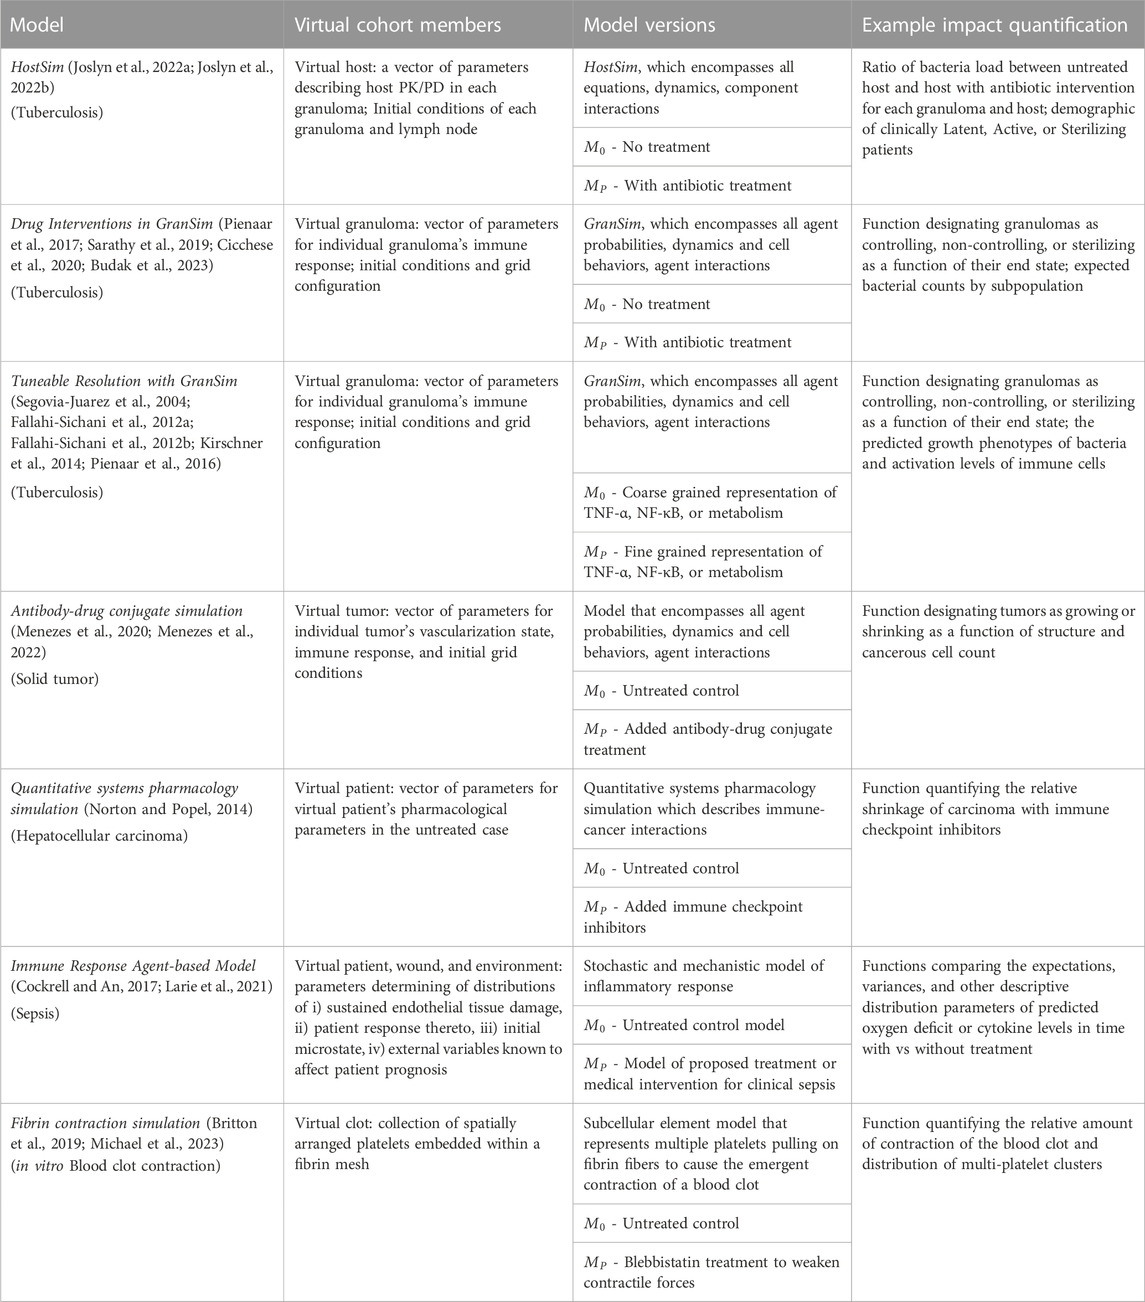
TABLE 1. Examples of potential application of the MID framework to biomedical systems. The virtual patient definition can be flexibly adapted and generalized to a broad set of virtual subjects and intervention types. Note that in all cases,
3.2 HostSim provides
A key step of developing our MID framework study is to declare a control model,
We update our TB simulation HostSim (Joslyn et al., 2022b) and recalibrate it to additional published datasets from NHPs across granuloma, host, and population scales (Gideon et al., 2015; Marino et al., 2016; Cadena et al., 2018; Darrah et al., 2019). We calibrated using our CaliPro procedure (Joslyn et al., 2023), integrating these data by using a population of 500 virtual hosts
We validated our virtual hosts at multiple scales according to the ten simple rules credibility standard (Erdemir et al., 2020; Fogarty et al., 2022; Nanda et al., 2023; Tatka et al., 2023). Figures 3A–E shows trajectories of 6,500 primary granulomas and whole-host CFU counts taken from 500 virtual hosts generated after we calibrated to multiple datasets from different NHP studies. At the population scale, clinically latent hosts had a range of 1–12 primary granulomas that eliminated all bacteria while hosts with active infection had 2–12 sterilized granulomas (Figure 3F). This recapitulates the common thinking that a single high-burden granuloma may determine the state of the Mtb host (i.e., active infection) (Lin et al., 2016). HostSim predicts that a small portion of granulomas are able to clear infection with innate response during early infection, which is presently not feasible to test in vivo. This is a feature of all of our computational and mathematical models of TB and it is believed to be a phenomenon that occurs in humans. On both the granuloma and host scale, we witness the presence of a transient high-CFU peak at approximately day 20, consistent with experimental observations (Gideon et al., 2015; Marino et al., 2016; Cadena et al., 2018; Darrah et al., 2019) (see Supplementary Material S1 Section 2 for details). Our updated HostSim model also is able to examine predictions that would match a PET-CT scan of a primate (human or NHP). We refer to this as FDG avidity, one of the only sources of time-series granuloma-scale data from live hosts and obtained via PET-CT scans (see Supplementary Material S1 Section 3 for details). FDG avidity is a measure of immune cell activity at the infection site within granulomas (Lin et al., 2013; Esmail et al., 2016). Supplementary Videos S1, S2 show the same representative latent virtual host developing granulomas over 400 days post-infection, with coloration based on their predicted FDG avidity values (comparable to NHP PET-CT images in Figure 1A of Ganchua et al. (Ganchua et al., 2018)).
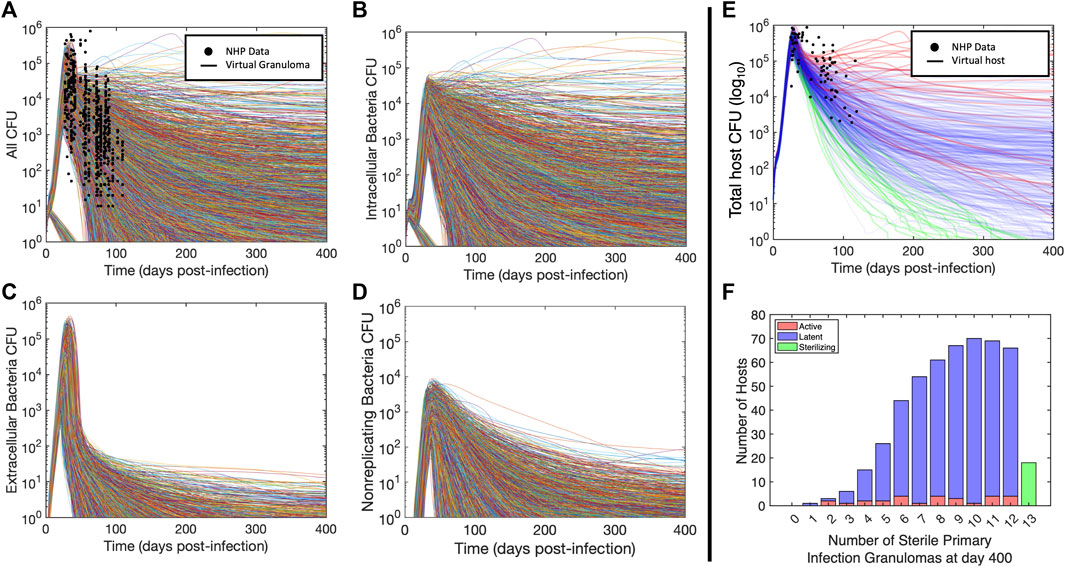
FIGURE 3. Virtual hosts and cohort for Mtb infection using HostSim. (A–D) Bacteria loads (CFU) for the total bacterial population and subpopulation trajectories for each granuloma. Curves showing granuloma CFU over time for each of the 13 primary granulomas in 500 hosts for 400 days post infection. Panel (A) shows total CFU per granuloma as well as the analogous measurements from NHPs at specific points (Gideon et al., 2015; Marino et al., 2016; Cadena et al., 2018; Darrah et al., 2019), (B) shows intracellular bacteria, (C) shows extracellular bacteria, and (D) shows nonreplicating bacteria. (E) Curves showing total lung CFU for each of
3.3 Generating a virtual host
Our goal is to create a cohort of virtual hosts that mechanistically produce the trajectories of bacterial burden in time. We will use this virtual cohort to test interventions - either a treatment intervention, e.g., drugs, vaccines, etc. (or in some cases, a model modification). For an experimental treatment study, a cohort can be defined as both an infection population and an uninfected (negative) control population. Our “healthy” state is represented by steady-state levels of T-cells in the blood and LNs and resting macrophages within lungs (as we currently do not track host toxicity or tolerability in HostSim, we only use the infection model for drug studies). In our MID framework, we use a unique virtual population, our virtual cohort, on which we test our interventions to compare against the same virtual cohort against the untreated treatment control scenario
We represent our virtual hosts, members of our virtual cohort
3.4 Drug interventions using HostSim (
A key aspect of creating a MID framework is to test interventions. For example, given the large drug regimen design space for diseases like TB, where multiple drugs are given for long periods of time, the possible combinations are on the order of 1017 (Cicchese et al., 2017)! The ability to explore the effects of drugs at the tissue, host, and population scales simultaneously in a virtual cohort is necessary to help screen this large space with the goal of identifying candidates that will be the best to test within a human cohort. A key goal of creating a MID framework is to use the impact of an intervention over multiple scales and to examine the wealth of synthetic data by comparing the outcomes of our virtual cohort with and without interventions.
To create an example intervention companion model
We described above how we generate our virtual cohort
3.5 Granuloma and host scale analyses of drug intervention capture mechanistic insights
As the final component of our MID framework, we want to understand how the perturbation or treatment
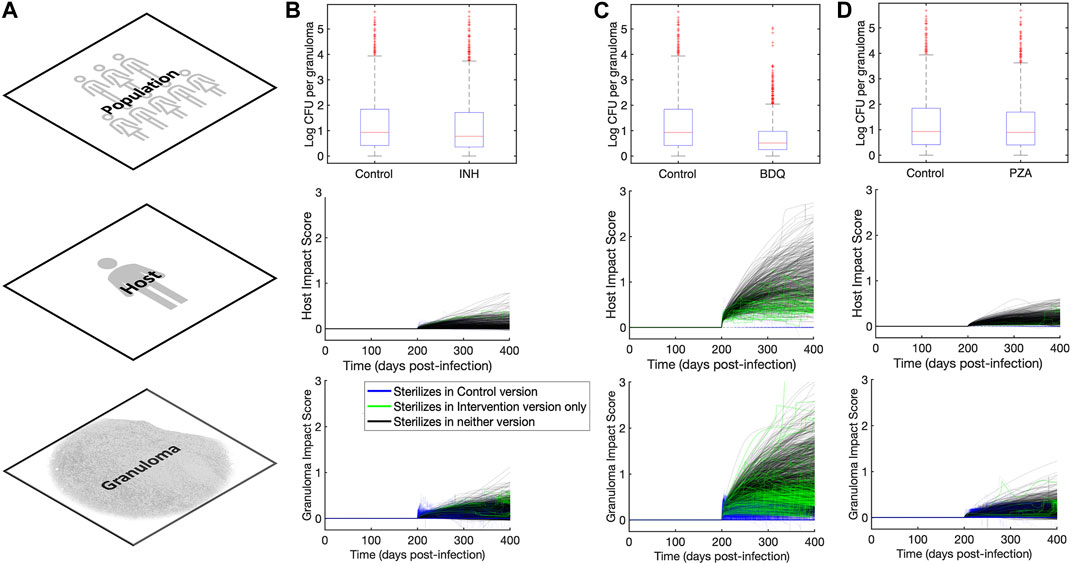
FIGURE 4. Impact quantification of three single-drug-like interventions across granuloma, host, and population scales. (A) Column showing the three scales (across rows) at which we analyze outcomes in our MID framework study. (B–D) Columns showing population, host, and granuloma scale impact quantification scores for (B)
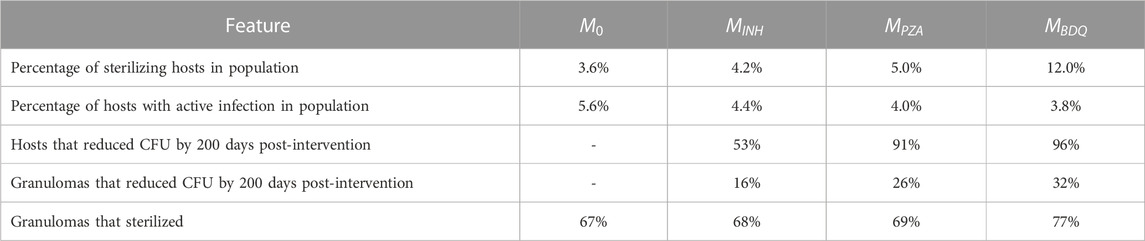
TABLE 2. Impact of interventions of three different drugs on a virtual cohort with 500 hosts across multiple scales.
Another way to explore intervention impact scores is to understand variance of intervention efficacy. We analyzed host and granuloma impact scores as model outputs using a sensitivity analysis that considers non-linear correlations, called partial rank correlation (see Section 2.7). This method correlates non-linear model parameters to outputs of interest, and in this case, we can use both scale impact scores as a readout. The results shown in Table 3 suggest that many host model parameters impact the BDQ-like drug intervention. As BDQ is shown to have the largest possible intervention impact score of the three drugs that we studied (Figure 4; Table 2) as well as the widest variance of impact scores, we found it surprising that BDQ also interacts with the highest numbers of host parameters. It may be that interventions that interact with many model components may both reach higher efficacy but also have a more complex range of host responses. Moreover, we find that parameters that correlate with the impact of drug interventions also overlap with the parameters that impact FDG avidity outputs (i.e., a measure of host immune activity) (Supplementary Material S1 Section 3.2). What this tells us is that expressions FDG avidity, as predicted by expressions [S1-S2], is driven by the same parameters that drive our impact score. This may suggest that FDG avidity is a good predictor of projected intervention efficacy, or that both quantities are affected by the same mechanisms.
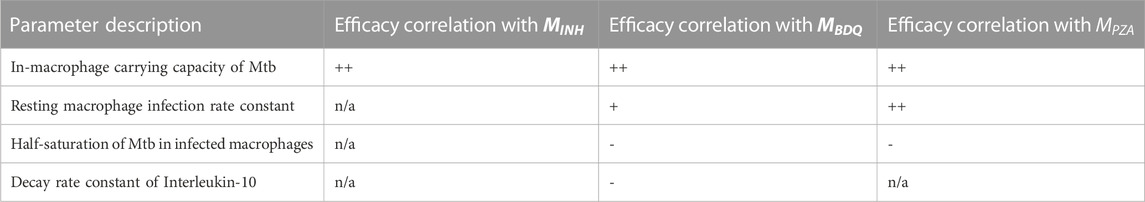
TABLE 3. Descriptions of parameters significantly driving variance in granuloma impact scores for three different treatments. PRCC values remained unchanged qualitatively between days 200 and 400 so, for simplicity, only the trends are shown. We use + to indicate a positive correlation after intervention, and - to indicate a negative correlation, and “n/a" indicates no significant correlation. Trends indicated correspond to PRCC values that were filtered by PCC z-test (Marino et al., 2008) to control for the absolute magnitude of the intervention impact.
4 Discussion
We introduce a model analysis framework that can be used to track a virtual cohort and the impacts of interventions or other model perturbations across multiple physiological scales patient, that we refer to as a MID framework. The three components of a MID framework are i) a cohort of a virtual patients (or virtual hosts) consistent across model versions; ii) validated control and intervention model versions; and iii) an explicitly defined method of impact quantification. A MID framework leverages the ability of models to perform “what-if” experiments on the same virtual patient under different interventions and is able to decompose the spectrum of patient responses to predict system parameters - and thereby also individual model components - as being principally responsible for patient placement within a spectrum.
As part of creating a MID framework, we developed an updated version of our whole-host model of TB, HostSim, which ranges from the cell/tissue scale to the population scale. We calibrated this model to both experimental data from the Flynn lab (Gideon et al., 2015; Marino et al., 2016; Cadena et al., 2018; Darrah et al., 2019), and to synthetic data from our fine-grained model GranSim, which is an agent-based model that represents formation and function of individual granulomas. TB is an ideal candidate for implementation of a MID framework as it is complex and intrinsically multi-scale, which necessarily requires many parameters. Moreover, model outcomes from HostSim (e.g., CFU count and FDG avidity) are directly comparable to existing data and can be used to create and interrogate intuitive impact quantification measures.
We presented an example MID framework implementation to generate examples of quantitative, mechanism-based outcome predictions for interventions that are challenging to obtain experimentally and may be used to forecast outcome heterogeneity for future experiments. We used our TB-focused MID framework to analyze the impact of three different drug interventions–each of which phenomenologically represents a drug commonly used to treat TB–on a virtual cohort of 500 virtual hosts. In doing so, we captured and quantified the impact of different interventions at multiple scales, which is typically inaccessible to an experimental-like research design that usually occurs over a single scale. Our method shows that the parameters - and thereby mechanisms - most correlated with host responsiveness to drugs overlap with the parameters most that correlate with our prediction a non-invasive, spatial measurement of TB infection progression, FDG avidity.
Though we use a MID framework to study virtual human patients in the context of virtual clinical trials, the method is not tied to this application. Given a model system, one may develop intervention model versions for other forms of interventions after you have a suitable control version–e.g., host-directed therapies, vaccines, or booster efficacies. Indeed, there are existing model studies that employ virtual-cohort-like methods of analyses. However, without specific attention paid to each of the three components of a MID framework, ad hoc approaches may face i) an ill-defined notion of a virtual patient (or subject), such that it is difficult to determine whether the “same subject” is being represented in both model versions; ii) non-rectifiable or non-credible model versions, where the control version
Another use of the MID framework may be to examine impacts of model updates, allowing us to demonstrate model consistency. If a model is updated extensively, we could use the original model as
There are other advantages to having a MID framework. First, a calibrated virtual cohort annotated with MID-framework outcomes may be used to store virtual reference cases. That is, for computationally intensive models, it may be useful to store virtual hosts across a heterogeneous virtual cohort along with their control (
Related efforts have been made to create tools that leverage computational models for medical decision supplementation and research (Vodovotz and An, 2019; Foy et al., 2020; Joshi et al., 2020; Wright and Davidson, 2020; Laubenbacher et al., 2022; Venkatapurapu et al., 2022), or for autonomous medical decision-making (Hoffmann et al., 2020; Singh et al., 2022; Yang, 2022) as a form of personalized medicine. A digital twin is a tool that predicts future states within a specific, real, complex biomedical system using a flexible, calibrated multi-scale computational model that integrates available real-time host-specific data. Medical digital twins (MDTs) have been developed to replicate and predict the trajectory of specific patients’ diseases (Wright and Davidson, 2020; Masison et al., 2021; Laubenbacher et al., 2022). With recent demand for standardization of and development of MDT validation, uncertainty analysis, model linkage, and interpretable outcomes (Wright and Davidson, 2020; Laubenbacher et al., 2022), the ability to find digital partners within virtual cohorts created from digital twins and the associated response to treatment would be a powerful decision supplement tool.
It is worth noting the distinction between a MID framework and several related sensitivity analysis tools. Existing sensitivity analyses, including both local and global methods, uncover dependencies between a model’s input variables and outcomes. While these tools (such as PRCC, used in this paper) are extremely valuable, they often include comparison of many parameter values distributed through a range. Often in experiments, intervention methods are defined regimens - a procedure applied to all subjects of the study (e.g., having multiple patients test the same FDA-approved drug dosage). In these cases, it is preferable to have an in-depth look at the impact of a single intervention regimen on an individual, as opposed to sampling a “gradient of intervention magnitude” - e.g., testing with/without drug, as opposed to various dosages. This is also true in the case of MDTs: having more detailed information on the projected impact of two mechanistically distinct interventions on a single patient may be invaluable. Moreover,
Importantly, using a MID framework is not a substitute for rigorous and validated model construction, nor do we wish anybody to consider our MID framework as such. Instead, it is a method to analyze differences between two highly-related, credible, multi-scale models by separating out those components that are patient-specific and those components that are intervention-specific. Each individual model version should be considered as a trial procedure - such as experimental or a placebo group protocol-that is being applied to the same virtual host. Each model version should be able to make credible claims about host outcomes in each intervention scenario; and the MID framework is a systematic method for examining drivers of heterogeneity of the response to those interventions.
In the future, our HostSim-derived virtual cohort may be improved by the use of experimental distributions for each parameter in the model, instead of uniformly sampling from each range. This would ensure that the virtual cohorts in our MID framework capture the demographic of host heterogeneity in more detail. This may grant us more insights both into subtle differences between common presentations of TB at each scale, or it may allow us to predict outlier or unusual host presentations or responses. It is also worth noting that the three steps of creating a MID framework, while conceptually simple, must be considered carefully. Creation of intervention models may be straightforward in some cases, but there should be a limiting case where the control case can be recovered by reducing the intervention’s amplitude. Representing a real-world entity (e.g., in the case of MDTs) in each model version may embed assumptions about that host that could be inconsistent between the model versions if each version’s assumptions are not stated explicitly. Finally, the intervention impact quantification method should be free of biases that might favor one phenotype as more easily impacted than another and should not overreach the context of use of either model version.
Data availability statement
The original contributions presented in the study are included in the article/Supplementary Material, further inquiries can be directed to the corresponding author.
Author contributions
CM: Conceptualization, Data curation, Formal Analysis, Investigation, Methodology, Software, Validation, Visualization, Writing–original draft, Writing–review and editing. SA: Software, Writing–review and editing. JL: Conceptualization, Formal Analysis, Funding acquisition, Methodology, Project administration, Supervision, Validation, Writing–original draft, Writing–review and editing. DK: Conceptualization, Formal Analysis, Funding acquisition, Methodology, Project administration, Resources, Supervision, Validation, Writing–original draft, Writing–review and editing.
Funding
The author(s) declare financial support was received for the research, authorship, and/or publication of this article. This research was supported by NIH grants R01 AI50684 (DK) and U01 HL131072 (DK, JL) and is supported in part by funding from the Wellcome Leap Delta Tissue Program (DK, JL).
Acknowledgments
We would like to thank the lab of JoAnne L. Flynn for the use of her data and provision of the data given in Supplementary Material S1 Section 1; as well as Henry J. Borish for providing us with the updated spatial data for the NHP lung triangulation presented in Figure 2 and our Supplementary Videos. We also thank Paul Wolberg for his support in the construction and maintenance of HostSim.
Conflict of interest
The authors declare that the research was conducted in the absence of any commercial or financial relationships that could be construed as a potential conflict of interest.
Publisher’s note
All claims expressed in this article are solely those of the authors and do not necessarily represent those of their affiliated organizations, or those of the publisher, the editors and the reviewers. Any product that may be evaluated in this article, or claim that may be made by its manufacturer, is not guaranteed or endorsed by the publisher.
Supplementary material
The Supplementary Material for this article can be found online at: https://www.frontiersin.org/articles/10.3389/fsysb.2023.1283341/full#supplementary-material
References
Aggarwal, R., and Ranganathan, P. (2019). Study designs: Part 4 - interventional studies. Perspect. Clin. Res. 10 (3), 137–139. doi:10.4103/picr.PICR_91_19
Aldieri, A., Curreli, C., Szyszko, J. A., La Mattina, A. A., and Viceconti, M. (2023). Credibility assessment of computational models according to ASME V&V40: application to the bologna biomechanical computed tomography solution. Comput. Methods Programs Biomed. 240, 107727. doi:10.1016/j.cmpb.2023.107727
An, G., and Cockrell, C. (2023). Generating synthetic multidimensional molecular time series data for machine learning: considerations. Front. Syst. Biol. 3. doi:10.3389/fsysb.2023.1188009
ASME (2018). Assessing credibility of computational modeling through verification and validation: application to medical devices. New York, NY, USA: ASME.
Barry, C. E., Boshoff, H. I., Dartois, V., Dick, T., Ehrt, S., Flynn, J., et al. (2009). The spectrum of latent tuberculosis: rethinking the biology and intervention strategies. Nat. Rev. Microbiol. 7 (12), 845–855. doi:10.1038/nrmicro2236
Bergmann, F. T., Adams, R., Moodie, S., Cooper, J., Glont, M., Golebiewski, M., et al. (2014). COMBINE archive and OMEX format: one file to share all information to reproduce a modeling project. BMC Bioinforma. 15 (1), 369. doi:10.1186/s12859-014-0369-z
Bergmann, F. T., Nickerson, D., Waltemath, D., and Scharm, M. (2017). SED-ML web tools: generate, modify and export standard-compliant simulation studies. Bioinformatics 33 (8), 1253–1254. doi:10.1093/bioinformatics/btw812
Blinov, M. L., Ruebenacker, O., and Moraru, (2008). Complexity and modularity of intracellular networks: a systematic approach for modelling and simulation. IET Syst. Biol. 2 (5), 363–368. doi:10.1049/iet-syb:20080092
Britton, S., Kim, O., Pancaldi, F., Xu, Z., Litvinov, R. I., Weisel, J. W., et al. (2019). Contribution of nascent cohesive fiber-fiber interactions to the non-linear elasticity of fibrin networks under tensile load. Acta Biomater. 94, 514–523. doi:10.1016/j.actbio.2019.05.068
Budak, M., Cicchese, J. M., Maiello, P., Borish, H. J., White, A. G., Chishti, H. B., et al. (2023). Optimizing tuberculosis treatment efficacy: comparing the standard regimen with Moxifloxacin-containing regimens. PLOS Comput. Biol. 19 (6), e1010823. doi:10.1371/journal.pcbi.1010823
Cacuci, D. G., and Ionescu-Bujor, M. (2004). A comparative review of sensitivity and uncertainty analysis of large-scale systems - II: statistical methods. Nucl. Sci. Eng. 147 (3), 204–217. doi:10.13182/04-54cr
Cadena, A. M., Fortune, S. M., and Flynn, J. L. (2017). Heterogeneity in tuberculosis. Nat. Rev. Immunol. 17 (11), 691–702. doi:10.1038/nri.2017.69
Cadena, A. M., Hopkins, F. F., Maiello, P., Carey, A. F., Wong, E. A., Martin, C. J., et al. (2018). Concurrent infection with Mycobacterium tuberculosis confers robust protection against secondary infection in macaques. PLOS Pathog. 14 (10), e1007305. doi:10.1371/journal.ppat.1007305
Chahine, E. B., Karaoui, L. R., and Mansour, H. (2014). Bedaquiline: a novel diarylquinoline for multidrug-resistant tuberculosis. Ann. Pharmacother. 48 (1), 107–115. doi:10.1177/1060028013504087
Cicchese, J. M., Dartois, V., Kirschner, D. E., and Linderman, J. J. (2020). Both pharmacokinetic variability and granuloma heterogeneity impact the ability of the first-line antibiotics to sterilize tuberculosis granulomas. PLoS Comput. Biol. 11, 333. doi:10.3389/fphar.2020.00333
Cicchese, J. M., Pienaar, E., Kirschner, D. E., and Linderman, J. J. (2017). Applying optimization algorithms to tuberculosis antibiotic treatment regimens. Cell Mol. Bioeng. 10 (6), 523–535. doi:10.1007/s12195-017-0507-6
Cockrell, C., and An, G. (2017). Sepsis reconsidered: identifying novel metrics for behavioral landscape characterization with a high-performance computing implementation of an agent-based model. J. Theor. Biol. 430, 157–168. doi:10.1016/j.jtbi.2017.07.016
Coleman, M. T., Maiello, P., Tomko, J., Frye, L. J., Fillmore, D., Janssen, C., et al. (2014). Early Changes by (18)Fluorodeoxyglucose positron emission tomography coregistered with computed tomography predict outcome after Mycobacterium tuberculosis infection in cynomolgus macaques. Infect. Immun. 82 (6), 2400–2404. doi:10.1128/IAI.01599-13
Darrah, P. A., DiFazio, R. M., Maiello, P., Gideon, H. P., Myers, A. J., Rodgers, M. A., et al. (2019). Boosting BCG with proteins or rAd5 does not enhance protection against tuberculosis in rhesus macaques. NPJ Vaccines 4, 21. doi:10.1038/s41541-019-0113-9
Dhillon, J., Andries, K., Phillips, P. P. J., and Mitchison, D. A. (2010). Bactericidal activity of the diarylquinoline TMC207 against Mycobacterium tuberculosis outside and within cells. Tuberculosis 90 (5), 301–305. doi:10.1016/j.tube.2010.07.004
Erdemir, A., Mulugeta, L., Ku, J. P., Drach, A., Horner, M., Morrison, T. M., et al. (2020). Credible practice of modeling and simulation in healthcare: ten rules from a multidisciplinary perspective. J. Transl. Med. 18 (1), 369. doi:10.1186/s12967-020-02540-4
Esmail, H., Lai, R. P., Lesosky, M., Wilkinson, K. A., Graham, C. M., Coussens, A. K., et al. (2016). Characterization of progressive HIV-associated tuberculosis using 2-deoxy-2-[18F]fluoro-D-glucose positron emission and computed tomography. Nat. Med. 22 (10), 1090–1093. doi:10.1038/nm.4161
Fallahi-Sichani, M., Flynn, J. L., Linderman, J. J., and Kirschner, D. E. (2012a). Differential risk of tuberculosis reactivation among anti-TNF therapies is due to drug binding kinetics and permeability. J. Immunol. 188 (7), 3169–3178. doi:10.4049/jimmunol.1103298
Fallahi-Sichani, M., Kirschner, D. E., and Linderman, J. J. (2012b). NF-κB signaling dynamics play a key role in infection control in tuberculosis. Front. Physiol. 3, 170. doi:10.3389/fphys.2012.00170
Fogarty, L., Ammar, M., Holding, T., Powell, A., and Kandler, A. (2022). Ten simple rules for principled simulation modelling. PLOS Comput. Biol. 18 (3), e1009917. doi:10.1371/journal.pcbi.1009917
Foy, B. H., Gonçalves, B. P., and Higgins, J. M. (2020). Unraveling disease pathophysiology with mathematical modeling. Annu. Rev. Pathology Mech. Dis. 15 (1), 371–394. doi:10.1146/annurev-pathmechdis-012419-032557
Ganchua, S. K. C., Cadena, A. M., Maiello, P., Gideon, H. P., Myers, A. J., Junecko, B. F., et al. (2018). Lymph nodes are sites of prolonged bacterial persistence during Mycobacterium tuberculosis infection in macaques. PLOS Pathog. 14 (11), e1007337. doi:10.1371/journal.ppat.1007337
Ganchua, S. K. C., White, A. G., Klein, E. C., and Flynn, J. L. (2020). Lymph nodes-The neglected battlefield in tuberculosis. PLoS Pathog. 16 (8), e1008632. doi:10.1371/journal.ppat.1008632
Ghaffarizadeh, A., Heiland, R., Friedman, S. H., Mumenthaler, S. M., and PhysiCell, M. P. (2018). PhysiCell: an open source physics-based cell simulator for 3-D multicellular systems. PLOS Comput. Biol. 14 (2), e1005991. doi:10.1371/journal.pcbi.1005991
Gideon, H. P., Phuah, J., Myers, A. J., Bryson, B. D., Rodgers, M. A., Coleman, M. T., et al. (2015). Variability in tuberculosis granuloma T cell responses exists, but a balance of pro- and anti-inflammatory cytokines is associated with sterilization. PLoS Pathog. 11 (1), e1004603. doi:10.1371/journal.ppat.1004603
Grant, N. L., Maiello, P., Klein, E., Lin, P. L., Borish, H. J., Tomko, J., et al. (2022). T cell transcription factor expression evolves over time in granulomas from Mycobacterium tuberculosis-infected cynomolgus macaques. Cell Rep. 39 (7), 110826. doi:10.1016/j.celrep.2022.110826
Guzzetta, G., Ajelli, M., Yang, Z., Mukasa, L. N., Patil, N., Bates, J. H., et al. (2015). Effectiveness of contact investigations for tuberculosis control in Arkansas. J. Theor. Biol. 380, 238–246. doi:10.1016/j.jtbi.2015.05.031
Helton, J. C., and Davis, F. J. (2003). Latin hypercube sampling and the propagation of uncertainty in analyses of complex systems. Reliab Eng. Syst. Safe 81 (1), 23–69. doi:10.1016/s0951-8320(03)00058-9
Hoffmann, K., Cazemier, K., Baldow, C., Schuster, S., Kheifetz, Y., Schirm, S., et al. (2020). Integration of mathematical model predictions into routine workflows to support clinical decision making in haematology. BMC Med. Inf. Decis. Mak. 20 (1), 28. doi:10.1186/s12911-020-1039-x
Jayaram, R., Shandil, R. K., Gaonkar, S., Kaur, P., Suresh, B. L., Mahesh, B. N., et al. (2004). Isoniazid pharmacokinetics-pharmacodynamics in an aerosol infection model of tuberculosis. Antimicrob. Agents Chemother. 48 (8), 2951–2957. doi:10.1128/AAC.48.8.2951-2957.2004
Joshi, A., Wang, D. H., Watterson, S., McClean, P. L., Behera, C. K., Sharp, T., et al. (2020). Opportunities for multiscale computational modelling of serotonergic drug effects in Alzheimer's disease. Neuropharmacology 174, 108118. doi:10.1016/j.neuropharm.2020.108118
Joslyn, L., Kirschner, D., and Linderman, J. (2023). CaliPro: a calibration protocol that utilizes parameter density estimation to explore parameter space and calibrate complex biological models. Cel. Mol. Bioeng. 14, 31–47. doi:10.1007/s12195-020-00650-z
Joslyn, L. R., Flynn, J. L., Kirschner, D. E., and Linderman, J. J. (2022a). Concomitant immunity to M. tuberculosis infection. Sci. Rep. 12 (1), 20731. doi:10.1038/s41598-022-24516-8
Joslyn, L. R., Linderman, J. J., and Kirschner, D. E. (2022b). A virtual host model of Mycobacterium tuberculosis infection identifies early immune events as predictive of infection outcomes. J. Theor. Biol. 539, 111042. doi:10.1016/j.jtbi.2022.111042
Keating, S. M., Waltemath, D., König, M., Zhang, F., Dräger, A., Chaouiya, C., et al. (2020). SBML Level 3: an extensible format for the exchange and reuse of biological models. Mol. Syst. Biol. 16 (8), e9110. doi:10.15252/msb.20199110
Kirschner, D. E., Hunt, C. A., Marino, S., Fallahi-Sichani, M., and Linderman, J. J. (2014). Tuneable resolution as a systems biology approach for multi-scale, multi-compartment computational models. Wiley Interdiscip. Rev. Syst. Biol. Med. 6 (4), 289–309. doi:10.1002/wsbm.1270
Larie, D., An, G., and Cockrell, R. C. (2021). The use of artificial neural networks to forecast the behavior of agent-based models of pathophysiology: an example utilizing an agent-based model of sepsis. Front. Physiology 12, 716434. doi:10.3389/fphys.2021.716434
Laubenbacher, R., Niarakis, A., Helikar, T., An, G., Shapiro, B., Malik-Sheriff, R. S., et al. (2022). Building digital twins of the human immune system: toward a roadmap. npj Digit. Med. 5 (1), 64. doi:10.1038/s41746-022-00610-z
Lin, P. L., Coleman, T., Carney, J. P., Lopresti, B. J., Tomko, J., Fillmore, D., et al. (2013). Radiologic responses in cynomolgus macaques for assessing tuberculosis chemotherapy regimens. Antimicrob. agents Chemother. 57, 4237–4244. doi:10.1128/AAC.00277-13
Lin, P. L., and Flynn, J. L. (2018). The end of the binary era: revisiting the spectrum of tuberculosis. J. Immunol. 201 (9), 2541–2548. doi:10.4049/jimmunol.1800993
Lin, P. L., Maiello, P., Gideon, H. P., Coleman, M. T., Cadena, A. M., Rodgers, M. A., et al. (2016). PET CT identifies reactivation risk in cynomolgus macaques with latent M. tuberculosis. M. tuberculosis. PLoS Pathog. 12 (7), e1005739. doi:10.1371/journal.ppat.1005739
Lyadova, I. V. (2017). Neutrophils in tuberculosis: heterogeneity Shapes the way? Mediat. Inflamm. 2017, 8619307. doi:10.1155/2017/8619307
Marino, S., Gideon, H. P., Gong, C., Mankad, S., McCrone, J. T., Lin, P. L., et al. (2016). Computational and empirical studies predict Mycobacterium tuberculosis-specific T cells as a biomarker for infection outcome. PLoS Comput. Biol. 12 (4), e1004804. doi:10.1371/journal.pcbi.1004804
Marino, S., Hogue, I. B., Ray, C. J., and Kirschner, D. E. (2008). A methodology for performing global uncertainty and sensitivity analysis in systems biology. J. Theor. Biol. 254 (1), 178–196. doi:10.1016/j.jtbi.2008.04.011
Martin, C. J., Cadena, A. M., Leung, V. W., Lin, P. L., Maiello, P., Hicks, N., et al. (2017). Digitally barcoding Mycobacterium tuberculosis reveals in vivo infection dynamics in the macaque model of tuberculosis. MBio 8 (3), e00312-17. doi:10.1128/mBio.00312-17
Masison, J., Beezley, J., Mei, Y., Ribeiro, H., Knapp, A. C., Sordo Vieira, L., et al. (2021). A modular computational framework for medical digital twins. Proc. Natl. Acad. Sci. U. S. A. 118 (20), e2024287118. doi:10.1073/pnas.2024287118
Menezes, B., Cilliers, C., Wessler, T., Thurber, G. M., and Linderman, J. J. (2020). An agent-based systems pharmacology model of the antibody-drug conjugate kadcyla to predict efficacy of different dosing regimens. AAPS J. 22 (2), 29. doi:10.1208/s12248-019-0391-1
Menezes, B., Linderman, J. J., and Thurber, G. M. (2022). Simulating the selection of resistant cells with bystander killing and antibody coadministration in heterogeneous human epidermal growth factor receptor 2-positive tumors. Drug Metab. Dispos. 50 (1), 8–16. doi:10.1124/dmd.121.000503
Michael, C., Pancaldi, F., Britton, S., Kim, O. V., Peshkova, A. D., Vo, K., et al. (2023). Combined computational modeling and experimental study of the biomechanical mechanisms of platelet-driven contraction of fibrin clots. Commun. Biol. 6 (1), 869. doi:10.1038/s42003-023-05240-z
Nahid, P., Dorman, S. E., Alipanah, N., Barry, P. M., Brozek, J. L., Cattamanchi, A., et al. (2016). Executive summary: official American thoracic society/centers for disease control and prevention/infectious diseases society of America clinical practice guidelines: treatment of drug-susceptible tuberculosis. Clin. Infect. Dis. 63 (7), 853–867. doi:10.1093/cid/ciw566
Nanda, P., Budak, M., Michael, C. T., Krupinsky, K., and Kirschner, D. E. (2023). Development and analysis of multiscale models for tuberculosis: from molecules to populations. bioRxiv 11, 2023.11.13.566861. doi:10.1101/2023.11.13.566861
Neal, M. L., Gennari, J. H., Waltemath, D., Nickerson, D. P., and König, M. (2020). Open modeling and exchange (OMEX) metadata specification version 1.0. J. Integr. Bioinforma. 17 (2-3), 20200020. doi:10.1515/jib-2020-0020
Norton, K. A., and Popel, A. S. (2014). An agent-based model of cancer stem cell initiated avascular tumour growth and metastasis: the effect of seeding frequency and location. J. R. Soc. Interface 11 (100), 20140640. doi:10.1098/rsif.2014.0640
Pienaar, E., Matern, W. M., Linderman, J. J., Bader, J. S., and Kirschner, D. E. (2016). Multiscale model of Mycobacterium tuberculosis infection maps metabolite and gene perturbations to granuloma sterilization predictions. Infect. Immun. 84 (5), 1650–1669. doi:10.1128/IAI.01438-15
Pienaar, E., Sarathy, J., Prideaux, B., Dietzold, J., Dartois, V., Kirschner, D. E., et al. (2017). Comparing efficacies of moxifloxacin, levofloxacin and gatifloxacin in tuberculosis granulomas using a multi-scale systems pharmacology approach. PLoS Comput. Biol. 13 (8), e1005650. doi:10.1371/journal.pcbi.1005650
Poplawski, N. J., Shirinifard, A., Swat, M., and Glazier, J. A. (2008). Simulation of single-species bacterial-biofilm growth using the Glazier-Graner-Hogeweg model and the CompuCell3D modeling environment. Math. Biosci. Eng. 5 (2), 355–388. doi:10.3934/mbe.2008.5.355
Portevin, D., Moukambi, F., Clowes, P., Bauer, A., Chachage, M., Ntinginya, N. E., et al. (2014). Assessment of the novel T-cell activation marker-tuberculosis assay for diagnosis of active tuberculosis in children: a prospective proof-of-concept study. Lancet Infect. Dis. 14 (10), 931–938. doi:10.1016/S1473-3099(14)70884-9
Prideaux, B., Via, L. E., Zimmerman, M. D., Eum, S., Sarathy, J., O'Brien, P., et al. (2015). The association between sterilizing activity and drug distribution into tuberculosis lesions. Nat. Med. 21 (10), 1223–1227. doi:10.1038/nm.3937
Renardy, M., Joslyn, L. R., Millar, J. A., and Kirschner, D. E. (2021). To Sobol or not to Sobol? The effects of sampling schemes in systems biology applications. Math. Biosci. 337, 108593. doi:10.1016/j.mbs.2021.108593
Renardy, M., Wessler, T., Blemker, S., Linderman, J., Peirce, S., and Kirschner, D. (2019). Data-driven model validation across dimensions. Bull. Math. Biol. 81 (6), 1853–1866. doi:10.1007/s11538-019-00590-4
Sarathy, J., Blanc, L., Alvarez-Cabrera, N., O'Brien, P., Dias-Freedman, I., Mina, M., et al. (2019). Fluoroquinolone efficacy against tuberculosis is driven by penetration into lesions and activity against resident bacterial populations. Antimicrob. Agents Chemother. 63 (5), e02516-18. doi:10.1128/AAC.02516-18
Sarathy, J. P., Via, L. E., Weiner, D., Blanc, L., Boshoff, H., Eugenin, E. A., et al. (2018). Extreme drug tolerance of Mycobacterium tuberculosis in caseum. Antimicrob. Agents Chemother. 62 (2), e02266-17. doi:10.1128/AAC.02266-17
Sarathy, J. P., Zuccotto, F., Hsinpin, H., Sandberg, L., Via, L. E., Marriner, G. A., et al. (2016). Prediction of drug penetration in tuberculosis lesions. ACS Infect. Dis. 2 (8), 552–563. doi:10.1021/acsinfecdis.6b00051
Schaff, J. C., Vasilescu, D., Moraru, , Loew, L. M., and Blinov, M. L. (2016). Rule-based modeling with virtual cell. Bioinformatics 32 (18), 2880–2882. doi:10.1093/bioinformatics/btw353
Segovia-Juarez, J. L., Ganguli, S., and Kirschner, D. (2004). Identifying control mechanisms of granuloma formation during M. tuberculosis infection using an agent-based model. J. Theor. Biol. 231 (3), 357–376. doi:10.1016/j.jtbi.2004.06.031
Shirinifard, A., Gens, J. S., Zaitlen, B. L., Poplawski, N. J., Swat, M., and Glazier, J. A. (2009). 3D multi-cell simulation of tumor growth and angiogenesis. PLoS One 4 (10), e7190. doi:10.1371/journal.pone.0007190
Singh, D., Nagaraj, S., Mashouri, P., Drysdale, E., Fischer, J., Goldenberg, A., et al. (2022). Assessment of machine learning–based medical directives to expedite care in pediatric emergency medicine. JAMA Netw. Open 5 (3), e222599. doi:10.1001/jamanetworkopen.2022.2599
Smith, L. P., Bergmann, F. T., Garny, A., Helikar, T., Karr, J., Nickerson, D., et al. (2021). The simulation experiment description markup language (SED-ML): language specification for level 1 version 4. J. Integr. Bioinforma. 18 (3), . doi:10.1515/jib-2021-0021
Tatka, L. T., Smith, L. P., Hellerstein, J. L., and Sauro, H. M. (2023). Adapting modeling and simulation credibility standards to computational systems biology. J. Transl. Med. 21 (1), 501. doi:10.1186/s12967-023-04290-5
Venkatapurapu, S. P., Iwakiri, R., Udagawa, E., Patidar, N., Qi, Z., Takayama, R., et al. (2022). A computational platform integrating a mechanistic model of crohn’s disease for predicting temporal progression of mucosal damage and healing. Adv. Ther. 39 (7), 3225–3247. doi:10.1007/s12325-022-02144-y
Vodovotz, Y., and An, G. (2019). Agent-based models of inflammation in translational systems biology: a decade later. WIREs Syst. Biol. Med. 11 (6), e1460. doi:10.1002/wsbm.1460
Warsinske, H. C., Pienaar, E., Linderman, J. J., Mattila, J. T., and Kirschner, D. E. (2017). Deletion of TGF-β1 increases bacterial clearance by cytotoxic T cells in a tuberculosis granuloma model. Front. Immunol. 8, 1843. doi:10.3389/fimmu.2017.01843
Wong, E. A., Evans, S., Kraus, C. R., Engelman, K. D., Maiello, P., Flores, W. J., et al. (2020). IL-10 impairs local immune response in lung granulomas and lymph nodes during early Mycobacterium tuberculosis infection. Mycobacterium Tuberc. Infect. 204 (3), 644–659. doi:10.4049/jimmunol.1901211
Wright, L., and Davidson, S. (2020). How to tell the difference between a model and a digital twin. Adv. Model. Simul. Eng. Sci. 7 (1), 13. doi:10.1186/s40323-020-00147-4
Yang, C. C. (2022). Explainable artificial intelligence for predictive modeling in healthcare. J. Healthc. Inf. Res. 6 (2), 228–239. doi:10.1007/s41666-022-00114-1
Keywords: model study design, digital partners, disease modeling, tuberculosis, computational biology, pharmacokinetic-pharmacodynamic model, sensitivity analysis, agent-based model
Citation: Michael CT, Almohri SA, Linderman JJ and Kirschner DE (2024) A framework for multi-scale intervention modeling: virtual cohorts, virtual clinical trials, and model-to-model comparisons. Front. Syst. Biol. 3:1283341. doi: 10.3389/fsysb.2023.1283341
Received: 15 September 2023; Accepted: 14 December 2023;
Published: 22 January 2024.
Edited by:
Gary An, University of Vermont, United StatesReviewed by:
R. Chase Cockrell, University of Vermont, United StatesGiulia Russo, University of Catania, Italy
Copyright © 2024 Michael, Almohri, Linderman and Kirschner. This is an open-access article distributed under the terms of the Creative Commons Attribution License (CC BY). The use, distribution or reproduction in other forums is permitted, provided the original author(s) and the copyright owner(s) are credited and that the original publication in this journal is cited, in accordance with accepted academic practice. No use, distribution or reproduction is permitted which does not comply with these terms.
*Correspondence: Denise E. Kirschner, a2lyc2NobmVAdW1pY2guZWR1; Jennifer J. Linderman, bGluZGVybWFAdW1pY2guZWR1