 Angelo Lucia
 Korkut Uygun
- 1Department of Chemical Engineering, University of Rhode Island, Kingston, RI, United States
- 2Center for Engineering in Medicine and Surgery, Harvard School of Medicine, Shriners Children’s, Massachusetts General Hospital, Boston, MA, United States
The current clinical standard of Static Cold Storage (SCS) which involves preservation on ice (about +4°C) in a hypoxic state limits storage to a few hours for metabolically active tissues such as the liver and the heart. This period of hypoxia during can generate superoxide and other free radicals from purine metabolism, a well-established component of ischemia/reperfusion injury (IRI). Machine perfusion is at the cutting edge of organ preservation, which provides a functional, oxygenated preservation modality that can avoid/attenuate IRI. In clinical application, perfusion usually follows a period of SCS. This presentation of oxygen following hypoxia can lead to superoxide and hydrogen peroxide generation, but machine perfusion also allows manipulation of the temperature profiles and supply of antioxidant treatments, which could be used to minimize such issues. However, metabolomic data is difficult to gather, and there are currently no mathematical models present to allow rational design of experiments or guide clinical practice. In this article, the effects of a gradual warming temperature policy and glutathione supplementation to minimize oxidative stress are studied. An optimal gradual warming temperature policy for mid-thermic machine perfusion of a liver metabolic model is determined using a combination of Nash Equilibrium and Monte Carlo optimization. Using this optimal gradual warming temperature policy, minimum GSH requirements to maintain hydrogen peroxide concentrations in the normal region are calculated using a different Monte Carlo optimization methodology. In addition, the dynamic behavior of key metabolites and cofactors are determined. Results show that the minimum GSH requirement increases and that the ratio of GSH/GSSG decreases with increasing hydrogen peroxide concentration. In addition, at high concentrations of hydrogen peroxide it is shown that cytochrome C undergoes dysfunction leading to a decrease in useful oxygen consumption and ATP synthesis from the electron transport chain and an overall reduction in the energy charge for the liver cells.
1 Introduction
The current clinical standard of Static Cold Storage (SCS) which involves preservation on ice (about +4°C) in a hypoxic state limits storage to a few hours for metabolically active tissues such as the liver and the heart. This rather restrictive limit creates major logistical constraints that compound donor organ shortage and presents a major obstacle to on-demand tissue availability and global organ sharing. Given SCS by definition involves creating hypoxia for the organ, the field is pushing ex situ Machine Perfusion (MP) as a functional preservation method, providing oxygen and nutrients in the duration the organ is outside a body. While clinical successes are extremely promising and demonstrate MP as superior to SCS, there is a limited understanding about the metabolic processes underlying the improvement. In particular the organ recovery process invariably involves some amount of cold ischemia for the organs prior to initiation of MP, which makes it likely that the grafts experience some level of ischemia/reperfusion injury (IRI). There is very limited data on the metabolic trajectory an organ follows during this critical period, and moreover many metabolic processes occur very quickly, in the order of minutes, which make it problematic if not impossible to capture some changes experimentally. Mathematical models could illuminate these metabolic processes during the organ preservation period which in turn could guide experimental design and clinical practice.
There is extensive established evidence in the open literature that documents IRI (Salaris, et al., 1991; Shibuya et al., 1997; Galaris et al., 2006; Hines et al., 2013; Hines and Grisham, 2011; Tang et al., 2022; Bardallo et al., 2022) and the potential for complications that lead to organ transplantation failure. While IRI is a complex, multistage process, all articles on the subject cite the presence of reactive oxygen species (ROS) such as superoxide (
During normal respiration, superoxide has a concentration in the range of
Hydrogen peroxide is then converted into water and oxygen
by the enzyme catalase (EC 1.11.1.6). It is generally agreed that the mitochondrial matrix concentrations of
Under normal physiological conditions, the antioxidant glutathione (GSH,
and produce water and glutathione disulfide (GSSG). Glutathione depletion and/or the concentration ratio [GSH]/[GSSG] are also often used as an indicator of oxidative stress. However, note that twice as much glutathione is needed to remove 1 mol (mol) of hydrogen peroxide and that 2 mol of water are produced for each mole of H2O2 removed. This is an important fact that can lead to glutathione depletion when an organ is under oxidative stress or inflammation. This, in turn, can result in elevated levels of
The objective of this article is to test if the recently developed Nash Equilibrium (NE) modeling approach (Lucia and DiMaggio, 2019) to metabolic network analysis can be used to study oxidative stress and provide quantitative information for antioxidant supplementation in liver machine perfusion. This article is organized as follows. Section 2 presents our current model of liver metabolism. The logistics of the numerical simulations are described in Section 3. In Section 4, perturbations of hydrogen peroxide are used to simulate oxidative stress/inflammation during static cold storage (SCS) and liver machine perfusion. The goals of this work were to use Nash Equilibrium and Monte Carlo optimization to determine 1) the optimal temperature (or gradual warming) policy following SCS and 2) the minimum level of GSH supplementation to keep hydrogen peroxide concentration in the normal range during gradual warming. Select plots of changes in oxygen and glutathione consumption, hydrogen peroxide concentration, ATP synthesis, glutathione disulfide production, and [GSH]/[GSSG] for various levels of oxidative stress and inflammation during MP are presented along with illustrations of the time evolution of key metabolites and a discussion of the numerical simulation results. Conclusions of the study are drawn in Section 5.
2 A metabolic model of the liver
Figure 1 is the network model of the liver that was used in this article. It contains five cellular compartments, twenty-six pathways, sixty-nine chemical reactions (including Eqs 1–3 shown in the introduction), three hundred thirty-seven metabolites and cofactors, two hundred and twenty-four atom (charge) balances, and eighty-seven standard state Gibbs free energies and enthalpies of formation, which are the only parameters used in the model.
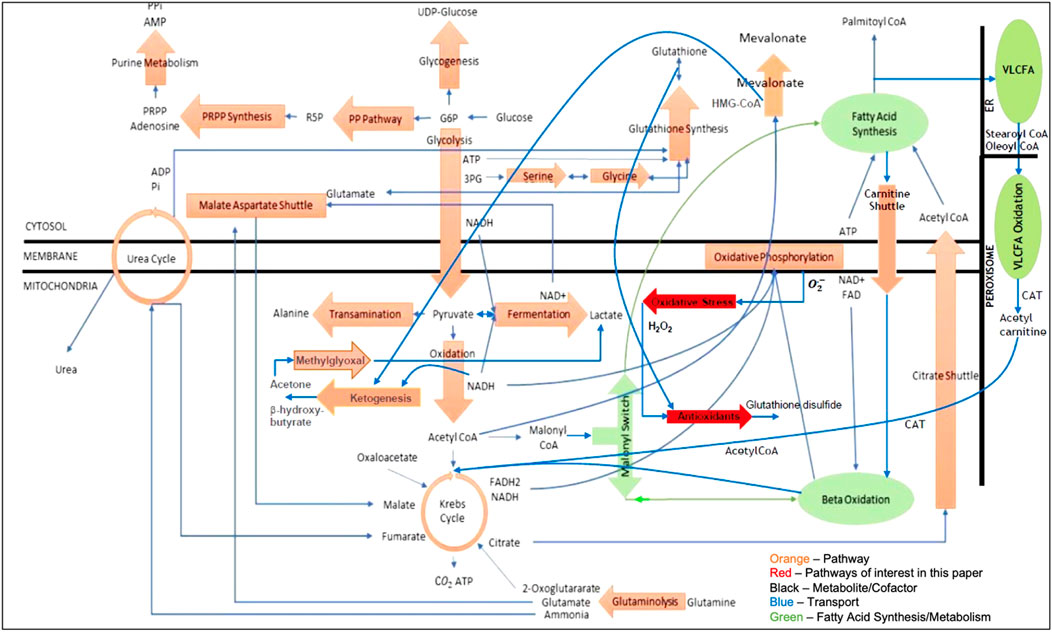
FIGURE 1. Metabolic network model of the liver.
All key model assumptions and simplifications are described in the Supplementary Table S1. The two pathways shown in bright red in Figure 1 represent the major pathways for oxidative stress and antioxidant behavior and are the main focus of this article.
3 The basis of numerical simulations using Nash Equilibrium
3.1 Nash Equilibrium modeling
The modeling approach used in this manuscript is based on the Nash equilibrium (NE) framework for determining unknown fluxes throughout a given network recently developed by Lucia and coworkers (Lucia and DiMaggio, 2019). The application of NE to liver metabolism is discussed in detail in Lucia et al. (2022) and will be briefly summarized here:
1) Enzymes are players in a multi-player game.
2) Each player (enzyme) minimizes the Gibbs free energy of the reaction it catalyzes subject to element mass balances.
3) The goal of the metabolic network is to find the best overall solution given the natural competition for nutrients among enzymes.
3.2 Formulation
The NE formulation for an arbitrary metabolic network is a rigorous, first principles approach that does not ignore or constrain accumulation/depletion of intermediate metabolites and cofactors.
The NE formulation is given by a collection of
where
where
Temperature effects are included using the Gibbs-Helmholtz equation, which is given by
where
where the
All necessary Gibbs free energies of formation data has been assembled in a local database and was taken from eQuilibrator (http://equilibrator.weizmann.ac.il/). Feedbacks within any pathway are converged using successive substitution. Also, any number of enzyme-substrate reactions can be explicitly included in the model and require that:
1) The RCSB Protein Data Bank (https://www.rcsb.org/pdb/home/) for accurate enzyme and/or enzyme-substrate structure data.
2) AutoDock or 1-Click-Docking (https://mcule.com) to compute the necessary Gibbs free energies of binding (or binding affinities) for all key enzymes.
3.3 Nash Equilibrium pseudo-algorithm
The Nash Equilibrium algorithm is iterative.
1) Define a metabolic network.
2) Identify all pathways (and species: metabolites, cofactors, enzymes), pathway connections, and transport fluxes in the given metabolic network.
3) Read properties for all species (i.e., Gibbs free energies and heats of formation, molecular weights, etc.).
4) Break all feedback and transport fluxes in the network and estimate the initial values of these fluxes.
5) Determine an initial steady-state solution.
6) Perturb the metabolic network to elicit a response.
7) Solve each NLP sub-problem given by Eqs 4–7 for the minimum Gibbs free energy for all unknown fluxes, including feedback and transport fluxes.
8) Compare the new calculated transport fluxes with previously estimated flux values.
a) If the 2-norm of the difference is within a certain tolerance,
b) If not, replace estimated feedback and transport fluxes with the calculated ones; go to step 7.
The numerical simulations of the liver model shown in Figure 1 consisted of
1) University of Wisconsin (UW) flush of the liver followed by 6 h of static cold storage at 4°C. Following Southard et al. (1990), the UW flush used in our simulations contains only the important constituents of the solution—adenosine and glutathione. The UW solution approximation used in this work is shown in Table 1. There is superoxide present primarily from purine metabolism to hypoxanthine, xanthine, and uric acid by xanthine oxidase since the cells are in a hypoxic state during SCS. However, note that the UW solution contains the antioxidant glutathione so there should be some glutathione present in the cells following static cold storage.
2) Machine Perfusion at
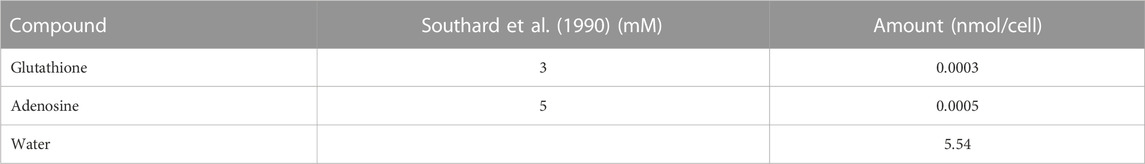
TABLE 1. UW solution components included in the model.
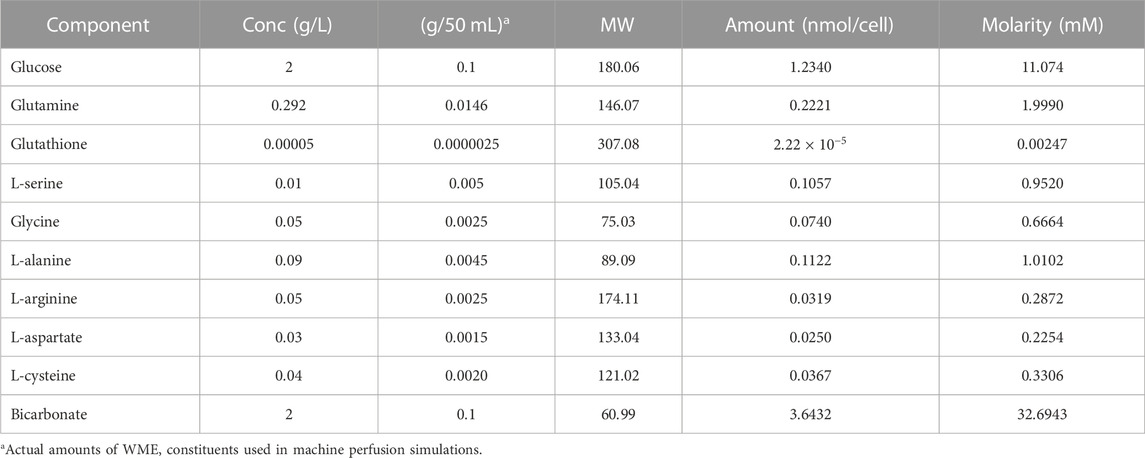
TABLE 2. Williams medium E solution components included in the model.
The mathematical model of the network shown in Figure 1 served as the basis for the numerical studies in this paper. More specifically, all reactions were solved to (some desired level of) chemical equilibrium using Gibbs free energy minimization in an inner loop while the transport fluxes shown in blue in Figure 1 were solved in an outer loop. In addition, while osmotic equilibrium is assumed in the model, chemical equilibrium between intra- and extracellular metabolites is not invoked. The same network model and algorithm were used for both SCS and MP. Algorithmic details can be found in Lucia et al. (2022).
4 Numerical perturbation studies of oxidative stress and inflammation
The numerical studies in this article included the following sequence of simulations/optimizations:
1) A baseline simulation of liver metabolism that included static cold storage and machine perfusion.
2) Monte Carlo temperature policy optimization of mid-thermic machine perfusion (MMP).
3) Monte Carlo optimization of GHS in the medium for addressing oxidative stress/inflammation.
All results presented in this section represent samples of the many simulations/optimizations conducted for this work, with simulations being repeated >100 times in each case as previously detailed in Lucia et al., 2022. Note that the optimizations of temperature policy and GSH supplementation were decoupled. All computations were performed on a Dell Vostro 5510 laptop using the Lahey-Fujitsu (LF95) compiler.
4.1 Baseline simulation
The baseline for all numerical perturbation studies of ischemia-reperfusion injury were as follows:
1) The liver was flushed with UW solution and then simulated for 6 h of SCS.
2) The resulting SCS solution was used as the starting point for the MP simulations/optimizations using Williams Medium E.
3) All MMP simulations/optimizations were run for 8 h.
During all MMP simulations/optimizations, several key biomarkers were used to ensure that the NE solution was physiologically meaningful. In particular, the NE methodology considered a solution to be physiologically meaningful if and only if the following conditions were satisfied:
1) Glycolysis produced a net amount of ATP.
2) The ratio of net ATP from the Krebs cycle to glucose consumed was between 0 and 2.
3) Oxidative phosphorylation synthesized ATP.
4) The malonyl-CoA synthesis reaction only proceeded in the forward direction because it is the committed step in fatty acid synthesis and therefore is irreversible.
5) Synthesis of fatty acids consumed ATP.
6) A net amount of glutathione disulfide was produced.
4.2 Monte Carlo temperature policy optimization
An initial MMP temperature policy of
where Glu is glucose consumption, ATP is net ATP production, Mev is mevalonate production (a measure of bile production), EC is energy charge, and w1—w4 are weights. Following Laing et al. (2017), the liver viability constraints used in this study were:
The optimization problem was defined as follows:
where

TABLE 3. Baseline solutions: 6 h of SCS followed by 8 h of MMP and OPT MMP.
Figure 2 presents plots of the optimal temperature policies and the dynamics of a few key metabolites for 6, 8, and 10 h of gradual warming MMP.
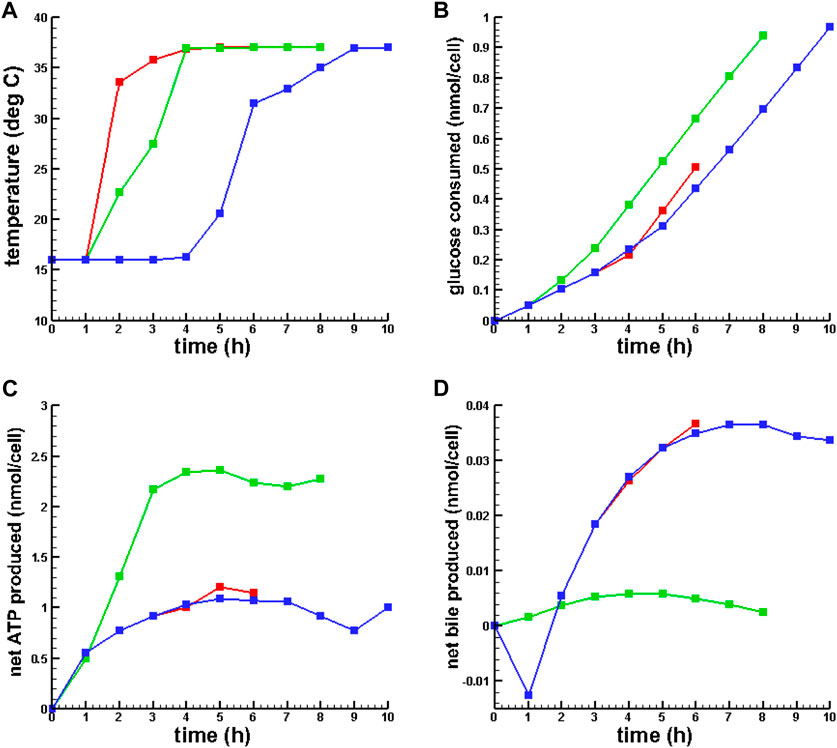
FIGURE 2. Optimal temperature policies and dynamic behavior of key metabolites for OPT MMP. (A) Optimal temperature policy. (B) Glucose consumed. (C) Net ATP synthesized. (D) Net bile produced.  6 h MMP,
  8 h MMP,
  10 h MMP.
Table 3; Figure 2 show that SCS ATP depletion, pH, and energy charge were qualitatively consistent with prior results reported in Lucia et al. (2022) and Bruinsma et al. (2013). While conventional MMP simulation and all MMP with temperature policy optimizations resulted in increased ATP synthesis and energy charge from the same SCS metabolic state, 8 h of gradual warming MMP resulted in significantly more ATP production. Also, concentrations of
Also, note that the simulations showed that the net bile synthesis after 8 h of MMP was negative, while for OPT MMP it was positive. Finally, despite the difference in ATP production between MMP and OPT MMP, there was only a slight difference in energy charge.
4.3 Optimization of GSH supplementation using hydrogen peroxide perturbation
Note that the UW solution and Williams medium E shown in Table 3 used in the baseline MMP and OPT MMP simulations resulted in hydrogen peroxide concentrations outside the normal range.
Using 6 h of SCS followed by 8 h of OPT MMP with the temperature policy determined in the previous section, an optimization problem was formulated to find the minimum amount of glutathione supplementation needed to keep hydrogen peroxide in the normal range and was defined by Eqs 11, 12:
such that
where
In the numerical experiments that follow, the lower bound on GSH was set to
4.3.1 Minimum GSH supplementation
In the first set of numerical perturbation studies, initial hydrogen peroxide perturbations were restricted such that H2O2 concentrations lied in the range from normal to just below the threshold for oxidative stress given in Sies (2017), which is
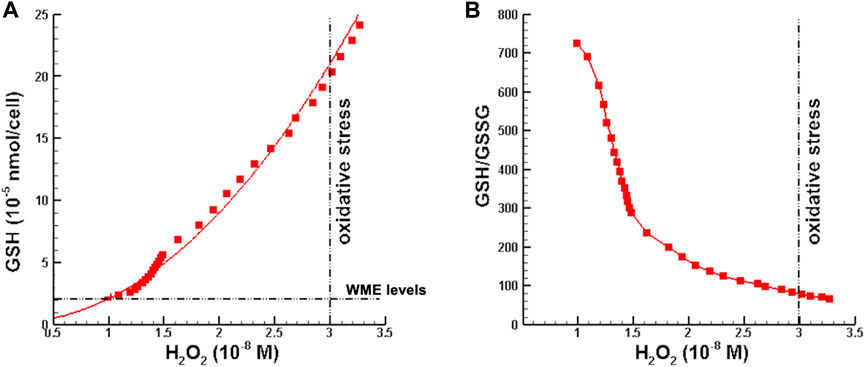
FIGURE 3. Minimum glutathione requirements as a function of hydrogen peroxide concentration. (A) Minimum GSH supplementation such that [H2O2] is in the normal range at the end of OPT MMP. (B) GSH/GSSG ratio corresponding to minimum GSH supplementation. Note that [H2O2] >
Figure 4 is a plot of the dynamics of [
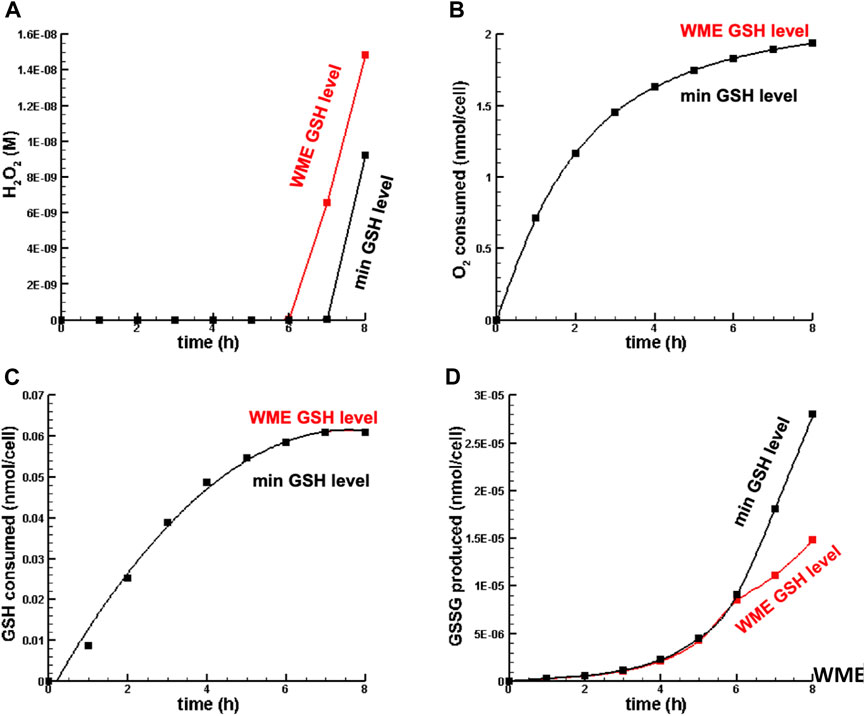
FIGURE 4. Dynamics of key metabolites in liver cell in oxidative stress. (A) H2O2 concentration. (B) O2 consumed. (C) GSH consumed. (D) GSSG synthesized. Note that inf in this figure (B,C), the min GSH level and WME GSH level curves overlap nearly perfectly.
4.3.2 Inflammation
One fundamental aspect of oxidative phosphorylation is the need for oxygen to produce ATP. Cytochrome C oxidase (or enzyme complex IV) of the electron transport chain (ETC.) is responsible for reducing oxygen (i.e., O2 accepts electrons from cytochrome C) and the reduced oxygen is combined with hydrogen ions to form water prior to the production of ATP in complex V (ATP synthase or ATPase). Cyt C oxidase is also responsible for pumping hydrogen ions to the intermembrane space to increase the proton gradient. Protons then re-enter the inner membrane through the F0 portion of ATP synthase and are used to power the F1 portion (or rotary motor) of ATPase to produce ATP. Unfortunately, oxidative stress/inflammation can lead to cytochrome C oxidase dysfunction (Srinivasan and Avadhami, 2012). This dysfunction can result in reduced useful oxygen consumption (i.e., the amount of oxygen excluding O2 converted to superoxide), an increase in water synthesis as enzymes catalase and glutathione peroxidase attempt to remove hydrogen peroxide, a reduction in the proton gradient to drive ATPase, and less ATP.
In the second set of numerical experiments, perturbations of hydrogen peroxide were increased to place [H2O2] in the inflammation regime as defined by Sies (2017) while the total amount of GSH was fixed at the amount available in Williams Medium E (see Table 2). Results for oxygen consumption, ATP synthesis from the, ETC., energy charge, and GSH/GSSG as a function of [H2O2] are shown in Figure 5.
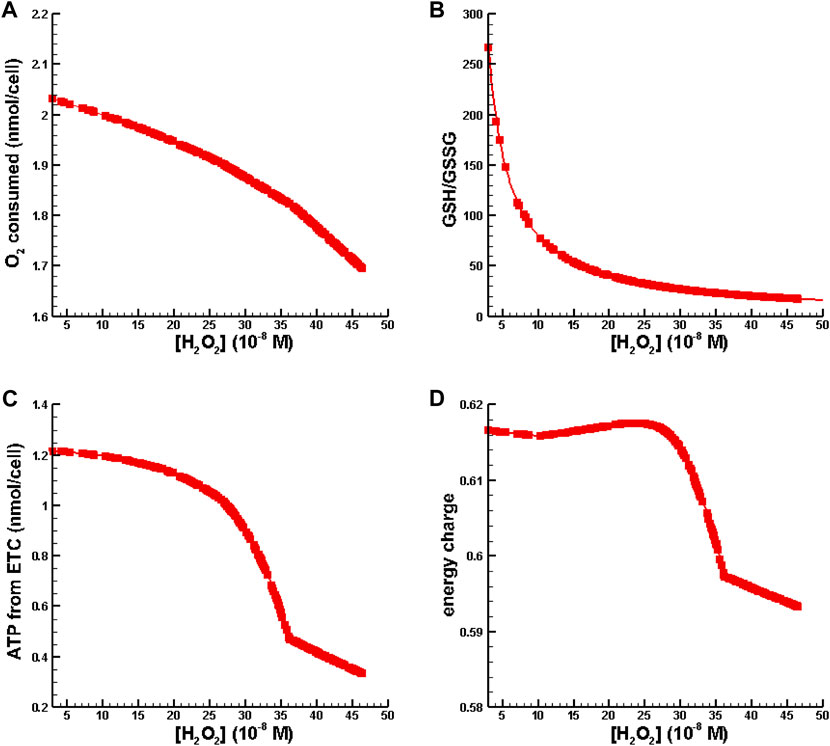
FIGURE 5. Metabolic behavior in the inflammation regime. (A) O2 consumed vs. [H2O2]. (B) GSH/GSSG ratio vs. [H2O2]. (C) ATP synthesis from oxidative phosphorylation vs. [H2O2]. (D) Energy charge vs. [H2O2].
Figure 5A is indicative of cytochrome c oxidase dysfunction resulting is a reduction of useful oxygen consumption. Figure 5B shows that the conventional biomarker for measuring oxidative stress and inflammation, GSH/GSSG, decreases as a function of [H2O2]. In Figures 5C, D one can see that ATP synthesis and energy charge decrease with increasing levels of inflammation. All of the behavior shown in Figure 5 is consistent with observations associated with oxidative stress/inflammation.
It is interesting to note that the optimal temperature policy (warming rate) does not change with GSH supplementation. Although the heat of reaction for conversion of hydrogen peroxide to water (Eq. 8) by GSH is exothermic and large (
On the other hand, the net amount of ATP generated is on the order of 1 nmol/cell and requires ∼20 kJ/mol. Here the net energy required for ATP synthesis is ∼2 × 10⁻⁸ kJ/cell, which is four orders of magnitude greater that the energy released by consuming hydrogen peroxide. Therefore, since ATP synthesis has a direct impact on the return function both directly and indirectly through the energy charge (Eq. 8), the dominating energy effects of ATP synthesis compared to the energy generated by hydrogen peroxide consumption show that GSH supplementation has essentially no effect on rewarming rate (or temperature policy).
5 Conclusion
In this article the metabolic behavior of a Nash Equilibrium model of liver metabolism under oxidative stress and inflammation during mid-thermic machine perfusion was studied using hydrogen peroxide perturbations. Monte Carlo optimization was used to determine an optimal gradual warming MMP temperature policy (OPT MMP). Using this MMP optimal temperature policy, perturbations in hydrogen peroxide were used to invoke oxidative stress and inflammation. Monte Carlo optimization was used again to determine the minimum amount of glutathione supplementation that kept [H2O2] in the normal range of
The medium optimization described in this paper considered the optimization of one compound in Williams Medium E. However, the Monte Carlo procedure described in this work can be extended to find optimal amounts of 1) multiple compounds in Williams Medium E, 2) compounds in other nutrient media such as Histidine-Tryptophan-Ketoglutarate (HTK) or Exsanguinous Metabolic Support (EMS) solution, and 3) therapeutic drugs.
Data availability statement
The raw data supporting the conclusion of this article will be made available by the authors, without undue reservation.
Author contributions
AL: Conceptualization, Methodology, Software, Writing–original draft, Writing–review and editing. KU: Conceptualization, Formal Analysis, Writing–review and editing.
Funding
The author(s) declare financial support was received for the research, authorship, and/or publication of this article. This material is partially based on work supported by the National Science Foundation under Grant No. EEC 1941543. Support from the US National Institutes of Health (Grant Nos R01DK096075 and R01DK114506) and the Shriners Children’s Hospital is gratefully acknowledged.
Conflict of interest
The authors declare that the research was conducted in the absence of any commercial or financial relationships that could be construed as a potential conflict of interest.
Publisher’s note
All claims expressed in this article are solely those of the authors and do not necessarily represent those of their affiliated organizations, or those of the publisher, the editors and the reviewers. Any product that may be evaluated in this article, or claim that may be made by its manufacturer, is not guaranteed or endorsed by the publisher.
Supplementary material
The Supplementary Material for this article can be found online at: https://www.frontiersin.org/articles/10.3389/fsysb.2023.1260315/full#supplementary-material
SUPPLEMENTARY TABLE S1 | Key model assumptions and simplifications.
References
Bardallo, R. G., Panisello-Rosello, A., Sanchez-Nuno, S., Alva, N., Rosello-Catafau, J., and Carbonell, T. (2022). Nrf2 and oxidative stress in liver ischemia/reperfusion injury. FEBS J. 289, 5463–5479. doi:10.1111/febs.16336
Bruinsma, B. G., Berendsen, T. A., Izamis, M. L., Yarmush, M. L., and Uygun, K. (2013). Determination and extension of the limits to static cold storage using subnormothermic machine perfusion. Int. J Artif Organs 36, 775–780. doi:10.5301/ijao.5000250
Galaris, D., Barbouti, A., and Korantzopoulos, P. (2006). Oxidative stress in hepatic ischemia-reperfusion injury: the role of antioxidants and iron chelating compounds. Curr. Pharm. Des. 12, 2875–2890. doi:10.2174/138161206777947614
Hines, I. N., and Grisham, M. B. (2011). Divergent roles of superoxide and nitric oxide in liver ischemia and reperfusion injury. J. Clin. Biochem. Nutr. 48 (1), 50–56. doi:10.3164/jcbn.11-016FR
Hines, I. N., Harada, H., Hoffman, J. M., Pavlick, K. P., Bharwani, S., Wolf, R., et al. (2013). “Role of Superoxide in post-ischemic liver injury,” in Madame curie bioscience database (Austin (TX): LandesBioscience). Available from: https://www.ncbi.nlm.nih.gov/books/NBK6357/.
Jurczuk, M., Moniuszko-Jakoniuk, J., and Rogalaski, J. (2006). Evaluation of oxidative stress in hepatic mitochondria of rats exposed to cadmium and ethanol. Pol. J. Environ. Stud. 15 (6), 853–860.
Laing, R. W., Mergental, H., Yap, C., Kirkham, A., Whilku, M., Barton, D., et al. (2017). Viability testing and transplantation of marginal livers (VITTAL) using normothermic machine perfusion: study protocol for an open-label, non-randomised, prospective, single-arm trial. BMJ Open 7, e017733. doi:10.1136/bmjopen-2017-017733
Lehtinen, M. K., and Bonni, A. (2006). Modeling oxidative stress in the central nervous system. Curr. Mol. Med. 6, 871–881. doi:10.2174/156652406779010786
Lucia, A., and DiMaggio, P. A. (2019). “Multi-scale computational approach to understanding cancer,” in Data science for healthcare: methodologies and algorithms. Editors S. Consoli, D. R. Recupero, and M. Petkovic (Switzerland AG: Springer Nature), 327–345.
Lucia, A., Ferrarese, E., and Uygun, K. (2022). Modeling energy depletion in rat livers using Nash equilibrium metabolic pathway analysis. Sci. Rep. 12, 3496. doi:10.1038/s41598-022-06966-2
Lucia, A., and Uygun, K. (2022). Optimal temperature protocols for liver machine perfusion using a Monte Carlo method. IFAC Pap. 55-23, 35–40. doi:10.1016/j.ifacol.2023.01.011
Miriyala, S., Holley, A. K., and St Clair, D. K. (2011). Mitochondrial superoxide dismutase--signals of distinction. Anticancer Agents Med. Chem. 11 (2), 181–190. doi:10.2174/187152011795255920
Salaris, S. C., Barbs, C. F., and Voorhees, W. D. (1991). Methylene blue as an inhibitor of superoxide generation by xanthine oxidase: a potential new drug for the attenuation of ischemia/reperfusion injury. Biochem. Pharmacol. 42 (3), 499–506. doi:10.1016/0006-2952(91)90311-r
Shibuya, H., Ohkohchi, N., Seya, K., and Satomi, S. (1997). Kupffer cells generate superoxide anions and modulate reperfusion injury in rat livers after cold preservation. Hepatology 25 (2), 356–360. doi:10.1053/jhep.1997.v25.pm0009021947
Sies, H. (2017). Hydrogen peroxide as a central redox signaling molecule in physiological oxidative stress: oxidative eustress. Redox Biol. 11, 613–619. doi:10.1016/j.redox.2016.12.035
Southard, J. H., van Gulik, T. M., Ametani, M. S., Vreugdenhil, P. K., Lindell, S. L., Pienaar, B. L., et al. (1990). Important components of the UW solution. Transplantation 49 (2), 251–257. doi:10.1097/00007890-199002000-00004
Srinivasan, S., and Avadhami, N. G. (2012). Cytochrome c oxidase dysfunction in oxidative stress. Free Radic. Biol. Med. 53 (6), 1252–1263. doi:10.1016/j.freeradbiomed.2012.07.021
Tang, S.-P., Mao, X.-L., Chen, Y. H., Yan, L. L., Ye, L. P., and Li, S. W. (2022). Reactive oxygen species induce fatty liver and ischemia-reperfusion injury by promoting inflammation and cell death. Front. Immunol. 13, 870239. doi:10.3389/fimmu.2022.870239
Thomas, C., Mackey, M. M., Diaz, A. A., and Cox, D. P. (2009). Hydroxyl radical is produced via the Fenton reaction in submitochondrial particles under oxidative stress: implications for diseases associated with iron accumulation. Redox Rep. 14 (3), 102–108. doi:10.1179/135100009X392566
Valdez, L. B., Bombicino, S. S., Iglesias, D. E., Rukavina, I., Mikusic, A., and Boveris, A. (2018). Mitochondrial peroxynitrite generation is mainly driven by superoxide steady-state concentration rather than by nitric oxide steady-state concentration. Int. J. Mol. Biol. 3 (2), 56–61. doi:10.15406/ijmboa.2018.03.00051
Nomenclature
Keywords: liver metabolism, machine perfusion, oxidative stress, inflammation, glutathione supplementation
Citation: Lucia A and Uygun K (2024) Metabolic perturbation studies using a Nash Equilibrium model of liver machine perfusion: modeling oxidative stress and effect of glutathione supplementation. Front. Syst. Biol. 3:1260315. doi: 10.3389/fsysb.2023.1260315
Received: 17 July 2023; Accepted: 11 December 2023;
Published: 08 January 2024.
Edited by:
Ioannis P. Androulakis, Rutgers, The State University of New Jersey, United StatesReviewed by:
Kengo Watanabe, Institute for Systems Biology (ISB), United StatesFrancois Berthiaume, Rutgers, The State University of New Jersey, United States
Copyright © 2024 Lucia and Uygun. This is an open-access article distributed under the terms of the Creative Commons Attribution License (CC BY). The use, distribution or reproduction in other forums is permitted, provided the original author(s) and the copyright owner(s) are credited and that the original publication in this journal is cited, in accordance with accepted academic practice. No use, distribution or reproduction is permitted which does not comply with these terms.
*Correspondence: Angelo Lucia, YWx1Y2lhQHVyaS5lZHU=