 Panteleimon D. Mavroudis
 Donato Teutonico2
 Nikhil Pillai
94% of researchers rate our articles as excellent or good
Learn more about the work of our research integrity team to safeguard the quality of each article we publish.
Find out more
ORIGINAL RESEARCH article
Front. Syst. Biol., 20 June 2023
Sec. Translational Systems Biology and In Silico Trials
Volume 3 - 2023 | https://doi.org/10.3389/fsysb.2023.1180948
This article is part of the Research TopicUse of Quantitative Systems Pharmacology Pipelines to Bridge in Vitro and in Vivo Results in Drug DiscoveryView all 5 articles
Prediction of a new molecule’s exposure in plasma is a critical first step toward understanding its efficacy/toxicity profile and concluding whether it is a possible first-in-class, best-in-class candidate. For this prediction, traditional pharmacometrics use a variety of scaling methods that are heavily based on pre-clinical pharmacokinetic (PK) data. We here propose a novel framework based on which preclinical exposure prediction is performed by applying machine learning (ML) in tandem with mechanism-based modeling. In our proposed method, a relationship is initially established between molecular structure and physicochemical (PC)/PK properties using ML, and then the ML-driven PC/PK parameters are used as input to mechanistic models that ultimately predict the plasma exposure of new candidates. To understand the feasibility of our proposed framework, we evaluated a number of mechanistic models (1-compartment, physiologically based pharmacokinetic (PBPK)), PBPK distribution models (Berezhkovskiy, PK-Sim standard, Poulin and Theil, Rodgers and Rowland, and Schmidt), and PBPK parameterizations (using in vivo, or in vitro clearance). For most of the scenarios tested, our results demonstrate that PK profiles can be adequately predicted based on the proposed framework. Our analysis further indicates some limitations when liver microsomal intrinsic clearance (CLint) is used as the only clearance pathway and underscores the necessity of investigating the variability emanating from the different distribution models when providing PK predictions. The suggested approach aims at earlier exposure prediction in the drug development process so that critical decisions on molecule screening, chemistry design, or dose selection can be made as early as possible.
The prediction of the pharmacokinetic (PK) exposure of drugs is critical to understanding their behavior, with researchers striving for optimal concentration versus time profile at the site of action to reach both efficacy and a suitable safety profile at a given dose and regimen (Hutchinson and Kirk, 2011; Khanna, 2012; Scannell et al., 2012; Schuck et al., 2015; Waring et al., 2015; Pammolli et al., 2020; Davies et al., 2020). PK profile is a function of both a drug’s intrinsic molecular properties such as lipophilicity, solubility, and chemical reactivity and an organism’s physiological characteristics that ultimately drive its absorption, distribution, metabolism, and excretion (ADME) (Lucas et al., 2019). Although there have been major efforts to using machine learning (ML) to predict the intrinsic properties of compounds for de novo molecular design, ML-based predictions of in vivo PK dynamics has been much less prominent (Obrezanova et al., 2022). A possible reason for this is that generating a large quantity and high quality of PK exposure data is far more costly and difficult than in vitro assays that can be run more easily to characterize a compound’s intrinsic properties (Hughes et al., 2011; Bender and Cortes-Ciriano, 2021). This hinders the application of ML in predicting PK dynamics.
Current approaches for predicting in vivo PK mainly involve mathematical models that build upon the classical foundations of pharmacology (Jusko, 2013; Ayyar and Jusko, 2020). These models can be categorized as non-compartmental, compartmental, and physiological. Noncompartmental analysis (NCA) is a useful analysis of concentration vs. time data to assess a drug’s maximum concentration (Cmax), area under the curve (AUC), clearance (CL), and steady-state volume of distribution (Vdss) for the preliminary assessment of properties such as linearity and stationarity. Compartmental models are improving the insights into distribution properties of drugs by incorporating “black box” compartments to capture the different slopes of the PK profile. Physiologically based PK (PBPK) models retain a model structure that is based on the physiology of the species of interest, with parameters divided into those representing a compound’s intrinsic properties and those assigned to the physiological measurements of the body (e.g., blood flow and organ size) (Rowland et al., 2011). Based on their structure, the use of ML approaches is increasingly appealing for predicting the input parameters for PBPK models to not only accelerate the development of robust PBPK-based predictions but also to save substantial resources and become an alternative approach to traditional in vivo data-based modeling (Hosea and Jones, 2013).
Several recent studies have used ML approaches to predict in vivo PK parameters such as Cmax, AUC, and Vdss (Schneckener et al., 2019; Wang et al., 2019; Ye et al., 2019; Feinberg et al., 2020; Kosugi and Hosea, 2020; Kosugi and Hosea, 2021; Lombardo et al., 2021; Miljkovic et al., 2021), while others studies have incorporated ML and PK models to predict PK profiles (Hosea and Jones, 2013; Schneckener et al., 2019; Antontsev et al., 2021; Chen et al., 2021; Chou and Lin, 2022). Predicting a drug’s PK profile rather than PK parameters can be advantageous, especially regarding its relationship to efficacy and toxicity. This relationship is not easy to correlate to a specific PK parameter but rather to its concentration time course at the site of action for the time the drug interacts with its target. In addition, compared to predicting PK solely through data-based methods, systems-based models such as PBPK can facilitate both the prediction of PK profile for different species and for a different tissue from that used to train the PBPK model. Both extrapolations can take advantage of the physiological basis of the model. However, the information needed to inform a systems-based model like PBPK is not always available in the early stages of drug development, and these models often incorporate numerous assumptions that they cannot be appropriately addressed.
We here evaluate the framework for using ML in combination with mechanism-based modeling (PK and PBPK) to predict the PK profile of intra-venous (IV) administration of small molecules in rats for 1 mg/kg dose. We thus evaluate several test cases where different types of mathematical models (1-compartment PK model, PBPK), different inputs to the models, and different distribution assumptions are considered. The overall goal of this proof-of-concept work is to evaluate whether using ML-derived parameters in tandem with PK/PBPK modeling can result in reasonable exposure predictions and to demonstrate the feasibility of conducting these predictions early after discovery, only knowing the structure of the molecule. ML algorithms developed here are meant to be continuously optimized by the incorporation of new datasets.
The schema of the framework used in this work is shown in Figure 1, where ML is used to predict PK and physicochemical (PC) parameters that are then used as input to mechanistic models to ultimately predict rat plasma exposure for IV administration. We therefore investigated 1-compartment and PBPK models. For PBPK modeling, we explored two parameterizations using as input either in vivo or microsomal intrinsic clearance (CL or CLint), and we tested five distribution models: Berezhkovskiy (Berezhkovskiy, 2004), PK-Sim standard (Willmann et al., 2005), Poulin and Theil (Poulin and Theil, 2000), Rodgers and Rowland (Rodgers et al., 2005), and Schmidt (Schmitt, 2008). The parameter inputs required for the different models are shown in Table 1.
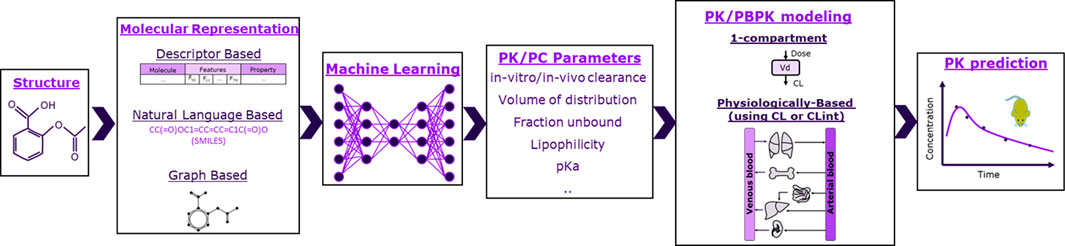
FIGURE 1. Schematic of the framework studied in this work. Molecules were represented as molecular fingerprints (bit vector), descriptors, or graphs. Machine learning was then used to predict pharmacokinetic (PK) and physicochemical (PC) parameters based on molecular representations. PK/PC parameters were finally inserted to either 1-compartment or physiologically based models to predict rats’ exposure.
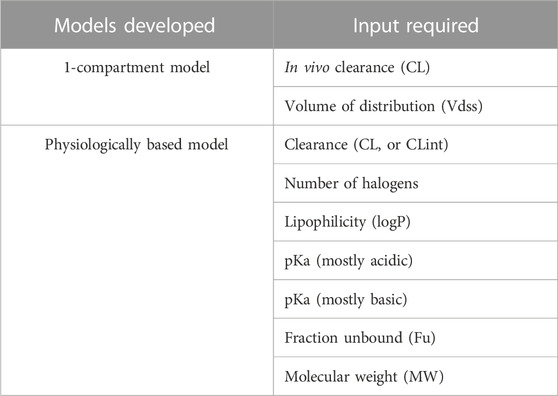
TABLE 1. Mechanistic models developed and the respective parameters required for IV administration PK prediction. For the physiologically based model, we used either in vivo clearance (CL) measured with NCA or intrinsic clearance (CLint) from liver microsomes.
To ensure data consistency and to mitigate variability due to assay choice, historical data generated exclusively in the Sanofi Boston site were used. These data were derived from two datasets: the compound property dataset, where structural, PC, and PK parameters are stored, and the PK profile dataset, where concentration time profiles for the different compounds are saved. The compound property dataset consisted of 530 compounds for which in vivo rat CL and Vdss were calculated based on NCA of 1 mg/kg IV administration in rats, and 451 compounds for which CLint was calculated based on in vitro microsomal experiments. There were 459 and 324 compounds with available information for pka (most acidic) and pka (most basic), respectively, and only 188 compounds for which Fu data were available. SMILES (simplified molecular-input line-entry system) string format was available for each compound. The PK profile dataset consisted of 397 compounds for which we had rat PK profile (concentration vs. time data) for 1 mg/kg IV administration in rats. A total of 637 unique compounds were obtained after combining the aforementioned datasets, of which 61 compounds were found to be common across all. As shown by chemical similarity distribution based on Tanimoto score (Supplementary Figure S1), most compounds in our dataset differed from each other.
As a first step in our proposed framework, ML models were built to predict the parameters required as input to mechanistic models. Details about the data used to develop these models are provided in Table 2. In-house ML models were built for fraction unbound (Fu), in vivo CL, in vivo Vdss, CLint, pKa (mostly acidic), and pKa (mostly basic). For molecular weight and lipophilicity (logP), they Python RDkit package was utilized to generate predictions (Swain, 2016b; Cheminformatics, 2022; RDKit, 2022; RDKit, 2023).

TABLE 2. Metrics for different models utilized to generate final prediction. Ten-fold cross-validation was performed on the training set for hyperparameter optimization (see Supplementary Table S2 for MAPE scores of cross-validation datasets). Performance metrics are reported for the best model.
SMILES strings—one of the most widely used ways to represent a molecule—were used as input to the ML model. For most structures, one part of the SMILES string consists of salt, and another part represents the base chemical structure for the compound; thus, initial data cleaning was performed prior to training the ML models. In the data cleaning process, salts were stripped from the molecules. In the pre-processing step, the SMILES strings were converted into their canonical forms, and SMILES strings were standardized using the MolVS package (Swain, 2016a) in Python. The SMILES strings, prior to feeding into the algorithm, were transformed into molecular descriptors (200 structure-based descriptors (RDKit, 2022)), molecular fingerprints (Morgan fingerprints, 1024 bit), and graphs (undirected graph represented as a 3-tuple (atom_features, bond_features, and pair_indices)) (Kensert, 2021) to test which molecular representation may help generate models (by testing different algorithms) with better accuracy (lower root-mean squared error (RMSE) or mean absolute percent error (MAPE)). ML models were developed by splitting the dataset into test and train sets. Validation was performed using ten-fold cross-validation on the training set. During cross-validation, hyperparameter optimization was also performed : for random forest algorithm, they were the number of estimators and max depth; for XGBoost, they were the number of estimators, subsample, colsample by tree, and learning rate; for support vector regression, they were kernel, gamma, regularization parameter, and epsilon (Pedregosa et al., 2011); for message passing neural network, they were the number of layers, number of neurons, and activation function (Kensert, 2021). Different molecular representations (molecular fingerprints, descriptors, and graphs (specifically for message-passing neural networks (MPNN))) were initially tested to determine which molecular representation had the best performance metrics (RMSE, MAPE) for our datasets. Different ML algorithms (random forest (Liaw and Wiener, 2002), support vector regression (SVR) (Awad and Khanna, 2015), XGboost (Chen and Guestrin, 2016), and MPNN (Gilmer et al., 2020)) were also tested to see which had the best performance metrics (Supplementary Table S1). To avoid biased predictions (predictions of PK profile generated for compound available in training set) and have uniform predictions generated from one compartment model and PBPK model, 61 compounds for which we had all associated data (PK, PC parameters, and PK profile) were used in the test set for all the models. Based on data availability, the rest of the compounds were used in the training set (see Table 2). Different algorithms, including both classical (random forest, XGboost, and SVR) and deep learning (MPNN) algorithms were tested on different combinations of molecular representation (fingerprints, descriptors, and graphs) to identify which combination of algorithm and molecular representation worked best for the data available (Table 2). Root-mean square error and mean absolute percent error were used to determine the final model.
The 1-compartment model assumes that the distribution of the drug takes place homogeneously in a single volume of distribution (Vdss), and its clearance is mediated by a unique rate of elimination (CL) following first-order kinetics (Talevi and Bellera, 2021). The one-compartment model was developed using MATLAB R2019a.
A whole-body physiologically based pharmacokinetic (PBPK) model was used to simulate the plasma concentration profiles for the same 61 drug compounds which were available in the test set of ML models. The PBPK model structure and its assumptions are detailed elsewhere (Willmann et al., 2003). Briefly, this model incorporates multiple compartments that represent physiologically relevant body tissues. The parameters of the model are related to the PC drug properties (e.g., lipophilicity and MW) and to physiological information (e.g., tissue volumes and blood flows) that are combined to predict the time course of the drug in the most relevant organs of drug distribution, metabolism, and excretion. Drug properties are used to predict tissue permeabilities and partition coefficients which, in turn, are used to predict the drug distribution in the different tissues. Since several distribution models are available to predict the drug partition coefficients, all the distribution models available were used to generate the drug concentrations, and respective variability was evaluated. PK/PC parameters were included in the simulation as measured or predicted from ML algorithms, depending on the simulation scenario. Simulations with both in vitro and in vivo clearance parameters were used to compare the predictability of these two parameters. In vitro clearance values were used as direct input into the PBPK model after conversion to specific clearance (intrinsic clearance normalized to the liver volume), while plasma clearances were converted into intrinsic clearances using the well-stirred model equation. This conversion was performed using PBPK modeling software. The PBPK model was implemented in PK-Sim, part of the Open Systems Pharmacology Suite version 11.0 (https://www.open-systems-pharmacology.org/). R version 4.2.0 (R Foundation for Statistical Computing) was used to perform the simulations.
Figures 2A–F show the measured vs. predicted values for each of the parameters tested. ML predictions for CL, Vdss, CLint, pKa (most acidic), and pKa (most basic) were found to be reasonable, with less than two-fold error (MAPE <1) for the final model. MAPE corresponding to fraction unbound was 1.11, which may be due to the low amount of data in the training set (Figure 2F). It was found for this dataset that deep learning methods were less accurate than the classical approach, perhaps due to a low amount of data used in the training set. Finally, it was observed that the MPNN model (deep learning) converged to the mean value of the parameter and hence was not able to capture the distribution spread. Performance metrics of the final model used for ML predictions are provided in Table 2, and performance metrics of different models tested for this analysis are provided in Supplementary Table S1. A combination of MAPE and RMSE were utilized to select the best model for each parameter (Supplementary Table S1).
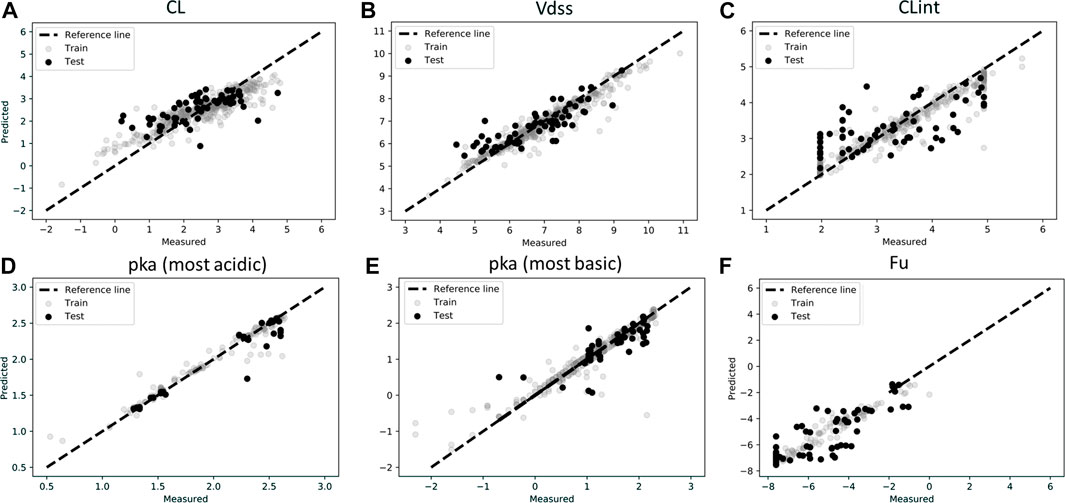
FIGURE 2. Scatter plots of observations (experimentally measured data) and predictions for test and train data in log scale for (A) Clearance (CL), (B) Volume of distribution (Vdss), (C) Intrinsic Clearance (CLint), (D) pka (most acidic), (E) pka (most basic), (F) Fraction unbound (Fu). Model predictions were based on best model as described in Table 2.
ML-derived in vivo CL and in vivo Vdss were used as input to the 1-compartment model, and the resulting profile was compared to the observed rat PK exposure data. Comparison between observed and predicted rat plasma exposure is shown in Figure 3. The majority of the predicted time points are close to the observed values as shown by the clustering of most of points around the identity line (Figure 3A). The ratio between the observed AUC until the last time point of 24 h (AUClast) and the predicted AUClast has a median of 0.9, and 50% of values are between 0.4 and 1.5 (Figure 3B), which indicates satisfactorily prediction of the relevant metrics. Similarly, the ratio of the observed maximum concentration and the predicted Cmax has an average of 0.9 and a 50% range narrower than the AUClast ratio (Figure 3C).
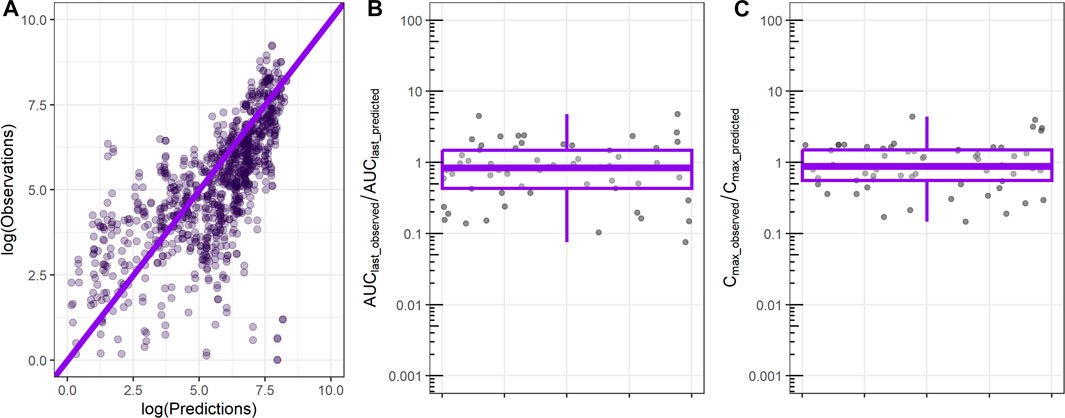
FIGURE 3. Comparison between observed rat plasma exposure and exposure predicted by the 1-compartment model using as input ML-derived CL, Vdss parameters. (A) Observed plasma exposure vs. 1-compartment model predictions. The solid line indicates the identity line. (B) Ratio between observed AUC until the final time point (AUClast_observed) and 1-compartment model-predicted AUC (AUClast_predicted). (C) Ratio between observed maximum concentration (Cmax_observed) and 1-compartment model-predicted maximum concentration (Cmax_predicted).
PBPK-based predictions using ML-driven parameters (Table 1) were also tested against the same PK profile dataset. Figure 4 shows individual profiles along with PBPK-based predictions using in vivo CL for the different distribution models investigated. The PBPK model predictions appear to satisfactorily describe the majority of the compounds’ PK profile. The PBPK model was able to capture the bi-exponential nature of the compounds’ plasma distribution. Comparing the different distribution models, simulations show that there are cases where all of them conclude in similar exposure prediction (e.g., compound 5 and others), whereas, for cases such as compound 60 or 61 and others, the PK profile has significantly different characteristics depending on the distribution model used.
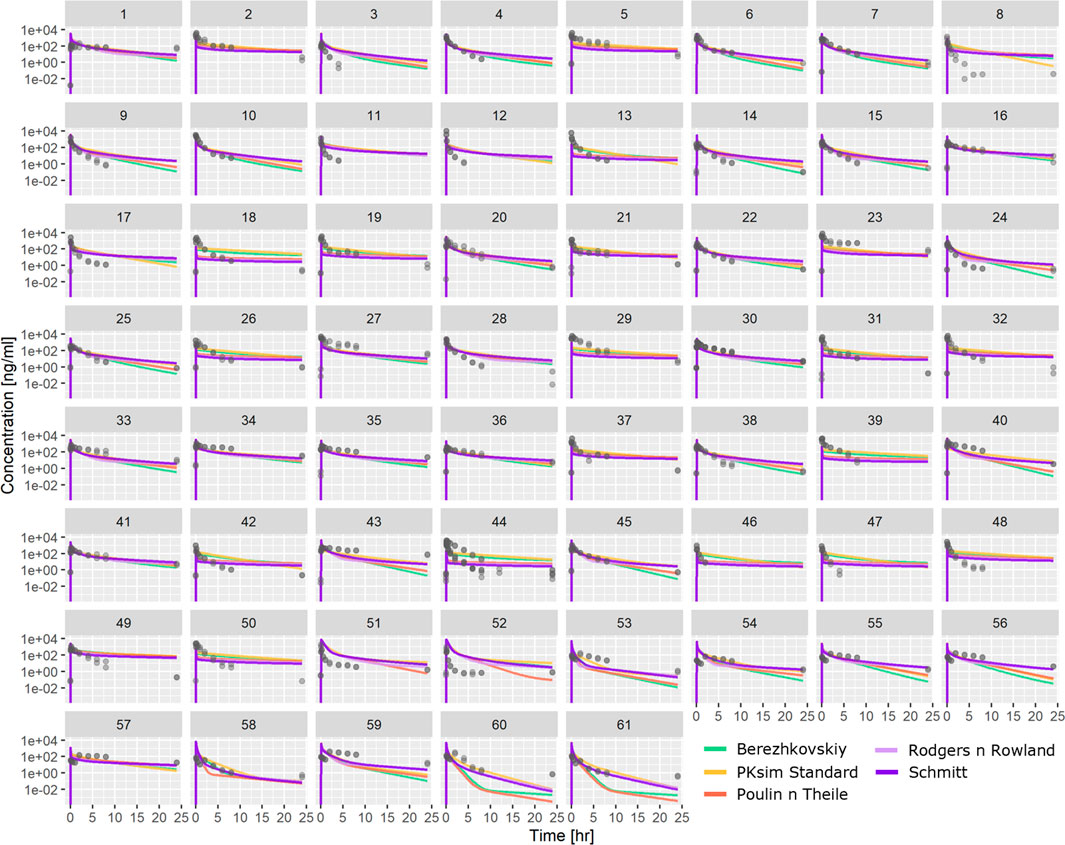
FIGURE 4. Comparison between observed PK profiles and profiles predicted using PBPK modeling with ML-driven PC/PK parameters and in vivo CL for the individual compounds tested. Different subplots indicate different compounds tested, and different colors indicate different distribution models.
Analysis of the AUClast and Cmax fold difference between observations and predictions for all PBPK distribution models is shown in Figure 5. Different distribution models have slightly different median values, but all distribution models tested showed a median AUClast_observed/AUClast_predicted range between 1 and 2, which indicates a reasonable prediction of observed AUC. Similarly, the ratio between Cmax_observed and Cmax_predicted retained a median range of 0.5 to 0.8. Compared to the AUC ratio, Cmax retained a larger spread of the predicted values.
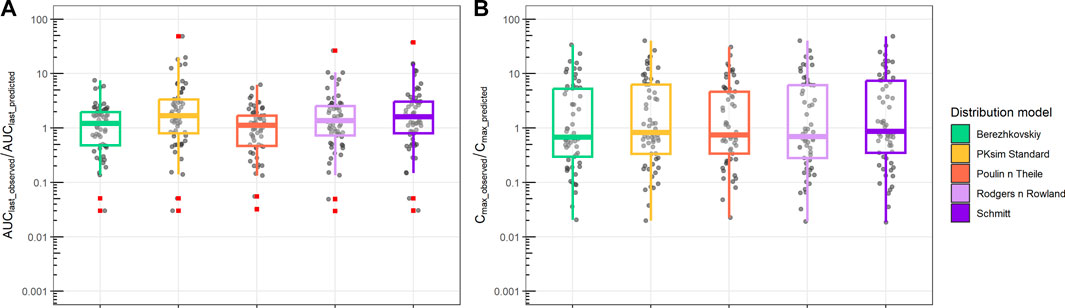
FIGURE 5. Ratio between observed and predicted AUC and Cmax based on PBPK prediction using ML-driven PK/PC parameters and in vivo clearance (CL). (A) Ratio between observed AUC until the final time point (AUClast_observed) and PBPK model-predicted AUC (AUClast_predicted). (B) Ratio between observed maximum concentration (Cmax_observed) and PBPK model-predicted maximum concentration (Cmax_predicted). Different boxplot colors indicate different distribution models.
Finally, we compared PBPK simulations using ML-driven PK/PC parameters and intrinsic clearance (CLint) with observed data (Figure 6). The median AUClast_observed/AUClast_predicted ranged from 0.2 to 0.7. The interquartile difference was different between the distribution models used. In contrast, the Cmax_observed/Cmax_predicted median had a narrower range (0.7–0.9) for all distribution models, with similar interquartile intervals.
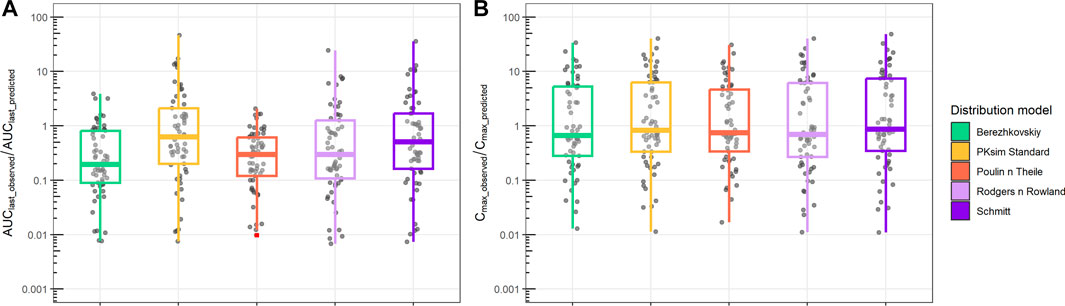
FIGURE 6. Ratio between observed and predicted AUC and Cmax based on PBPK prediction using ML-driven PK/PC parameters and intrinsic clearance (CLint). (A) Ratio between observed AUC until the final time point (AUClast_observed) and PBPK model-predicted AUC (AUClast_predicted). (B) Ratio between observed maximum concentration (Cmax_observed) and PBPK model-predicted maximum concentration (Cmax_predicted). Different boxplot colors indicate different distribution models.
In the past few decades, there have been considerable efforts to improve R&D productivity in the pharmaceutical industry. The main focus is to ensure that a molecule has desired pharmacological activity in humans prior to Phase II studies, with a heavy focus on having enough good Phase I-ready molecules (Paul et al., 2010). In this quick-win-fast-fail paradigm, ML and mechanism-based modeling have found increasing application to all stages of drug discovery and development (Pillai et al., 2022).
The application of ML is particularly appealing in the early stages of drug development where there is not enough mechanistic knowledge of how a new molecule distributes in the body and mediates its pharmacological effects. Several quantitative structure–activity relationship (QSAR) models for predicting preclinical ADME properties have been described (Van der Graaf et al., 1999; Ng et al., 2004; Gombar and Hall, 2013; Dave and Morris, 2015; Valitalo et al., 2016) and used in drug discovery. In this work, ML has been used to predict compounds’ PK/PC properties that are later used as input for mechanistic models to ultimately predict plasma exposure. Based on the ML models developed, it was found that, for all parameters except Fu, the average error in predictions with respect to observation was less than two-fold (MAPE values less than 1), while the average error for Fu was slightly higher than two-fold (MAPE values 1.1)—perhaps due to lack of data in the training set. We further assessed ML-driven propagation error in the ultimate exposure predictions by comparing 1-compartment/PBPK simulations using input parameters measured experimentally vs. predicted by ML (Supplementary Figure S2). Our analysis not only showed no significant difference in the PK profile prediction when using ML vs. experimental data, as indicated by overlapping boxplot edges, but it was also noted in some cases that ML models can mitigate errors that may occur due to variability in either recording or performing the experiment (Supplementary Figure S2, more outliers in data vs. ML predictions). The ML models developed in this study can be further improved by utilizing deep learning techniques and classical approaches when more data are available.
ML-derived in vivo CL and in vivo Vdss were initially used as input parameters to a 1-compartment model, and the resulting plasma exposure was tested against rat plasma profile (Figure 3A). The 1-compartment model is the simplest PK model that assumes a single volume of drug distribution (Vdss) with a linear clearance (CL); it is designed to explain mono-exponential PK profiles (straight line in logarithmic concentration vs. time plot). As such, 1-compartment representation is not suitable for capturing the distribution of the molecule to peripheral tissues of the body. Due to this inherent limitation, we observed a cluster of concentration data over the identity line at lower concentration values (Figure 3A), an indication of model underpredictability. Despite this inherent limitation, the 1-compartment model was able to capture the majority of both AUClast, and Cmax of observed data within a two-/three-fold difference (Figures 3B, C). In pharmacokinetics/toxicokinetics, there is no a priori threshold on an acceptable model error, but PBPK/PK models are generally accepted and considered useful when the prediction error on AUC or Cmax is in the two- or three-fold range (De Buck et al., 2007; Maharaj and Edginton, 2014; Mavroudis et al., 2018; Mavroudis et al., 2022).
To predict a new molecule’s tissue distribution in the absence of exposure data, quantitative pharmacologists often use PBPK modeling (Chen et al., 2012; Jones et al., 2015). The physiological details incorporated in PBPK models and the distribution models involved in their mathematical representation enable the prediction of tissue distribution based solely on the PC properties of the compound and the physiology of the relevant species. ML-driven parameters were used as input to the PBPK model (Table 1), considering all distribution models available in PK-Sim. In the results shown in Figures 4, 5, the PBPK model uses in vivo clearance (CL) resulting from NCA. As expected, the PBPK model can capture the distribution clearance and, as such, the bi-exponential exposure of the molecules (Figure 4) better than the 1-compartment model (Supplementary Figure S3). The median fold difference between observed and predicted AUClast ranged 1–2 depending on the distribution model chosen. This is an indication of the different assumptions involved in the different distribution models that ultimately lead to different clearances and exposure predictions (Figure 4). In contrast, Cmax is mainly determined by the compound’s PC properties and the body’s physiology, which was identical for all distribution models tested. As a result, the interquartile differences observed in Cmax are similar for the different distribution models and the narrower median value range (Figure 5B).
Our framework was also tested with PBPK model-based predictions using ML-driven parameters and intrinsic clearance (CLint) derived from in vitro experiments. For this case, although PBPK model could still satisfactorily describe the Cmax median within a two- to three-fold error (Figure 6B), the AUClast prediction was significantly higher for the majority of the observed data, leading to a low AUCobserved over AUCpredicted ratio (Figure 6A; Supplementary Figure S4). This is a common observation and challenge across companies when using in vitro data (Petersson et al., 2022). In contrast with in vivo CL that results from NCA and represents a holistic representation of the in vivo PK data elimination rate, intrinsic clearance here solely represents the liver microsomal clearance. To be used in PBPK modeling, CLint is scaled based on the relevant species liver weight, assuming a well-stirred liver compartment (Obach, 2001; Austin et al., 2002). In this case, all other clearance mechanisms (e.g., renal clearance) and active transports of the molecule (e.g., Pgp transporters) are not taken into consideration. This limited mechanistic representation of the molecule’s clearance pathways leads to an overprediction of AUClast and, ultimately, lower values of AUClast observed over a predicted ratio. Comparing AUClast and Cmax predictions from all models and parameterizations used in this work using ML-driven input (Supplementary Figure S5), PBPK using CLint maintains a lower ratio of AUClast observed/predicted, whereas PBPK with in vivo CL results in a similar AUClast ratio prediction to the 1-compartment model. Cmax prediction shows significantly higher variation independent of in vitro/in vivo parameterization.
Due to recent progresses in bioinformatics and systems modeling, along with technical improvements in instrumentation and quantification methods that enable large numbers of molecules to be screened early in discovery, the methodology presented in this work has been investigated to some extent by others (Hosea and Jones, 2013) (https://www.simulations-plus.com/software/admetpredictor/). Compared to previous efforts, our analysis consists of a significantly larger test set of molecules and considers a number of alternative models and parameterizations; it is thus the first to examine the use of ML in combination with mechanistic modeling to such a conclusive extent. Henceforth, ML models may not be applied interchangeably in any given task due to their poor extrapolation capabilities outside the range of data utilized to train the model. Due to their black-box nature, ML models and methodologies need to be dynamically developed and fine-tuned in orchestration with new data generation, as is the case for the models presented in this work.
In conclusion, the ML/mechanistic modeling framework proposed here results in reasonable exposure predictions for most of the scenarios tested. Our work underlines the necessity of considering multiple distribution models when predicting PK based on molecular structure and providing the respective variability in addition to a single PK profile estimate. This effort aims to enable PK prediction earlier in the drug development process and ultimately help in prioritizing compounds for future evaluation.
The data analyzed in this study are subject to the following licenses/restrictions: proprietary data that cannot be shared. Requests to access these datasets should be directed to cGFudGVsZWltb24ubWF2cm91ZGlzQHNhbm9maS5jb20=.
The animal studies were reviewed and approved by Sanofi.
PM and NP designed the in silico strategy. NP developed the ML methods and analyzed the respective data. PM and DT implemented the mechanism-based models (1-compartment, PBPK) and analyzed the respective data. All authors contributed to interpreting the results, contributed to the article, and approved the submitted version.
This study was funded by Sanofi.
The authors would like to thank Dr. Yongyi Luo for helping them understand the PK assays and data, Drs. Sirimas Sudsakorn and Henrik Cordes for facilitating data management and access, and Drs. Hans Matter and Gerhard Hessler for their discussion on machine learning methodologies.
All authors of this article are employees of Sanofi.
All claims expressed in this article are solely those of the authors and do not necessarily represent those of their affiliated organizations, or those of the publisher, the editors, and the reviewers. Any product that may be evaluated in this article, or claim that may be made by its manufacturer, is not guaranteed or endorsed by the publisher.
The Supplementary Material for this article can be found online at: https://www.frontiersin.org/articles/10.3389/fsysb.2023.1180948/full#supplementary-material
Antontsev, V., Jagarapu, A., Bundey, Y., Hou, H., Khotimchenko, M., Walsh, J., et al. (2021). A hybrid modeling approach for assessing mechanistic models of small molecule partitioning in vivo using a machine learning-integrated modeling platform. Sci. Rep. 11 (1), 11143. doi:10.1038/s41598-021-90637-1
Austin, R. P., Barton, P., Cockroft, S. L., Wenlock, M. C., and Riley, R. J. (2002). The influence of nonspecific microsomal binding on apparent intrinsic clearance, and its prediction from physicochemical properties. Drug Metab. Dispos. 30 (12), 1497–1503. doi:10.1124/dmd.30.12.1497
Awad, M., and Khanna, R. (2015). “Support vector regression,” in Efficient learning machines: Theories, concepts, and applications for engineers and system designers (Berkeley, CA: Apress), 67–80.
Ayyar, V. S., and Jusko, W. J. (2020). Transitioning from basic toward systems pharmacodynamic models: Lessons from corticosteroids. Pharmacol. Rev. 72 (2), 414–438. doi:10.1124/pr.119.018101
Bender, A., and Cortes-Ciriano, I. (2021). Artificial intelligence in drug discovery: What is realistic, what are illusions? Part 2: A discussion of chemical and biological data. Drug Discov. Today 26 (4), 1040–1052. doi:10.1016/j.drudis.2020.11.037
Berezhkovskiy, L. M. (2004). Volume of distribution at steady state for a linear pharmacokinetic system with peripheral elimination. J. Pharm. Sci. 93 (6), 1628–1640. doi:10.1002/jps.20073
Cheminformatics (2022). Open-Source cheminformatics software. Avaliable At: https://www.rdkit.org.
Chen, E. P., Bondi, R. W., and Michalski, P. J. (2021). Model-based target pharmacology assessment (mTPA): An approach using PBPK/PD modeling and machine learning to design medicinal chemistry and DMPK strategies in early drug discovery. J. Med. Chem. 64 (6), 3185–3196. doi:10.1021/acs.jmedchem.0c02033
Chen, T., and Guestrin, C. (2016). “XGBoost: A scalable tree boosting system,” in Proceedings of the 22nd ACM SIGKDD international conference on knowledge discovery and data mining (San Francisco, California, USA: Association for Computing Machinery), 785–794.
Chen, Y., Jin, J. Y., Mukadam, S., Malhi, V., and Kenny, J. R. (2012). Application of IVIVE and PBPK modeling in prospective prediction of clinical pharmacokinetics: Strategy and approach during the drug discovery phase with four case studies. Biopharm. Drug Dispos. 33 (2), 85–98. doi:10.1002/bdd.1769
Chou, W. C., and Lin, Z. (2022). Machine learning and artificial intelligence in physiologically based pharmacokinetic modeling. Toxicol. Sci. 191, 1–14. doi:10.1093/toxsci/kfac101
Dave, R. A., and Morris, M. E. (2015). Quantitative structure-pharmacokinetic relationships for the prediction of renal clearance in humans. Drug Metab. Dispos. 43 (1), 73–81. doi:10.1124/dmd.114.059857
Davies, M., Jones, R. D. O., Grime, K., Jansson-Lofmark, R., Fretland, A. J., Winiwarter, S., et al. (2020). Improving the accuracy of predicted human pharmacokinetics: Lessons learned from the AstraZeneca drug pipeline over two decades. Trends Pharmacol. Sci. 41 (6), 390–408. doi:10.1016/j.tips.2020.03.004
De Buck, S. S., Sinha, V. K., Fenu, L. A., Nijsen, M. J., Mackie, C. E., and Gilissen, R. A. (2007). Prediction of human pharmacokinetics using physiologically based modeling: A retrospective analysis of 26 clinically tested drugs. Drug Metab. Dispos. 35 (10), 1766–1780. doi:10.1124/dmd.107.015644
Feinberg, E. N., Joshi, E., Pande, V. S., and Cheng, A. C. (2020). Improvement in ADMET prediction with multitask deep featurization. J. Med. Chem. 63 (16), 8835–8848. doi:10.1021/acs.jmedchem.9b02187
Gilmer, J., Schoenholz, S. S., Riley, P. F., Vinyals, O., and Dahl, G. E. (2020). “Message passing neural networks,” in Machine learning meets quantum physics. Editor K. T. Schütt (Cham: Springer International Publishing), 199–214.
Gombar, V. K., and Hall, S. D. (2013). Quantitative structure-activity relationship models of clinical pharmacokinetics: Clearance and volume of distribution. J. Chem. Inf. Model. 53 (4), 948–957. doi:10.1021/ci400001u
Hosea, N. A., and Jones, H. M. (2013). Predicting pharmacokinetic profiles using in silico derived parameters. Mol. Pharm. 10 (4), 1207–1215. doi:10.1021/mp300482w
Hughes, J. P., Rees, S., Kalindjian, S. B., and Philpott, K. L. (2011). Principles of early drug discovery. Br. J. Pharmacol. 162 (6), 1239–1249. doi:10.1111/j.1476-5381.2010.01127.x
Hutchinson, L., and Kirk, R. (2011). High drug attrition rates--where are we going wrong? Nat. Rev. Clin. Oncol. 8 (4), 189–190. doi:10.1038/nrclinonc.2011.34
Jones, H. M., Chen, Y., Gibson, C., Heimbach, T., Parrott, N., Peters, S. A., et al. (2015). Physiologically based pharmacokinetic modeling in drug discovery and development: A pharmaceutical industry perspective. Clin. Pharmacol. Ther. 97 (3), 247–262. doi:10.1002/cpt.37
Jusko, W. J. (2013). Moving from basic toward systems pharmacodynamic models. J. Pharm. Sci. 102 (9), 2930–2940. doi:10.1002/jps.23590
Kensert, A. (2021). Message-passing neural network (MPNN) for molecular property prediction (keras). Avaliable At: https://keras.io/examples/graph/mpnn-molecular-graphs/#generate-graphs.
Khanna, I. (2012). Drug discovery in pharmaceutical industry: Productivity challenges and trends. Drug Discov. Today 17 (19-20), 1088–1102. doi:10.1016/j.drudis.2012.05.007
Kosugi, Y., and Hosea, N. (2020). Direct Comparison of total clearance prediction: Computational machine learning model versus bottom-up approach using in vitro assay. Mol. Pharm. 17 (7), 2299–2309. doi:10.1021/acs.molpharmaceut.9b01294
Kosugi, Y., and Hosea, N. (2021). Prediction of oral pharmacokinetics using a combination of in silico descriptors and in vitro ADME properties. Mol. Pharm. 18 (3), 1071–1079. doi:10.1021/acs.molpharmaceut.0c01009
Liaw, A., and Wiener, M. J. R. N. (2002). Classification and regression by random Forest. MJRN 2 (3), 18–22.
Lombardo, F., Bentzien, J., Berellini, G., and Muegge, I. (2021). In silico models of human PK parameters. Prediction of volume of distribution using an extensive data set and a reduced number of parameters. J. Pharm. Sci. 110 (1), 500–509. doi:10.1016/j.xphs.2020.08.023
Lucas, A. J., Sproston, J. L., Barton, P., and Riley, R. J. (2019). Estimating human ADME properties, pharmacokinetic parameters and likely clinical dose in drug discovery. Expert Opin. Drug Discov. 14 (12), 1313–1327. doi:10.1080/17460441.2019.1660642
Maharaj, A. R., and Edginton, A. N. (2014). Physiologically based pharmacokinetic modeling and simulation in pediatric drug development. CPT Pharmacometrics Syst. Pharmacol. 3 (11), e150. doi:10.1038/psp.2014.45
Mavroudis, P. D., Hermes, H. E., Teutonico, D., Preuss, T. G., and Schneckener, S. (2018). Development and validation of a physiology-based model for the prediction of pharmacokinetics/toxicokinetics in rabbits. PLoS One 13 (3), e0194294. doi:10.1371/journal.pone.0194294
Mavroudis, P. D., Pillai, N., Wang, Q., Pouzin, C., Greene, B., and Fretland, J. (2022). A multi-model approach to predict efficacious clinical dose for an anti-TGF-beta antibody (GC2008) in the treatment of osteogenesis imperfecta. CPT Pharmacometrics Syst. Pharmacol. 11 (11), 1485–1496. doi:10.1002/psp4.12857
Miljkovic, F., Martinsson, A., Obrezanova, O., Williamson, B., Johnson, M., Sykes, A., et al. (2021). Machine learning models for human in vivo pharmacokinetic parameters with in-house validation. Mol. Pharm. 18 (12), 4520–4530. doi:10.1021/acs.molpharmaceut.1c00718
Ng, C., Xiao, Y., Putnam, W., Lum, B., and Tropsha, A. (2004). Quantitative structure-pharmacokinetic parameters relationships (QSPKR) analysis of antimicrobial agents in humans using simulated annealing k-nearest-neighbor and partial least-square analysis methods. J. Pharm. Sci. 93 (10), 2535–2544. doi:10.1002/jps.20117
Obach, R. S. (2001). The prediction of human clearance from hepatic microsomal metabolism data. Curr. Opin. Drug Discov. Devel 4 (1), 36–44.
Obrezanova, O., Martinsson, A., Whitehead, T., Mahmoud, S., Bender, A., Miljkovic, F., et al. (2022). Prediction of in vivo pharmacokinetic parameters and time-exposure curves in rats using machine learning from the chemical structure. Mol. Pharm. 19 (5), 1488–1504. doi:10.1021/acs.molpharmaceut.2c00027
Pammolli, F., Righetto, L., Abrignani, S., Pani, L., Pelicci, P. G., and Rabosio, E. (2020). The endless frontier? The recent increase of R&D productivity in pharmaceuticals. J. Transl. Med. 18 (1), 162. doi:10.1186/s12967-020-02313-z
Paul, S. M., Mytelka, D. S., Dunwiddie, C. T., Persinger, C. C., Munos, B. H., Lindborg, S. R., et al. (2010). How to improve R&D productivity: The pharmaceutical industry's grand challenge. Nat. Rev. Drug Discov. 9 (3), 203–214. doi:10.1038/nrd3078
Pedregosa, F. A. V., Gramfort, A., Michel, V., and Thirion, O. (2011). Scikit-learn: Machine learning in {P}ython. J. Mach. Learn. Res. 12, 2825–2830.
Petersson, C., Zhou, X., Berghausen, J., Cebrian, D., Davies, M., DeMent, K., et al. (2022). Current approaches for predicting human PK for small molecule development candidates: Findings from the IQ human PK prediction working group survey. AAPS J. 24 (5), 85. doi:10.1208/s12248-022-00735-9,
Pillai, N., Dasgupta, A., Sudsakorn, S., Fretland, J., and Mavroudis, P. D. (2022). Machine Learning guided early drug discovery of small molecules. Drug Discov. Today 27 (8), 2209–2215. doi:10.1016/j.drudis.2022.03.017
Poulin, P., and Theil, F. P. (2000). A priori prediction of tissue:plasma partition coefficients of drugs to facilitate the use of physiologically-based pharmacokinetic models in drug discovery. J. Pharm. Sci. 89 (1), 16–35. doi:10.1002/(SICI)1520-6017(200001)89:1<16::AID-JPS3>3.0.CO;2-E
RDKit (2022). Open-source cheminformatics. Avaliable At: https://www.rdkit.org/docs/GettingStartedInPython.html#list-of-available-descriptors.
RDKit (2023). The RDKit documentation. Avaliable At: https://www.rdkit.org.
Rodgers, T., Leahy, D., and Rowland, M. (2005). Physiologically based pharmacokinetic modeling 1: Predicting the tissue distribution of moderate-to-strong bases. J. Pharm. Sci. 94 (6), 1259–1276. doi:10.1002/jps.20322
Rowland, M., Peck, C., and Tucker, G. (2011). Physiologically-based pharmacokinetics in drug development and regulatory science. Annu. Rev. Pharmacol. Toxicol. 51, 45–73. doi:10.1146/annurev-pharmtox-010510-100540
Scannell, J. W., Blanckley, A., Boldon, H., and Warrington, B. (2012). Diagnosing the decline in pharmaceutical R&D efficiency. Nat. Rev. Drug Discov. 11 (3), 191–200. doi:10.1038/nrd3681
Schmitt, W. (2008). General approach for the calculation of tissue to plasma partition coefficients. Toxicol Vitro 22 (2), 457–467. doi:10.1016/j.tiv.2007.09.010
Schneckener, S., Grimbs, S., Hey, J., Menz, S., Osmers, M., Schaper, S., et al. (2019). Prediction of oral bioavailability in rats: Transferring insights from in vitro correlations to (deep) machine learning models using in silico model outputs and chemical structure parameters. J. Chem. Inf. Model. 59 (11), 4893–4905. doi:10.1021/acs.jcim.9b00460
Schuck, E., Bohnert, T., Chakravarty, A., Damian-Iordache, V., Gibson, C., Hsu, C. P., et al. (2015). Preclinical pharmacokinetic/pharmacodynamic modeling and simulation in the pharmaceutical industry: An IQ consortium survey examining the current landscape. AAPS J. 17 (2), 462–473. doi:10.1208/s12248-014-9716-2
Swain, M. (2016). MolVS: Molecule validation and standardization. Avaliable At: https://molvs.readthedocs.io.
Swain, M. (2016). MolVS: Molecule validation and standardization. Avaliable At: https://molvs.readthedocs.io/en/latest/.
Talevi, A., and Bellera, C. L. (2021). “One-compartment pharmacokinetic model,” in The ADME encyclopedia: A comprehensive guide on biopharmacy and pharmacokinetics (Cham: Springer International Publishing), 1–8.
Valitalo, P. A., Griffioen, K., Rizk, M. L., Visser, S. A., Danhof, M., Rao, G., et al. (2016). Structure-based prediction of anti-infective drug concentrations in the human lung epithelial lining fluid. Pharm. Res. 33 (4), 856–867. doi:10.1007/s11095-015-1832-x
Van der Graaf, P. H., Nilsson, J., Van Schaick, E. A., and Danhof, M. (1999). Multivariate quantitative structure-pharmacokinetic relationships (QSPKR) analysis of adenosine A1 receptor agonists in rat. J. Pharm. Sci. 88 (3), 306–312. doi:10.1021/js980294a
Wang, Y., Liu, H., Fan, Y., Chen, X., Yang, Y., Zhu, L., et al. (2019). In silico prediction of human intravenous pharmacokinetic parameters with improved accuracy. J. Chem. Inf. Model. 59 (9), 3968–3980. doi:10.1021/acs.jcim.9b00300
Waring, M. J., Arrowsmith, J., Leach, A. R., Leeson, P. D., Mandrell, S., Owen, R. M., et al. (2015). An analysis of the attrition of drug candidates from four major pharmaceutical companies. Nat. Rev. Drug Discov. 14 (7), 475–486. doi:10.1038/nrd4609
Willmann, S., Lippert, J., and Schmitt, W. (2005). From physicochemistry to absorption and distribution: Predictive mechanistic modelling and computational tools. Expert Opin. Drug Metab. Toxicol. 1 (1), 159–168. doi:10.1517/17425255.1.1.159
Willmann, S., Lippert, J., Sevestre, M., Solodenko, J., Fois, F., and Schmitt, W. (2003). PK-Sim®: A physiologically based pharmacokinetic ‘whole-body’ model. BIOSILICO 1 (4), 121–124. doi:10.1016/s1478-5382(03)02342-4
Keywords: machine learning, drug discovery, pharmacokinetics, PBPK, model-based drug development, artificial intelligence, QSAR
Citation: Mavroudis PD, Teutonico D, Abos A and Pillai N (2023) Application of machine learning in combination with mechanistic modeling to predict plasma exposure of small molecules. Front. Syst. Biol. 3:1180948. doi: 10.3389/fsysb.2023.1180948
Received: 06 March 2023; Accepted: 31 May 2023;
Published: 20 June 2023.
Edited by:
Federico Reali, University of Trento Centre for Computational and Systems Biology, ItalyReviewed by:
Piet Van Der Graaf, Certara UK Limited, United KingdomCopyright © 2023 Mavroudis, Teutonico, Abos and Pillai. This is an open-access article distributed under the terms of the Creative Commons Attribution License (CC BY). The use, distribution or reproduction in other forums is permitted, provided the original author(s) and the copyright owner(s) are credited and that the original publication in this journal is cited, in accordance with accepted academic practice. No use, distribution or reproduction is permitted which does not comply with these terms.
*Correspondence: Panteleimon D. Mavroudis, cGFudGVsZWltb24ubWF2cm91ZGlzQHNhbm9maS5jb20=
Disclaimer: All claims expressed in this article are solely those of the authors and do not necessarily represent those of their affiliated organizations, or those of the publisher, the editors and the reviewers. Any product that may be evaluated in this article or claim that may be made by its manufacturer is not guaranteed or endorsed by the publisher.
Research integrity at Frontiers
Learn more about the work of our research integrity team to safeguard the quality of each article we publish.