 Pantea Pooladvand
 Peter S. Kim
94% of researchers rate our articles as excellent or good
Learn more about the work of our research integrity team to safeguard the quality of each article we publish.
Find out more
ORIGINAL RESEARCH article
Front. Syst. Biol., 13 October 2022
Sec. Multiscale Mechanistic Modeling
Volume 2 - 2022 | https://doi.org/10.3389/fsysb.2022.903512
This article is part of the Research TopicSystems Biology, Women in Science 2021/22: Multiscale Mechanistic ModelingView all 6 articles
Solid tumours develop much like a fortress, acquiring characteristics that protect them against invasion. A common trait observed in solid tumours is the synthesis of excess collagen which traps therapeutic agents, resulting in a lack of dispersion of treatment within the tumour mass. In most tumours, this results in only a localised treatment. Often the tumour quickly recovers and continues to invade surrounding regions. Anti-tumour viral therapy is no exception to this rule. Experimental results show collagen density affects virus diffusion and inhibits cell infection; therefore, accurately modelling virus dispersion is an important aspect of modelling virotherapy. To understand the underlying dynamics of viral diffusion in collagen, we derive a novel non-Fickian diffusion term from first principles. We demonstrate that this diffusion term captures experimentally observed virus dispersion in cancer-associated collagen, unlike the standard diffusion term, commonly used in virotherapy models. Then, using a system of partial differential equations, we explore virotherapy in relation to collagen density. We show that our model can predict therapy outcome in relation to collagen density. The results also suggest that modifications in virus performance, such as increased virus infectivity, is not effective in dense collagen; therefore, reducing collagen, might be the best approach when dealing with collagen-rich tumours. We also investigate virotherapy in relation to collagen structures and find that size of collagen deposits are as important to outcome as collagen density. Together, these results demonstrate that understanding virus diffusion in oncolytic virotherapy is a crucial step in capturing tumour response to treatment.
Oncolytic virotherapy is a cancer treatment where viruses are used to infect and kill cancer cells (Fountzilas et al., 2017). These anti-tumour viruses preferentially infect and replicate in cancer cells. Infected cells die when the new virus population bursts from the cell, a process known as lysis. Although treatment using viral vectors has shown promising results, there are still many challenges ahead before oncolytic virotherapy can gain widespread approval as a therapeutic approach. These challenges include delivery strategies, dose safety and lack of efficacy due to the tumour microenvironment (Jin et al., 2021; Moaven et al., 2021). A major factor contributing to the lack of success in solid tumours is the over-expression of extracellular matrix (ECM) components. There are many ways in which ECM protects tumours against treatment while promoting tumour growth. Here, we focus on how excess ECM creates a physical barrier and significantly hinders virus dispersion in the tumour environment (Choi et al., 2013; Zheng et al., 2019). An integral component of ECM in many tumours is collagen fibres, often synthesised by cancer-associated fibroblast cells (Li et al., 2019) or secreted by cancer cells (Gladson, 1999; Bellail et al., 2004). The formation of large and dense collagen regions in the tumour is also known as desmoplastic reaction. This reaction is a dynamic event as the collagen is continuously remodelled by cancer cells at different stages of tumour progression (Ueno et al., 2021).
To understand the relationship between collagen and virus spread, McKee et al. (2006) conducted a series of experiments imaging virus dispersion in collagen. Mice with human melanomas, known to have varying collagen concentrations, were injected with replication incompetent, oncolytic herpes simplex virus (HSV). By measuring virus distribution after 30 min using multiphoton images, they demonstrated that increased fibrillar collagen corresponds to a sharp decrease in viral penetration and observed an inverse correlation between collagen density and viral particles, see Figure 1. In another experiment, Choi et al. (2010) investigated viral infectivity in relation to tumour density. They found that treatment with a virus expressing decorin (a proteoglycan that can reduce the diameter of collagen fibrils) significantly increases virus infection of tumour cells. In comparison, a tumour treated with a standard adenovirus, resulted in minor cell infection, with infected cells appearing in small clusters. In addition, Dmitrieva et al. (Dmitrieva et al., 2011) degraded the ECM in glioblastoma spheroids and found a significant improvement in virus spread and anti-tumour efficacy. These results demonstrate that there is an important relationship between viral spread and collagen density.
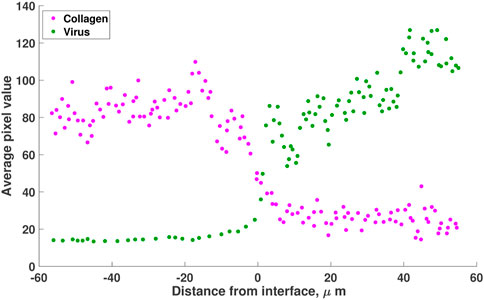
FIGURE 1. A reproduction of the results from Mckee et al. (McKee et al., 2006, Figure 1). Mice with Mu89 melanomas were injected with HSV-1 non-replicating virus. Virus distribution (green) in collagen (pink) is visualised using pixel analysis 30 min after intratumoral injection. Results show that the virus is concentrated in the low-collagen region of the melanoma (right of origin). The values are estimated using the online tool WebPlotDigitizer (Rohatgi, 2022).
Conventionally, virus spread in tumours is modelled using a variation of the advection-diffusion equation
where c represents the concentration of viruses. The first term, ∇ ⋅ (D∇c), is Fickian diffusion and D represents the diffusivity of viruses in the tumour environment. Depending on the model, D can be constant or vary spatially. The second term, ∇ ⋅ (vc), describes virus advection, where v is the interstitial fluid velocity. Here, R describes the source or sink terms related to virus binding, internalisation or degradation.
The Fickian form of diffusion is the standard and accepted description of viral spread. For example, Kim et al. (2014) investigate the co-injection of Chondroitinase ABC (an ECM-degrading enzyme) in oncolytic virotherapy of glioblastoma to find optimal outcomes in treatment. The model uses Fickian diffusion, where the diffusion coefficient is a function of local ECM density. Diffusion decreases at higher ECM concentrations. The authors use this model to recreate the experiments from Dmitrieva et al. (2011) and suggest an optimal strategy for treatment.
In another paper, Alzahrani et al. (2019) adopt a multiscale approach to investigate tumour-virus interactions. The authors use two approaches to model virus spread in solid tumours. In the first approach, they only consider virus motility in the form of Fickian diffusion, where the diffusion coefficient is a constant. In their second approach, the effect of the ECM is captured using a taxis term towards ECM gradients. The authors assume that although ECM usually acts as a barrier against virus motility, in regions of lower ECM density, the virus could potentially interact and infect a larger number of accumulated cells. The ECM-virus dynamics are therefore modelled using a reaction-advection-diffusion equation. In comparing the two approaches, the authors find that the virus under diffusion-advection is significantly more successful at spreading and infecting tumour cells. Other spatio-temporal models, investigating the dynamics of viral spread in relation to tumour cells, immune cells and adjuvant treatment can be found in (Camara et al., 2013; Malinzi et al., 2017; Friedman and Lai, 2018; Lee et al., 2020; Simbawa et al., 2020; Jenner et al., 2022); however, these models do not consider the mechanisms that drive the clustering behaviour of viruses in collagen. Understanding the relationship between collagen and virus spread is an integral part of modelling virotherapy in dense tumours.
In this paper, we investigate the mechanisms that drive viral diffusivity in collagen from first principles. Beginning with a random walk, we derive diffusion terms that cannot be expressed in the form of Eq. 1. We then compare how virus spread under Fickian diffusion compares with our non-Fickian diffusion. Referring to experimental observations, we propose that simple Fickian diffusion does not accurately capture viral dispersion in dense tumours. Using a system of partial differential equations that includes populations of tumour cells, virus and collagen, we validate our model against experimental results and show that our model can predict treatment outcome in different collagen densities. The sensitivity analysis suggests that response to treatment for collagen-dense tumours, cannot be improved with increased virus infectivity alone; therefore, reduction in collagen density may be a necessary strategy to improve treatment. In the final section, we show that configuration of collagen is also linked to tumour response. The model suggests that tumours with immature collagen formation are sensitive to collagen density, responding to treatment only at low collagen levels. On the other hand, tumours with mature collagen, where collagen fibres are finer, will respond well to treatment even at dense collagen concentrations. Overall, we demonstrate that virus diffusion is an important indicator of virotherapy success and its form needs to be carefully considered in modelling collagen-dense tumours.
To determine how virus diffusion affects virotherapy outcome, we use the following series of experiments performed by McKee et al. (2006) to inform our model:
1) Virus distribution in collagen-dense tumour. In this experiment, 106 viral transducing units of non-replicating HSV-1 virions were directly injected into human melanoma tumours (Mu89), grown in SCID mice (mice that lack both T and B lymphocytes). These tumours were known to contain regions of high and low collagen. In vivo, multiphoton imaging was conducted 30 min after the injections. Viral distribution was quantified using pixel analysis (second-harmonic generation). Results recreated in Figure 1 show that the virus (in green) moves to regions of low collagen density.
2) Effect of collagenase on oncolytic virotherapy. In this series of experiments, the authors compared the effect of virotherapy alone against coinjection of collagenase and virus. Collagenase is a metalloproteinases that degrades collagen. Human melanoma tumours were established in SCID mice. When tumours reached a volume of 100 mm3, the mice were randomised into four groups. The first group is the control, treated with 10 μL of phosphate buffered saline (PBS) only. The second group received 0.1 μg/μL of collagenase. The third group received 106 trasducing units of replication-competent oncolytic herpes simplex viral particles (HSV) in PBS. The fourth group received both collagenase (0.1 μg/μL) and HSV (106 trasducing units). Injections were given intratumorally on day 0 and day 2 of the experiment. The authors measured tumour fold increase, the ratio of tumour volume at time t to initial tumour volume. The results showed a significant improvement when collagenase is coinjected during virotherapy.
To describe virus dispersion in dense collagen, we derive three diffusion terms from first principles, adopting a similar approach to the volume-filling effect used by Painter and Hillen (2002) and Wang and Hillen (2007). Using one-dimensional Cartesian geometry, let V (x, t) represent a virus at position x at time t. Discretising time and space with step sizes Δt for time and Δx for space, we assume that viral particles follow a random walk upon injection into a tumour. We also assume that the probability a virus moves from one location to another depends on a probability p, which we call the squeeze probability, that is a function of collagen density (to be defined). We consider three cases, and each case leads to a different expression for virus diffusion as we move to a continuous system by taking the limit of Δt and Δx to zero. Details of the derivation for each case can be found in Supplementary Section S1.
• Case 1: In this case, we assume the ability of virus to move depends on the collagen density at its current location. In other words, if the collagen density is high at the virus’s current location, the virus has a low probability of movement. This assumption leads to the following PDE:
• Case 2: In this case, we assume the ability of virus to move depends on the collagen density at the location it is trying to enter. In other words, if the collagen density is high at a location adjacent to the virus, the virus has a low probability of moving there. This assumption leads to the following PDE:
• Case 3: The Fickian case. Fickian diffusion is derived with the assumption that the ability of virus to move depends on the average collagen density between its current location and the location the virus wants to enter. This assumption leads to the Fickian diffusion PDE:
The cases given above, can easily be extended into higher spatial dimensions. Note, if collagen density is constant throughout the given domain, then the results from Eqs 2, 3 will not differ from the classical case as px = 0 and we have
We now simulate the three diffusion cases described in Eqs 2–4, and identify the diffusion term that best describes the experimental observation of virus moving from regions of high to low collagen. In order to simulate the cases, we first define a function that describes the collagen concentration in Figure 1. In this figure, collagen concentration is measured as average pixel value. We normalise this data, dividing each data point by the maximum pixel value. Letting C(x) represent the ratio of collagen density to collagen carrying capacity, we fit C(x) to the normalised collagen data. For these simulations, collagen density is a function of x only, as we assume that there is no significant change in collagen in the 30-min duration of the experiment.
We also define the squeeze probability p(x) as a function of collagen density C(x). Mackee et al. proposed a decreasing relationship between viral diffusion and collagen density, so we let p take the form
For this first series of simulations, we assume a simple relationship, where n = 1, such that squeeze probability decreases linearly as collagen density increases. Once we have identified the diffusion term that qualitatively matches the observed dynamics, we then calibrate n to experimental data in Section 2.4. Since there is no change in the density of collagen in time, our squeeze probability is also a function of x only. We use a timescale of seconds and length scale of μm. We also need to estimate the diffusion coefficient D for virus spread. There is a lack of experimental data measuring D in collagen-rich tumours. Hence, we use the value from Friedman et al. (2006), which estimated virus diffusion at D = 3.6 × 10⁻² mm2 h−1 = 10 μm2 s−1. However, we note that in their model, the authors did not account for collagen density, making their estimate potentially inaccurate for our model. Therefore, in Section 3.4, we conduct a broad sensitivity analysis of our model with respect to this parameter.
We inject the virus into the centre of our domain where there is a rapid change in collagen density, so the initial virus population V0 = 1 virus/mm at − 10 μm
In the last section, for simplicity, we used the linear function p = 1 − C to connect squeeze probability and collagen density. We simulated the three diffusion cases described by Eqs 2–4 and identified the diffusion term that qualitatively matches experimental results. Let Dvf represent the chosen diffusion term for virus. From this point, we disregard the other diffusion cases and continue the analysis using Dvf for virus diffusion.
We now consider the generalised form of Eq. 5 and fit n to virus data to obtain a better estimate of squeeze probability in relation to collagen. If we assume the virus population has reached steady state by the end of the experiment (30 min), we can use the result in Supplementary Section S2.1 showing that the steady-state virus profile V(x) = Ap(x), where A is a constant and p(x) is the squeeze probability. This means that the virus profile reaches a scaled version of the squeeze probability. Using the virus data from Mckee et al. in Figure 1 and assuming squeeze probability takes the form in Eq. 5, we simulate virus diffusion using the chosen diffusion term Dvf, where virus is initially injected in the region −10 μm
We now outline the model that investigates oncolytic virotherapy in tumours with varying collagen densities. To do this, we move from Cartesian to spherical geometry. We consider a spherical tumour with radial symmetry. Let r denote distance from the centre of the tumour. Our model consists of four populations: Uninfected tumour cells U (r, t), free virus particles V (r, t), infected tumour cells I (r, t) and collagen (ratio of collagen density to maximum collagen density) C (r, t). This model is an extension of our previous work in Pooladvand et al. (2020), where we investigated behavioural changes in tumour load due to perturbations of parameters. In our previous model, diffusion of the virus followed a simple Fickian diffusion with no explicit consideration of the tumour stroma or collagen density. In this work, the evolution of population densities is as follows:
where p = 1 − (C (r,t))n is the squeeze probability described in Eq. 5, transformed to spherical geometry and β = β*(1 − C (r, t)).
Eq. 6 models the change in uninfected tumour cells. The cells diffuse at rate Du and have a maximum growth rate ru. Tumour growth is dependent on cell density and collagen concentration as can be seen by the logistic growth term, where k represents tumour cell carrying capacity and a is the collagen competition strength parameter. The infection of tumour cells is modelled using the mass-action term βUV. We assume that collagen can also hinder infection (Wojton and Kaur, 2010); therefore, infection rate β is a decreasing function of collagen density. We use a simple linear relationship between β and C but recognise that this is an area for further investigation.
Eq. 7 describes the change in free virus population. The first term, Dvf, represents the virus diffusion term chosen in Section 3.1 that best describes virus dynamics in collagen. Note, this diffusion term has been transformed to spherical geometry (details in Supplementary Section S3). Parameter Dv is the diffusion constant for virus. We assume viruses internalise into uninfected and infected cells at mass-action rate
Eq. 8, models infected tumour cells. We assume that virus infection does not change the morphology or migratory properties of the cells; therefore, the diffusion coefficient, Du, of infected cells is the same as for uninfected cells. This assumption has been used in other mathematical models (Boemo and Byrne, 2019; Lee et al., 2020). The infected cell population grows due to infection at rate βUV and dies due to lysis at rate δII.
Finally, Eq. 9 describes collagen production. Collagen fibres provide scaffolding upon which cells and tissue are organised. Further, within the tumour environment, collagen deposits are not only increased, but they are also stiffened due to remodelling (Pickup et al., 2014). Therefore, we assume collagen does not diffuse into surrounding regions. It has been shown that cancer cells and cancer-associated fibroblasts both produce significant amount of collagen in the tumour environment (Li et al., 2014; Xiong et al., 2020). We assume collagen production depends on the uninfected tumour cell population. We adopt the Michaelis-Menten expression from Kim et al. (2014), where rc is the collagen growth rate and m is a Hill-type exponent. This means collagen growth saturates at high tumour density. Collagen growth also depends on tumour cell density and collagen density as can be seen in the logistic growth term. The squeeze probability p depends on the ratio of collagen density. This function changes the behaviour of Dvf.
The interactions between the populations are illustrated in Figure 2. For all simulations we use no-flux boundary conditions and assume there are no infected tumour cells initially, i.e., I (r, 0) = 0, where r ∈ [0, L).
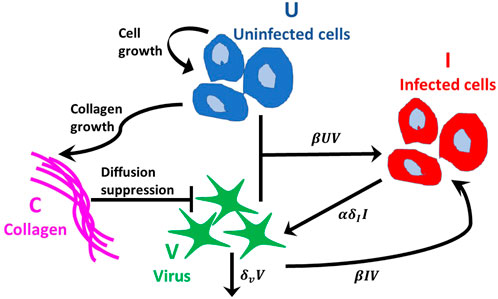
FIGURE 2. Interactions between populations. Tumour cells follow the logistic growth rate ruU (1 − (U + I)/K − aC). Virus infects uninfected tumour cells at rate βUV and internalises into infected cells at rate βIV, where β(C) is a decreasing function of collagen density. The virus decays at rate δvV. Infected tumour cells die at rate δII and α new viruses per cell are released into the free virus population. Collagen inhibits virus diffusion by reducing the probability of virus spread, modelled using a squeeze probability p(C), which is a decreasing function of collagen density, C. Collagen growth depends on the density of uninfected tumour cells and collagen.
We estimate some parameter values based on research literature and optimise the rest to experimental data from Experiment 2, described in Section 2.1.
We set the carrying capacity k for tumour cells at 106 cells mm−3 (Lodish et al., 2008). The diffusion coefficient for melanoma cells is estimated to be in the range of 0.002 and 0.07 mm2 day−1 (Tjia and Moghe, 2002). We use the average of these values and set Du = 0.036 mm2 day−1. Workenhe et al. (Workenhe et al., 2014) measured HSV wild type viral burst size at 157 ± 23.4 per cell. We set α = 150 viruses cell−1. Virus diffusion rate Dv is fixed as before at 10 μm2 s−1 = 0.864 mm2 day−1. The infected cell death rate δI is estimated at 0.288 days−1 in (Kim et al., 2014) and 1.33 days−1 in (Friedman et al., 2006). We set δI = 1 day−1. For collagen growth, we fix rc, the Hill-type exponent m and Hill-type coefficient Kc at 0.1, 1 and k respectively, as estimated in (Kim et al., 2014). Letting Kc = k means that when tumour cells are at carrying capacity, the growth rate saturates at rc/2. The list of parameters and their estimated values can be found in Table 2.
We optimise the tumour proliferation rate ru, collagen competition parameter a, infection rate β* and virus decay rate δv to the virotherapy results from McKee et al. (2006) outlined in Experiment 2, Section 2.1. Parameters ru and a are optimised simultaneously to tumour growth data without virus treatment. This data measures tumour fold change in time for treatment with PBS or collagenase. Parameters β* and δv are optimised simultaneously to tumour growth data with virus treatment. This data measures tumour fold change in time for treatment with virus alone or treatment with virus-collagenase. This information is outlined in Table 1. We optimise our fit using MATLAB’s built-in solver “lsqnonlin”.Total populations for U and I at time t, in spherical coordinates, can be tracked by using the triple integral formula
where Q = U or I. Given that we assume spherical symmetry, the above can be simplified to
We use Eq. 10 to calculate the total number of tumour cells in the domain 0 ≤ r ≤ L mm at each time step. The parameter L represents maximal tumour radius. The tumour fold change is then calculated as the ratio of tumour cells at time t, to the initial number of tumour cells (P(t)/P (0)).
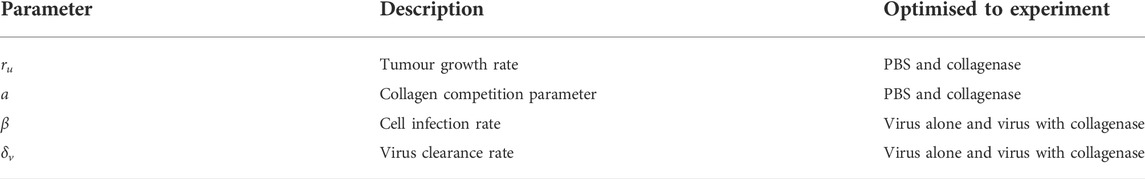
TABLE 1. Parameters optimised simultaneously to experiments from (McKee et al., 2006) outlined in Experiment 2, Section 2.1.
To fit our parameters, we need to simulate two initial scenarios: tumour with dense collagen (when collagenase is not used) and tumour with reduced collagen (when collagenase is used). Therefore, we need to define initial distributions for collagen and uninfected tumour cells. Collagen formation can differ from tumour to tumour. A good representation of this can be found in (Abyaneh et al., 2020, Figure 5). For this investigation, we consider the case where collagen is distributed in regular intervals between cancer cells, modelled by the initial collagen density
where w = 0.9 when collagen is at high density (no collagenase is administered) and w = 0.3 when collagen is at low density (collagenase is administered). The initial tumour radius r0 = 3 mm is chosen to represent a spherical tumour with volume 100 mm3 in line with Experiment 2.1. The maximum domain length of L = 15 mm is chosen large enough to avoid artefacts from boundary conditions. The representation of collagen in Eq. 11 means collagen is present in the entire domain. We believe this assumption is reasonable as tumours can be surrounded by collagen.
In the experimental procedure outlined in Experiment 2, only the collagen is reduced when collagenase is injected; therefore, for the purpose of these simulations, we assume that the tumours contain the same number of uninfected cells in both scenarios. We use
where w* = 0.9. The initial conditions ensure that we begin below carrying capacity. Where virotherapy is administered, we inject 106 viral particles on day 0 and day 2, in line with experiments. We assume the initial virus injection radius is 1 mm, giving a virus injection dose of V (r, 0) = 106/(4/3π(1)3) ≈ 2.4 × 10⁵ viruses mm−3 for r ≤ 1 mm and 0 otherwise. The conditions described can be seen in Figures 3A,B. We note that adopting radial symmetry means the tumour contains regions of cells and collagen in almost concentric spherical shells. Although this kind of symmetry is idealised, we believe it is a good starting point. We study other types of collagen distribution in Section 2.10.
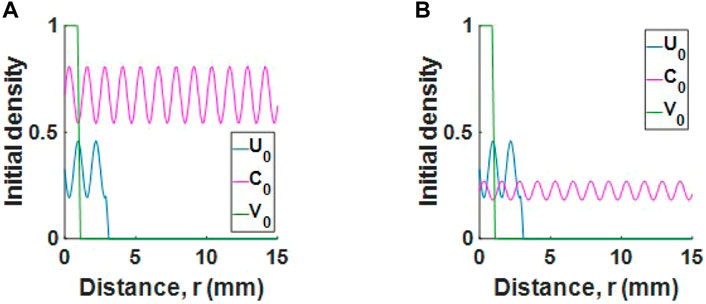
FIGURE 3. Initial conditions for a tumour with (A) high collagen or (B) low collagen. For readability, populations U and V are scaled by 106 and 2.4 × 10⁵ respectively.
To better understand how changes in parameters affect tumour outcome, we perform a global sensitivity analysis. We use Latin Hypercube Sampling to generate 500 samples from the parameter space over the range ±50% of basal values, given in Table 2. We then simulate our model and calculate the Spearman rank correlation coefficient (SRCC) between each parameter and total fold change in tumour volume integrated over the time interval [0, tend]. As P(t) (given in Eq. 10) represents the total population of tumour cells at time t, then the total tumour population from t = 0 to t = tend is
This metric is used to neutralise the effect of oscillations. For these simulations, we give a single virus dose of 2.4 × 10⁵ viruses mm−3 for r ≤ 1mm at t = 0, as defined in Section 2.7. We calculate the SRCC short term (tend = 5 days) and long term (tend = 20 days).
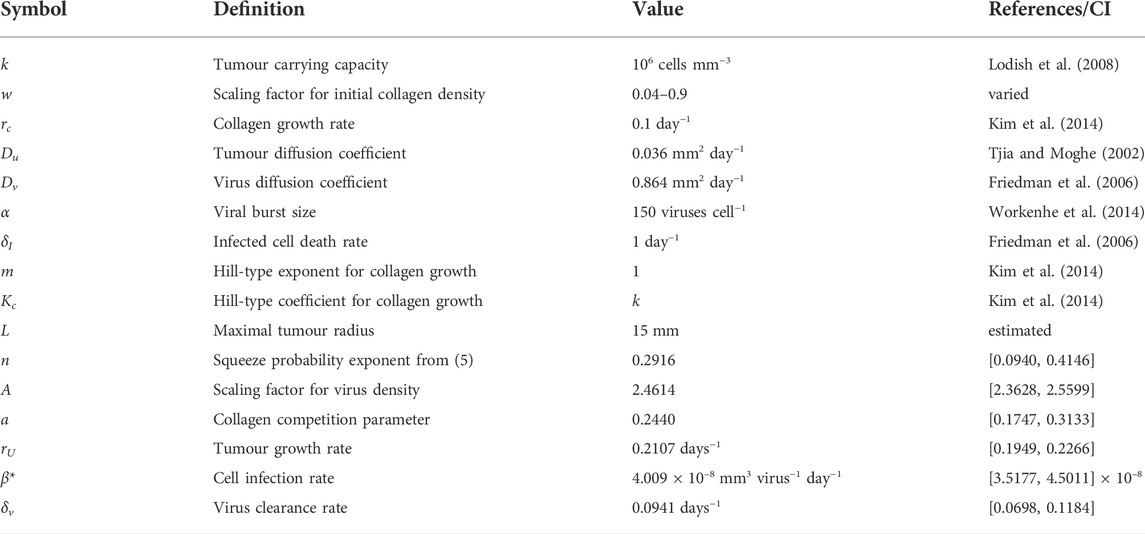
TABLE 2. Parameter estimates for virotherapy model.
We also run this analysis for a tumour with an exponentially decreasing initial collagen profile, C (r, 0) = we−qr and compare the SRCC results between a high collagen tumour and a low collagen tumour. The equation for initial tumour cell population is
Next, we perform a local sensitivity analysis to investigate how perturbations in two of our sensitive parameters, selected from SRCC analysis, affect tumour response in low and high collagen. We choose one parameter that promotes tumour growth and one parameter that promotes tumour hindrance. We begin with the initial conditions for tumour cells and collagen as described in Section 2.7, namely, Eq. 11 for collagen and Eq. 12 for uninfected tumour cells. We administer a single virus dose V (r, 0) = 2.4 × 10⁵ viruses mm−3 for r ≤ 1 mm and 0 otherwise. We vary the parameters ±50% about the basal values and track tumour fold change over 50 days. All other parameter values are fixed, as given in Table 2. We track tumour fold change in time over 50 days. If the tumour reaches a 10-fold increase, we terminate treatment. This is the tumour size where the mice either died or were euthanised, as outlined in experimental procedure.
In this section we explore the success of virotherapy in relation to desmoplastic reaction in tumours. Desmoplastic reaction is the growth of fibrous tissue around cancer cells. The aim is to understand how virotherapy will perform in clinically observed collagen formations. Clinical trials performed by Ueno et al. (Ueno et al., 2004, 2015, 2021) investigated the link between the stage of collagen formation and patient survival. In these trials, patients received surgical adjuvant chemotherapy. Desmoplastic reaction was characterised in three phases: mature desmoplastic reaction, intermediate desmoplastic reaction and immature desmoplastic reaction. These phases correspond to early, intermediate and late stage formations of collagen respectively.
Consider a section of a large tumour with uninfected cells and collagen. We use a series of Heaviside step functions
to describe initial collagen and cell densities, as in Figure 4A, where d represents the thickness of tumour cell region and h represents the thickness of collagen region (or thickness of collagen fibres). The initial collagen density
where w is the scaling factor and q is the centre line. The initial tumour cell population is
so that the total initial tumour and collagen populations fill the space up to carrying capacity.
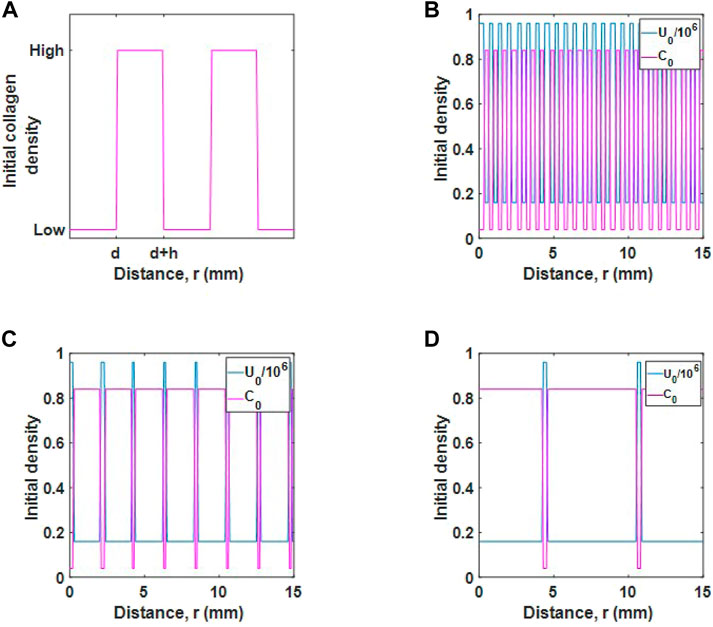
FIGURE 4. Initial populations for different desmoplastic reactions. (A) Schematic diagram of initial collagen distribution. The parameter d represents the thickness of tumour cell regions and h represents the thickness of collagen regions. (B) Initial tumour cell and collagen density for a mature desmoplastic reaction, (C), intermediate desmoplastic reaction and (D), immature desmoplastic reaction.
We consider three initial populations for cells and collagen, as described in Ueno et al. (Ueno et al., 2021). The cases are as follows:
• Mature desmoplastic reaction, as in Figure 4B. In this case, tumour cells are well distributed in collagen and the collagen fibres are fine. For this case d = h and the populations are relatively well mixed.
• Intermediate desmoplastic reaction, as in Figure 4C. In this case, collagen fibres are thicker and the collagen distribution is wider. The tumour cells are distributed in smaller regions such that d < h.
• Immature desmoplastic reaction, as in Figure 4D. In this case, regions where collagen deposits exist is increased further so that there is an even smaller number of tumour cells, d ≪ h.
We inject a viral dose of 2.4 × 10⁵ viruses mm−3 for r ≤ 1 mm, as before. Note, collagen maximum (0.84) and minimum (0.04) values are the same in each case.
We simulate the three diffusion cases described by Eqs 2–4 and identify which diffusion term best describes the experimental observation that virus moves to regions of low collagen density. To do this, we simulate the scenario from McKee et al. (2006) as outlined in Section 2.3. Our aim is to find a virus dispersion profile that matches the experimental observation from McKee et al. (2006), recreated in Figure 1. In this figure, the virus profile reaches a sigmoidal shape after 30 min.
We first define a function for collagen concentration by fitting C(x) to the normalised collagen data as in Figure 5A, obtaining a sigmoidal curve of the form
where b1 = −0.5574, b2 = 0.3198 and b3 = 0.778.
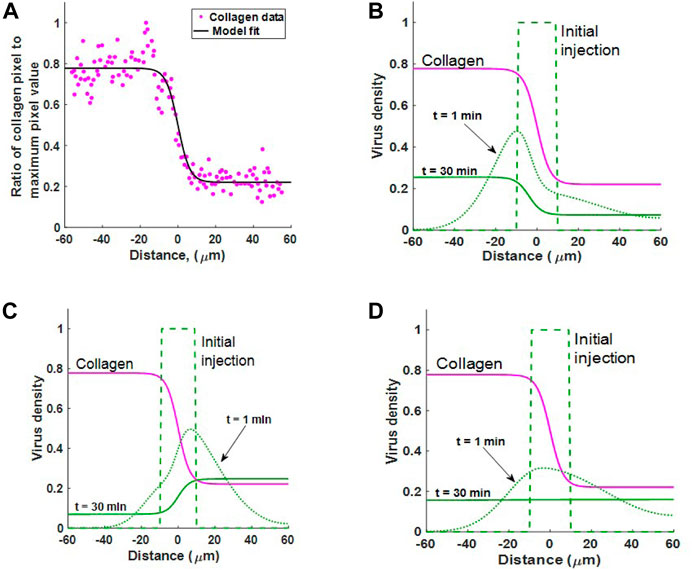
FIGURE 5. (A) Estimating collagen concentration C(x) by fitting a sigmoidal function (18) to the collagen data from (McKee et al., 2006, Figure 1B). Fit conducted using MATLAB’s Curve Fitting Toolbox. Goodness of fit: sum-of-squares estimate of errors (SSE) = 0.6498 and R2 = 0.9318. (B–D) Simulating experimental results from McKee et al. (2006). The diffusion of virus in an inhomogeneous collagen environment for 30 min. In all three cases the virus is initially injected in the region − 10 ≤ x ≤ 10. Collagen density C(x) (pink line) changes dramatically about x = 0. Case 1 Viral motion depends on collagen density in the current location, as in Eq. 2. Case 2: Viral motion depends on collagen density in adjacent locations, as in Eq. 3. Case 3: Spread of viruses under Fickian diffusion as in Eq. 4. Case 2 best describes experimental observation where virus moves to regions of low collagen density.
We now simulate virus dispersion for virus under each diffusion term in Eqs 2–4. Figures 5B–D show virus diffusion in 30 min for Cases 1, 2 and 3 respectively. The pink solid line represents collagen density C(x). Clearly, we see that Case 1 cannot describe virus diffusion in collagen as the majority of virus has moved into the collagen dense region in 30 min, represented by the solid green line. In Case 2, we see that virus diffuses much faster in the region with low collagen (x > 0). There is also bulk motion across the boundary at x = 0 so that the virus population migrates from left to right. The end result at 30 min is consistent with the sigmoidal shape observable in the results from Mackee et al., Figure 1. Importantly, once the virus moves into the low collagen region it will remain in this region. In Supplementary Section S2.1, we confirm that this profile is the steady state solution to 3) for any diffusion coefficient D(x), when no-flux boundary conditions are applied.
In Case 3, the Fickian case, the virus initially diffuses faster in the lower collagen region; however, at t = 30 the virus has reached a homogeneous state, distributed evenly in collagen. Importantly, this result demonstrates that Fickian diffusion does not describe virus distribution in relation to collagen density and is, therefore, not a good candidate for virus diffusion in collagen-dense tumours. In Supplementary Section S2.2, we also show that under Fickian diffusion, the steady-state solution with any diffusion coefficient D(x) and no-flux boundary conditions will be constant.
The simulations in this section highlight that preferential virus diffusion to regions of low collagen density only occurs in Case 2 and Case 3 (Fickian case). However, Case 2 is the only scenario where the virus remains in the low-collagen region. Since Case 2 is the scenario that best describes experimental observations, we disregard the other cases and build a virotherapy model using Eq. 3 as our virus diffusion term.
In the previous section we used a linear equation to describe the relationship between squeeze probability and collagen density. Now that we have identified the diffusion term that qualitatively matches experimental results, we consider the generalised form of Eq. 5 and fit n to virus data, Mckee et al. Figure 1, to obtain a better estimate of squeeze probability in relation to collagen. In Figure 6A, we have the optimal fits for the linear squeeze probability, where A is fitted and n = 1, and the nonlinear squeeze probability, where both A and n are fitted. From these results, we choose the nonlinear squeeze probability to describe the change in diffusion as collagen changes. The optimal fit for n at 0.2916 suggests that changes in virus diffusion with respect to collagen density is not a simple linear relationship. With n set at this value and plotting Eq. 5 in Figure 5B, we see that collagen concentration, even at low levels, can greatly impact virus diffusion. For example, at 20% collagen (to maximum collagen density), the squeeze probability reduces to approximately 0.4. Note, using the fitted value for n, will not change the qualitative behaviour observed in Figure 5. From here, we set n to the fitted value.
FIGURE 6. Optimal fit to virus data from Mckee et al. (McKee et al., 2006). (A) Virus diffusion in 30 min is modelled by (5) using a linear squeeze probability with n = 1 (dashed line) and a nonlinear squeeze probability with n = 0.2916 (solid line). (B) The plot for Eq. 5 with n = 0.2916 suggests a significant reduction in virus diffusion even at low collagen levels.
Before we optimise some of the parameters from the virotherapy model described in Section 2.5, we first generalise the derivation of Eq. 3 to three dimensions, then transform this equation to spherical geometry with radial symmetry. Therefore, the virus diffusion term in Eq. 7 is
The derivation for this term can be found in Supplementary Section S3.
We first fit tumour proliferation rate ru and competition parameter a to the tumour growth data treated with PBS or collagenase. In both data sets, there is no virus treatment, so we set initial virus population V (r, 0) = 0, and there are no infected cells, so I (r, 0) = 0. Our system reduces to
The optimal fit for ru and a can be seen in Figure 7A (PBS treatment where collagen is high) and Figure 7B (collagenase treatment where collagen is degraded).
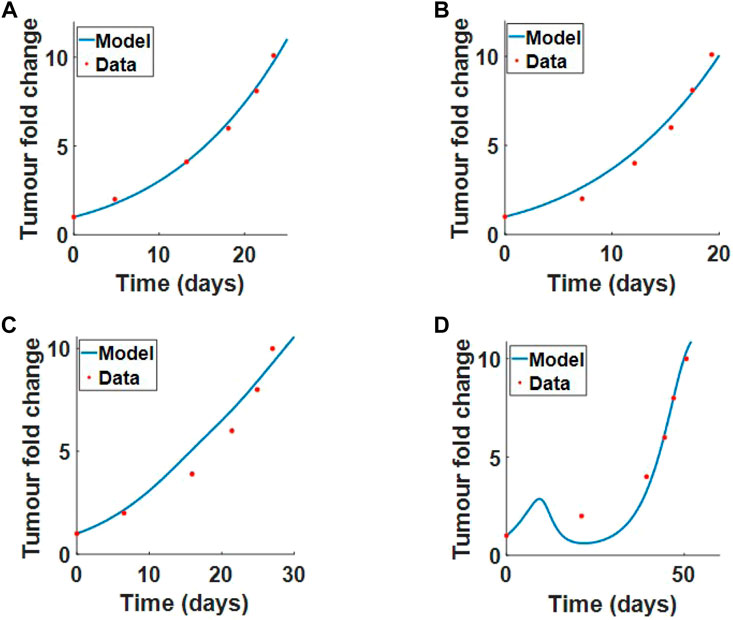
FIGURE 7. Model parameters fitted to the results from (McKee et al., 2006), Experimental procedure 2 in Section 2.1. We fit ru and a simultaneously to tumour fold change data when treated with (A) PBS or (B) collagenase. We fit β and δv simultaneously to tumour fold change data for (C) virus treatment alone or (D) virus treatment with coinjection of collagenase. Results from the fits are outline in Table 2.
Next, we fit the virus infection rate β* and virus decay rate δv simultaneously to virus treatment alone and virus treatment with coinjection of collagenase. The initial conditions for the tumour and collagen remain the same. The model fit to data for virotherapy in high collagen (no collagenase) and low collagen (coinjection of collagenase) can be seen respectively in Figures 7C,D. These results clearly demonstrate that our model can successfully describe virotherapy outcome with respect to high and low collagen tumours. The model shows that high-density collagen reduces virus diffusion and infection, overall reducing virus efficacy.
All estimated and optimised parameters (including 95% confidence intervals) can be found in Table 2. Using a profile likelihood approach, Simpson et al. (Simpson et al., 2020) investigated practical identifiability of a spatio-temporal, biological model. We also perform a practical identifiability analysis for our optimised parameters, following the approach described in (Eisenberg and Jain, 2017), where the likelihood profile is defined as the minimum sum of squares. The details of this analysis can be found in Supplementary Section S4. The likelihood profiles in Supplementary Figure S2, Supplementary Section S4, clearly indicate that the parameters are identifiable.
We now run a global sensitivity analysis to investigate how changes in parameters affect tumour outcome. The results from the Spearman rank correlation coefficient (SRCC) analysis are presented in Figures 8A,B. At t = 5 days, the tumour outcome is primarily driven by tumour growth ru. Longer term, t = 20 days, infection rate β*, viral burst size α and tumour carrying capacity k emerge as drivers in the system. The results from the two chosen time-points suggest that during the early phase of treatment, tumour size is determined by tumour growth rate and not by the parameters that control treatment, that is, α and β. Interestingly, the carrying capacity k has a negative effect on tumour size. This is because our initial tumour density, Eq. 12, is scaled by k so that as k increases we have a larger uninfected cell count at t = 0. This increases cell infection and overall virus activity, as a result, tumour size is reduced. The SRCC and p-values for Figure 8 can be found in Table 3.
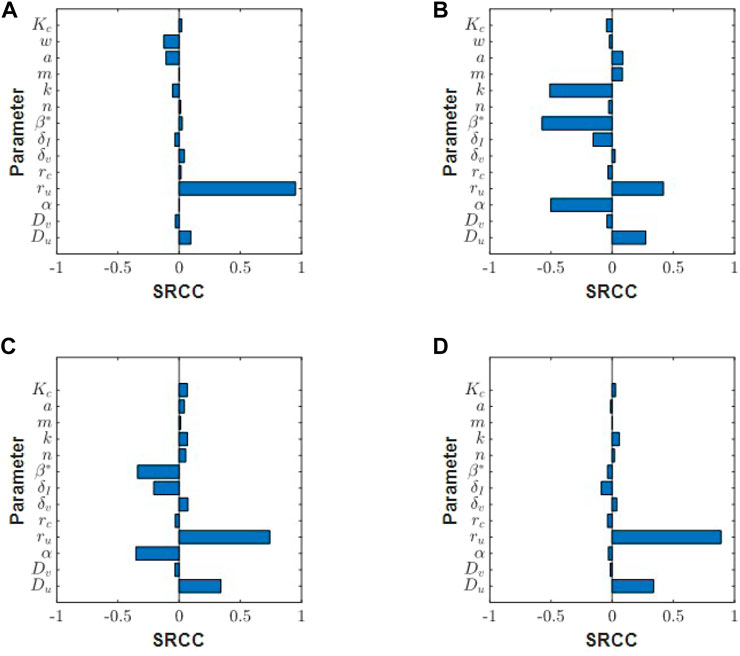
FIGURE 8. Spearman ranked correlation coefficients (SRCC) between model parameters and total tumour volume integrated over the time interval [0, tend] for (A) tend = 5 days and (B) tend = 20 days. SRCC analysis at tend = 15 days for (C) low collagen tumour (w = 0.1) and (D) high collagen tumour (w = 0.85).
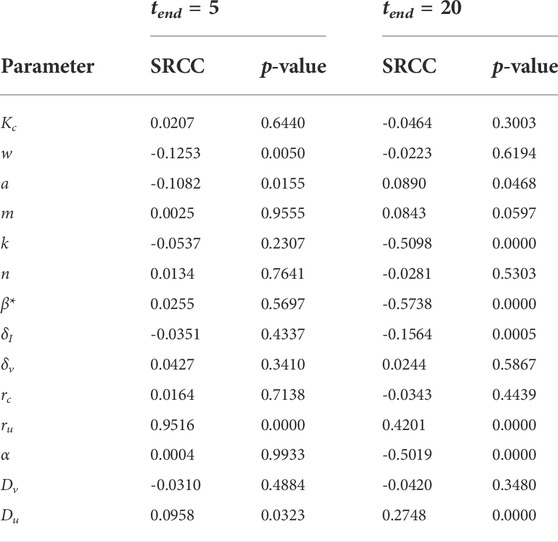
TABLE 3. Spearman ranked correlation coefficient (SRCC) between model parameters and total tumour population over the time interval [0, tend].
Next, we run this analysis for a tumour with an exponentially decreasing initial collagen profile, and compare the SRCC results between a high collagen tumour and a low collagen tumour. In this scenario, tumour cells and collagen are denser in the centre, and collagen density decays in the direction of tumour boundary. Using this initial profile, we see different responses in high and low collagen tumours. Early in the treatment at t = 5 days, tumour growth rate drives the system in both low and high collagen tumours (results not shown). At t = 15 days, the low collagen tumour begins to show sensitivity to virotherapy parameters, β and α, Figure 8C. The high-collagen tumour remains insensitive to these parameters, as in Figure 8D. At t = 30 days, the SRCC analysis between the low and high collagen tumour begin to look similar (results not shown), with both tumours showing sensitivity to treatment parameters β and α. This result indicates that low-collagen tumours respond earlier and more efficiently to treatment than high-collagen tumours. The lack of virus dispersion and uneven distribution in high-collagen tumours greatly reduces the efficacy of treatment.
Using the SRCC analysis above, we now select two parameters that drive tumour response and perturb these parameters in high and low collagen to see if there is a difference in response. We choose one parameter that promotes tumour growth, ru, and one parameter that promotes tumour hindrance, β*. Figures 9A,B show the tumour fold change as ru is perturbed in low and high collagen respectively. In low collagen, the single virus dose causes a reduction back to the original size at around day 20. This result occurs for all tested growth rates. Slower growth rates continue to remain well below 10-fold increase by the end of 50 days. In high collagen, there is an almost monotonic growth at all growth rates, demonstrating a lack of response to treatment. The analysis suggests that virotheapy may not be effective in high-collagen tumours, regardless of tumour growth rate. Figures 9C,D describe a scenario where virus infectivity is enhanced. Similar to results for tumour growth rate, low-collagen tumour responds well to a single treatment at all infection rates with the exception of the lowest rate. Notice that the time to initial response decreases as infection rate is increased. The high-collagen tumour does not respond at low infection rate and only partially responds with higher infection rates. The results here suggest that only minor improvements may be achieved in high-collagen tumours by increasing the infectivity of virus.
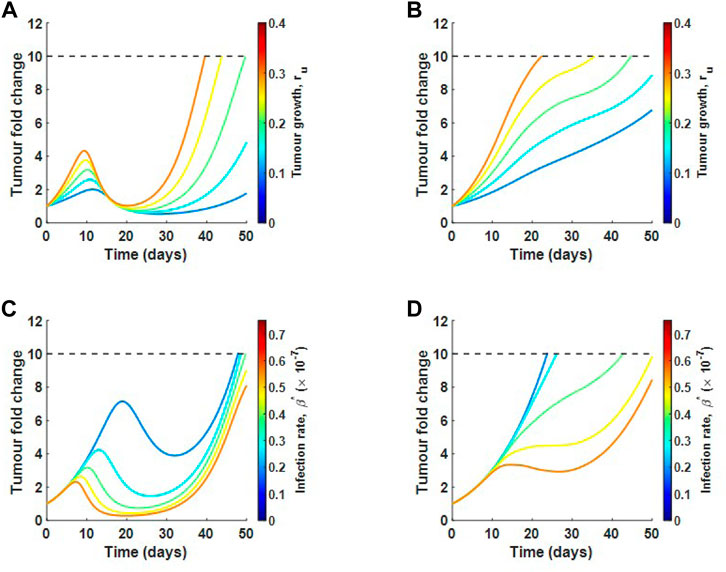
FIGURE 9. Local sensitivity analysis for tumour growth rate ru and infection rate β in relation to tumour fold change. Varying ru in (A) low collagen and in (B) high collagen. Varying β in (C) low collagen and in (D) high collagen. Dotted line represents the maximum allowable tumour size.
One limitation of the model is the lack of data measuring virus diffusion in the context of a collagen-rich tumour; therefore, we investigate the sensitivity of our model results with respect to virus diffusion constant Dv. The results for this analysis can be seen in Supplementary Figure S3, Supplementary Section S5. As Dv is increased, the collagen-dense tumour does not change its response. The low-collagen tumour will respond better to treatment as virus diffusion rate is increased; however, at very high diffusion rates, virus efficacy significantly decreases as the virus moves too quickly out of the tumour sphere, where cancer cells reside, before a significant number of cells are infected. These results are qualitatively similar to what we obtained before, showing that our model predictions qualitatively remain the same over a wide range of Dv.
We now investigate virotherapy in relation to clinically observed collagen formations. We consider mature, intermediate and immature desmoplastic reactions. The result in Figure 10A suggests that treatment using virotherapy is most successful in mature collagen, where collagen fibres are finer than in intermediate or immature collagen. This is in agreement with the observations from Ueno et al. Since in all three cases, collagen density begins in the same range, the difference between cases is in the thickness of collagen region. For the mature collagen, the virus is successful at killing the tumour at approximately day 30 (result not shown). In Figures 10B,C, we see very different virus profiles at day 25 of treatment between mature and immature desmoplastic reactions. Figure 10B shows that the virus in immature collagen is trapped in a low collagen region, while Figure 10C shows that the virus in mature collagen, is spreading efficiently in the tumour environment. Interestingly, although we begin with a much smaller cell count in immature collagen, the virus is not able to control tumour growth.
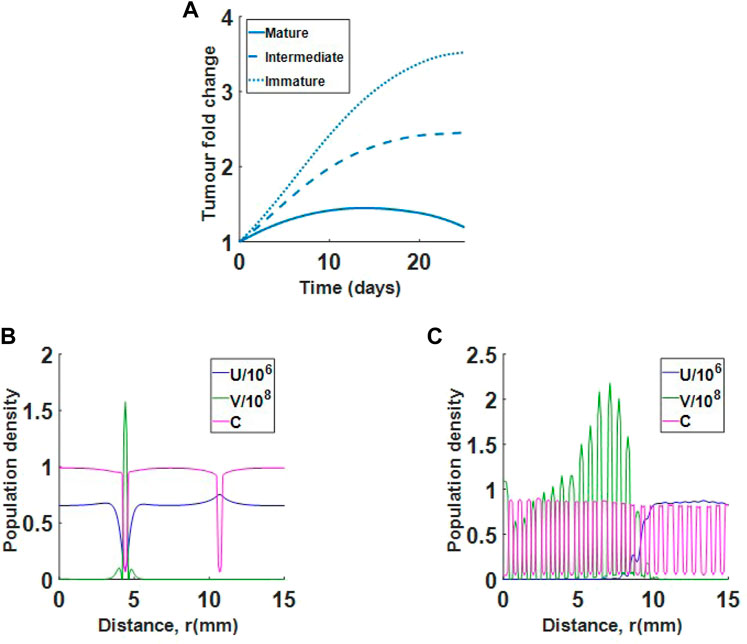
FIGURE 10. Single virus injection in tumour with mature collagen, intermediate collagen and immature collagen. (A) Results show that immature and intermediate collagen do not respond well to treatment. (B) Population profiles at day 25 for virotherapy in immature collagen. The virus (green) is trapped in a low collagen region. (C) Population profiles at day 25 for virotherapy in mature collagen. Virus is spreading efficiently in the tumour environment.
We also investigate how changes in collagen density alter treatment results. In Figure 11A, we show how reducing the maximum collagen density for the immature collagen scenario changes treatment outcome. Holding the minimum collagen value at 0.04, we see that reducing the maximum collagen can increase virus efficacy. For the mature collagen bundles, where collagen fibres are finer, we find that increasing minimum collagen density, while holding the maximum at 0.84, does not significantly change viral efficacy, as in Figure 11B. The results indicate that finer collagen fibres, even at higher densities, may still respond well to treatment. Overall, the model suggests that collagen orientation and density both contribute to tumour response.
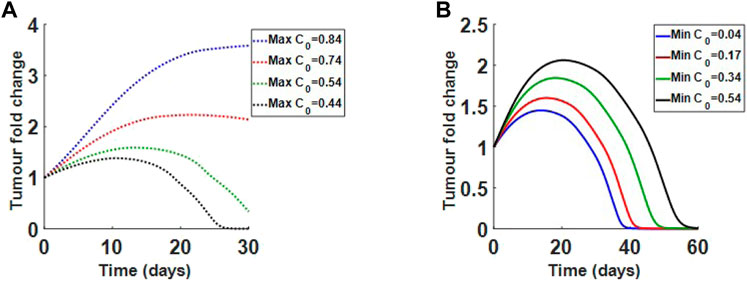
FIGURE 11. Varying initial collagen density for immature and mature desmoplastic reaction. (A) Decreasing initial maximum density for immature collagen from 0.84 to 0.44, while holding minimum density at 0.04. Lower densities respond to treatment. (B) Increasing initial minimum density for mature collagen from 0.04 to 0.54, while holding maximum density at 0.84. Even at higher densities the tumour responds to treatment.
The lack of virus diffusion in collagen-dense tumours is a major challenge in oncolytic virotherapy. Putting other factors aside, this therapy requires a relatively homogeneous distribution of virus in the tumour environment. Experiments have shown that viral vectors move to regions of low collagen density and this behaviour significantly contributes to lack of efficacy; therefore, an accurate depiction of virus diffusion with respect to collagen density is an important aspect when modelling virotherapy.
In this paper, we aimed to find a diffusion term that successfully describes virus dispersion in collagen. Beginning with a random walk, we derived three possible diffusion terms for virus dispersion. One of these terms (Case 3) is the Fickian diffusion term, commonly used in spatial virotherapy models. The other two are nonstandard, non-Fickian diffusion terms.
Simulating virus propagation in collagen for each diffusion term, we found that Case 2, described by Eq. 3, experienced bulk motion in the direction of low collagen density, as in Figure 5C. This result is in good agreement with experiments by Mackee et al. (McKee et al., 2006). Case 3, where virus dispersion is modelled under Fickian diffusion, resulted in initially faster spread into regions of low-collagen density; however, this behaviour is transient and virus will always move to a homogeneous steady state, spreading evenly in the tumour environment regardless of collagen density, as in Figure 5D.
We then explored the tumour response to virotherapy by using a PDE system of reaction-diffusion equations, where virus diffusion is described by the diffusion term in Eq. 14, the spherical transformation of Eq. 3. The model successfully captured the changes in treatment outcome between collagen-dense and collagen-sparse tumours. Using a global sensitivity analysis we found that the parameters driving treatment, namely infection rate, β, and viral burst size, α, do not become significant until around 20 days, as in Figures 8A,B. This sensitivity also depends on the initial collagen distribution. For example, as we saw in Figures 8C,D tumour with a dense centre and sparse boundary will have an early response to treatment if collagen density is low.
Next, we did a local sensitivity analysis, taking a closer look at the difference in response between high and low-collagen tumours. We used two of the most sensitive parameters, one that drives tumour progression, ru, and one that drives tumour hindrance, β. The analysis showed that low-collagen tumours respond much more robustly to treatment, even at higher tumour growth rates and lower infection rates, as in Figure 9. This result suggests that degradation of collagen in dense tumours might be the only viable approach to reducing tumour size as modifications in other parameters, such as increased infectivity or changes aimed at slowing cell doubling rate, do not seem to be effective.
Lastly, we looked at how changes in collagen structure alter treatment outcome. We found that tumours with finer sections of collagen (mature collagen) respond much better to treatment than tumours with thicker sections of collagen (intermediate and immature collagen), as in Figure 10. This result is in agreement with experimental findings from Ueno et al. (Ueno et al., 2004; Ueno et al., 2015; Ueno et al., 2021). We also investigated how changes in collagen density affect treatment of tumours with immature and mature collagen profiles. Interestingly, we found that although tumours with immature collagen become more responsive as collagen density is decreased, tumours with mature collagen continue to respond to treatment even at high collagen levels, as in Figure 11. This result shows that collagen structure in the tumour environment is as important to treatment outcome as collagen density.
Collectively, the results in this paper, highlight the importance of accurately modelling the interaction between treatment, in this case virotherapy, and tumour stroma such as collagen. A good extension of this work would be to include tumour-infiltrating immune cells. It is well documented that virotherapy can activate an immune response which can be harnessed to kill cancer cells (Gujar et al., 2018; Russell et al., 2019). Collagen density has been shown to reduce immune cell infiltration. In their experiments Kuczek et al. (2019) found a significant reduction in infiltrating CD8+ T cells when collagen density was increased in mammary tumours. Including the dynamics of T-cells, tumour cells and collagen would be a natural extension and could help in identifying combinations of characteristics that hinder treatment outcome.
Finally, lack of dispersion of nanoscale particles in collagen-rich tumours is not unique to virotherapy and is a common problem in many types of cancer treatments (Henke et al., 2020). We believe that our novel diffusion term can easily translate to models investigating other modes of therapy. Overall, our model demonstrates that the effect of collagen on therapy dispersion may be significant to treatment outcome and should be considered when modelling treatment of collagen-dense tumours.
The original contributions presented in the study are included in the article/Supplementary Material, further inquiries can be directed to the corresponding author.
PP and PK conceived and designed the modelling and analysis. PP performed the simulations and formal analysis. PP wrote the manuscript and PK edited.
PK was partially supported by an Australian Research Council Discovery Project (DP180101512). PP was partially supported by the Australian Mathematically Society Lift-off Fellowship.
The authors would like to thank Prof Matthew Simpson (Queensland University of Technology, Brisbane, Australia) for his advice on identifiability analysis.
The authors declare that the research was conducted in the absence of any commercial or financial relationships that could be construed as a potential conflict of interest.
All claims expressed in this article are solely those of the authors and do not necessarily represent those of their affiliated organizations, or those of the publisher, the editors and the reviewers. Any product that may be evaluated in this article, or claim that may be made by its manufacturer, is not guaranteed or endorsed by the publisher.
The Supplementary Material for this article can be found online at: https://www.frontiersin.org/articles/10.3389/fsysb.2022.903512/full#supplementary-material
Abyaneh, H. S., Regenold, M., McKee, T. D., Allen, C., and Gauthier, M. A. (2020). Towards extracellular matrix normalization for improved treatment of solid tumors. Theranostics 10, 1960–1980. doi:10.7150/thno.39995
Alzahrani, T., Eftimie, R., and Trucu, D. (2019). Multiscale modelling of cancer response to oncolytic viral therapy. Math. Biosci. 310, 76–95. doi:10.1016/j.mbs.2018.12.018
Bellail, A. C., Hunter, S. B., Brat, D. J., Tan, C., and Van Meir, E. G. (2004). Microregional extracellular matrix heterogeneity in brain modulates glioma cell invasion. Int. J. Biochem. Cell Biol. 36, 1046–1069. doi:10.1016/j.biocel.2004.01.013
Boemo, M. A., and Byrne, H. M. (2019). Mathematical modelling of a hypoxia-regulated oncolytic virus delivered by tumour-associated macrophages. J. Theor. Biol. 461, 102–116. doi:10.1016/j.jtbi.2018.10.044
Camara, B. I., Mokrani, H., and Afenya, E. K. (2013). Mathematical modeling of glioma therapy using oncolytic viruses. Math. Biosci. Eng. 10, 565–578. doi:10.3934/mbe.2013.10.565
Chen, J., Dang, Q., Unutmaz, D., Pathak, V. K., Maldarelli, F., Powell, D., et al. (2005). Mechanisms of nonrandom human immunodeficiency virus type 1 infection and double infection: preference in virus entry is important but is not the sole factor. J. Virol. 79, 4140–4149. doi:10.1128/JVI.79.7.4140-4149.2005
Choi, I., Lee, Y., Yoo, J., Yoon, A., Kim, H., Kim, D., et al. (2010). Effect of decorin on overcoming the extracellular matrix barrier for oncolytic virotherapy. Gene Ther. 17, 190–201. doi:10.1038/gt.2009.142
Choi, I.-K., Strauss, R., Richter, M., Yun, C.-O., and Lieber, A. (2013). Strategies to increase drug penetration in solid tumors. Front. Oncol. 3, 193. doi:10.3389/fonc.2013.00193
Cohen, F. S. (2016). How viruses invade cells. Biophys. J. 110, 1028–1032. doi:10.1016/j.bpj.2016.02.006
Dixit, N. M., and Perelson, A. S. (2005). Hiv dynamics with multiple infections of target cells. Proc. Natl. Acad. Sci. U. S. A. 102, 8198–8203. doi:10.1073/pnas.0407498102
Dmitrieva, N., Yu, L., Viapiano, M., Cripe, T. P., Chiocca, E. A., Glorioso, J. C., et al. (2011). Chondroitinase abc i–mediated enhancement of oncolytic virus spread and antitumor efficacy. Clin. Cancer Res. 17, 1362–1372. doi:10.1158/1078-0432.CCR-10-2213
Eisenberg, M. C., and Jain, H. V. (2017). A confidence building exercise in data and identifiability: Modeling cancer chemotherapy as a case study. J. Theor. Biol. 431, 63–78. doi:10.1016/j.jtbi.2017.07.018
Fountzilas, C., Patel, S., and Mahalingam, D. (2017). Review: Oncolytic virotherapy, updates and future directions. Oncotarget 8, 102617–102639. doi:10.18632/oncotarget.18309
Friedman, A., and Lai, X. (2018). Combination therapy for cancer with oncolytic virus and checkpoint inhibitor: A mathematical model. PLoS One 13, e0192449. doi:10.1371/journal.pone.0192449
Friedman, A., Tian, J. P., Fulci, G., Chiocca, E. A., and Wang, J. (2006). Glioma virotherapy: effects of innate immune suppression and increased viral replication capacity. Cancer Res. 66, 2314–2319. doi:10.1158/0008-5472.CAN-05-2661
Gladson, C. L. (1999). The extracellular matrix of gliomas: modulation of cell function. J. Neuropathol. Exp. Neurol. 58, 1029–1040. doi:10.1097/00005072-199910000-00001
Gujar, S., Pol, J. G., Kim, Y., Lee, P. W., and Kroemer, G. (2018). Antitumor benefits of antiviral immunity: an underappreciated aspect of oncolytic virotherapies. Trends Immunol. 39, 209–221. doi:10.1016/j.it.2017.11.006
Henke, E., Nandigama, R., and Ergün, S. (2020). Extracellular matrix in the tumor microenvironment and its impact on cancer therapy. Front. Mol. Biosci. 6, 160. doi:10.3389/fmolb.2019.00160
Jenner, A. L., Smalley, M., Goldman, D., Goins, W. F., Cobbs, C. S., Puchalski, R. B., et al. (2022). Agent-based computational modeling of glioblastoma predicts that stromal density is central to oncolytic virus efficacy. iScience 25, 104395. doi:10.1016/j.isci.2022.104395
Jin, K.-T., Du, W.-L., Liu, Y.-Y., Lan, H.-R., Si, J.-X., and Mou, X.-Z. (2021). Oncolytic virotherapy in solid tumors: The challenges and achievements. Cancers 13, 588. doi:10.3390/cancers13040588
Jung, A., Maier, R., Vartanian, J.-P., Bocharov, G., Jung, V., Fischer, U., et al. (2002). Recombination: Multiply infected spleen cells in HIV patients. Nature 418, 144. doi:10.1038/418144a
Karasneh, G. A., and Shukla, D. (2011). Herpes simplex virus infects most cell types in vitro: clues to its success. Virol. J. 8, 481–511. doi:10.1186/1743-422X-8-481
Kim, Y., Lee, H. G., Dmitrieva, N., Kim, J., Kaur, B., and Friedman, A. (2014). Choindroitinase abc i-mediated enhancement of oncolytic virus spread and anti tumor efficacy: a mathematical model. PLoS One 9, e102499. doi:10.1371/journal.pone.0102499
Kuczek, D. E., Larsen, A. M. H., Thorseth, M.-L., Carretta, M., Kalvisa, A., Siersbæk, M. S., et al. (2019). Collagen density regulates the activity of tumor-infiltrating t cells. J. Immunother. Cancer 7, 68–15. doi:10.1186/s40425-019-0556-6
Lee, T., Jenner, A. L., Kim, P. S., and Lee, J. (2020). Application of control theory in a delayed-infection and immune-evading oncolytic virotherapy. Math. Biosci. Eng. 17, 2361–2383. doi:10.3934/mbe.2020126
Li, J., Li, X., Lan, T., Qi, C., He, X., Yang, H., et al. (2014). Type i collagen secreted by lung cancer cells promotes cancer cell growth in a three-dimensional culture system. Nan Fang. Yi Ke Da Xue Xue Bao 34, 1129–1134.
Li, Y., Wei, Y., Tang, W., Luo, J., Wang, M., Lin, H., et al. (2019). Association between the degree of fibrosis in fibrotic focus and the unfavorable clinicopathological prognostic features of breast cancer. PeerJ 7, e8067. doi:10.7717/peerj.8067
Lodish, H., Berk, A., Kaiser, C. A., Krieger, M., Scott, M. P., Bretscher, A., et al. (2008). Molecular cell biology. New York: Macmillan.
Malinzi, J., Eladdadi, A., and Sibanda, P. (2017). Modelling the spatiotemporal dynamics of chemovirotherapy cancer treatment. J. Biol. Dyn. 11, 244–274. doi:10.1080/17513758.2017.1328079
McKee, T. D., Grandi, P., Mok, W., Alexandrakis, G., Insin, N., Zimmer, J. P., et al. (2006). Degradation of fibrillar collagen in a human melanoma xenograft improves the efficacy of an oncolytic herpes simplex virus vector. Cancer Res. 66, 2509–2513. doi:10.1158/0008-5472.CAN-05-2242
Moaven, O., Mangieri, C. W., Stauffer, J., A., Anastasiadis, P. Z., and Borad, M. J. (2021). Evolving role of oncolytic virotherapy: Challenges and prospects in clinical practice. JCO Precis. Oncol. 5, 432–441. doi:10.1200/PO.20.00395
Painter, K. J., and Hillen, T. (2002). Volume-filling and quorum-sensing in models for chemosensitive movement. Can. Appl. Math. Q. 10, 501–543.
Phan, D., and Wodarz, D. (2015). Modeling multiple infection of cells by viruses: Challenges and insights. Math. Biosci. 264, 21–28. doi:10.1016/j.mbs.2015.03.001
Pickup, M. W., Mouw, J. K., and Weaver, V. M. (2014). The extracellular matrix modulates the hallmarks of cancer. EMBO Rep. 15, 1243–1253. doi:10.15252/embr.201439246
Pooladvand, P., Yun, C.-O., Yoon, A.-R., Kim, P. S., and Frascoli, F. (2020). The role of viral infectivity in oncolytic virotherapy outcomes: A mathematical study. Math. Biosci. 334, 108520. doi:10.1016/j.mbs.2020.108520
Rohatgi, A. (2022). Webplotdigitizer: Version 4.6. Available at: https://automeris.io/WebPlotDigitizer.
Russell, L., Peng, K. W., Russell, S. J., and Diaz, R. M. (2019). Oncolytic viruses: priming time for cancer immunotherapy. BioDrugs 1–17, 485–501. doi:10.1007/s40259-019-00367-0
Simbawa, E., Al-Johani, N., and Al-Tuwairqi, S. (2020). Modeling the spatiotemporal dynamics of oncolytic viruses and radiotherapy as a treatment for cancer. Comput. Math. Methods Med. 2020, 3642654. doi:10.1155/2020/3642654
Simpson, M. J., Baker, R. E., Vittadello, S. T., and Maclaren, O. J. (2020). Practical parameter identifiability for spatio-temporal models of cell invasion. J. R. Soc. Interface 17, 20200055. doi:10.1098/rsif.2020.0055
Tjia, J. S., and Moghe, P. V. (2002). Regulation of cell motility on polymer substrates via” dynamic, ” cell internalizable, ligand microinterfaces. Tissue Eng. 8, 247–261. doi:10.1089/107632702753725012
Ueno, H., Jones, A. M., Wilkinson, K. H., Jass, J., and Talbot, I. (2004). Histological categorisation of fibrotic cancer stroma in advanced rectal cancer. Gut 53, 581–586. doi:10.1136/gut.2003.028365
Ueno, H., Shinto, E., Shimazaki, H., Kajiwara, Y., Sueyama, T., Yamamoto, J., et al. (2015). Histologic categorization of desmoplastic reaction: its relevance to the colorectal cancer microenvironment and prognosis. Ann. Surg. Oncol. 22, 1504–1512. doi:10.1245/s10434-014-4149-9
Ueno, H., Ishiguro, M., Nakatani, E., Ishikawa, T., Uetake, H., Murotani, K., et al. (2021). Prognostic value of desmoplastic reaction characterisation in stage ii colon cancer: prospective validation in a phase 3 study (sacura trial). Br. J. Cancer 124, 1088–1097. doi:10.1038/s41416-020-01222-8
Wang, Z., and Hillen, T. (2007). Classical solutions and pattern formation for a volume filling chemotaxis model. Chaos 17, 037108. doi:10.1063/1.2766864
Wojton, J., and Kaur, B. (2010). Impact of tumor microenvironment on oncolytic viral therapy. Cytokine Growth Factor Rev. 21, 127–134. doi:10.1016/j.cytogfr.2010.02.014
Workenhe, S. T., Simmons, G., Pol, J. G., Lichty, B. D., Halford, W. P., and Mossman, K. L. (2014). Immunogenic hsv-mediated oncolysis shapes the antitumor immune response and contributes to therapeutic efficacy. Mol. Ther. 22, 123–131. doi:10.1038/mt.2013.238
Xiong, G., Chen, J., Zhang, G., Wang, S., Kawasaki, K., Zhu, J., et al. (2020). Hsp47 promotes cancer metastasis by enhancing collagen-dependent cancer cell-platelet interaction. Proc. Natl. Acad. Sci. U. S. A. 117, 3748–3758. doi:10.1073/pnas.1911951117
Keywords: oncolytic virotherapy, diffusion, partial differential equations, random walk, collagen-dense tumour, desmoplastic reaction, mathematical modelling
Citation: Pooladvand P and Kim PS (2022) Modelling oncolytic virus diffusion in collagen-dense tumours. Front. Syst. Biol. 2:903512. doi: 10.3389/fsysb.2022.903512
Received: 24 March 2022; Accepted: 13 September 2022;
Published: 13 October 2022.
Edited by:
Jennifer Anne Flegg, The University of Melbourne, AustraliaReviewed by:
Fabien Crauste, Centre National de la Recherche Scientifique (CNRS), FranceCopyright © 2022 Pooladvand and Kim. This is an open-access article distributed under the terms of the Creative Commons Attribution License (CC BY). The use, distribution or reproduction in other forums is permitted, provided the original author(s) and the copyright owner(s) are credited and that the original publication in this journal is cited, in accordance with accepted academic practice. No use, distribution or reproduction is permitted which does not comply with these terms.
*Correspondence: Pantea Pooladvand, cC5wb29sYWR2YW5kQHVuc3cuZWR1LmF1
Disclaimer: All claims expressed in this article are solely those of the authors and do not necessarily represent those of their affiliated organizations, or those of the publisher, the editors and the reviewers. Any product that may be evaluated in this article or claim that may be made by its manufacturer is not guaranteed or endorsed by the publisher.
Research integrity at Frontiers
Learn more about the work of our research integrity team to safeguard the quality of each article we publish.