 Xinye Zhao1
 Peng Qiu
95% of researchers rate our articles as excellent or good
Learn more about the work of our research integrity team to safeguard the quality of each article we publish.
Find out more
ORIGINAL RESEARCH article
Front. Syst. Biol. , 11 January 2023
Sec. Integrative Genetics and Genomics
Volume 2 - 2022 | https://doi.org/10.3389/fsysb.2022.1082309
This article is part of the Research Topic Big Data in Systems Biology View all 3 articles
Single-cell RNA sequencing (scRNA-seq) data often contain doublets, where a doublet manifests as 1 cell barcode that corresponds to combined gene expression of two or more cells. Existence of doublets can lead to spurious biological interpretations. Here, we present single-cell MOdel-driven Doublet Detection (scMODD), a model-driven algorithm to detect doublets in scRNA-seq data. ScMODD achieved similar performance compared to existing doublet detection algorithms which are primarily data-driven, showing the promise of model-driven approach for doublet detection. When implementing scMODD in simulated and real scRNA-seq data, we tested both the negative binomial (NB) model and the zero-inflated negative binomial (ZINB) model to serve as the underlying statistical model for scRNA-seq count data, and observed that incorporating zero inflation did not improve detection performance, suggesting that consideration of zero inflation is not necessary in the context of doublet detection in scRNA-seq.
Advances in single-cell RNA sequencing technologies have enabled gene expression quantification at the resolution of individual cells. However, during the library preparation process of encapsulating cells in droplets or separating cells into wells, two or more cells may be captured in the same droplet or well, resulting in doublets or even multiplets. In the subsequent sequencing and data processing, a doublet will produce a gene expression profile that corresponds the combination of gene expression profiles of the cells forming the doublet, and may lead to spurious biological interpretations. Doublets can be generally divided into two types, heterotypic and homotypic. A heterotypic doublet is formed by 2 cells of distinct cell types, and a homotypic doublet is formed by 2 cells of the same cell type. Existence of doublets, especially heterotypic doublets, will impair the quality control (QC) process of scRNA-seq data (Luecken and Theis, 2019), and confuse downstream clustering analysis and interpretations of the data. Several experimental protocols have been developed to identify and remove doublets using multiplexing techniques, such as Demuxlet (Kang et al., 2018) and Cell Hashing (Stoeckius et al., 2018). However, these experimental protocols have critical limitations. For example, Demuxlet uses SNPs to detect doublets formed by cells from differential samples with distinct genotypes, but is unable to detect doublets formed by cells from the same sample.Motivated by the question of doublet detection, many computational methods have been developed, such as cxds (Bais and Kostka, 2020), scDblFinder (Germain et al., 2022), solo (Bernstein et al., 2020), scrublet (Wolock et al., 2019), DoubletFinder (McGinnis et al., 2019a), DoubletCells (Lun et al., 2016), DoubletDetection (Gayoso and Shor, 2018). Majority of these existing methods are data-driven approaches, training machine learning classifiers or neural networks to detect doublets. Although these data-driven approaches have shown high sensitivity and accuracy in doublet detection, we decided to develop a model-driven algorithm for doublet detection, which is an alternative strategy that may lead to complimentary statistical insights for modeling scRNA-seq count data.Given the high sparsity of scRNA-seq count data, there has been numerous discussions on appropriate statistical models to characterize the distribution of scRNA-seq data, and the two most widely used models are the Negative Binomial (NB) model and the Zero-Inflated Negative Binomial model (ZINB). Due to ZINB model’s capability in describing excessively high sparsity in scRNA-seq data, many computational methods have incorporated the ZINB model for dimension reduction (Pierson and Yau, 2015; Risso et al., 2018), de-noising (Eraslan et al., 2019), data integration (Lopez et al., 2018), etc. In the meantime, multiple published studies have shown that the NB model is sufficiently capable of modeling the sparsity of scRNA-seq data, and the zero inflation consideration may not be necessary (Kim et al., 2020; Qiu, 2020; Svensson, 2020; Jiang et al., 2022).In this study, we developed single-cell MOdel-driven Doublet Detection (scMODD), a model-driven algorithm for doublet detection in scRNA-seq data, and examined its performance in comparison with existing data-driven algorithms for doublet detection. When implementing scMODD, we tested both the NB model and the ZINB model to serve as the underlying statistical model for scRNA-seq count data, which enabled an evaluation of these two statistical models in the context of the doublet detection problem.
The schematic overview of scMODD is shown in Figure 1. Given a scRNA-seq gene-cell count matrix as input data of scMODD, standard data pre-processing and cell clustering are performed, including library size normalization, log-transformation, selection of highly-variable genes, principle component analysis (PCA) for dimension reduction, and community finding to identify cell clusters. Under the assumption that none of the cell clusters are dominated by doublets, scMODD constructs one singlet model to statistically describe the raw count data for each cell cluster. After that, for each pair of cell clusters, artificial doublets are simulated by sampling cells from the two clusters, which produces data to construct one doublet model to statistically describe the count data for doublets formed by the 2 cell clusters. If the clustering analysis produces K cell clusters, scMODD constructs a total of K singlet models and K(K−1)/2 doublet models. All cells in the input data and simulated doublets are evaluated against all K + K(K−1)/2 models, which produces probability values to train a classifier that aims to distinguish singlets and doublets. Finally, the classifier is applied to all “cells” in the input data to detect doublets.

FIGURE 1. Schematic Overview of scMODD.
The input data is preprocessed with the Scanpy package in Python. Starting from the raw gene-cell count matrix, library size normalization is performed to scale the total counts of each cell to be 10,000, followed by log-transformation. The top 2000 highly-variable genes (HVG) are selected, based on which principle component analysis (PCA) is performed to reduce the dimensionality down to 50. Based on the dimension reduced data in the PCA space, the community finding algorithm Leiden (Traag et al., 2019) (with resolution value .8) is performed to cluster the cells.
For each pair of cell clusters, 500 artificial doublets are simulated. One artificial doublet is simulated by combining the raw count data for 2 cells, each randomly sampled from the two clusters respectively. These 500 artificial doublets collectively form a doublet cluster of a particular heterotypic type. If the clustering analysis produces K cell clusters, the total number of simulated doublets is 500*K(K−1)/2, which can be considered as K(K−1)/2 doublet clusters of various heterotypic doublet types.
For each singlet cluster or doublet cluster, scMODD constructs a statistical model to describe the raw count data of the cluster. The statistical model can be formulated based on the Negative Binomial (NB) model, which has been frequently used to model the distribution of single-cell count data. For each gene i, the NB model is defined as below:
where xi is a random variable that describes gene i’s count data across cells in this cluster, Γ represents the Gamma function, μi is the gene-specific mean value of the counts, and θ is a shared dispersion parameter among all genes. To obtain the model parameters, μi is estimated by the mean counts of gene i across cells in the cluster, and θ is obtained by curve-fitting using the following relationship:
The statistical models that scMODD constructs can also be formulated using Zero-Inflated Negative Binomial (ZINB). The ZINB model is an extension of the NB model to account for the excessive sparsity that NB model may not be able to explain. Given the high sparsity of scRNA-seq count data, the ZINB model has been widely adopted in scRNA-seq analysis (Risso et al., 2018)(Tian et al., 2019)(Tian et al., 2021). For each gene i, the ZINB model is defined as below:
where xi, μi and θ carry the same definition as in the NB model, πi represents the sparsity of count data for gene i and is estimated by computing the proportion of zeros of gene i, and δ(⋅) represents the Dirac function. Similar to above, the ZINB model parameters are estimated for each of the top 2000 highly-variable genes. For each cell cluster or doublet cluster, scMODD uses the joint probability of the ZINB models of the top 2000 highly-variable genes to describe the cluster.
Given the probability functions and parameters of the singlet and doublet models constructed based on either NB or ZINB, we can compute the log-likelihood of one individual cell against each of the models. Using the notation based on NB as an example, the log-likelihood of 1 cell j belonging to the model k can be written as:
where i is an index for the 2000 highly variable genes, j is an index representing individual cells, and k represents either singlet or doublet models constructed by scMODD. Xj represents the gene expression counts for cell j, and xi,j represents the count value of gene i in cell j. If the clustering analysis produces K cell clusters, Eq. (3) enables calculation of K + K(K−1)/2 likelihood values for an individual cell, which represent the likelihood of this individual cell belonging to each of the K singlet models and the K(K−1)/2 heterotypic doublet models.
To construct a model for detecting doublets, scMODD trains a binary classifier with features being the probabilities based on the singlet models and the doublet models in previous subsections. Given an scRNA-seq data set, scMODD first considers all cell barcodes in the data as one class and all simulated artificial doublets as another class, and then use the probabilities from the singlet and doublet models as features to train a classifier to distinguish the real data and the simulated doublets. After that, the trained classifier is applied to evaluate each cell barcode in the scRNA-seq data set, which produces a score for each cell barcode, estimating its probability of being a doublet. The classifier used in scMODD is the Multi-layer perceptron (MLP) classifier, implemented as the MLPClassifier from “sklearn” package in Python with “relu” as activation function, one hidden layer, hidden layer size being 100, “max _iter” being 300 and “learning_rate” equals to 10–3.
Since scMODD builds singlet models based on cell clusters generated by scRNA-seq clustering analysis, scMODD implicitly assumes that all cell clusters are dominated by singlets, whereas the doublets do not form their own clusters but are embedded into singlet-dominated clusters. This is an important assumption that needs to be justified. Therefore, we performed simulation experiments to examine the relationship between the prevalence of doublets and formation of doublet-dominated cell clusters in standard clustering analysis. Here, singlet-dominated clusters and doublet-dominated clusters are distinguished by whether the proportion of artificial doublets in a cluster is ≥50%.
Two scRNA-seq data sets were used to construct our simulation experiments to examine when doublets might form their own clusters in cell clustering analysis. The two scRNA-seq data sets were PBMC3k data set, and mouse kidney data set (Bernstein et al., 2020). Since it has been previously reported that the doublet percentage in an scRNA-seq data set could be as high as 40%, we generated simulated data sets where the doublet percentage varied from 1%, 2%, 3%, all the way to 40%. For example, if the doublet percentage was 10% and the scRNA-seq data set contained 2,700 cells, 300 artificial doublets were generated and inserted to the data set, so that the doublet percentage in the resulting data set was 10%. To generate one artificial doublet, 2 cell types in the scRNA-seq data set were randomly selected according to their proportions, 1 cell from each of the two selected cell types were randomly picked, and the sum of their gene expression counts was used to represent the artificial doublet. Figure 2 shows the UMAP (McInnes et al., 2018) visualizations of two examples of simulated data sets, each based on one real scRNA-seq data set, both with doublet percentage being 6%.
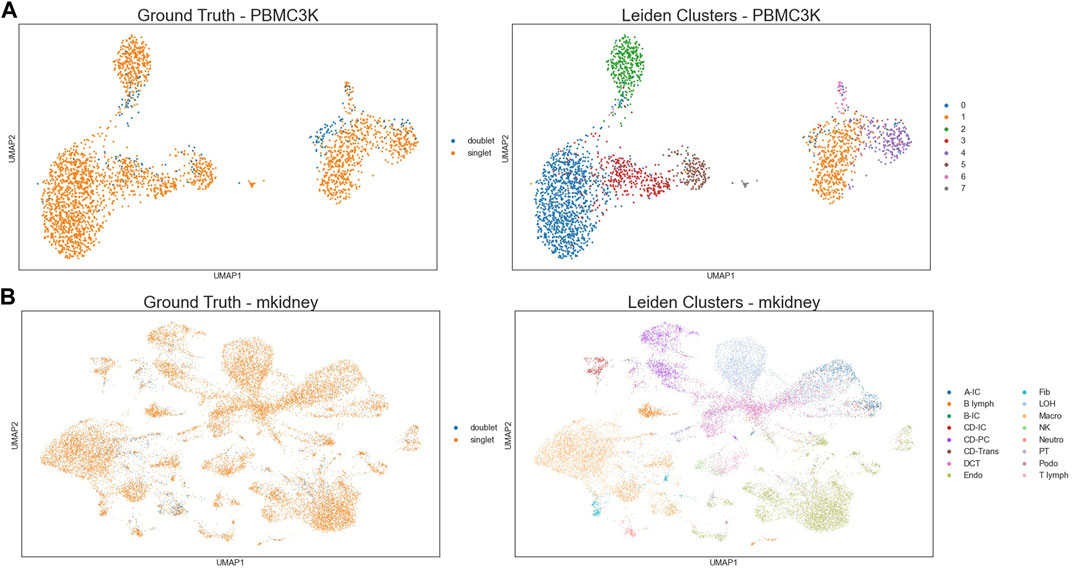
FIGURE 2. Examples of the simulated data. (A) UMAP of PBMC3k based simulated data with 6% artificial doublet. (B) UMAP of mouse-kidney based simulated data with 6% artificial doublet.
For each of the two real scRNA-seq data sets and each of the 40 choices of doublet percentage values, we generated 100 simulated data sets. Therefore, a total of 8,000 simulated data sets were generated. Each simulated data set was processed and clustered using the pipeline described in Section 2.2. For each resulting cell cluster, we computed the proportion of artificial doublets to examine whether it is dominated by doublets. Figure 3 showed the relationship between percentage of simulated artificial doublets and the percentage of doublet-dominated cell clusters, where we observed that doublet-dominated cell clusters were very rare when the percentage of doublets was under 9%. This results indicated that for scRNA-seq data set with realistic heterogeneity and up to 9% doublets, it is reasonable for scMODD to assume that cell clusters defined by clustering analysis are all dominated by singlet cells.
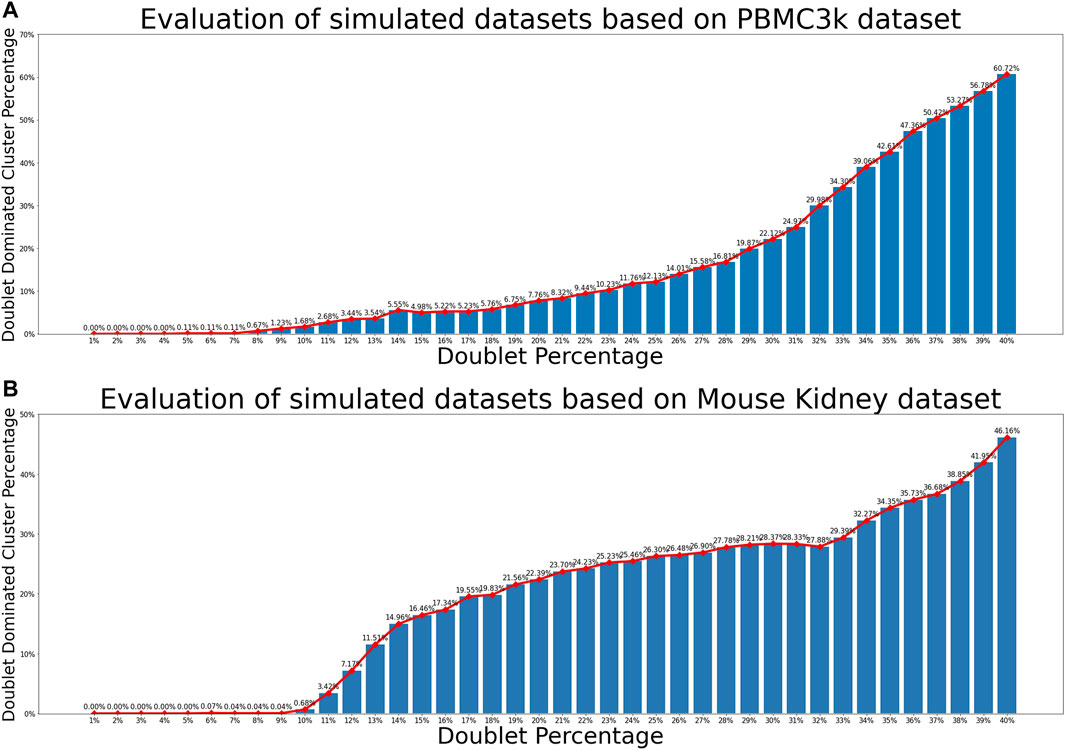
FIGURE 3. Relationship between doublet percentage and formation of doublet-dominated cell clusters. (A) Evaluation results of simulated data sets based on the PBMC3k data set. The horizontal axis is the simulated doublet percentage. The vertical axis is the proportion of doublet-dominated cell clusters. Relationship Between doublet dominated cluster proportion and doublet percentage of mouse-kidney data (B) Evaluation results of simulated data sets based on the mouse kidney data set.
To compare scMODD with existing doublet detecting algorithms, we generated 20 data sets based on PBMC3k data, with simulated artificial doublet percentage varying from 2%, 4%, all the way to 40%. For each of the simulated data sets, we applied scMODD with NB or ZINB to detect doublets. We also compared with two state-of-art doublet detecting algorithms, DoubletFinder (McGinnis et al., 2019a) and scDblFinder (Germain et al., 2022). The doublet detection performance of each algorithm on each simulated data set was quantified by the area under curve (AUC) of the receiver operating curve (ROC). As shown in Figure 4, scMODD with NB and scMODD with ZINB achieved almost identical doublet detection performance. The performance of scMODD was consistently higher than DoubletFinder on all 20 simulated data sets, and slightly lower than scDblFinder. Interestingly, although Section 3.1 showed that when doublet percentage was greater that 9%, clustering analysis produced doublet-dominated clusters, which violated scMODD’s assumption and might impair scMODD’s performance, scMODD showed consistent doublet detection performance for all simulated data sets with doublet percentage ranging from 2% to 40%.

FIGURE 4. Comparison of scMODD and data-driven algorithms based on simulated data sets.
In an attempt to further improve the doublet detection performance, we combined the probability features in scMODD with NB and the features defined in scDblFinder, and trained a doublet detection classifier using the gradient boosted tree (GDBT), which was also used in the scDblFinder algorithm. Unfortunately, combining scMODD and scDblFinder did not lead to improved doublet detection performance in these simulated data sets, compared to separate application of these two algorithms.
Overall, this comparison based on simulated data showed that the model-based scMODD algorithm was able to achieve comparable performance compared to scDblFinder, which is the state-of-art data-driven algorithm for doublet detection.
We compared scMODD with DoubletFinder and scDblFinder using a collection of 16 real scRNA-seq data sets which was used in a recent benchmarking paper for doublet detection (Xi and Li, 2021). These 16 data sets represented varying levels of heterogeneity. Four were generated from mixtures of human and mouse cells (hm-6k, hm-12 k, nuc-MULTI and pdx-MULTI); three were generated from mixtures of human cell lines (cline-ch, J293t-dm and HEK-HMEC-MULTI); six were generated from human PBMC samples (pbmc-ch, pbmc-1A-dm, pbmc-1B-dm, pbmc-1c-dm, pbmc-2ctrl-dm and pbmc-2stim-dm); two were generated from human epithelial cells (HMEC-orig-MULTI and HMEC-rep-MULTI); one was generated from mouse kidney (Mkidney-ch). The number of cells in these data sets also varied significantly, ranging from 500 to more than 20,000. In addition, the ground truth annotation of doublets in these 16 datasets were defined using different techniques, including Demuxlet(Kang et al., 2018), Cell Hashing and MULTI-seq, with the percentage of doublets ranging from 2.51% to 37.31%.
We applied scMODD, DoubletFinder and scDblFinder to these 16 scRNA-seq data sets, and used the area under the receiver-operator characteristic (AUROC) to quantify the doublet detection performance of these methods. As shown in Figure 5, scMODD with NB model and scMODD with ZINB model achieved similar performance in all 16 data sets. In 15 of the 16 date sets, scMODD outperformed DoubletFinder, which was considered to be the best performer in the previous benchmarking study (Xi and Li, 2021). In addition, scMODD achieved slightly lower but similar performance compared to scDblFinder, which was developed after the benchmarking study and was demonstrated to outperform DoubletFinder (Germain et al., 2022). All these results were consistent with the simulation analysis in the previous section, and consistent with previously reported comparisons between DoubletFinder and scDblFinder (Germain et al., 2022).

FIGURE 5. Results of benchmarking scMODD on 16 real scRNA-seq data set.
In one of the 16 data sets (J293t-dm), scMODD performed significantly worse than DoubletFinder and scDblFinder. This was likely due to the fact that the J293t-dm data set contained only 500 cells (the lowest among the 16 data sets), which might not be sufficient for scMODD. Since scMODD built distribution models based on cell clusters, the small data size of J293t-dm led to fewer cells in the cell clusters, which impaired scMODD’s performance. For this data set, combining with features from scDblFinder improved scMODD’s to comparable performance with DoubletFinder and scDblFinder. However, in all other 15 data sets, combining scMODD and scDblFinder led to slightly lower performance compared to separate application of the two algorithms, which was consistent with the simulation analysis in the previous section. This result indicated that scMODD and scDblFinder were sensitive to similar features for doublet detection, and hence, not complementary to each other.
In this paper we presented scMODD, a model-driven computational algorithm that detects doublets in scRNA-seq data sets by modeling the distributions of count data. Compared to state-of-art doublet detection algorithms, our model-driven algorithm achieved similar performance. Given that the majority of existing doublet detection algorithms are data-driven approaches, it is interesting to demonstrate that a model-driven approach can achieve comparable performance in both simulated and real scRNA-seq data sets.
In our simulation experiment, we observed that for simulated data sets containing
The running time of scMODD is quadratic with respect to the number of clusters generated by clustering step of the scMODD pipeline. This is because scMODD constructs one singlet model for each cell cluster, and one doublet model for each pair of cell clusters. Therefore, the running time of scMODD can vary drastically among various datasets. Among the 16 real scRNA-seq datasets analyzed in the Results section, scMODD’s running time ranged from 100 s to 4 h, with 1722 s being the mean running time. In comparison, the mean running time of scDblFinder was 68 s, and the mean running time of DoubletFinder was 966 s. Therefore, given scMODD’s longer running time and comparable performance with respect to existing data-driven approaches, scMODD is not the best algorthim choise from users’ perspective. However, it is still interesting to demonstrate that the model-driven design of scMODD is able to achieve similar performance compared to the data-driven approach adopted by majority of existing doublet detection algorithms.
In additoin, the model-driven design of scMODD provided a new angle to discuss the concept of zero inflation in statistical modeling of scRNAs-seq count data. Due to the high sparsity of scRNA-seq data, many computational methods have been developed based on zero-inflated statistical model for scRNA-seq counts (Pierson and Yau, 2015; Lopez et al., 2018; Risso et al., 2018; Eraslan et al., 2019a). However, multiple published studies suggested that scRNA-seq count data is not zero-inflated. For example, Svensson (2020) proposed that the excessive zeros in scRNA-seq data are primarily driven by the biological variation and heterogeneity among cells. Similarly, Qiu (2020) demonstrated that the sparsity and zero/non-zero patterns in scRNA-seq data can be used to accurately cluster cells into biologically meaningful cell types. Kim et al. (2020) compared the sparsity in scRNA-seq data with expected sparsity under the commonly used distribution models and concluded that it is unnecessary to consider zero inflation when modulating the scRNA-seq counts. Jiang et al. (2022) provided a comphensive review of discussions regarding zero-inflation and scRNA-seq data. In this paper, we demonstrated that scMODD achieved almost the same doublet detection performance regardless of whether the count data was modeled with or without zero inflation. This study provided another piece of evidence suggesting that zero inflation is not necessary for building effective models for doublet detection.
Publicly available datasets were analyzed in this study. This data can be found here: PBMC3k data can be downloaded from the 10X Genomics website via this link: https://support.10xgenomics.com/single-cell-gene-expression/datasets/1.1.0/pbmc3k, and mouse kidney data set is available on GEO: GSE140262.
XZ and PQ designed the research and analyzed the data. AD participated in the data analysis. XZ and PQ wrote the manuscript. All authors contributed to the article and approved the submitted version.
This work was supported by funding from the National Science Foundation (CCF2007029) and the National Institute of Health (R21CA240214). PQ is an ISAC Marylou Ingram Scholar and a Wallace H. Coulter Distinguished Faculty Fellow. The funders had no role in study design, data collection and analysis, decision to publish, or preparation of the manuscript.
The authors declare that the research was conducted in the absence of any commercial or financial relationships that could be construed as a potential conflict of interest.
All claims expressed in this article are solely those of the authors and do not necessarily represent those of their affiliated organizations, or those of the publisher, the editors and the reviewers. Any product that may be evaluated in this article, or claim that may be made by its manufacturer, is not guaranteed or endorsed by the publisher.
Bais, A. S., and Kostka, D. (2020). scds: computational annotation of doublets in single-cell rna sequencing data. Bioinformatics 36, 1150–1158. doi:10.1093/bioinformatics/btz698
Bernstein, N. J., Fong, N. L., Lam, I., Roy, M. A., Hendrickson, D. G., and Kelley, D. R. (2020). Solo: Doublet identification in single-cell rna-seq via semi-supervised deep learning. Cell Syst. 11, 95–101. doi:10.1016/j.cels.2020.05.010
Eraslan, G., Simon, L. M., Mircea, M., Mueller, N. S., and Theis, F. J. (2019). Single-cell rna-seq denoising using a deep count autoencoder. Nat. Commun. 10, 390. doi:10.1038/s41467-018-07931-2
Germain, P.-L., Lun, A., Macnair, W., and Robinson, M. D. (2022). Doublet identification in single-cell sequencing data using scdblfinder. F1000Research 10, 979. doi:10.12688/f1000research.73600.2
Jiang, R., Sun, T., Song, D., and Li, J. J. (2022). Statistics or biology: The zero-inflation controversy about scrna-seq data. Genome Biol. 23, 31–24. doi:10.1186/s13059-022-02601-5
Kang, H. M., Subramaniam, M., Targ, S., Nguyen, M., Maliskova, L., McCarthy, E., et al. (2018). Multiplexed droplet single-cell rna-sequencing using natural genetic variation. Nat. Biotechnol. 36, 89–94. doi:10.1038/nbt.4042
Kim, T., Zhou, X., and Chen, M. (2020). Demystifying “drop-outs” in single-cell umi data. Genome Biol. 21, 196. doi:10.1186/s13059-020-02096-y
Lopez, R., Regier, J., Cole, M. B., Jordan, M. I., and Yosef, N. (2018). Deep generative modeling for single-cell transcriptomics. Nat. methods 15, 1053–1058. doi:10.1038/s41592-018-0229-2
Luecken, M. D., and Theis, F. J. (2019). Current best practices in single-cell rna-seq analysis: A tutorial. Mol. Syst. Biol. 15, e8746. doi:10.15252/msb.20188746
Lun, A. T., McCarthy, D. J., and Marioni, J. C. (2016). A step-by-step workflow for low-level analysis of single-cell rna-seq data with bioconductor. F1000Research 5, 2122. doi:10.12688/f1000research.9501.2
McGinnis, C. S., Murrow, L. M., and Gartner, Z. J. (2019). Doubletfinder: Doublet detection in single-cell rna sequencing data using artificial nearest neighbors. Cell Syst. 8, 329–337.e4. doi:10.1016/j.cels.2019.03.003
McInnes, L., Healy, J., and Melville, J. (2018). Umap: Uniform manifold approximation and projection for dimension reduction. arXiv preprint arXiv:1802.03426.
Pierson, E., and Yau, C. (2015). Zifa: Dimensionality reduction for zero-inflated single-cell gene expression analysis. Genome Biol. 16, 241. doi:10.1186/s13059-015-0805-z
Qiu, P. (2020). Embracing the dropouts in single-cell rna-seq analysis. Nat. Commun. 11, 1169–9. doi:10.1038/s41467-020-14976-9
Risso, D., Perraudeau, F., Gribkova, S., Dudoit, S., and Vert, J.-P. (2018). A general and flexible method for signal extraction from single-cell rna-seq data. Nat. Commun. 9, 284. doi:10.1038/s41467-017-02554-5
Stoeckius, M., Zheng, S., Houck-Loomis, B., Hao, S., Yeung, B. Z., Mauck, W. M., et al. (2018). Cell hashing with barcoded antibodies enables multiplexing and doublet detection for single cell genomics. Genome Biol. 19, 224. doi:10.1186/s13059-018-1603-1
Svensson, V. (2020). Droplet scrna-seq is not zero-inflated. Nat. Biotechnol. 38, 147–150. doi:10.1038/s41587-019-0379-5
Tian, T., Min, M. R., and Wei, Z. (2021). Model-based autoencoders for imputing discrete single-cell rna-seq data. Methods 192, 112–119. doi:10.1016/j.ymeth.2020.09.010
Tian, T., Wan, J., Song, Q., and Wei, Z. (2019). Clustering single-cell rna-seq data with a model-based deep learning approach. Nat. Mach. Intell. 1, 191–198. doi:10.1038/s42256-019-0037-0
Traag, V. A., Waltman, L., and Van Eck, N. J. (2019). From louvain to leiden: Guaranteeing well-connected communities. Sci. Rep. 9, 5233. doi:10.1038/s41598-019-41695-z
Wolock, S. L., Lopez, R., and Klein, A. M. (2019). Scrublet: Computational identification of cell doublets in single-cell transcriptomic data. Cell Syst. 8, 281–291. doi:10.1016/j.cels.2018.11.005
Keywords: negative binomial, zero-inflated negative binomial, doublet detection, model-driven, artificial doublets
Citation: Zhao X, Du A and Qiu P (2023) scMODD: A model-driven algorithm for doublet identification in single-cell RNA-sequencing data. Front. Syst. Biol. 2:1082309. doi: 10.3389/fsysb.2022.1082309
Received: 28 October 2022; Accepted: 29 December 2022;
Published: 11 January 2023.
Edited by:
Yuying Xie, Michigan State University, United StatesReviewed by:
Zhaoheng Li, University of Washington, United StatesCopyright © 2023 Zhao, Du and Qiu. This is an open-access article distributed under the terms of the Creative Commons Attribution License (CC BY). The use, distribution or reproduction in other forums is permitted, provided the original author(s) and the copyright owner(s) are credited and that the original publication in this journal is cited, in accordance with accepted academic practice. No use, distribution or reproduction is permitted which does not comply with these terms.
*Correspondence: Peng Qiu , cGVuZy5xaXVAYm1lLmdhdGVjaC5lZHU=
Disclaimer: All claims expressed in this article are solely those of the authors and do not necessarily represent those of their affiliated organizations, or those of the publisher, the editors and the reviewers. Any product that may be evaluated in this article or claim that may be made by its manufacturer is not guaranteed or endorsed by the publisher.
Research integrity at Frontiers
Learn more about the work of our research integrity team to safeguard the quality of each article we publish.