 Congmin Xu
 Huyun Lu
 Peng Qiu
- 1BioMap (Beijing) Intelligent Technology Co, Ltd. (BioMap), Beijing, China
- 2Department of Biomedical Engineering, Georgia Institute of Technology and Emory University, Atlanta, GA, United States
- 3School of Biological Sciences, Georgia Institute of Technology, Atlanta, GA, United States
When analyzing scRNA-seq data with clustering algorithms, annotating the clusters with cell types is an essential step toward biological interpretation of the data. Annotations can be performed manually using known cell type marker genes. Annotations can also be automated using knowledge-driven or data-driven machine learning algorithms. Majority of cell type annotation algorithms are designed to predict cell types for individual cells in a new dataset. Since biological interpretation of scRNA-seq data is often made on cell clusters rather than individual cells, several algorithms have been developed to annotate cell clusters. In this study, we compared five cell type annotation algorithms, Azimuth, SingleR, Garnett, scCATCH, and SCSA, which cover the spectrum of knowledge-driven and data-driven approaches to annotate either individual cells or cell clusters. We applied these five algorithms to two scRNA-seq datasets of peripheral blood mononuclear cells (PBMC) samples from COVID-19 patients and healthy controls, and evaluated their annotation performance. From this comparison, we observed that methods for annotating individual cells outperformed methods for annotation cell clusters. We applied the cell-based annotation algorithm Azimuth to the two scRNA-seq datasets to examine the immune response during COVID-19 infection. Both datasets presented significant depletion of plasmacytoid dendritic cells (pDCs), where differential expression in this cell type and pathway analysis revealed strong activation of type I interferon signaling pathway in response to the infection.
Introduction
Single-cell RNA sequencing (scRNA-seq) has facilitated the study of cellular heterogeneity in complex tissues, enabling identification and characterization of many cell types in various biological contexts (Eberwine et al., 2014). When analyzing scRNA-seq data with clustering algorithms, annotating the clusters with cell types is a key step for downstream analysis and biological interpretations. Often, cell type annotation is performed manually based expression of known cell type marker genes, which can be subjective and labor-intensive (Lahnemann et al., 2020). Motivated by this analysis challenge, numerous computational algorithms have been developed to automatically annotate cells (Duo et al.,2018; Freytag et al., 1000; Kiselev et al., 2019).
Existing cell type annotation algorithms can be categorized into either knowledge-driven or data-driven approaches, depending on whether prior knowledge of cell type marker genes or annotated scRNA-seq reference datasets are used to construct models to predict cell types in a new query dataset (Abdelaal et al., 2019). Another way to categorize cell type annotation algorithms is whether the cell type predictions are made for individual cells or cell clusters in a new dataset. Majority of existing cell type annotation algorithms make predictions for individual cells, such as Azimuth, SingleR, Garnett, CHETAH, scMATCH, CellAssign, scmap, scPred, and CellAtlasSearch (Alquicira-Hernandez et al., 2019; Kiselev et al., 2018; Srivastava et al., 2018; Aran et al., 2019; Hou et al., 2019; Jurrian et al., 2019; Pliner et al., 2019; Zhang et al., 2019; Hao et al., 2021). Since biological interpretation of scRNA-seq is often made on cell clusters rather than individual cells, a few algorithms have been developed to annotate cell clusters instead of individual cells, such as SCSA and scCATCH (Cao et al., 2020; Shao et al., 2020). The strategy of annotating cell clusters is intuitively appealing, because it is more in line with how biologists interpret the data. In addition, annotation predictions based on data of a cell cluster may be more robust compared to making predictions based on data of an individual cell, because expression data for an individual cell can be noisy and sparse, whereas data of a cell cluster can define more robust and less sparse gene expression signatures. To evaluate whether the conceptual advantage of annotating cell clusters translates into higher annotation accuracy, we set out to compare two algorithms designed to annotate cell clusters [i.e., SCSA and scCATCH (Cao et al., 2020; Shao et al., 2020)] and three algorithms for annotating individual cells (i.e., Azimuth, SingleR, and Garnett (Aran et al., 2019; Pliner et al., 2019; Hao et al., 2021)), using PBMC samples in Coronavirus disease 2019 (COVID-19) as the biological context.
COVID-19 has triggered international concern due to its rapid spread and mortality rate. Blood tests revealed differences in cell indices between COVID-19 patients and healthy controls (Chua et al., 2020; Ji-Yuan Zhang et al., 2020; Lee et al., 2020; Wilk et al., 2020), but the underlying molecular mechanism of such differences is not fully understood. In two pioneering studies (Lee et al., 2020; Wilk et al., 2020), peripheral blood mononuclear cells (PBMC) of COVID-19 patients and healthy controls were profiled using scRNA-seq, which provided valuable datasets that not only are suitable for testing performance of cell type annotation algorithms, but also have the potential to elucidate the molecular landscape of PBMCs of COVID-19 patients.
In this study, we applied five cell type annotation algorithms to annotate the two scRNA-seq datasets of PBMC samples of both healthy and COVID-19 patients. The annotation performances of these tools were cross-compared. We observed that the cell-based annotation algorithms outperformed the cluster-based annotation algorithms. This was somewhat counter intuitive, but pointed to an opportunity to further develop algorithms for annotating cell clusters. Using the cell type annotation results generated by Azimuth, we compared the cell type composition of COVID-19 patients and healthy controls, aiming to identify common trends of compositional changes in both datasets, as well as genes and pathways that exhibit cell-type-specific changes associated to COVID-19.
Results
Compare cell type annotation algorithms using PBMC data of COVID-19 patients
In this study, we compared five cell type annotation algorithms. Two of these algorithms, Azimuth (Hao et al., 2021), SingleR (Aran et al., 2019) and Garnett (Pliner et al., 2019), make cell type annotations for individual cells in a query dataset, based on either annotated reference scRNA-seq data or prior knowledge of cell-type-specific marker genes. The other two of these algorithms, scCATCH (Shao et al., 2020) and SCSA (Cao et al., 2020), make cell type annotations for cell clusters defined in a query dataset, by matching cluster marker genes identified from the query data and prior knowledge of cell-type-specific marker genes. Therefore, these five algorithms spanned the spectrum of exiting cell type annotation algorithms, i.e., data-driven vs. knowledge-driven, and cell-based vs. cluster-based.
scRNA-seq data of PBMC from two cohorts of COVID-19 patients and healthy controls were obtained from two previously published studies (Lee et al., 2020; Wilk et al., 2020). Lee et al. (2020) provided scRNA-seq data for 4 healthy controls, 5 COVID-19 patients with mild symptoms and 6 COVID-19 patients with severe symptoms. Wilk et al. (2020) provided scRNA-seq data for 6 healthy controls and 7 COVID-19 patients with severe symptoms. To prepare the input for cluster-based cell type annotation algorithms, cells from different samples in the same cohort were aligned and integrated using scTransform and CCA implemented in the Seurat package to remove batch effect (Stuart et al., 2019). Then, cells were clustered using Seurat, and the clusters served as the input for SCSA and scCATCH to annotate these clusters. For cell-based approaches, raw count data without any preprocessing were provided to Azimuth, SingleR, and Garnett to annotate individual cells.
We applied the five cell type annotation algorithms on these two datasets, and evaluated the annotation results. First, the annotation performance was quantified by calculating the percentage of cells being confidently annotated (Table 1). Four of the five algorithms are able to report cells or clusters that cannot be confidently annotated. Garnett assigns label “unknown” to cells with low prediction scores from its elastic net regression models. Azimuth produces probabilities for annotating each cell to each possible cell type, and the annotation of a cell is less confident if the highest probability for the cell is lower than a threshold (0.75 was used in this study which was determined based on the distribution of probabilities across all cells). The two cluster-based algorithms provide qualitative evaluation of Good/Uncertain/Unknown for their annotations, depending on the marker evidence scoring metrics in those algorithms. In our analysis, we considered cells belonging to clusters with “Good” annotations as confidently annotated cells. In contrast, SingleR assigns a cell type label to every query cell with its most similar cell type in the reference datasets, based on similarity defined by Spearman correlation of gene expression profiles. More details about the annotation results are described in Supplementary Table S1. The percentages of cells confidently annotated by four algorithms were summarized in Table 1, with SingleR listed as N/A (not applicable) because it does not label any query cell as unknown or uncertain. As shown in Table 1, the cell-based algorithms (Azimuth and Garnett) were able to produce confident annotations for much higher percentage of cells compared to the cluster-based algorithms (SCSA and scCATCH), which indicates that cell-based algorithms achieved a higher level of recall by annotating more cells confidently.
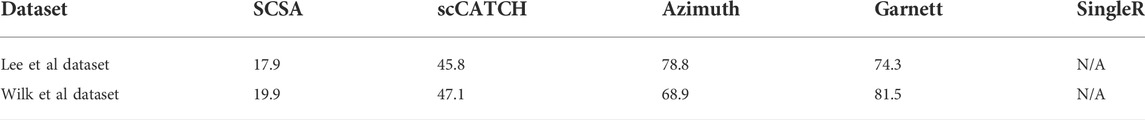
TABLE 1. Percentage of cells being confidently annotated.
We also examined the agreement among different annotation algorithms. Since these algorithms produced cell type annotations at different levels of granularity, we consolidated the annotation results at a relatively low resolution. We kept annotations of major lineages (such as DC, B, Monocytes, T, Erythrocytes, HSPC, Lymphoid and Macrophages), and merged detailed subtypes into the corresponding major lineages, (such as merging B intermediate, B memory and B naïve to B cells). More details available in Supplementary Table S1. After consolidating the annotation results, we defined the consensus annotations of the five algorithms. If three or more of the five algorithms gave one cell the same annotation, we considered this cell to have a consensus annotation from the five algorithms. If the five algorithms failed to achieve a majority vote, i.e., the five algorithms collective gave four or five distinct annotations for one cell, we considered no consensus existed for this cell. If there was a tie that two algorithms gave a certain annotation, two other algorithms gave another annotation and the remaining algorithm gave a third annotation, we also considered no consensus existed for the cell. For the two datasets combined, 66.9% of the cells received consensus annotation (other than unknown), 5.1% of the cells were consensually annotated as unknown, and 28.0% of the cells did not receive consensus annotation. We compared the annotation result for each algorithm against the consensus annotation, and calculated the percentage of cells whose annotation from individual algorithms agreed with the consensus. As shown in Table 2, cell type annotation results of Azimuth, SingleR, and Garnett had a higher level of agreement with the consensus, which means Azimuth, SingleR, and Garnett likely achieved higher level of accuracy in their annotations.
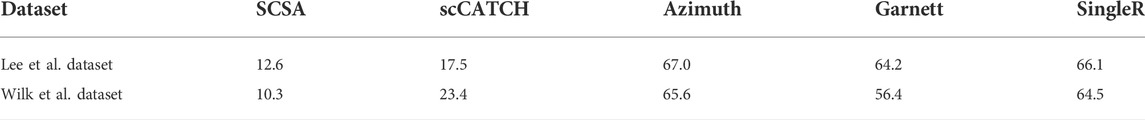
TABLE 2. Agreement among different annotation algorithms.
Therefore, despite cluster-based methods’ conceptual advantage of using more data to perform annotation, current implementations of the cluster-based methods still need further improvement to match the performance of state-of-art cell-based methods, such as Azimuth and Garnett. Since Azimuth provided finer annotations with more detailed cell types, our subsequent explorations of the COVID datasets were based on the annotation results generated by Azimuth.
Cellular composition differences associated to COVID-19
We examined the cellular composition of various samples based on the annotation result of Azimuth. Comparisons of the cellular compositions between COVID-19 patients and healthy subjects revealed COVID-19 associated changes in the cell type proportions. In the Lee et al. dataset, compared to COVID-19 patients with mild symptoms, COVID-19 patients with severe symptoms showed significant depletion of multiple immune cell types (Figure 1), such as CD4+ naïve T-cells, CD4+ T-cell subsets (TCM and TEM), CD8+ TCM, regulatory T-cells (Tregs), CD16 monocytes, CD56 bright natural killer (NK) cells, cDC2 dendritic cells, γδ T-cells, and plasmacytoid dendritic cells (pDCs) (p-value<0.05). Among these immune cell types, only CD8+ T central memory (TCM) cells and γδ T-cells were significantly exhausted in COVID-19 patients with mild symptoms when compared to healthy controls (Figure 1). These observations were consistent with a previous study which showed that the frequency of NK cells was significantly lower in severe COVID-19 cases when compared to mild cases and healthy controls, implying that lower NK cell counts are associated with greater COVID-19 severity (Li et al., 2020). The previous study also found that the cellular compositions of CD4+ T-cells, CD8+ T-cells and NKT cells were considerably lower in severe cases than in mild cases. In addition, another study also linked SARS-CoV-2 infection and impairment of NK cellular functions as well as the innate and cell-mediated immune responses (van Eeden et al., 2020).
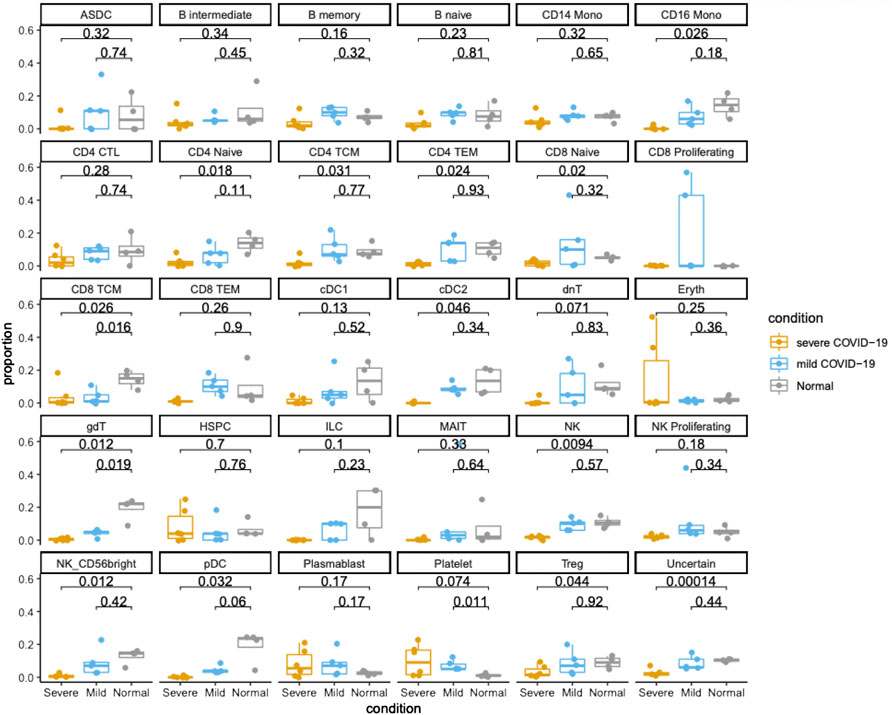
FIGURE 1. Cellular compositions of PBMC samples from healthy controls and COVID-19 patients in Lee et al. dataset. Dots and boxes of different colors represent samples from samples groups of normal, mild COVID-19 and severe COVID-19, respectively. The Y axis represents the cellular fractions of cell types. The p_values were calculated from t-test.
The Wilk et al. dataset allowed us to compare the immune cell types’ proportions between healthy controls and COVID-19 patients with severe symptoms. As shown in Figure 2, innate lymphoid cells (ILC), mucosal associated invariant T-cells (MAIT) and plasmacytoid dendritic cells (pDCs) (p-value < 0.05) presented significant depletion in the COVID-19 patients. It has been reported that MAIT cells are associated with COVID-19 severity due to their activation function on ILCs, proinflammatory cytokines, and interleukin (IL)-18 (Flament et al., 2021). Consequently, the frequency of differentiated ILCs drops remarkably in patients. Furthermore, a relevant study found some ILC subsets, like ILC1, ILC2, and ILC precursors, reveal a dysregulated expression of chemokine receptors involved in the activation response (Garcia et al., 2020). Thus, we can conclude that alteration or depletion of MAIT cell functions might be responsible for disease severity.
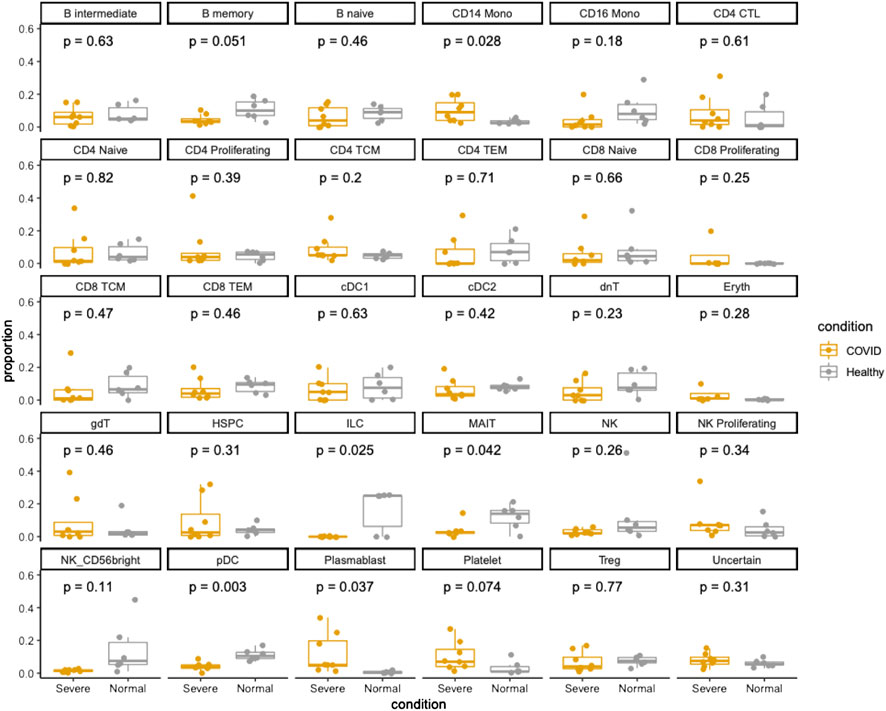
FIGURE 2. Cellular compositions of PBMC samples from healthy controls and COVID-19 patients in Wilk et al. dataset. Dots and boxes of different colors represent samples groups of healthy vs. COVID. The Y axis represents the cellular fractions of cell types. The p_values were calculated from t-test.
When comparing the analysis result of the Lee et al. dataset and the Wilk et al. dataset, it is worth noting that pDCs presented significant depletion in COVID-19 patients in both studies (Figures 1, 2). pDCs are primarily responsible for the production of Type I and III interferons (IFN-I/λ), which are critical antiviral mediators against SARS-CoV-2 infection. A previous study showed that activation of pDCs is negatively associated to the severity of COVID-19, and some of the severe cases presented damage of the pDC response pathway (Venet et al., 2021). The previous study is consistent with our observation that mild patients in the Lee et al. dataset showed less depletion of pDCs compared to severe patients. SARS-CoV-2 infection and the triggered inflammation may have an influence on the frequency and functioning of different pDC subpopulations and their corresponding regeneration capacity (Venet et al., 2021). Furthermore, higher expression of pro-apoptotic molecules was found in pDCs from severe COVID patients (Saichi et al., 2021), which may explain their massive cellular depletion in both datasets.
Gene profile alteration of pDCs during COVID-19 infection
As pDCs was the only cell type that exhibited significant depletion in both datasets, we focused on the pDCs to examine genes and pathways that showed differential expression for this specific cell type between COVID-19 patients and healthy subjects.
Differential expression analysis revealed that IFI44L, IFI27, MX1, XAF1, and STAT1 were the most differentially expressed genes of pDCs between COVID-19 patients and healthy subjects, as shown in Figure 3A. Our observations were consistent with a previous study which compared SARS-CoV-2-induced acute respiratory illnesses (ARIs) and non-viral ARIs, and showed that interferon pathway genes, such as IFI44L and IFI27, were most significantly upregulated in COVID-driven ARIs (Mick et al., 2020). Both IFI44L and MX1 are antiviral associated genes (Pekayvaz et al., 2022), and MX1 could function to generate an antiviral response, showing higher expression in COVID-19 patients in a previous study (Bizzotto et al., 2020). XAF1 is known to interact with interferon regulatory factor-1 (IRF-1) as a positive feedback loop, where IRF-1 stimulates its transcription, which further stabilizes and activates IRF-1 (Jeong et al., 2018). This pathway is frequently triggered under stressful conditions, accompanied by increasing cellular apoptosis, which might be another reason explaining the significant exhaustion of pDCs in infected samples of the Lee et al. and Wilk et al. datasets. STAT1 acts as a downstream effector of interferon signaling. Its upregulation was reported to be positively correlated with the severity of COVID-19 patients (Rincon-Arevalo et al., 2022). The differential expression of STAT1 in pDCs observed in our analysis aligned well with its function to amplify IFN-mediated signals.
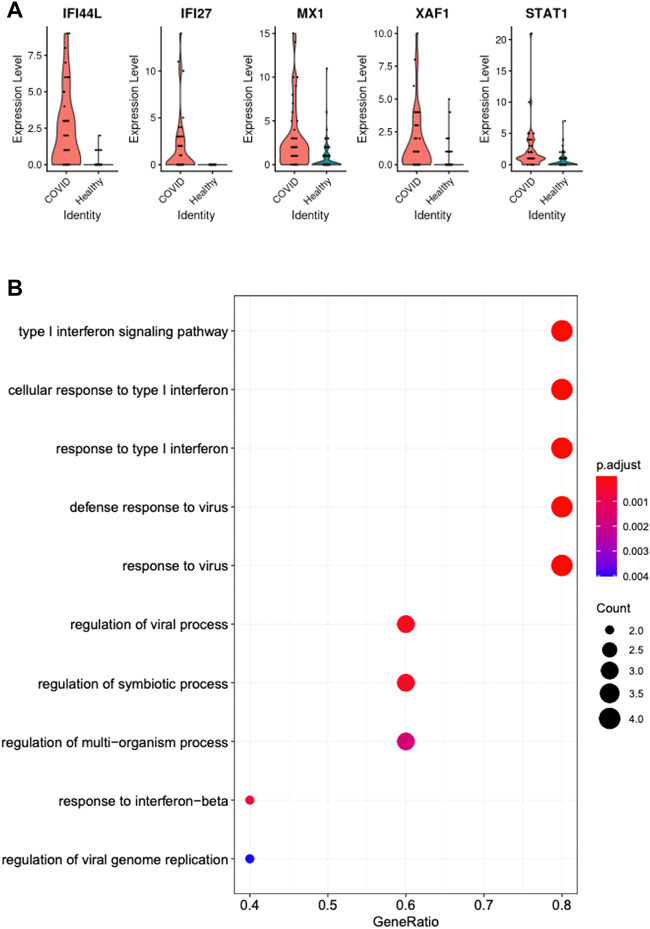
FIGURE 3. (A) Top-ranked differential genes in pDCs of COVID-19 patients and healthy controls. (B) Pathways enriched by these differential genes.
Gene set enrichment analysis revealed pathways enriched in those COVID-19 associated differentially expressed genes in pDCs, where we observed a strong IFN-I/λ activation pathway triggered by SARS-CoV-2 infection, as shown in Figure 3B. The enriched pathways pointed to a biologically coherent mechanism, where pDCs could be differentiating into various subgroups with different functions and efficacy levels to initiate type I interferon signaling pathway (Venet et al., 2021), which further stimulated high cellular response and defense response to virus.
Discussion
In this study, we compared five cell type annotation algorithms, which cover the spectrum of knowledge-driven and data-driven approach to annotate either individual cells or cell clusters. Using two scRNA-seq datasets of PBMC samples of COVID-19 patients and healthy subjects, we demonstrated that the annotation performance of methods that annotated clusters (scCATCH and SCSA) were relatively poor compared to methods that annotated individual cells. This is somewhat counter intuitive. The strategy of annotating cell clusters has the potential to be more robust and accurate, because expression data of cell clusters is less noisy and less sparse compared to expression data of individual cells. Such a counter intuitive result pointed to an opportunity to further develop algorithms for annotating cell clusters. In fact, both of the cluster-based annotation methods examined here (scCATCH and SCSA) are knowledge-driven, aiming to match marker genes of cell clusters with prior knowledge of cell type marker genes. Data-driven designs of annotation algorithms for cell clusters may be a promising direction to better realize the potential of the strategy of annotating cell clusters, and hence a possible future direction for development cell type mapping algorithms.
Among the five annotation algorithms compared here, scCATCH and SCSA were designed to annotated clusters. Since they require pre-defined cell clusters as part of their input, their performances depend on the quality of the pre-defined clusters. In this study, we defined clusters using the Seurat clustering pipeline with default parameters, because it is the most popular clustering analysis pipeline widely used in the literature. We also examined these two algorithms using clusters defined with different Seurat parameter, in particular, the resolution parameter. When the number of clusters was too small, cluster-based cell type annotation performed poorly which was expected. When the resolution parameter was large to over-cluster the data, the cell type mapping performance also decreased. Overall, we observed that the pre-defined clusters using default Seurat worked very well with the two cluster-based cell type annotation algorithms.
The sample sizes of the two datasets are small, which limit the statistical power for consistently identifying biological signals. Some cell types showed similar trend but did not achieve statistical significance in both datasets. For examples, CD4+ TEM, Tregs, Monocytes and CD56bright natural killer (NK) cells were significantly depleted in the Lee et al. dataset. The alteration in the Wilk et al. dataset was not significant, even though similar depletion trend could be observed. On the other hand, MAIT was significantly depleted in the Wilk et al. dataset, while did not pass the significant test in the Lee et al. dataset. Given this observation, the power of applying single cell RNA sequencing and automated cell type annotation for defining cellular alteration during immune response was proved. If the sample size could be larger, the agreement would be better.
Materials and methods
All analyses were performed using the R statistical computing environment. SCSA, scCATCH, SingleR, and Garnett were download following instructions in their original publications (Aran et al., 2019; Pliner et al., 2019; Cao et al., 2020; Shao et al., 2020). Azimuth was performed using its online portal (https://azimuth.hubmapconsortium.org/).
PBMC scRNA-seq data of healthy controls and COVID-19 subjects were obtained from two published datasets, Lee et al. (2020); Wilk et al. (2020). The datasets are available from GEO with accession number GSE149689 (Lee et al. dataset) and GSE150728 (Wilk et al. dataset).
In order to prepare input for cluster-based annotation algorithms, we used Seurat with default parameters to cluster the cells. Preprocessing parameters included min. cells = 3, min. features = 200 and percent. mt < 20 for quality control filtering of cells and genes. SC Transform and CCA were performed to reduce batch effect. In the dimension reduction step by principle component analysis (PCA), 10 principle components (PCs) were chosen. For the clustering analysis by community finding, the clustering resolution was set as 0.5.
Data availability statement
Publicly available datasets were analyzed in this study. This data can be found here: GEO with accession number GSE149689 (Lee et al dataset) and GSE150728 (Wilk et al dataset).
Author contributions
PQ and CX designed the research and analyzed the data. CX, HL, and PQ wrote the manuscript. All authors contributed to the article and approved the submitted version.
Funding
This work was supported by funding from the National Science Foundation (CCF2007029). PQ is an ISAC Marylou Ingram Scholar and a Wallace H. Coulter Distinguished Faculty Fellow. The funders had no role in study design, data collection and analysis, decision to publish, or preparation of the manuscript.
Conflict of interest
The authors declare that the research was conducted in the absence of any commercial or financial relationships that could be construed as a potential conflict of interest.
Publisher’s note
All claims expressed in this article are solely those of the authors and do not necessarily represent those of their affiliated organizations, or those of the publisher, the editors and the reviewers. Any product that may be evaluated in this article, or claim that may be made by its manufacturer, is not guaranteed or endorsed by the publisher.
Supplementary material
The Supplementary Material for this article can be found online at: https://www.frontiersin.org/articles/10.3389/fsysb.2022.1026686/full#supplementary-material
References
Abdelaal, T., Michielsen, L., Cats, D., Hoogduin, D., Mei, H., Reinders, M. J. T., et al. (2019). A comparison of automatic cell identification methods for single-cell RNA sequencing data. Genome Biol. 20 (1), 194. doi:10.1186/s13059-019-1795-z
Alquicira-Hernandez, J., Sathe, A., Ji, H. P., Nguyen, Q., and Powell, J. E. (2019). scPred: Accurate supervised method for cell-type classification from single-cell RNA-seq data. Genome Biol. 20, 264. doi:10.1186/s13059-019-1862-5
Aran, D., Looney, A. P., Liu, L., Wu, E., Fong, V., Hsu, A., et al. (2019). Reference-based analysis of lung single-cell sequencing reveals a transitional profibrotic macrophage. Nat. Immunol. 20 (2), 163–172. doi:10.1038/s41590-018-0276-y
Bizzotto, J., Sanchis, P., Abbate, M., Lage-Vickers, S., Lavignolle, R., Toro, A., et al. (2020). SARS-CoV-2 infection boosts MX1 antiviral effector in COVID-19 patients. iScience 23 (10), 101585. doi:10.1016/j.isci.2020.101585
Cao, Y., Wang, X., and Peng, G. (2020). Scsa: A cell type Annotation tool for single-cell RNA-seq data. Front. Genet. 11 (490), 490. doi:10.3389/fgene.2020.00490
Chua, R. L., Lukassen, S., Trump, S., Hennig, B. P., Wendisch, D., Pott, F., et al. (2020). COVID-19 severity correlates with airway epithelium-immune cell interactions identified by single-cell analysis. Nat. Biotechnol. 38 (8), 970–979. doi:10.1038/s41587-020-0602-4
Duo, A., Robinson, M. D., and Soneson, C. (2018). A systematic performance evaluation of clustering methods for single-cell RNA-seq data. F1000Res. 7, 1141. doi:10.12688/f1000research.15666.1
Eberwine, J., Sul, J. Y., Bartfai, T., and Kim, J. (2014). The promise of single-cell sequencing. Nat. Methods 11 (1), 25–27. doi:10.1038/nmeth.2769
Flament, H., Rouland, M., Beaudoin, L., Toubal, A., Bertrand, L., Lebourgeois, S., et al. (2021). Outcome of SARS-CoV-2 infection is linked to MAIT cell activation and cytotoxicity. Nat. Immunol. 22 (3), 322–335. doi:10.1038/s41590-021-00870-z
Freytag, S., Tian, L., Lonnstedt, I., Ng, M., and Bahlo, M. (10002018). Comparison of clustering tools in R for medium-sized 10x Genomics single-cell RNA-sequencing data. F1000Res. 7, 1297. doi:10.12688/f1000research.15809.2
Garcia, M., Kokkinou, E., Carrasco Garcia, A., Parrot, T., Palma Medina, L. M., Maleki, K. T., et al. (2020). Innate lymphoid cell composition associates with COVID-19 disease severity. Clin. Transl. Immunol. 9 (12), e1224. doi:10.1002/cti2.1224
Hao, Y., Hao, S., Andersen-Nissen, E., Mauck, W. M., Zheng, S., Butler, A., et al. (2021). Integrated analysis of multimodal single-cell data. Cell 184 (13), 3573–3587 e29. doi:10.1016/j.cell.2021.04.048
Hou, R., Denisenko, E., and Forrest, A. R. R. (2019). scMatch: a single-cell gene expression profile annotation tool using reference datasets. Bioinformatics 35 (22), 4688–4695. doi:10.1093/bioinformatics/btz292
Jeong, S. I., Kim, J. W., Ko, K. P., Ryu, B. K., Lee, M. G., Kim, H. J., et al. (2018). XAF1 forms a positive feedback loop with IRF-1 to drive apoptotic stress response and suppress tumorigenesis. Cell Death Dis. 9 (8), 806. doi:10.1038/s41419-018-0867-4
Ji-Yuan Zhang, F.-S. W., Wang, X. M., Xing, X., Xu, Z., Zhang, C., Song, J. W., et al. (2020). Single-cell landscape of immunological responses in patients with COVID-19. Nat. Immunol. 21, 1107–1118. doi:10.1038/s41590-020-0762-x
Jurrian, K., Lijnzaad, P., Candelli, T., Margaritis, T., and Holstege, F. C. P. (2019). Chetah: A selective, hierarchical cell type identification method for single-cell RNA sequencing. Nucleic Acids Res. 47 (16), e95. doi:10.1093/nar/gkz543
Kiselev, V. Y., Andrews, T. S., and Hemberg, M. (2019). Challenges in unsupervised clustering of single-cell RNA-seq data. Nat. Rev. Genet. 20 (5), 273–282. doi:10.1038/s41576-018-0088-9
Kiselev, V. Y., Yiu, A., and Hemberg, M. (2018). scmap: projection of single-cell RNA-seq data across data sets. Nat. Methods 15 (5), 359–362. doi:10.1038/nmeth.4644
Lahnemann, D., Koster, J., Szczurek, E., McCarthy, D. J., Hicks, S. C., Robinson, M. D., et al. (2020). Eleven grand challenges in single-cell data science. Genome Biol. 21 (1), 31. doi:10.1186/s13059-020-1926-6
Lee, J. S., Park, S., Jeong, H. W., Ahn, J. Y., Choi, S. J., Lee, H., et al. (2020). Immunophenotyping of COVID-19 and influenza highlights the role of type I interferons in development of severe COVID-19. Sci. Immunol. 5, eabd1554. doi:10.1126/sciimmunol.abd1554
Li, M., Guo, W., Dong, Y., Wang, X., Dai, D., Liu, X., et al. (2020). Elevated exhaustion levels of NK and CD8(+) T cells as indicators for progression and prognosis of COVID-19 disease. Front. Immunol. 11, 580237. doi:10.3389/fimmu.2020.580237
Mick, E., Kamm, J., Pisco, A. O., Ratnasiri, K., Babik, J. M., Castañeda, G., et al. (2020). Upper airway gene expression reveals suppressed immune responses to SARS-CoV-2 compared with other respiratory viruses. Nat. Commun. 11, 5854. doi:10.1038/s41467-020-19587-y
Pekayvaz, K., Leunig, A., Kaiser, R., Joppich, M., Brambs, S., Janjic, A., et al. (2022). Protective immune trajectories in early viral containment of non-pneumonic SARS-CoV-2 infection. Nat. Commun. 13 (1), 1018. doi:10.1038/s41467-022-28508-0
Pliner, H. A., Shendure, J., and Trapnell, C. (2019). Supervised classification enables rapid annotation of cell atlases. Nat. Methods 16 (10), 983–986. doi:10.1038/s41592-019-0535-3
Rincon-Arevalo, H., Aue, A., Ritter, J., Szelinski, F., Khadzhynov, D., Zickler, D., et al. (2022). Altered increase in STAT1 expression and phosphorylation in severe COVID-19. Eur. J. Immunol. 52 (1), 138–148. doi:10.1002/eji.202149575
Saichi, M., Ladjemi, M. Z., Korniotis, S., Rousseau, C., Ait Hamou, Z., Massenet-Regad, L., et al. (2021). Single-cell RNA sequencing of blood antigen-presenting cells in severe COVID-19 reveals multi-process defects in antiviral immunity. Nat. Cell Biol. 23 (5), 538–551. doi:10.1038/s41556-021-00681-2
Shao, X., Liao, J., Lu, X., Xue, R., Ai, N., and Fan, X. (2020). scCATCH: Automatic annotation on cell types of clusters from single-cell RNA sequencing data. iScience 23 (3), 100882. doi:10.1016/j.isci.2020.100882
Srivastava, D., Iyer, A., Kumar, V., and Sengupta, D. (2018). CellAtlasSearch: A scalable search engine for single cells. Nucleic Acids Res. 46 (W1), W141–W147. doi:10.1093/nar/gky421
Stuart, T., Butler, A., Hoffman, P., Hafemeister, C., Papalexi, E., Mauck, W. M., et al. (2019). Comprehensive integration of single-cell data. Cell 177 (7), 1888–1902. e21. doi:10.1016/j.cell.2019.05.031
van Eeden, C., Khan, L., Osman, M. S., and Cohen Tervaert, J. W. (2020). Natural killer cell dysfunction and its role in COVID-19. Int. J. Mol. Sci. 21 (17), E6351. doi:10.3390/ijms21176351
Venet, M., Sa Ribeiro, M., Décembre, E., Bellomo, A., Joshi, G., Villard, M., et al. (2021). Severe COVID-19 patients have impaired plasmacytoid dendritic cell-mediated control of SARS-CoV-2-infected cells. MedRxiv. 21262969. Preprint. doi:10.1101/2021.09.01.21262969
Wilk, A. J., Rustagi, A., Zhao, N. Q., Roque, J., Martinez-Colon, G. J., McKechnie, J. L., et al. (2020). A single-cell atlas of the peripheral immune response in patients with severe COVID-19. Nat. Med. 26 (7), 1070–1076. doi:10.1038/s41591-020-0944-y
Keywords: single-cell data, cell type annotation, PBMC, COVID-19, type I interferon
Citation: Xu C, Lu H and Qiu P (2022) Comparison of cell type annotation algorithms for revealing immune response of COVID-19. Front. Syst. Biol. 2:1026686. doi: 10.3389/fsysb.2022.1026686
Received: 24 August 2022; Accepted: 12 October 2022;
Published: 24 October 2022.
Edited by:
Yuying Xie, Michigan State University, United StatesReviewed by:
Zhaoheng Li, University of Washington, United StatesYuexu Jiang, University of Missouri, United States
Copyright © 2022 Xu, Lu and Qiu. This is an open-access article distributed under the terms of the Creative Commons Attribution License (CC BY). The use, distribution or reproduction in other forums is permitted, provided the original author(s) and the copyright owner(s) are credited and that the original publication in this journal is cited, in accordance with accepted academic practice. No use, distribution or reproduction is permitted which does not comply with these terms.
*Correspondence: Peng Qiu, cGVuZy5xaXVAYm1lLmdhdGVjaC5lZHU=