 Jacob D. Davis
 Daniel V. Olivença
 Sam P. Brown2,3
 Eberhard O. Voit
94% of researchers rate our articles as excellent or good
Learn more about the work of our research integrity team to safeguard the quality of each article we publish.
Find out more
REVIEW article
Front. Syst. Biol. , 26 October 2022
Sec. Data and Model Integration
Volume 2 - 2022 | https://doi.org/10.3389/fsysb.2022.1021897
This article is part of the Research Topic Education in Systems Biology 2022 View all 5 articles
The Lotka-Volterra (LV) model was introduced in the early 20th Century to describe predator-prey systems. Since then, the model has been expanded to capture the dynamics of numerous types of interacting populations and to include the effects of external factors from the environment. Despite many simplifying assumptions, the LV approach has proven to be a very valuable tool for gaining insights into the dynamics of diverse biological interaction systems. In particular, recognizing the critical importance of microbiomes for human and environmental heath, LV systems have become effective tools of analysis and, indeed, the default for quantitatively assessing interactions within these large microbial communities. Here we present an overview of parameter inference methods for LV systems, specifically addressing individuals entering the field of biomathematical modeling, who have a modest background in linear algebra and calculus. The methods include traditional local and global strategies, as well as a recently developed inference method based strictly on linear algebra. We compare the different strategies using both lab-acquired and synthetic time series data. We also address a recent debate within the scientific community of whether it is legitimate to compose large models from information inferred for the dynamics of subpopulations. In addition to parameter estimation methods, the overview includes preparatory aspects of the inference process, including data cleaning, smoothing, and the choice of an adequate loss function. Our comparisons demonstrate that traditional fitting strategies, such as gradient descent optimization and differential evolution, tend to yield low residuals but sometimes overfit noisy data and incur high computation costs. The linear-algebra-based method produces a satisfactory solution much faster, generally without overfitting, but requires the user to estimate slopes from the time series, which can introduce undue error. The results also suggest that composing large models from information regarding sub-models can be problematic. Overall, there is no clear “always-best method” for inferring parameters from data, and prudent combinations may be the best strategy.
The Lotka-Volterra (LV) modeling framework was introduced in the early 20th Century by biophysicist Alfred Lotka (Lotka, 1920) and mathematician Vito Volterra (Volterra, 1926) to describe predator-prey systems. Throughout the years, the framework has been expanded to capture the dynamics of numerous types of interacting populations and also to include the effects of external factors from the environment (Stein et al., 2013; Dam et al., 2020). The traditional LV model structure is simple because it makes several assumptions, which are, strictly speaking, not quite true. These include constancy of the food supply for the prey species, lack of (physiological or evolutionary) adaptation of all participating populations, and initial proportionality between the size of each population and its rate of growth, which yields exponential growth if the population is unaffected by others. In spite of these simplifying assumptions, the LV model has proven to be a very valuable tool for gaining insights into the dynamics of numerous diverse biological interaction systems, for instance, among different mammalian or fish species (Wangersky, 1978), bacterial lake communities (Dam et al., 2016), and freshwater ciliates (Muhlbauer et al., 2020), to name just a few. Furthermore, recognizing the critical importance of microbiomes in recent years, LV systems have become an effective tool of analysis and, indeed, the default for quantitatively assessing interactions within these large microbial communities (Mounier et al., 2007; Buffie et al., 2015; Dakos et al., 2020; Dimas Martins and Gjini, 2020). LV models have moreover been proposed in non-ecological contexts, such as physics (Nambu, 1986; Hacinliyan et al., 2010), economics (Chiang, 2012), and to address pollution issues (Haas, 1981; Zhou and Chen, 2006). Finally, rigorous mathematical analysis has demonstrated that the LV model structure, while rigid and simple, is extraordinarily rich and indeed able to capture any differentiable nonlinearities if sufficiently many “auxiliary” variables in LV format are introduced (Peschel and Mende, 1986; Voit and Savageau, 1986; HernandezBermejo and Fairen, 1997). These nonlinearities include the entire spectrum from monotonic trajectories to bifurcations, damped and stable oscillations, and deterministic chaos (Sprott et al., 2005; Vano et al., 2006). Sometimes, LV models are considered old-fashioned and inferior to more modern methods of systems biology. However, due to their simplicity and intuitive structure, they are often excellent baseline models for potential comparisons with more sophisticated models. One might add that LV models have been used in almost 500 PubMed-listed studies over the past decade alone.
The generic LV system for n populations or species xi takes the form:
where the non-negative parameter
For the case of a single species (n = 1), the LV model simplifies to the logistic equation
(Verhulst, 1838). The growth rate,
This carrying capacity term implicitly includes information about the spatial and nutritional environment of the species. For example, it has been shown that the amount of carbon initially available to a bacterial culture contributes to the species’ carrying capacity (Rattray et al., 2022).
The typical growth curve of a bacterial population in an experimental setting has three phases (Figure 1) (Madigan, 2015). During the initial lag phase (Lotka, 1920), the population does not grow all that much, as the bacteria adjust to their new environmental or experimental conditions and optimize their metabolic responses. This lag phase is not always observed in an experimental setting though. In the subsequent exponential phase (Volterra, 1926), bacteria rapidly divide. This phase ends once one of the essential nutrients is used up or some waste product inhibits further growth. Thus, the population enters a stationary phase (Dam et al., 2020), where the rates of growth and death of cells are roughly equal. One could add to these phases a fourth decline (or death) phase, where cells can no longer divide as quickly as they die, thereby causing a decrease in population density, which is often modeled as an exponential decay function. This categorization into phases is somewhat simplistic, and other phases, such as diauxic growth and different death phases, may be observed in an actual setting (Navarro Llorens et al., 2010; Boulineau et al., 2013).
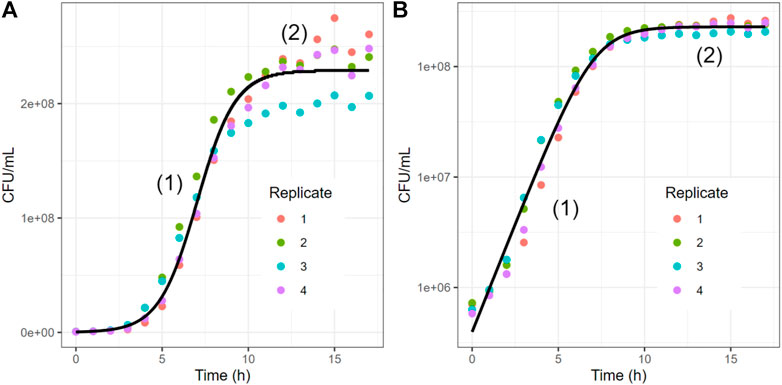
FIGURE 1. Typical Experimental and Simulated Growth Trends of a Single Bacterial Population. Colored dots represent four replicates of a growth curve of E. coli (see Methods). The black curve represents the fit of the data with a logistic equation (one-variable case of LV, here
Note that the Lotka-Volterra model does not account for the death phase of a generic bacterial population growth curve, as it addresses static environmental conditions. In principle, time-dependent environmental factors, such as substrate availability, can be incorporated in the LV equations with additional terms (Stein et al., 2013; Dam et al., 2020), but such environmental data are seldom experimentally available (Piccardi et al., 2019). In practice, points during the decay phase are often ignored, though they could be fit with some additional function. An alternative to the Lotka-Volterra model for species growth is the Monod equation (Monod, 1949), which incorporates a limiting substrate, such as a carbohydrate. The logistic equation can be seen as a special case of this Monod equation (Kargi, 2009). Though multi-species versions for the Monod equation exist (Huisman and Weissing, 1999), this equation does not account for species interactions that are not resource mediated and requires temporal tracking of limiting resources, which is a major practical limitation in addition to other technical limitations of the model (Muloiwa et al., 2020).
The two-variable case (n = 2) of the Lotka-Volterra model includes three terms for each species: one growth term (
The sign of each interspecies interaction term represents the type of relationship between the two species, which can be categorized as presented in Table 1. The balances among all terms in these equations determine the dynamics of the community.

TABLE 1. Types of interactions between two Species.
For larger communities, such as food webs and human or environmental microbiomes, the values of these growth and interaction parameters are typically not known, and it is often even unclear a priori whether they are positive, negative, or zero. However, as the nature of these interactions is needed to understand the dynamics of a mixed community, it is often the primary goal of a quantitative LV analysis to infer the types of interactions among species and, thus, the signs of the interaction parameters. The strengths of the interactions, that is, the magnitudes of the parameter values, are important as well, at least to some degree, because they are used to assess system stability (Allesina and Tang, 2012). The inference of parameter signs and values from observational data is computationally achieved with optimization methods of parameter estimation. Typical methods, which are discussed later, include grid searches, gradient descent methods, various evolutionary algorithms, such as genetic, ant colony or swarm algorithms, simulated annealing, as well as newer methods based on linear algebra. For a general introduction to typical numerical optimization methods see (Nocedal and Wright, 2006). In this paper, we provide a gentle introduction to parameter estimation for non-linear differential equation systems. As our main focus, we review and compare the concepts of representative methods specifically for inferring the parameters of LV models from observational time series data, using microbial communities as our central target. We also discuss preparatory data management steps that facilitate the inference process.
The growing recognition of the importance of diverse microbial communities has revived the interest in LV systems. Recent work has shown that LV can be a good approximation for both nutrient-limited and complex microbial systems (Dedrick et al., 2022). As representative examples, Buffie et al. used LV models to assess the emergence of C. difficile in antibiotic treated gastrointestinal tracts (Buffie et al., 2015); Venturelli et al. studied the interactions in synthetic gut communities using a twelve-species system (Venturelli et al., 2018); and Mounier et al. inferred interactions within a community of cheese microorganisms (Mounier et al., 2007).
Applying simple mathematical models to microbes faces challenges associated with critical assumptions that are not necessarily true in bacterial communities (Fort, 2020). For LV models, these assumptions postulate that:
1. The populations are well mixed;
2. All parameters are fixed in time (i.e., no environmental changes, physiological adaptation, regulatory shifts or evolutionary changes are taken into account);
3. There are no higher-order interactions in a sense that, for instance, Species three might alter the interactions between Species one and 2.
In an experimental setting, a researcher can control for these issues to some degree, for instance, by constantly shaking the cultures during growth (assumption 1) or growing only two species together (assumption 3). The environmental changes in assumption two are potentially addressed by the use of a chemostat, which however still allows for adaptations and evolution (Gresham and Dunham, 2014).
For this overview, we will use three datasets of a slightly different nature that allow us to highlight various aspects of data analysis and the inference of LV parameter values from data in an effective manner. One consists of computationally simulated data of a community of four species growing within the same environment. The advantage of this dataset is that we have complete knowledge of the interactions and can therefore assess the efficacy of different methods most acutely. The other two cases address real-world experimental datasets, which allow us to explore the feasibility and applicability of various methods in practice. First, we examine a recently-published four-species model derived from an industrial context (Piccardi et al., 2019); we then examine a three-species microbial community that we experimentally composed and studied de novo.
The synthetic dataset was created from a simulated LV system and consists of trajectories of four species, with or without superimposed noise. All parameters (growth rates, carrying capacities, and interaction terms) were selected to fall within the range of -2 to 2.5 (see Supplementary Table S5). The data were designed such that all species coexist in various scenarios.
As the first real-world application, we analyze a dataset published recently by Piccardi et al. (Piccardi et al., 2019). The authors co-cultured populations of four species of bacteria capable of degrading metal working fluid (MWF), an industrial coolant and lubricant. This fluid is interesting as it contains both growth substrates and toxic biocides. The authors’ goal was to determine if toxicity from the fluid affects the interactions among the species. They quantified these interactions by comparing the growth curves of each species. Specifically, they used as the metric for comparisons the area under a (growth) curve (AUC), which was obtained from fitting observations at several time points. The authors argued that a lower AUC value of a species, grown in the presence of another organism, compared to the AUC value during monoculture growth would indicate a negative interaction, and vice versa. We use for our illustrations the data from Supplementary Figure S8 of (Piccardi et al., 2019).
In addition to the synthetic and previously published datasets, we composed de novo a community of three model bacterial species, Vibrio cholerae, Staphylococcus aureus, and Escherichia coli (Choi et al., 2005; Ibberson et al., 2016; McNally et al., 2017) which all constitutively produce a distinct fluorescent protein. This fluorescence permitted hourly fluorescence tracking over three daily passages (Figure 2). Experiments were performed in monoculture, pairwise, and with the full 3-species community. We used an equal ratio of 1:40 (or 1 μl per 40 μl) cells grown from each overnight monoculture in fresh medium for pairwise experiments; a ratio of 1:60 was used as inoculum for three-species experiments. The data are available online at (Davis et al., 2022).
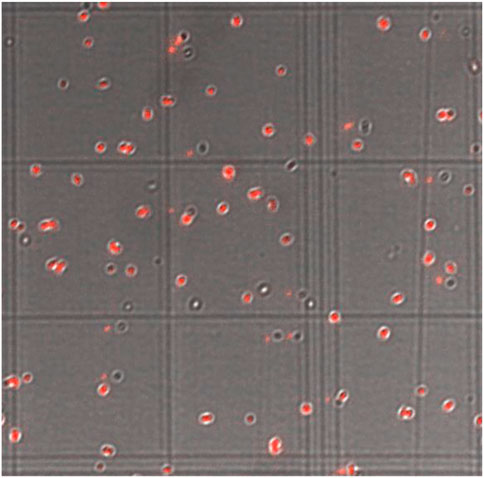
FIGURE 2. Hemocytometer Image of a Culture of S. aureus Expressing dsRed Fluorescent Protein. Squares are 100 × 100 μm with a depth of 10 μm. An average of four squares was used to calculate density in CFU/mL.
To extract growth and interaction parameters from a time series dataset, it is advisable to arrange the data in a format that facilitates computational analysis as much as feasible. The preparation might begin with “cleaning” the data by removing duplicates, statistically significant outliers, and dealing with missing values, either by inferring them or removing suspicious observations upon statistical diagnostics (Rousseeuw and Hubert, 2011; Aggarwal, 2017). If need be, the data must be converted into the same standard unit, such as Colony Forming Units per milliliter (CFU/ml) in the case of bacteria. This step often involves a calibration, as data may have been gathered with different methods, yielding units related to luminescence (LUX), relative fluorescence (RFU), or optical density (OD). For most mathematical and statistical methods, it is helpful to organize data in either matrix form or a data frame format where the first column represents time and subsequent columns are observations. An example is a common format such as ###.csv or ###.txt. For a thorough review of data cleaning, see (Van den Broeck et al., 2005).
Researchers In microbiology are often interested in the steady state of multiple species within the experimental system, which consists of the absolute or relative sizes of all participating populations in a situation where these numbers do not change. While direct measurements of steady-state abundances are possible in many ecological systems, in vitro experiments pose a challenge: resources are often used up before the species have a chance to reach this equilibrium. To overcome this issue, it is common practice to “passage” the cells, that is, to take a small portion (aliquot) of the cells (generally 1–10%), remove them from the medium, and add them to fresh medium (Figure 3). While this procedure is helpful for keeping the populations from decaying, it makes the modeling process more difficult, as one must deal with a discontinuity at every passage, which is at odds with differential equation models, including Lotka-Volterra systems. This problem can be addressed through event handling: In many ODE solvers, callback functions can be implemented by stopping the simulation at a specified condition (i.e., at a certain time or when a variable reaches a certain value). The system can then be modified and the simulation resumes (Figure 4).
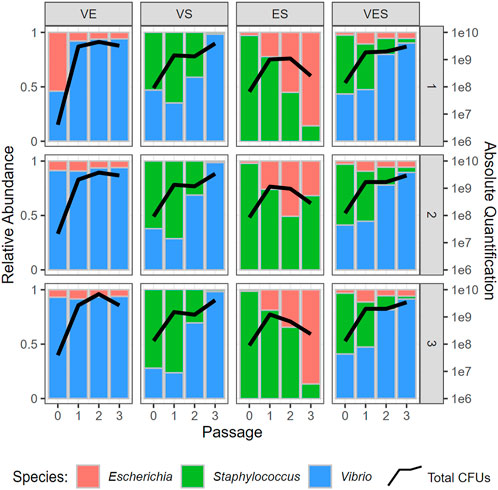
FIGURE 3. Experimental Results of de novo 3-Species System. Column panels display different combinations of co-cultured species (e.g., VS. = Vibrio and Staphylococcus), with each panel showing proportions of species observed at different passages. Passages 1, 2, and three happen at 24, 48, and 72 h, respectively. Each passage contains 25 hourly measurements (t = 0 to t = 24). Rows represent biological replicates of the experiment. Black lines indicate the overall community size at different time points. The y-axis on the left shows relative abundances, while the y-axis on the right represents logarithms of community sizes.
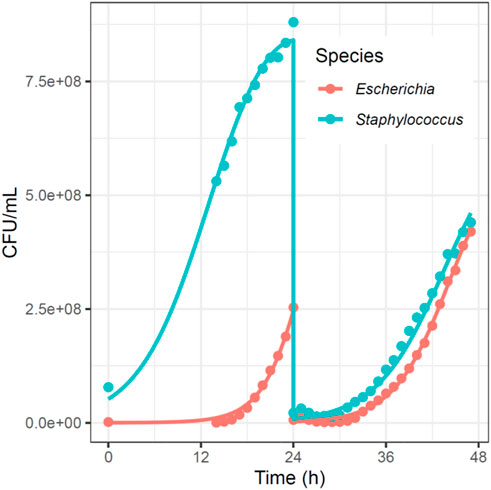
FIGURE 4. Experimental and Simulated Growth Curves of Two Bacterial Populations with Passaging; from the de novo Dataset. In this example, we passaged 2.5% of the cells at 24 h, resulting in a 1/40 reduction in density at the 24-h time point. In the ODE solver, we programed a callback: when the solver reached t = 24, we divided all populations by 40. This callback allowed us to use our normal parameter estimation methods despite the discontinuity.
Before models can be fit to data, one must choose a metric for deciding which of two sets of model parameters provides the better fit for the given dataset. The main criterion is generally the value of a loss function, which describes how different the estimated model predictions are from the true data. According to this metric, the optimal solution of a parameter estimation problem is the set of parameters that correspond to a model instantiation with the smallest loss function.
Several loss functions are in common use. The most prevalent defaults are the sum of squared errors, SSE, the SSE divided by the number of parameters to be estimated, SSE/p, or the SSE divided by the number of data points, SSE/n. Frequent alternatives include the mean absolute error (MAE) and the coefficient of determination (R2), which measures the proportion of the dependent variable’s variance that can be explained by the independent variable. (Reid, 2010).
Our analyses here will use the SSE, which is the sum of the squared differences between each data point and the predicted model estimate at that point:
For a perfect solution, this sum equals 0, but any level of noise will lead to a higher value. Thus, we look to determine the set of parameters that results in the smallest residual error.
“Regularization” is a process where one or more penalty terms are added to the loss function in order to solve ill-posed problems or prevent overfitting of data (Neumaier, 1998). LASSO (“L1-norm”) regularization seeks to minimize SSE, while also minimizing the number of non-zero parameters. This task is set up by adding a regularization hyperparameter
Lambda must be optimized, together with the other parameters, to give an optimal fit, thereby making the method computationally more expensive. Specifically, the general idea behind LASSO regularization is that a small improvement in SSE may not be worthwhile if the number of non-zero parameters increases. In other words, the researcher must balance two quantities that are not truly comparable: the SSE and the number of non-zero parameters. As a consequence of this required balancing,
An alternative regularization method is Ridge (“L2-norm”, or Tikhonov) regression (Tikhonov et al., 1995), where the objective of the optimization is to balance the data fit with the total magnitude of all parameters:
The Ridge approach tends to minimize the values of all parameters, thus penalizing parameters with large magnitudes, but it does not generally remove parameters from the model. Methods have been devised to determine the optimal value of the hyperparameter
Thus, LASSO regression tends to yield sparse sets of parameters and should therefore be used to fit large systems with minimally complex models, while Ridge regression often uses every available parameter but tends to avoid extreme magnitudes of the parameter values.
The elastic net approach combines both L1 and L2 regularizations:
While this method benefits from both, the LASSO and Ridge regression concepts, the elastic net regression obviously requires the optimization of two lambda hyperparameters (Zou and Hastie, 2005). Figure 5 and Table 2 illustrate the differences among the various alternative methods.
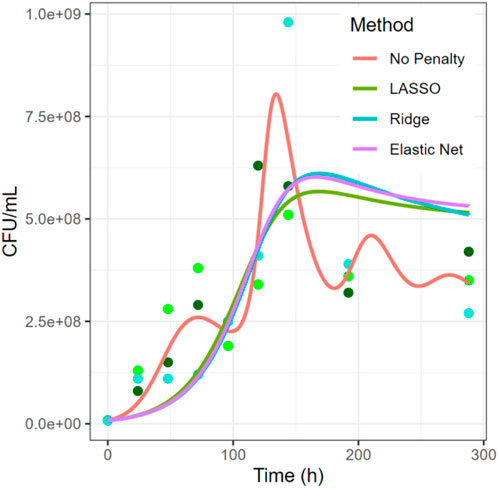
FIGURE 5. Comparison of Regularization Methods in the System of Piccardi et al. (Piccardi et al., 2019). While the estimation with no penalty is presumably overfitted, the other three approaches produce much smoother solutions. The data shown represent the growth of C. testosteroni from the 4-species experiment. Three dots at each timepoint represent three biological replicates. Results for additional species are shown in Supplements.
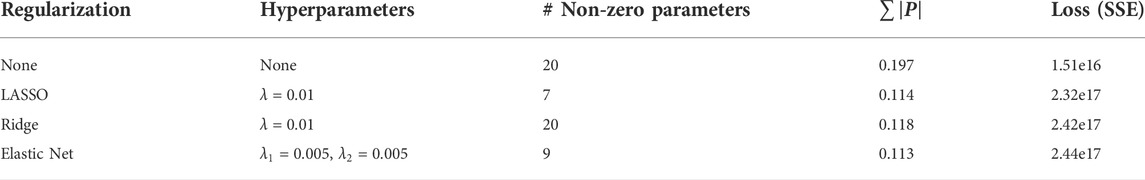
TABLE 2. Comparison of Penalties in loss functions. Here
In the example of Figure 5, all three methods using a penalty term have similar curves for one the species shown, but very different parameters, both in amount and magnitude (see Supplementary Table S1). The estimation with no penalty term has the lowest error but appears to be overfitting the data, based on the biological assumption that the over- and undershoots between hours 50 and 150 are unlikely to be true, and therefore the model fit is “chasing noise” in the data. The LASSO and elastic net approaches shrink the number of parameters from 20 to seven or 9, respectively. In both estimations, all four growth terms are kept, together with
In addition to the consideration of differences between model and data, a possibly important additional criterion for choosing a loss function is “normalization,” which is achieved by dividing each residual by the value of the data point. This step can be useful in cases where the variables operate at different orders of magnitude, because otherwise the noise in high-valued variables might dominate SSE, thereby leading to poor fits for low-valued variables. It may furthermore be beneficial to weigh the importance of outliers in the data. A good reference is Chapter 10 of (Hastie et al., 2009).
While the SSE, with or without regularization and normalization, is arguably the most important criterion, a minimal residual error should not be the only criterion, for several reasons (Voit, 2011). First, one should remember the extreme case of a high-dimensional polynomial, which can be constructed to fit any finite dataset perfectly (Camporeale, 2019). While the SSE is thus 0, one problem with this approach is that its parameter values do not have much biological meaning. The polynomial has two additional problems: First, the removal or addition of even a single data point typically changes the entire parameter set (the coefficients of the polynomial) drastically. Second, extrapolations toward higher values of the independent variable tend to converge to ∞ or –∞.
A somewhat related issue with sole focus on the SSE is overfitting, which we saw to some degree in Figure 4 and which can be caused by the use of more model parameters than are warranted by the data. To some degree, overfitting can be diagnosed by leaving data points out of the fitting process, fitting again, and comparing the resulting parameter sets. If these vary greatly, overfitting is a likely explanation. Practically, the estimation should be performed with a percentage of the data points (the training set) and validated against the remaining points (the validation set) (Hasdemir et al., 2015). Numerous other issues outside the residual error between data and model fit should be taken into account when deciding on the “best” solution (Voit, 2011) (Figure 5).
It happens quite often that the parameterization of systems yields many good solutions which, however, consist of somewhat or even completely different parameter values, as shown in the earlier regularization example. The reason can be the existence of an entire solution domain with the same or very similar SSEs. One scenario is an entire (one- or multi-dimensional) surface or domain of solutions with exactly the same SSEs, in which a search algorithm determines all points to be optimal solutions. It is also possible that different parameter sets yield SSE values that are so similar that the optimizer cannot distinguish them. Yet another possibility is that each point (i.e., parameter set) within this domain corresponds to an isolated local minimum, i.e., a point with a small loss function surrounded by (slightly) larger ones, which local optimizers tend to find. The smallest loss function value in the entire search space is found at the global minimum, but this exact point can often be difficult to obtain. Global optimizers, such as evolutionary algorithms, grid searches, and sampling methods, are designed to find the global minimum, but they usually only reveal the neighborhood of the global minimum by stopping before they find the exact value.
While mathematically intriguing, the differences between the absolutely smallest possible SSE and parameter sets with slightly higher values are biologically irrelevant and it might actually be preferable to determine all parameter sets with a “sufficiently small” SSE. After all, data with replicates or multiple scenarios are very likely to lead to slightly different answers within the solution domain. Thus, a modern approach to this problem is not to strive for the absolute optimum but to identify whole clusters of different, almost-optimal solutions. Subsequent to this identification is the use of statistical methods to assess how much the parameter combinations may vary without substantially affecting the accuracy of the data fit (Figure 6). This approach has become known as ensemble modeling (Kuepfer et al., 2007; Lee et al., 2014).
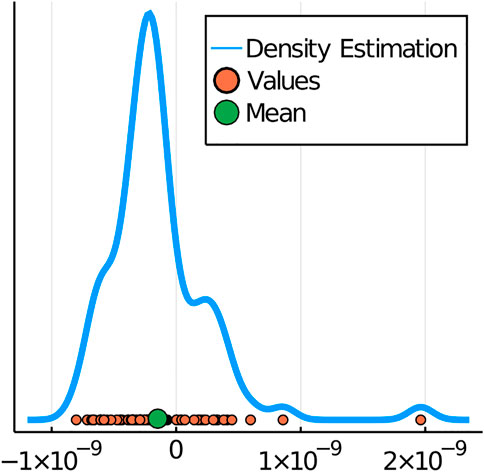
FIGURE 6. Density Plot of a Parameter with Values from All Combinations of Replicates. The four-species case with three replicates from the dataset of Piccardi et al. (Piccardi et al., 2019) permits three rank-four replicates and three replicates with each species removed, giving a total of 3^4 different combinations. The values of the same parameter inferred from each of the 81 combinations are displayed in orange and their mean is indicated with the green dot. Here, the mean value of the parameter is about -1.48*10–10, and the standard deviation is 3.96*10–10. The blue distribution curve is fitted by using kernel density estimation.
One interesting estimation issue particular to mixed community systems is the general strategy for inferring interactions. Should one perform replicates of experiments with all populations of interest and then estimate all interactions at once (top-down), or should one instead (bottom-up) create monoculture experiments to estimate growth and saturation parameters for each species, then two-species experiments, from which pairwise interaction parameters are inferred, and then successively larger communities, where the earlier parameter values are considered known from the previous experiments? Both strategies present strong pros and cons, and much of the answer is driven by the size of the system, which becomes evident from a thought experiment for a moderately large system: To infer parameters for a system with
By contrast, suppose the interaction parameters for co-cultures of two or three species at a time had been estimated from corresponding experiments and that new experiments with these species plus one or two new species were to be analyzed. Given the quadratic increase in parameters characterizing a community (
Thus, the bottom-up approach offers a “pro” side by dissecting a large optimization task into smaller ones, each having to deal with considerably fewer “free” parameters, which would make the estimation problem much easier to solve, requiring less computation time and minimizing redundancies among the parameters. Also, each solution space would have considerably fewer dimensions, which increases the likelihood that a search algorithm is able to find the optimal solution.
On the “con” side, however, the bottom-up approach may not even be valid, mathematically or biologically. On the mathematical side, constructing a model parameterization from the bottom up in a stepwise manner may constrain each of the later estimation tasks too much, ultimately yielding faulty conclusions. Namely, if the parameter values obtained from the smaller models are not entirely appropriate for the larger model, the solution space will be unduly restricted and may no longer contain the correct solution. On the biological side, even if the correct parameter values had been obtained for intrinsic growth rates, as an example, the interactions among the species in the larger model could alter the growth characteristics of one or more species (i.e. there are higher-order interactions). Moreover, the two-species interaction terms could possibly be altered in value—or even sign—in a three-species model. Such effects are a problem when higher-order interactions take place between several species. An example of higher-order interactions was experimentally demonstrated in the zebrafish gut microbiome, where researchers showed that the addition of microbial species dampened the strengths of the interactions between other species pairs, thereby contributing to the stability of the community (Sundarraman et al., 2020). Whether this finding is true in general is unknown. The standard LV model is not equipped to handle these types of complex interactions directly, and the question becomes how well the LV model which, like all other models, is a simplifying approximation, still reflects reality and at least permits reliable predictions of the signs of interactions.
As an illustration, we analyze again data from the earlier mentioned system with four species (Piccardi et al., 2019), but use a different example from the study. Figure 7 displays the results of an analysis where we inferred the parameters in four different ways:
1. using a top-down approach with no previous assumptions regarding the parameter values, where all parameters are fit simultaneously;
2. adopting growth rates from single-species experiments and fitting all interaction parameters from data of the four-species experiment;
3. adopting growth rates and carrying capacities from the single-species experiments; and
4. using the growth rate and carrying capacity from each single-species experiment, as well as the interaction parameters from two-species experiments; in this case, all parameters were thus considered known and the four-species data were only used as validation, because no parameter was left to be fitted.
The results in Figure 7 highlight several issues that may or may not emerge in the various estimation strategies. Overall, it is clear that overfitting is reduced when some of the parameters are fixed. The estimation without former knowledge (all parameters free; Top Down) and the estimation with fixed growth rates, leaving 16/20 parameters to be estimated, produce over- and undershoots caused by the algorithm attempting to fit all data points with the minimal SSE. It is unlikely that this is the true dynamics of the system, although we cannot be sure. Regularization methods (above) would presumably tame these over- and undershoots.
FIGURE 7. Comparison of Top-Down vs Bottom-Up Methods. Shown here is growth of Ochrobactrum anthropi. Time is in hours and abundances are in CFU/mL on a logarithmic scale. The colors of dots represent three replicates. Data from (Piccardi et al., 2019).
On the other extreme, the estimation that exclusively uses single-species and two-species parameter values, so that no parameters remain to be estimated (All Fixed; Bottom Up), overestimates the density at virtually all time points, thus indicating that the growth of individual species is affected and/or that some of the interactions change in the transition from the two-species systems to the combined four-species system.
In this example, the estimation that adopts the growth parameters (Fixed Growth + Carrying Capacity) but leaves the interaction parameters free to be estimated displays a good tradeoff between accuracy and overfitting (Figure 7). Note that these fits are not regularized. It is not known whether this result is true with some generality.
We can also look at the signs of the interaction terms among the four species in (Piccardi et al., 2019) to see if they are reasonably similar when either fitted with the bottom-up or the top-down approach (Figure 8). Disconcertingly, more than half of the interaction signs are interchanged, thus suggesting drastically different relationships between the species (see Table 1). We do not know the true interaction structure for the bacterial community in (Piccardi et al., 2019), but there is clear indication that the two approaches yield different results. The reason may be that higher-order interactions are at play in the larger community, with a “new” species influencing the interactions between other species, i.e., that the interactions cannot be explained adequately by the Lotka-Volterra framework. Research has shown that more positive interactions occur in lower diversity systems (Palmer and Foster, 2022) and that pairwise interactions cannot always predict community outcomes (Friedman et al., 2017).
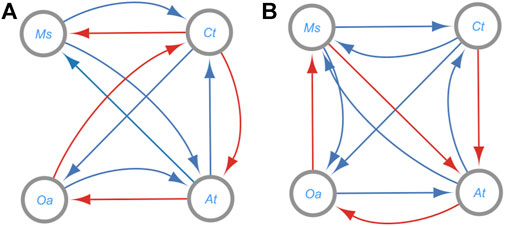
FIGURE 8. Differences in Signs of Inferred Interaction Terms from the Bottom-up (A) and Top-down (B) Fits for Data from Four Co-cultured Bacterial Species (Piccardi et al., 2019). The species are (A) tumefaciens (AT), C. testosteroni (CT), M. saperdae (MS), and O. anthropi (OA). The interactions are colored positive (blue) or negative (red); cf. Table 1. 80% of interactions in the bottom-up system and 60% of the top down system match the authors’ inferred interaction direction. No significant direct influence was detected for MS and OA and vice versa in (A); more exactly, the corresponding interaction terms were very close to 0. This is also the effect of OA on CT in (B).
The overall conclusion from this example is two-fold:
1. Caution is necessary when adopting parameter values from sub-models in combined community models. There is no guarantee that the lower-level parameter values validly translate into the larger model, because interaction parameters could possibly change in the presence of additional species, thereby leading to higher-order interactions. Without further experiments, it is not possible to discern which interaction structure is most likely. Turned into a positive argument, the different analyses indicate which interactions are presumably persistent among the alternative estimations and pose hypotheses regarding those interactions that are variable within an ensemble of candidate models.
2. Initially fixing some parameters may give reasonable initial estimates for fitting higher-dimensional systems, because one might argue that the earlier parameter values are probably not totally wrong but simply become modulated by the addition of species. In other words, it might be beneficial to pass the lower-level parameter values as initial guesses to the solver for the higher-level inference task, possibly with reasonable ranges. By providing these educated guesses, the solver may more readily converge to the optimal solution, although there is no guarantee. Once such a solution is obtained, it is advisable to vary the parameter values in the solution and re-estimate the system, in order to see whether the solution is more or less unique or part of a larger ensemble.
As some aspect of validation, we can look at the simulated system, which we know adheres to the LV interaction structure, and where we have a defined ‘ground truth’ of user defined parameters. Table 3 suggests that both parameter sets, from the bottom-up and the top-down estimations, are reasonably good when compared to the ground truth parameters. In fact, all parameters from the two-species bottom-up estimations roughly match the parameters obtained when estimating all four species together, at least in sign, and would, at the very least, offer good initial guesses for a subsequent gradient optimization (see below).
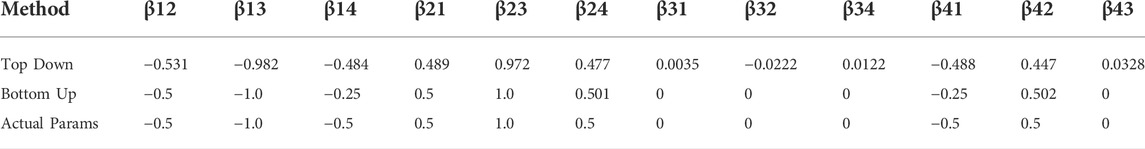
TABLE 3. Signs of inferred interaction terms from the bottom-up and top-down fits for data from four simulated bacterial species.
If the system under consideration is linear and time series data are available, it is usually straightforward to estimate optimal parameter values per multivariate linear regression (Kutner et al., 2004). This approach is similarly feasible, if the system becomes linear through some equivalence transformation. Notably, this is possible for LV systems, at least under favorable conditions (Voit and Chou, 2010).
The next three sections describe the concepts of different parameter estimation methods used by specialized search algorithms, with a focus on LV models. These algorithms are needed because explicit mathematical solutions are impossible to compute even for moderately sized models. Instead, the system is simulated very many times with different parameter sets and a loss function is calculated every time. The settings of each simulation are determined by the algorithm such that there is a reasonable probability that the value of the loss function decreases. General introductions and reviews of parameter search methods include (Gennemark and Wedelin, 2007; Chou and Voit, 2009; Gennemark and Wedelin, 2009; Voit, 2013).
The available classes of algorithms differ in the way new parameter sets are chosen. Many variations on each theme exist, and we focus here just on the basic concepts.
The general procedure of a search estimation consists of the following steps:
1. Enter the model structure into a search algorithm of choice and choose a loss function.
2. Based on general knowledge of the system, choose an initial set of parameters. The simplest choice consists of default values provided by the algorithm. However, if any information regarding the parameters is known, using this information can speed up the algorithm tremendously. For instance, it is often known whether a parameter value must be positive or negative. By entering such a constraint, the search space is cut in half.
3. Enter the parameter values into the model and simulate.
4. Calculate the value of the loss function.
5. Let the algorithm change the current parameter values. This step allows tremendous variations and is the hallmark of each method.
6. Repeat steps 3-5 until an optimized solution is found or a predefined limit on the number of iterations is reached. The solution may be the actual optimum, but that is not always guaranteed. For instance, it may be a local—but not the global—minimum of SSE.
Uncounted search algorithms, many with additional variations, have been published. All have advantages and disadvantages, but there is still no silver bullet that successfully, reliably, and effectively yields the optimal solution every time. The various types of algorithms can be categorized as shown in the following sections.
We do not mention the possibility of using maximum likelihood estimation (MLE). While this method effectively reduces the problem of overfitting in statistical applications (Reid, 2010), MLE is not really useful for dynamic systems that deviate considerably from a steady state, because the data, by their nature, are not independent and identically distributed, which is a prerequisite for MLE. The use of MLE could be beneficial, though, for assessments of noise in data relatively close to a steady state (cf. (Holmes et al., 2012).
Most methods directly–or with some coding–permit the setting of bounds for some or all parameters to be estimated. Such bounds are a blessing and also a problem. Of course, strong bounds can reduce the size of the search domain substantially. Also, it is often known, for instance, whether a parameter value should be positive or negative. However, the implementation of bounds in an algorithm is not always facilitated and may require specific coding.
A grid search is a brute force method of testing every combination of parameter values within a predefined set of bounds and with predefined density. As an example, consider our one-variable logistic equation. It contains two parameters, so that its estimation from data requires the creation of a two-dimensional grid that represents the growth rate α on the x-axis and β on the y-axis. In biological applications, we know that α must be positive and β negative. Hence, we initially set the search intervals within the fourth quadrant, for instance, as
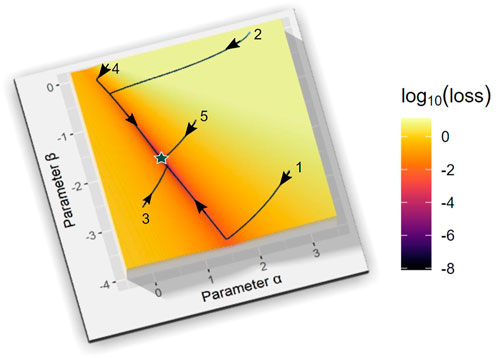
FIGURE 9. Estimation Results for the Logistic Model with Grid Search and Five Gradient-descent Optimizations. The grid search is within the parameter domain ([0,3], [-3,0]) for a and ß of a logistic equation. Grid sizes
In this example shown, the systematic grid search actually returns the exact parameter values, which we know, since their combination is located exactly on one of the grid points that were tested, but that is typically not the case, for instance, if the true values are irrational. However, even if the true solution does not lie on the grid, the search can provide a good estimate of the location where the optimal solution can be found.
Large, relatively coarse grid searches are sometimes a good initial step for determining the approximate locations of local minima and thereby provide a good starting point for more refined types of optimizations, including possibly a finer grid search within the neighborhood of the best local minimum determined in the previous step. This process, executed iteratively, has a good chance of leading to a parameter set close to the global minimum within predefined bounds, up to the accuracy of the grid size. Again, this result is not guaranteed, as it is theoretically possible that the coarse grid search determined locally the best solutions even though the true, global solution lies somewhere else.
Note that a grid search for two parameters can be easily executed and visualized, whereas plots of grid searches become infeasible with additional parameters and smaller discretization. For example, with 16 free parameters and using grid points with Δ = 1 in the range of [-5,5] in each dimension, which corresponds to just 11 possible values for each parameter, we must create a solution array of size 54·1112 = 1.96·1015 which, using floating point numbers (8 bytes each), would require allocating over 15 petabytes of memory. It would also take an extraordinarily long time to simulate each combination of parameters. Extrapolating solution times from the two-parameter case, solving all combinations would take over 211 s to solve, that is, nearly 7,000 years! Even then, this approach would only give us the solutions that assume parameter values to be integers between -5 and 5. Facing this “combinatorial explosion,” numerous methods have been proposed to alleviate the problem. Pertinent examples include Latin hypercube sampling and Monte Carlo simulation (Mckay et al., 1979; Luengo et al., 2020), where large random samples of parameter values are taken throughout the parameter space and solutions are compared. These are good compromises for otherwise computationally infeasible problems since they represent the search space within an acceptable time. A variation on this theme is importance sampling, where the most impactful parameters are emphasized and therefore chosen with a higher frequency than other parameters (Luengo et al., 2020).
Direct search methods include many variations of a fundamental algorithm that starts with a user-supplied initial guess of all parameter values, sometimes called a “guestimate,” locally searches for improved parameter sets close-by and moves the search in the direction of greatest improvement, that is, a lower value of the loss function. This process is iterated thousands or millions of times. Variations on this theme prominently include deterministic and stochastic steepest-descent and hill-climbing approaches, Newton-Raphson and Levenberg-Marquardt methods, and Simulated Annealing. The search-and-improve process is iterated until a predefined limit in the number of simulations is reached or until there is no more substantial decrease in the loss function when parameters are changed, indicating that a minimum has been detected. For a detailed account of these and other methods, see (Kochenderfer and Wheeler, 2019).
The most common direct search method is gradient descent. Generically, a gradient-descent optimizer takes an initial set of parameters {P0}, solves the model with these parameter values, computes the value of a loss function, typically SSE, and approximates the gradient of this function at {P0}. It then changes the parameters to a new set {P1} that is located in the negative direction of the gradient, which is therefore expected to yield a lower SSE. The distance of {P0} from {P1} is controlled by a hyperparameter, the learning rate. The algorithm then solves the model with set {P1}, computes SSE, and determines the gradient again. This process of local improvement is iterated thousands of times. Uncounted variations of gradient-descent based methods have been described in the literature.
While a very effective approach in principle, this type of approach is prone to getting stuck in local minima, each of which the algorithm considers a successful result, because all values close-by have a higher SSE, even though the global minimum, possibly far away, would have an even lower SSE. For more information, see Chapter 4 of (Goodfellow et al., 2016).
Recent techniques have been designed to avoid this local-minimum problem, for instance, by using adaptive learning rates and momentum-based methods (Qian, 1999; Duchi et al., 2011). Also, restarting the estimation with different sets of parameters may help to avoid allegedly optimal solutions at local minima. As a minor issue, these methods require that the model to be estimated is differentiable, which complicates the methods for models with discontinuities or points without derivatives; an example is
Simulated annealing is an effective algorithm that adds an important twist on the direct search algorithm: the possibility of not strictly following the gradient towards the local minimum. The likelihood of proceeding into a different direction is determined by the parameter T. T stands for temperature, in reference to annealing in metallurgy, which inspired this method. This method often works well, but is generally computationally expensive (van Laarhoven and Aarts, 1987).
Figure 9 visualizes the process of gradient-descent based parameter optimization with the same example of a logistic function as before. Here, the algorithm is set to start at five different points in the parameter space (initial guesses). In this simple case, they all converge quickly to the true minimum of the loss function, with the correct parameters. The optimizer used here is a variant of the ADAM optimizer (Kingma and Ba, 2014), which uses an adaptive learning rate based on the first and second moments of the gradient.
Evolutionary algorithms are global search methods superficially gleaned from the principles of biological evolution, where traits are randomly mutated and recombined from one generation to the next. Those mutations and recombinations leading to superior performance, in this case a lower SSE, have a higher chance of being passed on to the next generation. Evolutionary algorithms fundamentally consist of a series of generations of parameter sets that improve over time (Bäck, 1996). They mainly include genetic algorithms (Michalakelis et al., 2012), differential evolution (Storn and Price, 1997), ant colonies (Dorigo and Stützle, 2004), and particle swarm optimization (Mosayebi and Bahrami, 2018), but also others.
The generic steps of these types of algorithms are:
1. Selection–A population of candidate solutions (parameter sets) is evaluated against a loss function; the fittest solutions (with the lowest SSEs or other loss function values) are given the highest probability to produce offspring for the next generation. The population size can be determined by the user: higher population sizes offer more candidate solutions, but solutions take longer to compute. Candidate solutions can be chosen by several different methods, such as tournament selection, steady-state selection, or elitism selection (Blickle and Thiele, 1996). It has turned out that it is advantageous to make the choice probabilistic, thereby allowing some less-fit solutions to enter the next generation, although with a low probability.
2. Recombination–In this key process, which is also called crossover, two parent solutions from the previous generation are combined stochastically to create a new candidate solution. Specifically, all parameter values are sequentially arranged into a string, often called a chromosome, and the first portion of the offspring chromosome comes from one parent and the remainder from the other parent. The cut-off is determined stochastically. These candidate solutions are evaluated with respect to their SSEs, and solutions with the lowest SSEs among parents and offspring will constitute the new generation of parameter sets. These details vary depending on the algorithm. Most parameter changes emerge in this step of the optimization.
3. Mutation–With a very small probability, bits of candidate solutions can be mutated before they reach the new generation. This option is meant to replicate biological mutation and maintain diversity in the population. Without mutation, candidate solutions may become too similar and never approach the optimal solution.
This three-step process generally ends when solutions no longer improve after a certain number of generations. Other stopping conditions include the number of generations or a time limit. The various types of evolutionary algorithms use different methods for arranging recombination and introducing mutations. Unlike gradient descent methods, evolutionary methods do not require the system under investigation to be differentiable. For more information on evolutionary strategies see (Simon, 2013).
For the purpose of comparison in a later section, we will use radius-limited differential evolution, as implemented in (Wang et al., 2014a).
As an example, consider the tracking of an evolutionary parameter search for the logistic function whose global minimum is at (2.5, -2.0) (Figure 10). Starting at (0, 0) (Generation 0), the solution quickly jumps to around (4.96, -2.59) in Generation one and to (3.71, -2.82) in Generation 2. Generations three through seven do not find better solutions than what had been found in Generation 2. The solution of Generation eight holds for nearly 200 generations until a solution is found in Generation 195 that is considerably closer to the true minimum. The solution is now slowly improved further with a solution at about (2.84, -2.28) in Generation 503. Additional minor improvements ensue successively until Generation 5314, which is the last generation where the solution improves, and the algorithm terminates with a final solution of (2.502, -2.002), which is approximately correct.
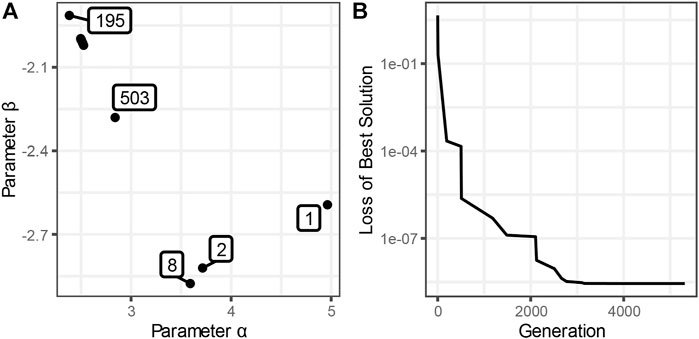
FIGURE 10. Progression of an Evolutionary Optimization. This figure uses the same logistic function as in Figure 9. (A) The solution successively migrates from the first population of estimates, with the minimum SSE for parameter set (4.96, -2.59), to the cluster of points in the upper left, where the solution is fine-tuned in generations 1486–5314. The true solution is at (2.5, -2.0). (B) The SSE is improving in distinct steps and converges to about 2.8·10–9 at generation 5314.
Note that evolutionary methods are unlikely to find the precise minimum of the loss function, since the parameters are randomly generated, and a criterion for cutoff must be defined, which is generally a set number of generations or a successive number of generations without solution improvement. In fact, once the algorithm stops, we do not really know if the algorithm has found a value close enough to the true solution. One should however note that most modern algorithms usually do a good job avoiding local minima, which is the Achilles heel of gradient-based methods. Thus, it is often a good strategy to start with an evolutionary algorithm, let it evolve to a reasonably good solution and then to use the result as a very good starting point for a direct search method, such as a gradient method.
All the above methods are directly applicable to LV systems. However, in stark contrast to the direct and evolutionary search methods, and due to their specific structure, many other approaches have been proposed for general or specific LV inference tasks. We present two methods here: ALVI-LR (Algebraic LV Inference by Linear Regression) and ALVI-MI (Matrix Inversion). Both can be used as stand-alone estimation algorithms or as tools for quickly determining candidate solutions that are to be subsequently fine-tuned with gradient-descent based methods.
ALVI-LR. An n-dimensional LV system
can be rearranged by moving each
If time series data of sufficient quantity and quality are available, both
for each time point
and approximately true for reasonably small
An often-better approximation is the averaged slope in the “three-point formula”
For data of exponentially changing populations, it is furthermore possible to estimate slopes in terms of logarithms: Because
one may perform the estimation of
Further information on slope estimation can be found in (Voit and Almeida, 2004). It should be noted that it is often advantageous to smooth the data, for instance, with a smoothing spline, and to compute slopes from this spline (see below).
To summarize, if data are available at K time points, they may be used to estimate the slopes for the left side of Eq. (Mounier et al., 2007). at each time point and also to populate the xj’s on the right side, resulting in K linear algebraic equations per variable. Subsequent linear regression is used for each xi to calculate the
For ease of discussion of the inference task, we may collect the parameters into a vector p, which depends on the xi’s, and reformulate Eq. (Mounier et al., 2007). as
Written in matrix form (where
It is known that noise in observation data is exacerbated in their slopes (Knowles and Wallace, 1995). This issue can be addressed by smoothing the raw data. For example, Liao et al. had good success fitting parameters when using empirical mode decomposition (Wang et al., 2014b; Liao et al., 2020). Other common smoothing techniques include splines and the LOESS method (Cleveland, 1979). For more information on smoothing see (Olivença et al., 2021). In general, there is no strict criterion guiding the decision when smoothing is necessary or beneficial. A somewhat vague rule is to smooth the data if the signal-to-noise ratio in the sample is so low that it is difficult to discern whether certain features in the data, like peaks or overshoots, are biologically reasonable or due to randomness. Smoothing should also be considered if slopes of the time trends are to be estimated and if the estimates of subsequent slopes vary much in magnitude, and especially in sign.
Smoothing offers other important advantages, beyond reducing the effects of outliers and noise. Namely, upon smoothing the trends in the data, values of xi and the corresponding slopes may be estimated at any points within the reported time interval, thus increasing the base for performing regression. Moreover, slopes can be estimated algebraically from the spline function.
One might ask: If the data are smoothed, why is it even necessary to estimate an LV model? The answer is that smoothing functions typically contain numerous parameters who have no biological meaning whatsoever. In particular, they do not reveal anything about the nature of the interactions among the population in a mixed community.
Thus, an effective inference consists of the following steps:
1. Smooth the data, if necessary;
2. Estimate values of xi and of slopes
3. Choose a loss function;
4. Minimize the loss function using Least-Squares Regression, possibly with normalization and/or regularization.
As an example, consider a two-variable system and choose Δt = 1. The first equation then reads
For a dataset of 11 time points (t = 0, ..., 10), we thus obtain a vector (B) of 11 slope estimates for species x1. Using the slope estimate from above, we obtain:
We also formulate a data matrix (A) of values of x1 at different time points:
The result at each time point is B = A⋅P. In this formulation, Δt is incorporated in the elements of the vector B. This type of equation is established for each variable in a multi-species system. Each species has its own unique B matrix, but the A matrix is the same for all species. Matrix A has an additional column of 1s for each species. The optimal parameters correspond to the solution of the equation set A⋅P-B = 0. Due to noise or the fact that the smoothed trends are not exactly captured by the LV equations, the task is now to minimize the function AP-B, which is most easily accomplished with least-squares regression. Once all parameter values are inferred, they are plugged into the LV equations to assess the goodness of fit. While we have not used bounds on possible parameter values, they may be imposed on some or all of the parameters in ALVI-LR estimation tasks.
ALVI-MI. The previous section has demonstrated that the inference task for LV models becomes linear if time series data are available from which values xi and slopes are estimated. Above, we assumed data at K time points and obtained the solution by linear regression. An alternative is the following. Instead of using values at all K time points, one uses only n+1 time points. Assuming that the data and slopes at these points are linearly independent, the matrices A and B lead to a system of linear equations that can be solved by simple matrix inversion. The fact that only n+1 time points are used for each solution, poses advantages and disadvantages. On the one hand, the best sample(s) need to be determined. On the other hand, retaining all results with low SSEs naturally generates an ensemble of well-fitting models.
As an illustration, we revisit the simulated example of four variables with the following data points, with the average of three replicates, superimposed with 5% Gaussian noise (Table 4).

TABLE 4. Simulated data for the four species system.
First, we choose n+1 time points. We should select a representative (spread-out) sample, so we choose points 1, 2, 3, 8, and 9. We can use the LOESS method to smooth our slopes, as shown in (Olivença et al., 2021), which gives the matrix slightly different values than the data points in Table 4. This step is not necessary for the method to work but may yield slightly better inferences. It results in the following matrices, with A being the data matrix and Bi the vector for species i:
Here, each slope is divided by the ∆t between time points sampled. This is done automatically in the ALVI software (see Software). We now perform regular matrix inversion for each B and use inv(A)⋅B to obtain parameter values for the system. The best results are usually obtained by choosing points that capture the dynamics of the system well. Solutions with the lowest SSEs are retained and collected as an ensemble. Figure 11 and Table 5 display the results of a collection of nine sets of points with the lowest SSEs. Among them, the points 2, 3, 5, six and nine produce the solution with the lowest SSE. Some of these solutions may be discarded if they display over- or undershoots that do not appear reasonable on biological grounds (here, Sets 1, 7, and possibly 8). How many parameter sets are to be included in the ensemble is a matter of choosing cut-offs within the set of SSEs and of biological judgment.

FIGURE 11. ALVI-MI Fits of Data Points from the Simulated Dataset with Noise and Replicates. Nine different combinations of (n+1) time points yielding fits with the lowest SSEs are displayed along with the true solution. Altogether,

TABLE 5. Sample Point Sets for ALVI-MI inferences and corresponding SSE values for Data in Figure 11.
Analysis of the possible point choices indicates that similar SSE values do not necessarily lead to similar fits. For example, the lowest SSEs in the above example are obtained with combinations 6 and 7, which however yield rather different trendlines. Furthermore, Panel seven displays a larger overshoot at t = 1 than Panel six and an additional overshoot between times 3 and 4, which indicates that the SSE should not be the only criterion when declaring the best fit. For more information on criteria for good fits see (Voit, 2011).
A new variation on the ALVI methods in the previous sections is the estimation of interaction parameters from different steady-state profiles of the system. Such data may come from similar experiments leading to different outcomes. As an example, the administration of antibiotics might lead to different survivor profiles of bacterial species, even if the experimental set-up is identical in all experiments (Varga et al., 2022). In this study, administration of Meropenem led to dominance of either Burkholderia cenocepacia or S. aureus, the latter of which is normally not able to survive in the presence of Meropenem. Even without antibiotics, different outcomes can be seen among biological replicates of the de novo dataset of E. coli and S. aureus shown in Figure 3. Even though experimental conditions were the same in all three replicates, experimental endpoints appeared with dominance of either E. coli or S. aureus.
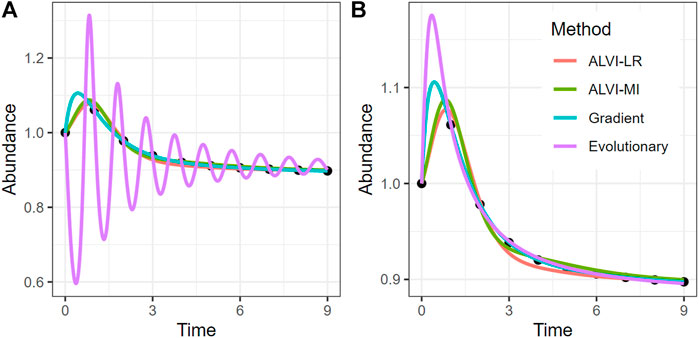
FIGURE 12. Method Comparison with a Simulated Dataset. Black dots represent abundances of species X2 in the simulated dataset. The four curves are fits to these data, obtained with different strategies. Note that the ALVI-MI fit corresponds to the single best set of points (6 from Figure 11) and not to some average of an ensemble. (A) shows a solution per differential evolution that is clearly overfit with large, damped oscillations. (B) shows a differential evolution fit that incorporates tighter constraints for all parameters. Fits for all other methods are essentially the same in both panels, although they differ in the initial peak and incur different SSEs (Table 6). Time and abundance units are arbitrary. Fits for all four variables are in Supplements.
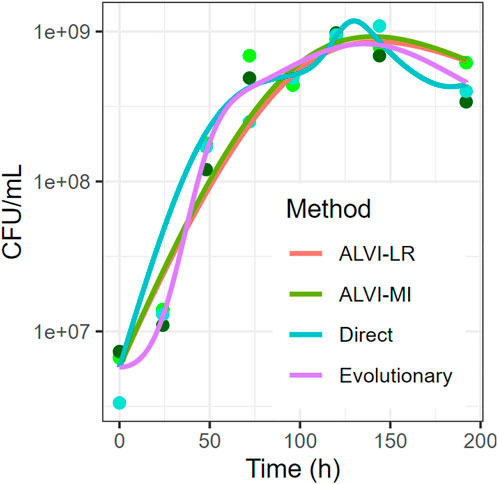
FIGURE 13. Comparison of Parameter Inference Methods for the Dataset of Piccardi et al. (Piccardi et al., 2019). The species shown is C. testosteroni. Time is in hours and abundance is in CFU/mL on a logarithmic scale. The data points are three replicates of the species.
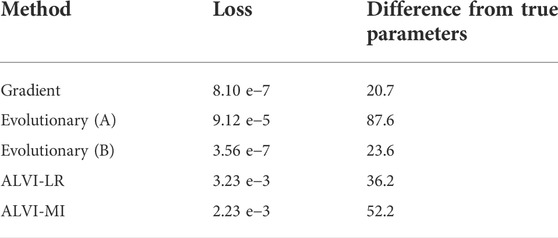
TABLE 6. Comparison of Methods with the Simulated Dataset in Figure 12. The difference from true parameters is defined as
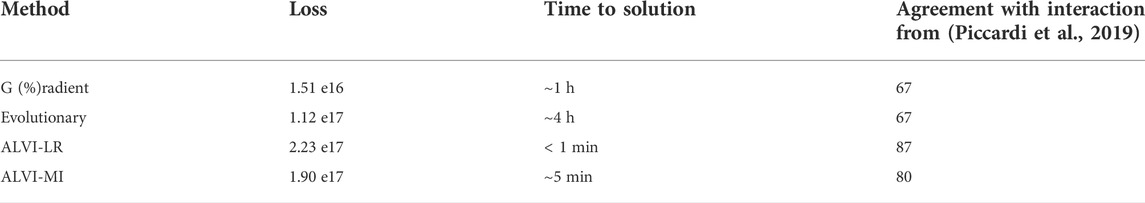
TABLE 7. Comparison of Parameter Inference Methods using the Dataset of Piccardi et al. (Piccardi et al., 2019). These values correspond to the fits from Figure 13. For the loss function, we used the SSE. Time to solution does not include data processing.
Mathematically, the structure of such a system permits several stable steady states, whose basins of attraction are delineated by separatrices. In this situation, different outcomes are possible if the initial states of two communities may be quite close to each other, but are located on different sides of a separatrix. Thus, the exact same model, with exactly the same parameter sets, but starting with slightly different initial values of the species within the community, can lead to distinctly different steady states, including extinction of one or more species.
Ideally, if the system involves n species, n+1 survivor profiles would be available, because then a matrix inversion would be directly possible, as we will demonstrate below. But even if the data are scarcer, a productive analysis may still be possible, either with additional information or by using pseudo-inverses of the involved matrices (Moore, 1920; Albert, 1972; Penrose, 2008). In terms of additional information, other experiments might have produced the growth characteristics of each species, growing by itself which, ideally, had yielded the
As an illustration, suppose the values of two different steady states are available for a two-species system. In one experiment, the two species coexist, but in the second experiment Species two does not survive. To be specific, suppose these two steady-state data points are:
Dividing by x1, inserting 2.5 for a1, and putting in the first steady-state profile gives
Similarly for the second steady-state profile, we obtain
Straightforward substitution yields (b11, b12) = (-2, -0.5). In more general notation, we can convert the equations into the matrix form:
which can be solved with matrix inversion (or pseudo-inversion for undetermined equations). The result is
The method is applicable to systems of any number of species, if sufficiently many different survivor profiles are available. If fewer profiles are available, the set of equations is underdetermined and the method produces a solution space that contains the correct solution (Voit et al., 2021). Note that this method assumes that different steady-state profiles exist even though the species operate under quite similar conditions. The profiles may reflect total coexistence or the extinction of one or more species. If different well-fitting parameter sets are found for a system, an ensemble of solutions can be established and statistical arguments may be used to identify the most likely parameter sets (see Figures 6, 11).
Due to the popularity of LV models, the research community has developed many more approaches than those enumerated so far. Some examples are the following: Michalik et al. used an incremental single shooting strategy to infer LV parameters (Michalik et al., 2009), while Bergmann et al. employed a multiple shooting strategy to fit LV models in a piecewise fashion (Bergmann et al., 2016). Cao et al. proposed a parameter cascade method (Cao et al., 2007). Waniewsky et al. used an individual-based model to perform parameter estimation (Waniewski and Jedruch, 1999). Wenk et al. used a Gaussian process approach (Wenk et al., 2020), while Martín-Fernández et al. applied a particle filter method to estimate parameters while simultaneously measuring biomass (Martín-Fernández et al., 2014). Xiao et al. inferred interactions using only steady-state snapshots of data using both brute force and heuristic algorithms (Xiao et al., 2017).
The simple LV format can be embellished in uncounted ways. Correspondingly, parameter inference methods were proposed for many specific situations. A few examples are listed here. Momeni et al. made use of mechanistic insights into the modeled phenomenon to infer interactions in a more effective manner (Momeni et al., 2017). Zhao et al. parameterized models with jumps (Zhao et al., 2018). Stein et al. and Dam et al. introduced seasonal variability into an LV model (Stein et al., 2013; Dam et al., 2016; Dam et al., 2020). Zimmer and Sahle were able to parameterize partially observed LV models (Zimmer, 2013). Finally, Xu et al. introduced Brownian motion to simulate external perturbations (Xu et al., 2020).
To compare the methods, we use the same simulated four-variable dataset that we discussed in the context of top-down/bottom-up estimation. For a fair comparison, we first identify the growth rates and fix them in each scenario.1
This scenario has a perfect solution since the parameters were taken from a true Lotka-Volterra system. Nevertheless, none of the methods finds the exact parameters when all 20 parameters are allowed to be fit without constraints, which indicates that the data are of insufficient density to infer the parameters of the system with confidence. One notes that the dynamics is well captured with all methods but that the peaks around t = 1 are different in all solutions. This result again suggests that the data do not contain sufficient information about that peak, so that the SSE is unaffected by the size of the peak in the estimation. For this particular system, the gradient-descent method finds both the best fit with regard to SSE as well as the closest parameters. However, all methods are able to find reasonable estimates, with the exception of the loosely constrained evolutionary method, which is very clearly overfit. Even if sufficiently many noise-less data are available, the inferred parameter estimates may not be 100% exact, which may be due to numerical inaccuracies, especially if slopes of the time trends are to be estimated. It is also mathematically possible that distinct parameter sets can generate perfect solutions (Voit, 2018).
For the case published by Piccardi et al. (Piccardi et al., 2019) and discussed before, we can compare the results to some aspects of the authors’ inferred interaction network. As their inferred interactions came from comparing the area under mono- and co-culture growth curves, they cannot be compared directly to our Lotka-Volterra analysis. However, we can qualitatively compare at least the signs of interactions. Despite having the highest SSE, the linear regression method most closely matches the interactions that the authors of the paper concluded. The gradient search method has the lowest SSE but introduces an overshoot in the second half of the curve. The evolutionary method also produces some bumps, compared to the linear algebra-based fits that yield relatively smooth trends. One notes that the algebraic methods require a fraction of the computation time to find a solution, although we did not include data preprocessing, like smoothing, in this argument. More generally, computation time becomes a practical criterion of substantial weight if the estimation task targets large models, with dozens or even hundreds of parameters. It is well possible that methods fail in these situations, even if they perform well for small models. One should also mention that some methods, including the algebraic algorithms mentioned here, are better suited than others when it comes to speeding up the solution through parallel computing or the use of multi-threaded programming. Thus, each method is a compromise, and it is impossible to declare winners and losers in a general manner.
Lotka-Volterra models have once again become popular, this time in the context of microbial communities that often determine the health of humans and the environment. The overarching goal in these microbiome analyses is the identification and quantification of interactions among different species, which are captured in LV models by interaction parameters. Thus, an important task is the inference of these parameters from observational data, both in terms of signs and magnitudes. Arguably the most informative of such data are time series that quantify the abundances of the various coexisting species at a sequence of time points. As is the case for most dynamical models, this quantification is usually a considerable challenge. In this overview, we summarize the typical steps of the parameter inference process, with particular focus on LV models. These models stand out, due to their history of successful applications and the fact that the task of inferring LV parameters from time series data can be transformed into a linear problem (Voit and Chou, 2010). It is impossible to devise a rigorous formal test to determine the accuracy of an LV model for a particular community system, but extensive work in the literature has been addressing the adequacy in terms of both experimental applications (e.g., (Dedrick et al., 2022)) and the computational power of these equations for a variety of analyses (e.g., (Voit et al., 2021)).
Before specific inference algorithms are called up, it is beneficial to preprocess the data through data cleaning, smoothing, and the estimation of slopes, which can tremendously reduce computation time in large and moderately large systems. In fact, an analysis of computing effort indicated that over 95% of the time used by a search engine to identify optimal parameter values of an ODE system is spent on integrating these equations, and this step can be circumvented if slopes can be estimated (Voit and Almeida, 2004). It is also advisable to consider different metrics for the quality of data fits resulting from the parameter inference.
For the inference process itself, we have discussed generic and specialized methods and applied them to synthetic and real-world datasets. Analysis of the different examples makes it evident that each method has aspects in which it excels and where it has drawbacks. Grid searches are only feasible for very small systems, although the concept can be extended for larger systems through specialized statistical sampling or Monte-Carlo simulations. The latter may be useful to obtain a general impression of solutions throughout the parameter space, but they seldom reveal reliable quantitative solutions. The typical gradient methods have been fine-tuned for many years. They have been and remain to be the true work horses of parameter estimation but are time consuming and prone to converging to local minima. Evolutionary approaches have the potential of leading the search toward the global minimum of the estimation task but seldom generate exact answers. It has therefore almost become standard procedure to initiate a parameter search with an evolutionary method and follow it up with a gradient method. We also discussed two newer algebraic LV inference (ALVI) methods that are based on linear algebra. Their theoretical underpinnings were previously documented by Xiao et al. (Xiao et al., 2017) and practically applied in detail to different datasets in (Olivença et al., 2021). These methods do not always capture the transient dynamics as well as gradient methods, which is likely due to imprecision when estimating slopes, but they avoid overfitting and are computationally so cheap that numerous fits are readily computed, either to select the solution with the lowest value of some loss function or to establish an entire ensemble of well-fitting solutions.
An unbiased overall comparison of all methods is difficult, as different metrics should be considered that are truly incomparable (Table 8). These metrics include the residual error, computation time, multiple solutions and solutions domains, unrealistic dynamics, and parameter values that seem biologically doubtful. Thus, it might be advisable to clean and smooth the data, estimate slopes, and start with ALVI. In many cases, this procedure will generate good solutions, but it can also be used as a quick method for generating good initial guesses for more refined methods.

TABLE 8. Comparison of different aspects of the various fitting strategies.
In the end, uncounted methods are available but there is still no silver bullet, and parameter estimation remains to be somewhat of an art. In part, this is so because the computational techniques are still not universally effective and all methods can boast with examples where they shine. However, the proponents of these methods should also acknowledge situations where the algorithms become very slow, ineffective, or fail altogether.
A combined theoretical and computational issue is the “sloppiness” or “unidentifiability” of parameters in estimation tasks (e.g., (Arkin et al., 2007; Raue et al., 2009; Vilela et al., 2009; Srinath and Gunawan, 2010)). Namely, it is a frequent occurrence that similar—or even very different—parameter sets produce SSEs of similar quality. The reason is usually one of two situations: First, the model may permit exact or approximate redundancies among its parameters, such as two parameters that always occur in the model as a product p1·p2, in which case the product may be estimated, but any combination of p1 and p2 resulting in the same product yields a different, yet equally good solution. This particular case is almost trivial, but such redundancies are quite frequent in actual systems (e.g., (Goel et al., 2008; Voit, 2018)). Second, the structure of model is such that many parameter sets yield similar, although not identical fits. This situation can be troublesome, because an “optimal” parameter set for a given dataset may fail drastically if the same parameters are used to model another dataset. A positive interpretation of this situation leads to the acceptance of multiple solutions and the identification of ensembles of models, as we discussed them in the text.
The estimation of parameter values is not only a mathematical task but has biological implications (Voit, 2011). It may happen that a parameter in the best-fitting solution has an unreasonable magnitude or even the wrong sign on biological grounds, for instance, being negative although it represents a turn-over rate. Finally, the relatively best parameter set for given data may mask the fact that the model structure is not even adequate, which becomes a severe issue when the model is extrapolated toward new biological situations or data. As an example, our estimates for the Piccardi data and our own data yield decent fits, but that does not prove that the LV framework is even the best option. More complicated models, such as Generalized Mass Action systems (Voit, 2013) which are direct extensions of LV systems, could provide better fits, for instance, by permitting higher-order interactions among species. These fits with lower SSEs would likely necessitate a higher number of parameters, raising the difficult question whether the increased model complexity is “worth it.”
All these challenges can be daunting, but many of them have at least been identified and subjected to scientific scrutiny, although they are not definitely solved. But the effort is certainly warranted. After all, the estimation of parameter values stands between the power of theoretical models and the biological reality of the actual world.
Simulations and optimization tasks were performed in the Julia programming language (v1.7) (Bezanson et al., 2017). Results were visualized with the ggplot2 package (v.3.3.6) in the R (v4.1.3) programming language or the Javascript version of the Plotly package (v2.14.0) (Wickham, 2016; Sievert, 2020). Network visualization was done with Cytoscape (v3.9.1) (Shannon et al., 2003).
Differential equations were solved using different variants of Runge-Kutta (Tsitouras, 2011; Rackauckas and Nie, 2017) methods, depending on the type of problem to be solved. Simulations were executed in the Julia programming language (Bezanson et al., 2017).
Grid search method: Each parameter was assessed over a predefined range (0–five for
Gradient-descent based method: Parameters were tuned using the AdaMax (Kingma and Ba, 2014) method with a learning rate of 1e-3 with 0s as initial parameters using the Flux optimization package (v0.13.4) (Innes, 2018).
Differential evolution method: Parameters were tuned with the bounds of -5 to five for
ALVI-LR method: Data were discretized as in (Mounier et al., 2007) and separated into a vector of abundances and estimated slopes. Each variable was optimized individually using an interior point optimization solver (Biegler and Zavala, 2009) in the JuMP package (v. 1.1.1) (Dunning et al., 2017). Smoothing was performed with the LOESS method as described in (Olivença et al., 2021).
The ALVI-MI method was performed as described in (Olivença et al., 2021).
The ALVI survivor profile method was performed as described in (Voit et al., 2021).
JD, DO, SB, and EV. conceived this project and performed the literature review. JD created the synthetic data examples, executed the analyses, and wrote the manuscript. DO contributed to the analysis and to the code required for the study. All authors reviewed and edited the manuscript.
The authors acknowledge the following funding sources supporting this project: The Cystic Fibrosis Foundation (BROWN19I0, BROWN21P0, DAVIS21H0), the Centers for Disease Control and Prevention (BAA 2016-N-17812, BAA 2017-OADS-01, 75D30120C-09782), the National Institutes of Health (1R21AI143296 and 1R21AI156817), and the Georgia Research Alliance.
The authors would also like to acknowledge members of the Voit and Brown labs for their valuable contributions to the manuscript, and the Partnership for Advanced Computing (PACE) at Georgia Tech for use of their computing nodes.
The authors declare that the research was conducted in the absence of any commercial or financial relationships that could be construed as a potential conflict of interest.
All claims expressed in this article are solely those of the authors and do not necessarily represent those of their affiliated organizations, or those of the publisher, the editors and the reviewers. Any product that may be evaluated in this article, or claim that may be made by its manufacturer, is not guaranteed or endorsed by the publisher.
The Supplementary Material for this article can be found online at: https://www.frontiersin.org/articles/10.3389/fsysb.2022.1021897/full#supplementary-material.
1Note that a full grid search is infeasible even for a problem of this size.
Albert, A. E. (1972). Regression and the moore-penrose pseudoinverse. New York: Academic Press, 180.
Allesina, S., and Tang, S. (2012). Stability criteria for complex ecosystems. Nature 483 (7388), 205–208. doi:10.1038/nature10832
Arkin, A. P., Gutenkunst, R. N., Waterfall, J. J., Casey, F. P., Brown, K. S., Myers, C. R., et al. (2007). Universally sloppy parameter sensitivities in systems biology models. PLoS Comput. Biol. 3 (10), 1871–1878. doi:10.1371/journal.pcbi.0030189
Bäck, T. (1996). Evolutionary algorithms in theory and practice : Evolution strategies, evolutionary programming, genetic algorithms. New York: Oxford University Press, 314.
Bergmann, F. T., Sahle, S., and Zimmer, C. (2016). Piecewise parameter estimation for stochastic models in COPASI. Bioinformatics 32 (10), 1586–1588. doi:10.1093/bioinformatics/btv759
Bezanson, J., Edelman, A., Karpinski, S., and Shah, V. B. (2017). Julia: A fresh approach to numerical computing. SIAM Rev. Soc. Ind. Appl. Math. 59 (1), 65–98. doi:10.1137/141000671
Biegler, L. T., and Zavala, V. M. (2009). Large-scale nonlinear programming using IPOPT: An integrating framework for enterprise-wide dynamic optimization. Comput. Chem. Eng. 33 (3), 575–582. doi:10.1016/j.compchemeng.2008.08.006
Blickle, T., and Thiele, L. (1996). A comparison of selection schemes used in evolutionary algorithms. Evol. Comput. 4 (4), 361–394. doi:10.1162/evco.1996.4.4.361
Boulineau, S., Tostevin, F., Kiviet, D. J., ten Wolde, P. R., Nghe, P., and Tans, S. J. (2013). Single-Cell dynamics reveals sustained growth during diauxic shifts. PLoS ONE 8 (4), e61686. doi:10.1371/journal.pone.0061686
Buffie, C. G., Bucci, V., Stein, R. R., McKenney, P. T., Ling, L., Gobourne, A., et al. (2015). Precision microbiome reconstitution restores bile acid mediated resistance to Clostridium difficile. Nature 517 (7533), 205–208. doi:10.1038/nature13828
Camporeale, E. (2019). The challenge of machine learning in space weather: Nowcasting and forecasting. Space weather. 17 (8), 1166–1207. doi:10.1029/2018sw002061
Cao, J., Fussmann, G. F., and Ramsay, J. O. (2007). Estimating a predator‐prey dynamical model with the parameter cascades method. Biometrics 64 (3), 959–967. doi:10.1111/j.1541-0420.2007.00942.x
Casella, G., Ghosh, M., Gill, J., and Kyung, M. (2010). Penalized regression, standard errors, and Bayesian lassos. Bayesian Anal. 5 (2). doi:10.1214/10-ba607
Chiang, S. Y. (2012). An application of Lotka-Volterra model to Taiwan's transition from 200 mm to 300 mm silicon wafers. Technol. Forecast. Soc. Change 79 (2), 383–392. doi:10.1016/j.techfore.2011.05.007
Choi, K. H., Gaynor, J. B., White, K. G., Lopez, C., Bosio, C. M., Karkhoff-Schweizer, R. R., et al. (2005). A Tn7-based broad-range bacterial cloning and expression system. Nat. Methods 2 (6), 443–448. doi:10.1038/nmeth765
Chou, I. C., and Voit, E. O. (2009). Recent developments in parameter estimation and structure identification of biochemical and genomic systems. Math. Biosci. 219 (2), 57–83. doi:10.1016/j.mbs.2009.03.002
Cleveland, W. S. (1979). Robust locally weighted regression and smoothing scatterplots. J. Am. Stat. Assoc. 74 (368), 829–836. doi:10.1080/01621459.1979.10481038
Dakos, V., Joseph, T. A., Shenhav, L., Xavier, J. B., Halperin, E., and Pe’er, I. (2020). Compositional Lotka-Volterra describes microbial dynamics in the simplex. PLoS Comput. Biol. 16 (5), e1007917. doi:10.1371/journal.pcbi.1007917
Dam, P., Fonseca, L. L., Konstantinidis, K. T., and Voit, E. O. (2016). Dynamic models of the complex microbial metapopulation of lake mendota. NPJ Syst. Biol. Appl. 2, 16007. doi:10.1038/npjsba.2016.7
Dam, P., Rodriguez, R. L., Luo, C., Hatt, J., Tsementzi, D., Konstantinidis, K. T., et al. (2020). Model-based comparisons of the abundance dynamics of bacterial communities in two lakes. Sci. Rep. 10 (1), 2423. doi:10.1038/s41598-020-58769-y
Davis, J., Olivenca, D., Brown, S., and Voit, E. (2022). A passaged 3-species synthetic microbial community. Zenodo.
Dedrick, S., Warrier, V., Lemon, K. P., and Momeni, B. (2022). When does a lotka-volterra model represent microbial interactions? Insights from in-vitro nasal bacterial communities. bioRxiv.
Dimas Martins, A., and Gjini, E. (2020). Modeling competitive mixtures with the lotka-volterra framework for more complex fitness assessment between strains. Front. Microbiol. 11, 572487. doi:10.3389/fmicb.2020.572487
Duchi, J., Hazan, E., and Singer, Y. (2011). Adaptive subgradient methods for online learning and stochastic optimization. J. Mach. Learn Res. 12, 2121–2159.
Dunning, I., Huchette, J., and Lubin, M. (2017). JuMP: A modeling language for mathematical optimization. SIAM Rev. Soc. Ind. Appl. Math. 59 (2), 295–320. doi:10.1137/15m1020575
Friedman, J., Higgins, L. M., and Gore, J. (2017). Community structure follows simple assembly rules in microbial microcosms. Nat. Ecol. Evol. 1 (5), 109. doi:10.1038/s41559-017-0109
Gennemark, P., and Wedelin, D. (2009). Benchmarks for identification of ordinary differential equations from time series data. Bioinformatics 25 (6), 780–786. doi:10.1093/bioinformatics/btp050
Gennemark, P., and Wedelin, D. (2007). Efficient algorithms for ordinary differential equation model identification of biological systems. IET Syst. Biol. 1 (2), 120–129. doi:10.1049/iet-syb:20050098
Goel, G., Chou, I. C., and Voit, E. O. (2008). System estimation from metabolic time-series data. Bioinformatics 24 (21), 2505–2511. doi:10.1093/bioinformatics/btn470
Golub, G. H., Heath, M., and Wahba, G. (1979). Generalized cross-validation as a method for choosing a good ridge parameter. Technometrics 21 (2), 215–223. doi:10.1080/00401706.1979.10489751
Goodfellow, I., Bengio, Y., and Courville, A. (2016). Deep learning. Cambridge, MA: The MIT Press, 775.
Gresham, D., and Dunham, M. J. (2014). The enduring utility of continuous culturing in experimental evolution. Genomics 104 (6), 399–405. doi:10.1016/j.ygeno.2014.09.015
Haas, C. N. (1981). Application of predator-prey models to disinfection. J. Water Pollut. Con F. 53 (3), 378–386.
Hacinliyan, A. S., Kusbeyzi, I., and Aybar, O. O. (2010). Approximate solutions of Maxwell Bloch equations and possible Lotka Volterra type behavior. Nonlinear Dyn. 62 (1-2), 17–26. doi:10.1007/s11071-010-9695-5
Hansen, P. C., and O’Leary, D. P. (1993). The use of the L-curve in the regularization of discrete ill-posed problems. SIAM J. Sci. Comput. 14 (6), 1487–1503. doi:10.1137/0914086
Hasdemir, D., Hoefsloot, H. C. J., and Smilde, A. K. (2015). Validation and selection of ODE based systems biology models: How to arrive at more reliable decisions. BMC Syst. Biol. 9 (1), 32. doi:10.1186/s12918-015-0180-0
Hastie, T., Tibshirani, R., and Friedman, J. H. (2009). The elements of statistical learning : Data mining, inference, and prediction. 2nd ed. New York, NY: Springer, 745.
Hernandez-Bermejo, B., and Fairen, V. (1997). Lotka-volterra representation of general nonlinear systems. Math. Biosci. 140 (1), 1–32. doi:10.1016/s0025-5564(96)00131-9
Holmes, E. E., Ward, E. J., and Wills, K. (2012). Marss: Multivariate autoregressive state-space models for analyzing time-series data. R J. 4 (1), 11. doi:10.32614/rj-2012-002
Huisman, J., and Weissing, F. J. (1999). Biodiversity of plankton by species oscillations and chaos. Nature 402 (6760), 407–410. doi:10.1038/46540
Ibberson, C. B., Parlet, C. P., Kwiecinski, J., Crosby, H. A., Meyerholz, D. K., Horswill, A. R., et al. (2016). Hyaluronan modulation impacts Staphylococcus aureus biofilm infection. Infect. Immun. 84 (6), 1917–1929. doi:10.1128/IAI.01418-15
Innes, M. (2018). Flux: Elegant machine learning with Julia. J. Open Source Softw. 3 (25), 602. doi:10.21105/joss.00602
Kargi, F. (2009). Re-interpretation of the logistic equation for batch microbial growth in relation to Monod kinetics. Lett. Appl. Microbiol. 48 (4), 398–401. doi:10.1111/j.1472-765X.2008.02537.x
Kingma, D. P., and Ba, J. (2014). Adam: A method for stochastic optimization. 2014 December 01, 2014:[arXiv:1412.6980 p.]. Available at: https://ui.adsabs.harvard.edu/abs/2014arXiv1412.6980K.
Knowles, I., and Wallace, R. (1995). A variational method for numerical differentiation. Numer. Math. 70 (1), 91–110. doi:10.1007/s002110050111
Kochenderfer, M. J., and Wheeler, T. A. (2019). Algorithms for optimization. Cambridge, MA: The MIT Press, 500.
Kuepfer, L., Peter, M., Sauer, U., and Stelling, J. (2007). Ensemble modeling for analysis of cell signaling dynamics. Nat. Biotechnol. 25 (9), 1001–1006. doi:10.1038/nbt1330
Kutner, M. H., Nachtsheim, C., and Neter, J. (2004). Applied linear regression models. 4th ed. Boston, New York: McGraw-Hill/Irwin, 701.
Lee, Y., Lafontaine Rivera, J. G., and Liao, J. C. (2014). Ensemble Modeling for Robustness Analysis in engineering non-native metabolic pathways. Metab. Eng. 25, 63–71. doi:10.1016/j.ymben.2014.06.006
Liao, C., Xavier, J. B., and Zhu, Z. (2020). Enhanced inference of ecological networks by parameterizing ensembles of population dynamics models constrained with prior knowledge. BMC Ecol. 20 (1), 3. doi:10.1186/s12898-019-0272-6
Lotka, A. J. (1920). Analytical note on certain rhythmic relations in organic systems. Proc. Natl. Acad. Sci. U. S. A. 6 (7), 410–415. doi:10.1073/pnas.6.7.410
Luengo, D., Martino, L., Bugallo, M., Elvira, V., and Sarkka, S. (2020). A survey of Monte Carlo methods for parameter estimation. EURASIP J. Adv. Signal Process. 2020 (1), 25. doi:10.1186/s13634-020-00675-6
Martín-Fernández, L., Gilioli, G., Lanzarone, E., Míguez, J., Pasquali, S., Ruggeri, F., et al. (2014). A Rao-Blackwellized particle filter for joint parameter estimation and biomass tracking in a stochastic predator-prey system. Math. Biosci. Eng. 11 (3), 573–597. doi:10.3934/mbe.2014.11.573
Maynard, D. S., Miller, Z. R., and Allesina, S. (2020). Predicting coexistence in experimental ecological communities. Nat. Ecol. Evol. 4 (1), 91–100. doi:10.1038/s41559-019-1059-z
Mckay, M. D., Beckman, R. J., and Conover, W. J. (1979). A comparison of three methods for selecting values of input variables in the analysis of output from a computer code. Technometrics 21 (2), 239–245. doi:10.2307/1268522
McNally, L., Bernardy, E., Thomas, J., Kalziqi, A., Pentz, J., Brown, S. P., et al. (2017). Killing by Type VI secretion drives genetic phase separation and correlates with increased cooperation. Nat. Commun. 8, 14371. doi:10.1038/ncomms14371
Michalakelis, C., Christodoulos, C., Varoutas, D., and Sphicopoulos, T. (2012). Dynamic estimation of markets exhibiting a prey–predator behavior. Expert Syst. Appl. 39 (9), 7690–7700. doi:10.1016/j.eswa.2012.01.049
Michalik, C., Hannemann, R., and Marquardt, W. (2009). Incremental single shooting—a robust method for the estimation of parameters in dynamical systems. Comput. Chem. Eng. 33 (7), 1298–1305. doi:10.1016/j.compchemeng.2009.02.002
Momeni, B., Xie, L., and Shou, W. (2017). Lotka-Volterra pairwise modeling fails to capture diverse pairwise microbial interactions. Elife 6, e25051. doi:10.7554/eLife.25051
Monod, J. (1949). The growth of bacterial cultures. Annu. Rev. Microbiol. 3 (1), 371–394. doi:10.1146/annurev.mi.03.100149.002103
Moore, E. H. (1920). On the reciprocal of the general algebraic matrix. Bull. Amer Mathem Soc. 26, 394–395.
Mosayebi, R., and Bahrami, F. (2018). A modified particle swarm optimization algorithm for parameter estimation of a biological system. Theor. Biol. Med. Model. 15 (1), 17. doi:10.1186/s12976-018-0089-6
Mounier, J., Monnet, C., Vallaeys, T., Arditi, R., Sarthou, A. S., Helias, A., et al. (2007). Microbial interactions within a cheese microbial community. Appl. Environ. Microbiol. 74 (1), 172–181. doi:10.1128/AEM.01338-07
Muhlbauer, L. K., Schulze, M., Harpole, W. S., and Clark, A. T. (2020). gauseR: Simple methods for fitting Lotka-Volterra models describing Gause's "Struggle for Existence. Ecol. Evol. 10 (23), 13275–13283. doi:10.1002/ece3.6926
Muloiwa, M., Nyende-Byakika, S., and Dinka, M. (2020). Comparison of unstructured kinetic bacterial growth models. South Afr. J. Chem. Eng. 33, 141–150. doi:10.1016/j.sajce.2020.07.006
Nambu, M. (1986). Plasma-maser effects in plasma astrophysics. Space Sci. Rev. 44 (3-4), 357–391. doi:10.1007/bf00200820
Navarro Llorens, J. M., Tormo, A., and Martínez-García, E. (2010). Stationary phase in gram-negative bacteria. FEMS Microbiol. Rev. 34 (4), 476–495. doi:10.1111/j.1574-6976.2010.00213.x
Neumaier, A. (1998). Solving ill-conditioned and singular linear systems: A tutorial on regularization. SIAM Rev. Soc. Ind. Appl. Math. 40 (3), 636–666. doi:10.1137/s0036144597321909
Olivença, D. V., Davis, J. D., and Voit, E. O. (2021). Comparison between lotka-volterra and multivariate autoregressive models of ecological interaction systems. bioRxiv. 2021.10.07.463461.
Palmer, J. D., and Foster, K. R. (2022). Bacterial species rarely work together. Science 376 (6593), 581–582. doi:10.1126/science.abn5093
Penrose, R. (2008). A generalized inverse for matrices. Math. Proc. Camb. Phil. Soc. 51 (3), 406–413. doi:10.1017/s0305004100030401
Peschel, M., and Mende, W. The predator-prey model : Do we live in a Volterra world? Wien, NJ: Springer; 1986. 251 p. p.
Piccardi, P., Vessman, B., and Mitri, S. (2019). Toxicity drives facilitation between 4 bacterial species. Proc. Natl. Acad. Sci. U. S. A. 116 (32), 15979–15984. doi:10.1073/pnas.1906172116
Qian, N. (1999). On the momentum term in gradient descent learning algorithms. Neural Netw. 12 (1), 145–151. doi:10.1016/s0893-6080(98)00116-6
Rackauckas, C., and Nie, Q. (2017). DifferentialEquations.jl – a performant and feature-rich ecosystem for solving differential equations in Julia. J. Open Res. Softw. 5, 15. doi:10.5334/jors.151
Rattray, J. B., Thomas, S. A., Wang, Y., Molotkova, E., Gurney, J., Varga, J. J., et al. (2022). Bacterial quorum sensing allows graded and bimodal cellular responses to variations in population density. mBio 13 (3), e0074522. doi:10.1128/mbio.00745-22
Raue, A., Kreutz, C., Maiwald, T., Bachmann, J., Schilling, M., Klingmüller, U., et al. (2009). Structural and practical identifiability analysis of partially observed dynamical models by exploiting the profile likelihood. Bioinformatics 25 (15), 1923–1929. doi:10.1093/bioinformatics/btp358
Rousseeuw, P. J., and Hubert, M. (2011). Robust statistics for outlier detection. WIREs Data Min. Knowl. Discov. 1 (1), 73–79. doi:10.1002/widm.2
Shannon, P., Markiel, A., Ozier, O., Baliga, N. S., Wang, J. T., Ramage, D., et al. (2003). Cytoscape: A software environment for integrated models of biomolecular interaction networks. Genome Res. 13 (11), 2498–2504. doi:10.1101/gr.1239303
Sievert, C. (2020). Interactive web-based data visualization with R, plotly, and shiny. Boca Raton, FL: CRC Press, Taylor and Francis Group.
Simon, D. (2013). Evolutionary optimization algorithms : Biologically-inspired and population-based approaches to computer intelligence. Hoboken, NJ: John Wiley & Sons, 742.
Sprott, J. C., Vano, J. A., Wildenberg, J. C., Anderson, M. B., and Noel, J. K. (2005). Coexistence and chaos in complex ecologies. Phys. Lett. A 335 (2-3), 207–212. doi:10.1016/j.physleta.2004.12.068
Srinath, S., and Gunawan, R. (2010). Parameter identifiability of power-law biochemical system models. J. Biotechnol. 149 (3), 132–140. doi:10.1016/j.jbiotec.2010.02.019
Stein, R. R., Bucci, V., Toussaint, N. C., Buffie, C. G., Ratsch, G., Pamer, E. G., et al. (2013). Ecological modeling from time-series inference: Insight into dynamics and stability of intestinal microbiota. PLoS Comput. Biol. 9 (12), e1003388. doi:10.1371/journal.pcbi.1003388
Storn, R., and Price, K. (1997). Differential evolution – a simple and efficient heuristic for global optimization over continuous spaces. J. Glob. Optim. 11 (4), 341–359. doi:10.1023/a:1008202821328
Sundarraman, D., Hay, E. A., Martins, D. M., Shields, D. S., Pettinari, N. L., and Parthasarathy, R. (2020). Higher-order interactions dampen pairwise competition in the zebrafish gut microbiome. mBio 11 (5), 016677. doi:10.1128/mBio.01667-20
Tikhonov, A. N., Goncharsky, A. V., Stepanov, V. V., and Yagola, A. G. (1995). Numerical methods for the solution of ill-posed problems.
Tsitouras, C. (2011). Runge–Kutta pairs of order 5(4) satisfying only the first column simplifying assumption. Comput. Math. Appl. 62 (2), 770–775. doi:10.1016/j.camwa.2011.06.002
Van den Broeck, J., Argeseanu Cunningham, S., Eeckels, R., and Herbst, K. (2005). Data cleaning: Detecting, diagnosing, and editing data abnormalities. PLoS Med. 2 (10), e267. doi:10.1371/journal.pmed.0020267
Vano, J. A., Wildenberg, J. C., Anderson, M. B., Noel, J. K., and Sprott, J. C. (2006). Chaos in low-dimensional Lotka-Volterra models of competition. Nonlinearity 19 (10), 2391–2404. doi:10.1088/0951-7715/19/10/006
Varah, J. M. (1982). A spline least squares method for numerical parameter estimation in differential equations. SIAM J. Sci. Stat. Comput. 3 (1), 28–46. doi:10.1137/0903003
Varga, J. J., Zhao, C. Y., Davis, J. D., Hao, Y., Farrell, J. M., Gurney, J. R., et al. (2022). Antibiotics drive expansion of rare pathogens in a chronic infection microbiome model. mSphere.
Venturelli, O. S., Carr, A. C., Fisher, G., Hsu, R. H., Lau, R., Bowen, B. P., et al. (2018). Deciphering microbial interactions in synthetic human gut microbiome communities. Mol. Syst. Biol. 14 (6), e8157. doi:10.15252/msb.20178157
Verhulst, P. F. (1838). Notice sur la loi que la populations suit dans son accroissement. Corresp. Math. Physique 10.
Vilela, M., Vinga, S., Maia, M. A. G. M., Voit, E. O., and Almeida, J. S. (2009). Identification of neutral biochemical network models from time series data. BMC Syst. Biol. 3 (1), 47. doi:10.1186/1752-0509-3-47
Voit, E. O. (2018). A first course in systems biology. Second edition. New York: Garland Science, 468.
Voit, E. O., and Almeida, J. (2004). Decoupling dynamical systems for pathway identification from metabolic profiles. Bioinformatics 20 (11), 1670–1681. doi:10.1093/bioinformatics/bth140
Voit, E. O. (2013). Biochemical systems theory: A review. Int. Sch. Res. Netw. (ISRN – Biomath. 2013, 897658.
Voit, E. O., Davis, J. D., and Olivença, D. V. (2021). Inference and validation of the structure of lotka-volterra models. bioRxiv. doi:10.1101/2021.08.14.456346
Voit, E. O., and Savageau, M. A. (1986). Equivalence between S-systems and volterra systems. Math. Biosci. 78 (1), 47–55. doi:10.1016/0025-5564(86)90030-1
Voit, E. O. (2011). “What if the fit is unfit? Criteria for biological systems estimation beyond residual errors,” in Applied statistics for network biology, 181–200.
Voit, E., and Chou, I. C. (2010). Parameter estimation in canonical biological systems models. Int. J. Syst. Synth. Biol. 1, 1–19.
Voit, E. O., and Savageau, M. A. (1982). Power-law approach to modeling biological systems; II. Application to ethanol production. J. Ferment. Technol. 60, 229–232.
Volterra, V. (1926). Fluctuations in the abundance of a species considered mathematically. Nature 118, 558–560. doi:10.1038/118558a0
Wang, Y., Li, H. X., Huang, T. W., and Li, L. (2014). Differential evolution based on covariance matrix learning and bimodal distribution parameter setting. Appl. Soft Comput. 18, 232–247. doi:10.1016/j.asoc.2014.01.038
Wang, Y. H., Yeh, C. H., Young, H. W. V., Hu, K., and Lo, M. T. (2014). On the computational complexity of the empirical mode decomposition algorithm. Phys. A Stat. Mech. its Appl. 400, 159–167. doi:10.1016/j.physa.2014.01.020
Wangersky, P. J. (1978). Lotka-Volterra population models. Annu. Rev. Ecol. Syst. 9, 189–218. doi:10.1146/annurev.es.09.110178.001201
Waniewski, J., and Jedruch, W. (1999). Individual based modeling and parameter estimation for a Lotka–Volterra system. Math. Biosci. 157 (1-2), 23–36. doi:10.1016/s0025-5564(98)10075-5
Wenk, P., Abbati, G., Osborne, M. A., Schölkopf, B., Krause, A., and Bauer, S. (2020). ODIN: ODE-informed regression for parameter and state inference in time-continuous dynamical systems. Proc. AAAI Conf. Artif. Intell. 34 (04), 6364–6371. doi:10.1609/aaai.v34i04.6106
Wickham, H. (2016). ggplot2 : Elegant graphics for data analysis. Cham: Springer International Publishing. Imprint: Springer.
Xiao, Y., Angulo, M. T., Friedman, J., Waldor, M. K., Weiss, S. T., and Liu, Y. Y. (2017). Mapping the ecological networks of microbial communities. Nat. Commun. 8 (1), 2042. doi:10.1038/s41467-017-02090-2
Xu, L., Xu, X., Kong, D., Gu, H., and Kenney, T. (2020). Stochastic generalized lotka-volterra model with an application to learning microbial community structures. 2020 September 01, 2020:[arXiv:2009.10922 p.]. Available at: https://ui.adsabs.harvard.edu/abs/2020arXiv200910922X.
Zhao, H., Zhang, C., and Wen, L. (2018). Maximum likelihood estimation for stochastic Lotka–Volterra model with jumps. Adv. Differ. Equ. 2018 (1), 148. doi:10.1186/s13662-018-1605-z
Zhou, Y., and Chen, B. (2006). “Analysis of multi-ISPs game based on lotka-volterra model,” in 2006 International Conference on Computational Inteligence for Modelling Control and Automation and International Conference on Intelligent Agents Web Technologies and International Commerce (CIMCA'06), 34.
Zimmer, C. (2013). Parameter estimation for stochastic models of biochemical reactions. J. Comput. Sci. Syst. Biol. 06 (01). doi:10.4172/jcsb.1000095
Zou, H., and Hastie, T. (2005). Regularization and variable selection via the elastic net. J. R. Stat. Soc. B 67, 301–320. doi:10.1111/j.1467-9868.2005.00503.x
Keywords: community dynamics, lotka-volterra model, microbiome, parameter estimation, population dynamics, systems biology
Citation: Davis JD, Olivença DV, Brown SP and Voit EO (2022) Methods of quantifying interactions among populations using Lotka-Volterra models. Front. Syst. Biol. 2:1021897. doi: 10.3389/fsysb.2022.1021897
Received: 17 August 2022; Accepted: 04 October 2022;
Published: 26 October 2022.
Edited by:
Rongling Wu, The Pennsylvania State University (PSU), United StatesReviewed by:
Dengcheng Yang, Beijing Forestry University, ChinaCopyright © 2022 Davis, Olivença, Brown and Voit. This is an open-access article distributed under the terms of the Creative Commons Attribution License (CC BY). The use, distribution or reproduction in other forums is permitted, provided the original author(s) and the copyright owner(s) are credited and that the original publication in this journal is cited, in accordance with accepted academic practice. No use, distribution or reproduction is permitted which does not comply with these terms.
*Correspondence: Eberhard O. Voit, ZWJlcmhhcmQudm9pdEBibWUuZ2F0ZWNoLmVkdQ==
Disclaimer: All claims expressed in this article are solely those of the authors and do not necessarily represent those of their affiliated organizations, or those of the publisher, the editors and the reviewers. Any product that may be evaluated in this article or claim that may be made by its manufacturer is not guaranteed or endorsed by the publisher.
Research integrity at Frontiers
Learn more about the work of our research integrity team to safeguard the quality of each article we publish.