 Piaopiao Li1
 Lei Ma
- 1College of Life Science, Shihezi University, Shihezi, Xinjiang Uyghur Region, China
- 2The First Affiliated Hospital, College of Medicine, Shihezi University, Shihezi, China
Background: Non-small cell lung cancer (NSCLC) is a malignant tumor with high mortality. Lung squamous carcinoma (LUSC) and lung adenocarcinoma (LUAD) are the common subtypes of NSCLC. However, how LUSC and LUAD are compatible remains to be elucidated.
Methods: We used a network approach to find highly interconnected genes shared with LUSC and LUAD, and we then built modules to assess the degree of preservation between them. To quantify this result, Z-scores were used to summarize the interrelationships between LUSC and LUAD. Furthermore, we correlated network hub genes with patient survival time to identify risk factors.
Results: Our findings provided a look at the regulatory pattern for LUSC and LUAD. For LUSC, several genes, such as AKR1C1, AKR1C2, and AKR1C3, play key roles in regulating network modules of cell growth pathways. In addition, CCL19, CCR7, CCL21, and LY9 are enriched in LUAD network modules of T lymphocyte-related pathways. LUSC and LUAD have similar expressed gene expression patterns. Their networks share 46 hub genes with connectivity greater than 0.9. These genes are correlated with patient survival time. Among them, the expression level of COL5A2 in LUSC and LUAD is higher than that in normal tissues, which is closely related to the poor prognosis of LUSC and LUAD patients.
Conclusion: LUSC and LUAD share a network pattern. COL5A2 may be a risk factor in poor prognosis in LUSC and LUAD. The common landscape of LUSC and LUAD will help better define the regulation of NSCLC candidate genes and achieve the goals of precision medicine.
Introduction
Lung cancer is one of the fastest-growing malignancies in the world in terms of morbidity and mortality (1). Non-small cell lung carcinoma (NSCLC) accounts for more than 85% of lung cancer patients (2). Advanced NSCLC has a poorer prognosis compared to small cell lung cancer (3). It is imperative to find early biomarkers to judge prognosis and guide treatment for NSCLC (2). Lung squamous carcinoma (LUSC) and lung adenocarcinoma (LUAD) are the most common subtypes of NSCLC (4). They differ in genetics, pathogenesis, biological behavior, treatment, and prognosis (5–8). Generally, LUAD grows more slowly and has a smaller mass than LUSC at the same stage, but LUAD tends to start to metastasize at an early stage (9, 10). LUSCs metastasize later and are usually diagnosed at an advanced stage (11). LUAD is insensitive to radiation and chemotherapy (12). The prognosis of patients is unsatisfactory, and the 5-year survival rate is less than 10% (13). However, both subtypes lack effective early diagnosis methods. Therefore, elucidating the molecular mechanisms of these two subtypes and finding new prognostic markers is of great significance for the prognosis of patients with NSCLC (14).
Comparative studies of cancer types based on common features (13) and individual distinct attributes can provide new insights into different cancers at the molecular level (15). Network analysis is an effective means to provide key insights into the relationship between gene expression levels and the different progression of cancers (16). To access how LUSC and LUAD are compatible, we built a network to find highly interconnected genes associated with them. In sum, LUSC and LUAD share a common gene expression pattern with 46 common hub genes in both networks. In addition, the COL5A2 gene may be a major factor in poor prognosis in LUSC and LUAD. The common landscape of LUSC and LUAD may provide potential target genes for the diagnosis of NSCLC and provide a new insight into the precision therapy of LUSC and LUAD.
Material and methods
Data preparation
We downloaded 484 LUSC and 510 LUAD cohorts from the cBioPortal for Cancer Genomics (http://www.cbioportal.org/) (17). We then used R to standardize the dataset and determine the comparability of the data. By calculating the median absolute deviation, we selected the top 20% of genes shared by the two cancers. Then, according to the degree of sample aggregation estimated by the WGCNA package, 136 LUSCs and 184 LUADs were retained (Supplementary Table S1) (18). The two datasets were comparable when the data correlation between LUSCs and LUSCs was 0.46 (P < 0.01) (Supplementary Figure S1).
Network analysis of weighted gene co-expression
We set genes as nodes and relationships between genes as edges to build a co-expression network using the WGCNA package (18). The construction steps of the network mainly included correlation matrix calculation, soft threshold selection, adjacency matrix calculation, heterogeneous matrix calculation, dynamic branch cutting, and module merging (19). We then identified the network modules.
Module consensus between subtypes
We identified the consensus module between LUSC and LUAD. Module overlap degree referred to the common gene number between modules (20). We then generated Z-scores (20) using the permutation test in the WGCNA package to assess the preservation of LUAD genes in the LUSC module. The ranges 5 < Z < 10 and Z > 10 were considered moderate and highly preserved, respectively.
Module eigengene and GO enrichment
Module eigengene (ME), the first principal component of modules, represents the feature expression mode of modules (21). Eigengene connectivity (KME) represents the Pearson correlation between genes (including genes not originally assigned to modules) and modules in the network. We calculated KME and P values for all genes in LUSC and LUAD, then ranked the KME values from largest to smallest and selected the top 100 genes for each module (P < 0.05). We performed a Gene Ontology (GO) enrichment analysis to select the top five enrichment terms for each module via the Clusterprofiler package (22).
Hub gene screen
Based on Z-scores, we selected candidate hub genes with KME-module correlations greater than 0.9 in high-conservation modules. We then performed Spearman's rank correlation analysis between the expression of candidate hub genes and the overall survival time of patients. Finally, the online software Kaplan–Meier Plotter (23) was used to analyze the effect of gene expression on patient survival. Cancer samples were divided into two groups based on high and low expression levels of genes. Genes with significantly different survival curves between the two groups were thought to be closely related to the survival of cancer patients (19). We used Cox univariate analysis in the SURVIVAL and SURVMISER software packages to verify whether hub gene expression is a major prognostic factor.
Validation of COL5A2
Based on the GEO database (https://www.ncbi.nlm.nih.gov/gds/), we obtained the LUSC and LUAD gene expression dataset (GSE134381), including 20 LUSC cancer samples and 20 normal samples, and 17 LUAD cancer samples and 17 normal samples. We evaluated the expression differences of hub genes in cancer and normal samples. We searched for chemical substances and human diseases that have regulatory relationships with hub genes in the Comparative Toxicogenomics Database (CTD) (24) and counted the number of corresponding files.
Results
Similarity of LUSC and LUAD network
We identified 11 LUSC and 6 LUAD gene co-expression modules, respectively (Figure 1 and Supplementary Figures S1, S2). For visualization, we named modules with colors. Modules are clusters of densely interconnected genes that may be involved in a similar function. For example, the LUSC module “greenyellow” contains some genes, such as AKR1C1, AKR1C2, and AKR1C3, enriched in regulation of the extent of cell growth pathways. In addition, the LUAD module “yellow” consists of genes, such as CCL19, CCR7, CCL21, and LY9, that are enriched in T-lymphocyte-related pathways involved in T-cell activation, regulation of lymphocyte activation, and regulation of T-cell activation.
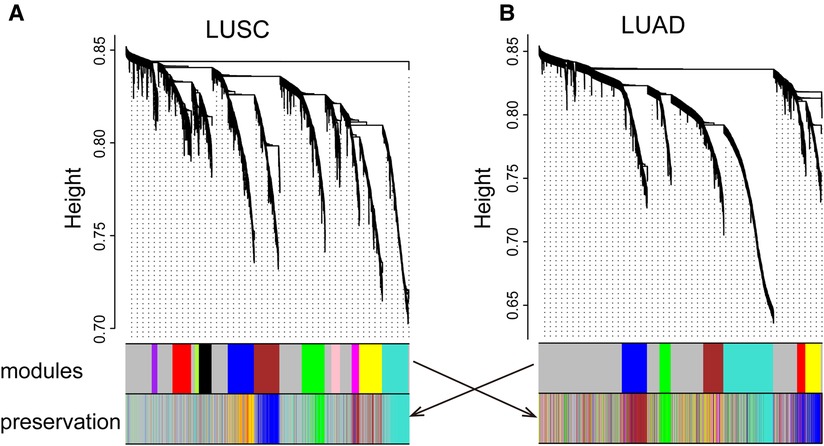
Figure 1. LUSC (A) and LUAD (B) networks. The upper panel shows a gene dendrogram obtained by mean linkage hierarchical clustering. The first color row underneath the dendrogram shows the module assignment determined by the dynamic tree cut. The second row shows the imposition of a subtype module onto another network. These module color labels in the second row are still grouped together corresponding to the first row, indicating good preservation. Note that for some modules, even with significant preservation, they cannot be seen in obvious grouping in the second dataset.
Modules highlighted similar expression patterns of genes in LUSC and LUAD, respectively. We then assessed how well the modules in one cancer subtype are preserved in another cancer subtype. As a qualitative evaluation, we imposed modules from LUSC onto the network for dataset LUAD and vice versa (Figures 1A,B). Some modules from one cancer subtype are still assembled in another cancer, well preserved (Figure 2; Supplementary Table S2). There is a high degree of gene overlap within the module between LUSC and LUAD. For example, the LUSC module “turquoise” is contained in the LUAD module “turquoise,” and the LUSC module “brown” is corresponding to the LUAD module “blue.” To quantify this result, we used the Z-score to summarize how well the modules hold in each other (Table 1). In general, the higher the value of the Z-score, the more preserved the module is between cancer subtypes. The Z-scores of the six modules are greater than 10, indicating that the LUSC network is significantly similar to LUAD (Table 1).
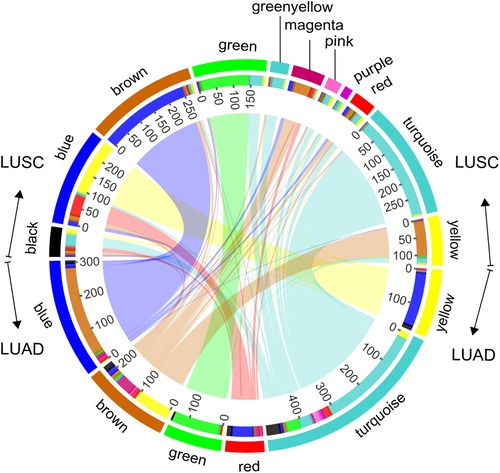
Figure 2. Module overlaps. Circles represent, from outermost to innermost, the color labels of modules of LUSC and LUAD, the number of genes, and internetwork overlapping.
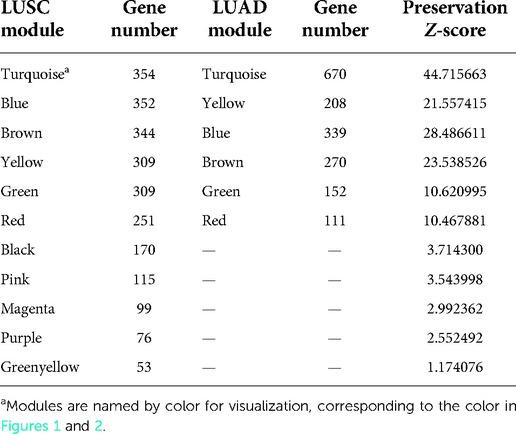
Table 1. LUSC and LUAD network module.
Module function similarity
We explored the top five significant rich GO terms for each module. The functional overlap degree of modules between LUSC and LUAD corresponds to the degree of preservation of the module among them (Figure 3 and Supplementary Table S3). The higher the degree of preservation between the LUSC module and the LUAD module, the higher the functional overlap between them. For example, the LUSC module “turquoise” and the LUAD module “turquoise” have the highest Z-score, sharing 80% (4/5) of GO terms (Figure 3A). Furthermore, LUSC module “brown” and LUAD module “blue” are almost completely overlapping (Figure 2), which share common biological processes, such as extracellular matrix organization, extracellular structure organization, collagen fibril organization, ossification, and cartilage development (Figure 3B). In addition, low-preservation modules also have shared GO terms. For example, both the LUSC module “magenta” and the LUAD module “blue” are involved in extracellular structure in organization processes (Figure 3B).
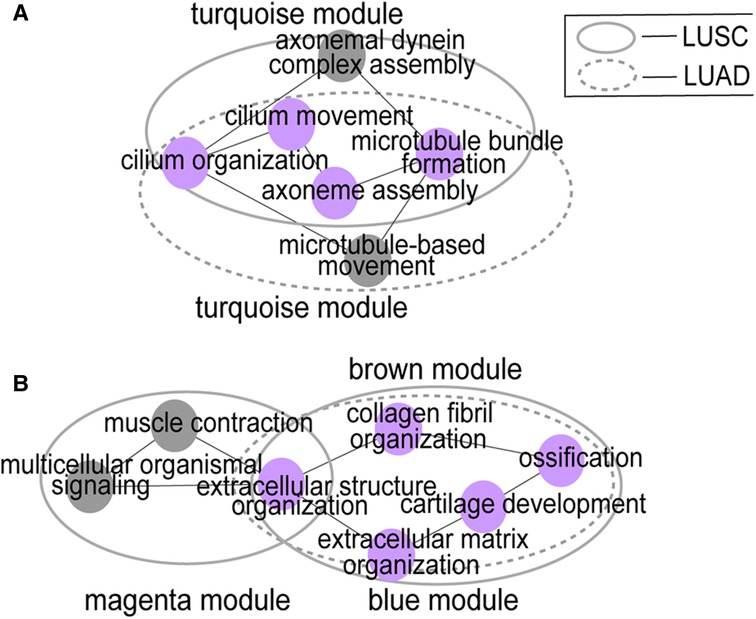
Figure 3. Module function similarity. (A) shows the functional overlap between LUSC module “turquoise” and LUAD module “turquoise”; (B) shows the functional overlap between LUSC module “brown” and LUAD module “blue”, the LUSC module “magenta” and the LUAD module “blue”. Big circles represent modules and small colored circles represent GO terms. The purple circles represent the inter-network overlap.
Hub genes
The LUSC and LUAD networks share 46 hub genes with connectivity greater than 0.9. We then correlated these genes with patient survival time. The hub genes of COL5A2, TTLL3, SPEF1, TMEM190, CCDC65, CCDC33, and GLT8D2 have the highest Spearman rank correlations. Furthermore, COL5A2 is closely related to both LUSC and LUAD patients’ survival time (Figure 4), implying it may be a risk factor. The COL5A2 gene may lead to both LUSC and LUAD patients' poor prognosis [LUSC HR = 1.35 (1.02–1.78), logrank P = 0.035; LUAD HR = 1.5 (1.07–2.11), logrank P = 0.019]. The higher the COL5A2 expression, the worse the patient survival rate (Figure 4).
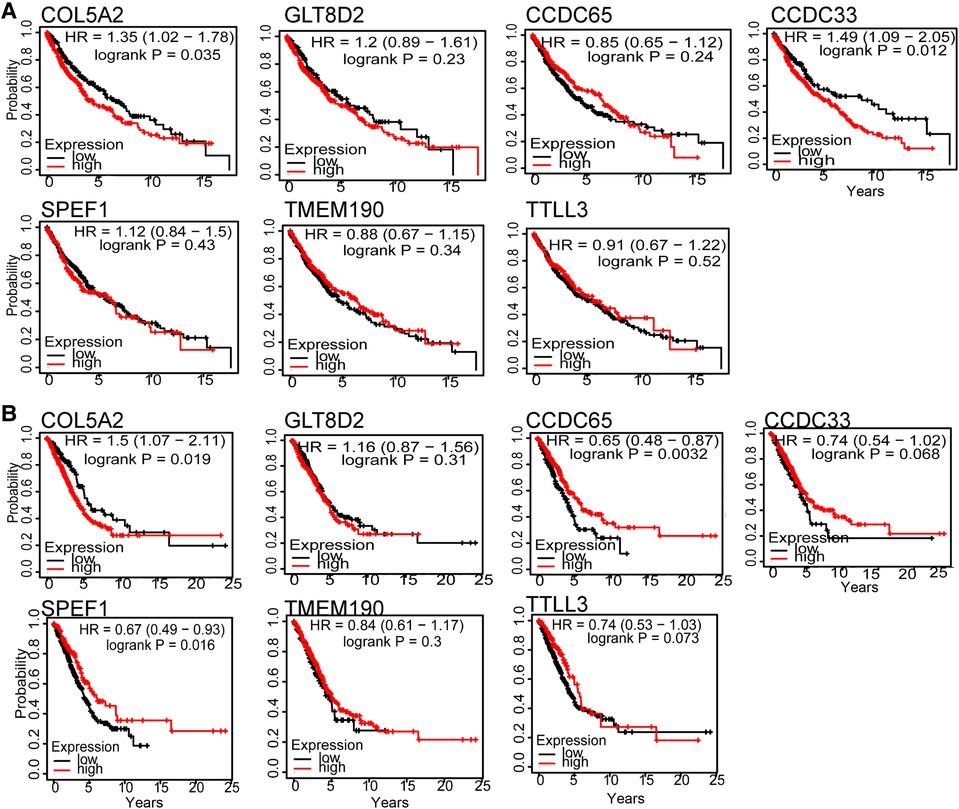
Figure 4. Hub genes survival curve for seven genes in LUSC (A) and LUAD (B). The horizontal axis is survival time, and the vertical axis is the overall survival rate.
Prognostic factor COL5A2
To determine whether the COL5A2 gene is a major prognostic factor, we correlated the clinical data of LUSC and LUAD with patient prognoses (Table 2). The survival analysis results showed that age and gender have no significant relationship with LUSC and LUAD patients' survival rates (Figure 5). Moreover, the COL5A2 gene expression in LUSC and LUAD samples is significantly higher than that in normal samples (P < 0.001, Figure 6). Therefore, COL5A2 may serve as a potential therapeutic target for NSCLC.
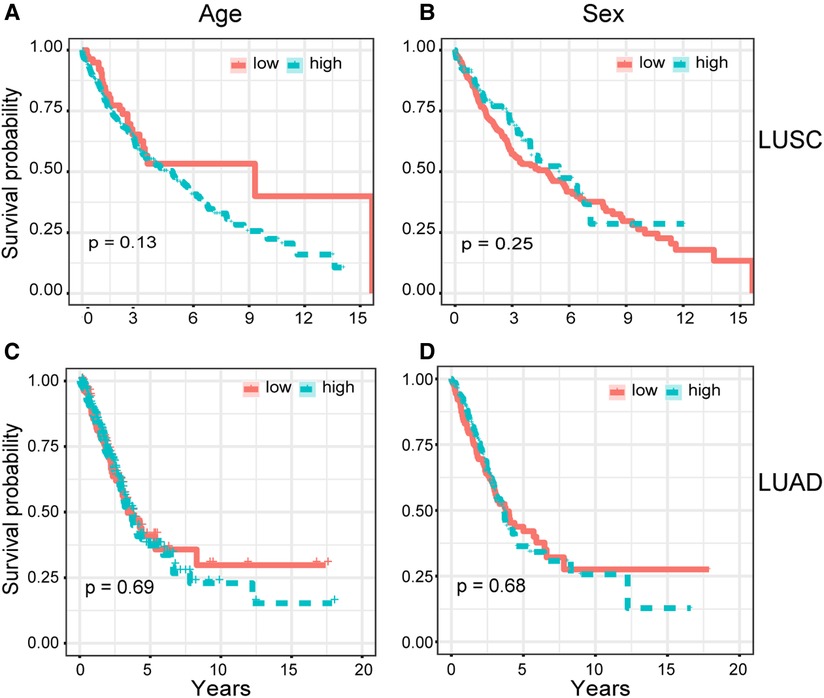
Figure 5. Cox univariate analysis. Relationships between clinical characteristics and patients' overall survival rate were shown. (A,B) show the relationship between patients' overall survival rate with age and sex for LUSC, respectively. (C,D) show the relationship between patients' overall survival rate with age and sex for LUAD, respectively.
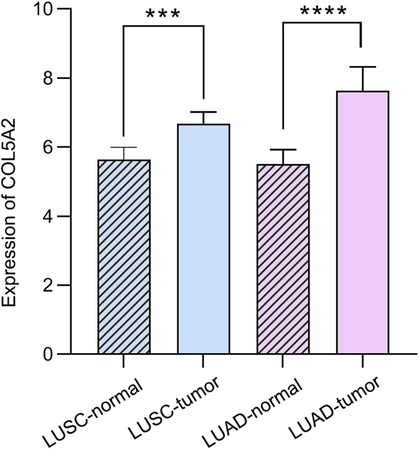
Figure 6. The relative expression of COL5A2. Stars represent statistical significance of T-test: ***<0.001; ****<0.0001.
Table 2. LUSC and LUAD clinical characteristics.
COL5A2 subnetwork
To investigate the role of COL5A2, we searched the CTD database. We found that COL5A2 may regulate chemicals and human diseases and it is related to tumor treatment drugs. In addition, many tumor-related substances or drugs can affect the expression of COL5A2 (Figure 7). For example, PIRINIXIC acid can increase COL5A2 expression by binding to PAPAYA protein and increasing its activity. In addition, tumor preventive drugs such as decitabine and fenretinide can downregulate COL5A2. Dexamethasone can reduce COL5A2 expression and suppresses the testosterone response.
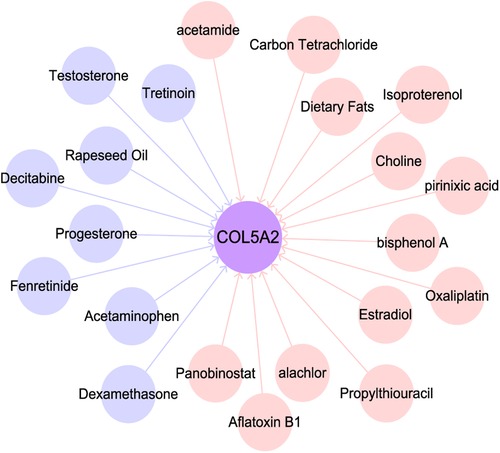
Figure 7. Substances related to COL5A2. Pink and blue circles represent substances that up- and downregulate COL5A2.
Discussion
We used a network approach to find a number of highly interconnected transcriptional events associated with non-small cell lung cancer (Figure 1). Our findings provided a preliminary view of the regulatory landscape of LUSC and LUAD. For LUSC, some genes, such as AKR1C1, AKR1C2, and AKR1C3, are enriched in the network module for regulating cell growth pathways. Overexpression of AKR1C1 is associated with cancer progression (25). In addition, AKR1C1 can directly interact with and promote phosphorylation of STAT3, enhancing the binding of STAT3 to the promoter regions of target genes, and then transactivating these genes, promoting tumor metastasis (26). Therefore, further studies on the mechanisms of AKR1C1, AKR1C2, and AKR1C3 in LUSC may provide new candidate targets for the treatment of patients.
Furthermore, genes CCL19, CCR7, CCL21, and LY9 are enriched in LUAD network modules of T-lymphocyte-related pathways, such as T-cell activation, regulation of lymphocyte activation, and regulation of T-cell activation. CCL19, CCL21, and CCR7 are involved in inducing the directed migration of T lymphocytes to lymph nodes in LUAD. CCL19 and CCL21 are chemokines and CCR7 is their receptor in gastric cancer (27) and esophageal squamous cell carcinoma (28). The three genes play an important role in cell migration and lymph node metastasis (29). These chemokines may play a crucial role in directing immune cell migration, which is required to initiate an effective antitumor immune response (30).
Modules with high retention rates between LUSC and LUAD are enriched with similar functionality (Figures 1–3). For example, most LUSC modules show significant overlap with at least one LUAD module in terms of functionality (Table 1). LUSC and LUAD networks were found to share 46 common hub genes, of which COL5A2, TTLL3, SPEF1, TMEM190, CCDC65, CCDC33, and GLT8D2 had the highest correlations with patient survival time. Further results showed that the COL5A2 gene was highly expressed in both cancer subtypes with significantly poorer prognoses (Figure 6). COL5A2, encoding type V collagen a2, is upregulated in rapidly proliferating cells (31). In addition, COL5A2 is involved in the occurrence and development of various malignancies, such as lung cancer (32), squamous cell carcinomas (33), bladder cancer (34), and colon cancer (35). We found that higher COL5A2 expression was associated with lower survival in LUSC and LUAD patients (Figure 4). Our findings on COL5A2 are largely consistent with previous studies that the COL5A2 gene can be used to assess and predict prognosis in LUAD. Therefore, COL5A2 may be a major factor in poor prognosis in LUSC and LUAD (Figure 7).
Considering that the pathogenesis of non-small cell lung cancer is still under investigation, we do not claim that our network approach can identify key genes in all classes of LUSC and LUAD, although it successfully found some instances with similar characteristics to those reported in the experiments. For further research, the following issues are worth: (1) investigating the utility and feasibility of COL5A2 as a clinical marker; and (2) identifying the pathways in which COL5A2 is involved and the key mechanisms that may guide personalized therapeutic strategies.
Conclusion
LUSC and LUAD share a common network pattern, i.e., similar gene expression trends. AKR1C1, AKR1C2, and AKR1C3 are enriched in the network module of LUSC for regulating cell growth pathways. CCL19, CCR7, CCL21, and LY9 are keys in LUAD network modules of T-lymphocyte-related pathways. Furthermore, COL5A2 may be a major factor in poor prognosis in LUSC and LUAD. The above findings may provide potential target genes for the early diagnosis of NSCLC and provide a new reference for the targeted therapy of LUSC and LUAD.
Data availability statement
The original contributions presented in the study are included in the article/Supplementary Material, further inquiries can be directed to the corresponding authors.
Author contributions
PL and LM contributed to the conception and design. LM, TZ, and XK provided administrative support. PL and XK contributed to the collection and assembly of data. PL contributed to the data analysis and interpretation. PL contributed to manuscript writing. PL and TZ provided final approval of the manuscript. All authors contributed to the article and approved the submitted version.
Funding
This work was supported by the National Natural Science Foundation of China [grant numbers 31860308 and 31272416 (to LM)], and the Science Foundation of Shihezi University [grant number RCZK201953 (to TZ)].
Acknowledgments
We thank all of the contributors of the RNA-seq data sets, and the editor and the reviewers for helpful suggestions on the manuscript.
Conflict of interest
The authors declare that the research was conducted in the absence of any commercial or financial relationships that could be construed as a potential conflict of interest.
Publisher's note
All claims expressed in this article are solely those of the authors and do not necessarily represent those of their affiliated organizations, or those of the publisher, the editors and the reviewers. Any product that may be evaluated in this article, or claim that may be made by its manufacturer, is not guaranteed or endorsed by the publisher.
Supplementary material
The Supplementary Material for this article can be found online at: https://www.frontiersin.org/articles/10.3389/fsurg.2022.958479/full#supplementary-material.
References
1. Bray F, Ferlay J, Soerjomataram I, Siegel RL, Torre LA, Jemal A. Global cancer statistics 2018: GLOBOCAN estimates of incidence and mortality worldwide for 36 cancers in 185 countries. CA Cancer J Clin. (2018) 68(6):394–424. doi: 10.3322/caac.21492
2. Zhao M, Zhang H, Zhu G, Liang J, Chen N, Yang Y, et al. Association between overexpression of Wip1 and prognosis of patients with non-small cell lung cancer. Oncol Lett. (2016) 11(4):2365–70. doi: 10.3892/ol.2016.4245
3. Wu FZ, Song JJ, Zhao ZW, Huang XF, Mao JT, Tu JF, et al. The efficacy and safety of erlotinib compared with chemotherapy in previously treated NSCLC: a meta-analysis. Math Biosci Eng. (2019) 16(6):7921–33. doi: 10.3934/mbe.2019398
4. Ding Y, Zhong T, Wang M, Xiang X, Ren G, Jia Z, et al. Integrative analysis reveals across-cancer expression patterns and clinical relevance of ribonucleotide reductase in human cancers. Front Oncol. (2019) 9(2):956. doi: 10.3389/fonc.2019.00956
5. Campbell JD, Alexandrov A, Kim J, Wala J, Berger AH, Pedamallu CS, et al. Distinct patterns of somatic genome alterations in lung adenocarcinomas and squamous cell carcinomas. Nat Genet. (2016) 48(6):607–16. doi: 10.1038/ng.3564
6. Huang T, Li J, Zhang C, Hong Q, Jiang D, Ye M, et al. Distinguishing lung adenocarcinoma from lung squamous cell carcinoma by two hypomethylated and three hypermethylated genes: a meta-analysis. PLoS One. (2016) 11(2):e0149088. doi: 10.1371/journal.pone.0149088
7. Zhan C, Yan L, Wang L, Sun Y, Wang X, Lin Z, et al. Identification of immunohistochemical markers for distinguishing lung adenocarcinoma from squamous cell carcinoma. J Thorac Dis. (2015) 7(8):1398–405. doi: 10.3978/j.issn.2072-1439.2015.07.25
8. Gottschling S, Jauch A, Kuner R, Herpel E, Mueller-Decker K, Schnabel PA, et al. Establishment and comparative characterization of novel squamous cell non-small cell lung cancer cell lines and their corresponding tumor tissue. Lung Cancer. (2012) 75(1):45–57. doi: 10.1016/j.lungcan.2011.05.020
9. Chen M, Liu X, Du J, Wang XJ, Xia L. Differentiated regulation of immune-response related genes between LUAD and LUSC subtypes of lung cancers. Oncotarget. (2017) 8(1):133–44. doi: 10.18632/oncotarget.13346
10. Cancer Genome Atlas Research Network. Comprehensive genomic characterization of squamous cell lung cancers. Nature. (2012) 489(7417):519–25. doi: 10.1038/nature11404
11. Gao M, Kong W, Huang Z, Xie Z. Identification of key genes related to lung squamous cell carcinoma using bioinformatics analysis. Int J Mol Sci. (2020) 21(8):2994. doi: 10.3390/ijms21082994
12. Cancer Genome Atlas Research Network. Comprehensive molecular profiling of lung adenocarcinoma. Nature. (2014) 511(7511):543–50. doi: 10.1038/nature13385
13. Zhao X, Li X, Zhou L, Ni J, Yan W, Ma R, et al. LncRNA HOXA11-AS drives cisplatin resistance of human LUAD cells via modulating miR-454-3p/Stat3. Cancer Sci. (2018) 109(10):3068–79. doi: 10.1111/cas.13764
14. Dong HX, Wang R, Jin XY, Zeng J, Pan J. LncRNA DGCR5 promotes lung adenocarcinoma (LUAD) progression via inhibiting hsa-mir-22-3p. J Cell Physiol. (2018) 233(5):4126–36. doi: 10.1002/jcp.26215
15. Haiman CA, Le Marchand L, Yamamato J, Stram DO, Sheng X, Kolonel LN, et al. A common genetic risk factor for colorectal and prostate cancer. Nat Genet. (2007) 39(8):954–6. doi: 10.1038/ng2098
16. Liu M, Zhang Y, Zhang J, Cai H, Zhang C, Yang Z, et al. MicroRNA-1253 suppresses cell proliferation and invasion of non-small-cell lung carcinoma by targeting WNT5A. Cell Death Dis. (2018) 9(2):189. doi: 10.1038/s41419-017-0218-x
17. Hou H, Zhang C, Qi X, Zhou L, Liu D, Lv H, et al. Distinctive targetable genotypes of younger patients with lung adenocarcinoma: a cBioPortal for cancer genomics data base analysis. Cancer Biol Ther. (2020) 21(1):26–33. doi: 10.1080/15384047.2019.1665392
18. Presson AP, Sobel EM, Papp JC, Suarez CJ, Whistler T, Rajeevan MS, et al. Integrated weighted gene co-expression network analysis with an application to chronic fatigue syndrome. BMC Syst Biol. (2008) 2:95. doi: 10.1186/1752-0509-2-95
19. Jia R, Zhao H, Jia M. Identification of co-expression modules and potential biomarkers of breast cancer by WGCNA. Gene. (2020) 750:144757. doi: 10.1016/j.gene.2020.144757
20. Miller JA, Horvath S, Geschwind DH. Divergence of human and mouse brain transcriptome highlights Alzheimer disease pathways. Proc Natl Acad Sci USA. (2010) 107(28):12698–703. doi: 10.1073/pnas.0914257107
21. Langfelder P, Horvath S. WGCNA: an R package for weighted correlation network analysis. BMC Bioinform. (2008) 9:559. doi: 10.1186/1471-2105-9-559
22. Yu G, Wang LG, Han Y, He QY. Clusterprofiler: an R package for comparing biological themes among gene clusters. Omics. (2012) 16(5):284–7. doi: 10.1089/omi.2011.0118
23. Hou GX, Liu P, Yang J, Wen S. Mining expression and prognosis of topoisomerase isoforms in non-small-cell lung cancer by using oncomine and Kaplan-Meier plotter. PLoS One. (2017) 12(3):e0174515. doi: 10.1371/journal.pone.0174515
24. Davis AP, Grondin CJ, Johnson RJ, Sciaky D, McMorran R, Wiegers J, et al. The comparative toxicogenomics database: update 2019. Nucleic Acids Res. (2019) 47(D1):D948–54. doi: 10.1093/nar/gky868
25. Chien CW, Ho IC, Lee TC. Induction of neoplastic transformation by ectopic expression of human aldo-keto reductase 1C isoforms in NIH3T3 cells. Carcinogenesis. (2009) 30(10):1813–20. doi: 10.1093/carcin/bgp195
26. Zhu H, Chang LL, Yan FJ, Hu Y, Zeng CM, Zhou TY, et al. AKR1C1 activates STAT3 to promote the metastasis of non-small cell lung cancer. Theranostics. (2018) 8(3):676–92. doi: 10.7150/thno.21463
27. Zhou R, Sun J, He C, Huang C, Yu H. CCL19 suppresses gastric cancer cell proliferation, migration, and invasion through the CCL19/CCR7/AIM2 pathway. Hum Cell. (2020) 33(4):1120–32. doi: 10.1007/s13577-020-00375-1
28. Shi M, Chen D, Yang D, Liu XY. CCL21-CCR7 promotes the lymph node metastasis of esophageal squamous cell carcinoma by up-regulating MUC1. J Exp Clin Cancer Res. (2015) 34:149. doi: 10.1186/s13046-015-0268-9
29. Shields JD, Fleury ME, Yong C, Tomei AA, Randolph GJ, Swartz MA. Autologous chemotaxis as a mechanism of tumor cell homing to lymphatics via interstitial flow and autocrine CCR7 signaling. Cancer Cell. (2007) 11(6):526–38. doi: 10.1016/j.ccr.2007.04.020
30. Ozga AJ, Chow MT, Luster AD. Chemokines and the immune response to cancer. Immunity. (2021) 54(3):859–74. doi: 10.1016/j.immuni.2021.01.012
31. Chiarelli N, Carini G, Zoppi N, Ritelli M, Colombi M. Molecular insights in the pathogenesis of classical Ehlers-Danlos syndrome from transcriptome-wide expression profiling of patients’ skin fibroblasts. PLoS One. (2019) 14(10):e0211647. doi: 10.1371/journal.pone.0211647
32. Jiang H, Xu S, Chen C. A ten-gene signature-based risk assessment model predicts the prognosis of lung adenocarcinoma. BMC Cancer. (2020) 20(1):782. doi: 10.1186/s12885-020-07235-z
33. Chen HC, Tseng YK, Shu CW, Weng TJ, Liou HH, Yen LM, et al. Differential clinical significance of COL5A1 and COL5A2 in tongue squamous cell carcinoma. J Oral Pathol Med. (2019) 48(6):468–76. doi: 10.1111/jop.12861
34. Zeng XT, Liu XP, Liu TZ, Wang XH. The clinical significance of COL5A2 in patients with bladder cancer: a retrospective analysis of bladder cancer gene expression data. Medicine. (2018) 97(10):e0091. doi: 10.1097/MD.0000000000010091
35. Wei S, Chen J, Huang Y, Sun Q, Wang H, Liang X, et al. Identification of hub genes and construction of transcriptional regulatory network for the progression of colon adenocarcinoma hub genes and TF regulatory network of colon adenocarcinoma. J Cell Physiol. (2020) 235(3):2037–48. doi: 10.1002/jcp.29067
Keywords: non-small cell lung cancer, lung squamous carcinoma, lung adenocarcinoma, co-expression network, prognostic markers
Citation: Li P, Kuang X, Zhang T and Ma L (2022) Shared network pattern of lung squamous carcinoma and adenocarcinoma illuminates therapeutic targets for non-small cell lung cancer. Front. Surg. 9:958479. doi: 10.3389/fsurg.2022.958479
Received: 12 July 2022; Accepted: 12 September 2022;
Published: 3 October 2022.
Edited by:
Wenwu Wu, Zhejiang Agriculture and Forestry University, ChinaReviewed by:
Shulin Yang, Chinese Academy of Agricultural Sciences, ChinaDongfeng Yang, Zhejiang Sci-Tech University, China
© 2022 Li, Kuang, Zhang and Ma. This is an open-access article distributed under the terms of the Creative Commons Attribution License (CC BY). The use, distribution or reproduction in other forums is permitted, provided the original author(s) and the copyright owner(s) are credited and that the original publication in this journal is cited, in accordance with accepted academic practice. No use, distribution or reproduction is permitted which does not comply with these terms.
*Correspondence: Tingting Zhang enRpbmdAc2h6dS5lZHUuY24= Lei Ma bWxlaUBzaHp1LmVkdS5jbg==
Specialty Section: This article was submitted to Thoracic Surgery, a section of the journal Frontiers in Surgery