
95% of researchers rate our articles as excellent or good
Learn more about the work of our research integrity team to safeguard the quality of each article we publish.
Find out more
ORIGINAL RESEARCH article
Front. Surg. , 30 August 2022
Sec. Surgical Oncology
Volume 9 - 2022 | https://doi.org/10.3389/fsurg.2022.934148
This article is part of the Research Topic Predictive And Prognostic Factors In Pancreatic Ductal Adenocarcinoma View all 11 articles
 Lishan Song†
 Chaojie Xu†Tong Zhang†Shengyang Chen†Zhigang ShiShuiquan HuBingbing ChengHao TongGuangkun Wei
 Xiaoyong Li*
Background: With advances in early diagnosis and treatment, the number of cancer survivors continues to grow, and more and more cancer survivors face the threat of second primary cancer (SPM). Second primary pancreatic ductal adenocarcinoma (spPDAC) is an important subclass of SPM, but its prognostic characteristics are poorly understood.
Methods: A total of 5,439 spPDAC samples and 67,262 primary pancreatic ductal adenocarcinoma (pPDAC) samples were extracted from the SEER database for this study. Survival differences between spPDAC and pPDAC samples were compared using Kaplan–Meier curves and log-rank tests. The Fine and Gray proportional subdistributed hazard method was used to analyze potential associations between clinical variables and pancreatic ductal adenocarcinoma-specific death (PDACSD) and death from other causes. After that, the clinical variables significantly related to PDACSD were screened out to construct a competing risk nomogram, which was used to evaluate the probability of the occurrence of PDACSD. The C-index was used to evaluate the discriminative ability of the model. The area under the curve (AUC) was used to verify the discrimination of the model. The calibration curve was used to verify the calibration of the model. Decision curve analysis (DCA) was used to validate the clinical utility of the model.
Results: Compared with patients with spPDAC, the pPDAC sample had a better prognosis (p = 0.0017). Across all spPDAC samples, the three most common sites of first-present cancer were the prostate, breast, and digestive system. Age (p < 0.001), race (p = 0.006), interval (p = 0.016), location (p < 0.001), T stage (p = 0.003), M stage (p < 0.001), chemotherapy (p < 0.001), and radiotherapy (p = 0.006) were the clinical variables associated with PDACSD screened by multivariate competing risks analysis. The concordance index values for the training and validation sets were 0.665 (95% CI, 0.655, 0.675) and 0.666 (95% CI, 0.650, 0.682), respectively. AUC, calibration curve, and DCA indicated that the model we constructed had good discrimination, calibration, and clinical utility.
Conclusions: In conclusion, we first analyzed the impact of previous cancer history on prognosis. We then constructed a competing risk model that can predict the probability of developing PDACSD in spPDAC. This model has good discriminative ability, calibration, and clinical practicability and has certain guiding value for clinical decision-making.
Second primary malignancy (SPM) refers to the reappearance of a new primary malignant tumor based on the original malignant tumor (1). The number of cancer survivors is also growing due to early diagnosis, advances in treatment technology, and an aging population (2). Some statistical agencies predict that in 2026, there will be 20 million cancer survivors (3). Cancer survivors represent approximately 3.5% of the general population in the United States, and approximately one in ten newly diagnosed cancers occurs in cancer survivors (4, 5). Statistics show that with an increase in the number of cancer survivors, the number of patients with SPM also has a steady upward trend (6, 7). SPM has emerged as a significant risk factor for cancer survivors. First primary cancers (FPCs) and their treatments may influence the biological progression, treatment, and prognosis of SPM (8–11). This has led many studies to exclude this particular group. However, the increasing number of SPM patients urgently needs more research to provide guidance for clinical decision-making.
Second primary pancreatic ductal adenocarcinoma (spPDAC) is an important component of SPM. As one of the most common cancers worldwide, pancreatic ductal adenocarcinoma (PDAC) is the seventh leading cause of cancer-related death (12, 13). As more and more cancer survivors are at risk from SPM, the development of PDAC to SPM is also more frequent (14, 15). A pooled analysis study of international multicenter cancer registries reported that spPDAC accounted for 6.9% of all PDAC diagnoses (15). A Korean study showed that the type of FPC can affect the probability and prognosis of spPDAC (16). In a cohort study based on 273,144 samples, an increased incidence of pancreatic cancer was found in a population of patients with previous colon cancer (17). Due to the characteristics of multiple primary cancers, a large number of studies have excluded this special group. Furthermore, because the occurrence of spPDAC cases is relatively rare and difficult to collect, there is currently a lack of research on the prognostic characteristics of spPDAC. There are few studies on spPDAC, and the risk factors associated with spPDAC remain unclear.
The aim of this study was to analyze the impact of previous cancer on the prognosis of spPDAC patients and to identify clinical and demographic factors associated with spPDAC survival. Based on the Fine and Gray proportional subdistributed hazard method, we attempted to create competing risk nomograms to predict half-year, 1-year, and 2-year pancreatic ductal adenocarcinoma-specific mortality for spPDAC.
The data used in this study were extracted from the Surveillance, Epidemiology, and End Results (SEER) database (https://seer.cancer.gov/). Using SEER*Stat (version 8.4.0) data extraction software, eligible samples from the 18 population-based registriy (2000–2018) datasets were downloaded (18). Based on submissions in November 2020 and released in April 2021, the dataset covers 18 regions, including San Francisco-Oakland SMSA, Connecticut, and Detroit (Metropolitan), and accounts for 27.8% of the total US population. For Group A, 16,392 samples with a history of cancer were extracted. The retrieval conditions are as follows: (1) the first tumor was malignant; (2) the second primary cancer was in the pancreas; and (3) the histological diagnosis was positive. Extract clinical variables of interest include gender, ethnicity, age and year at diagnosis, site of cancer occurrence, pathological type, marital status, location of spPDAC, TNM stage of spPDAC, treatment of spPDAC, FPC site, and FPC histology type. For Group B, 67,945 pPDAC samples were extracted. The search criteria are as follows: (1) age not less than 20 years old; (2) the time of diagnosis was between 2004 and 2015; (3) the topographic code located in the pancreas was selected (ICD-O-3: C25.0–C25.3, C25 .7–C25.9) with ICD-O-3 histology/behavior code 8140/3 (adenocarcinoma) or 8500/3 (invasive ductal adenocarcinoma); and (4) only one primary malignancy occurred. This study was exempt from institutional review board approval due to the public nature and deidentification of all data.
Of the 16,392 original samples in group A, 5,439 samples were finally screened for follow-up studies. The exclusion criteria are as follows: (1) delete samples with three or more primary tumors (n = 2,347); (2) delete samples with pancreatic cancer as the third and fourth primary cancers (n = 117); (3) samples (n = 4,760) whose spPDAC diagnosis time was not within the time range from 2004 to 2015 were deleted; (4) delete missing data (n = 62); (5) delete missing clinical variables (n = 866); (6) delete samples where the FPC was pancreatic cancer (n = 53) and samples (n = 586) where the interval between two cancers was less than or equal to 6 months; and (7) exclude patients whose pathological type of SPM is not pancreatic ductal adenocarcinoma (n = 2,126). To screen out samples that fit clinicopathological types, we first used the International Classification of Neoplastic Diseases to select topographic codes with primary sites located in the pancreas (ICD-O-3: C25.0–C25.3, C25.7–C25.9) (19). Second, samples with ICD-O-3 histology/behavior code 8140/3 (adenocarcinoma) or 8500/3 (invasive ductal adenocarcinoma) were selected (19–21). The detailed process of data screening is shown in Figure 1. After removing samples with unknown data from the 67,945 samples in group B (race unknown, n = 129; surgical status unknown, n = 441; survival time unknown, n = 113), the remaining 67,262 samples were used for follow-up studies.
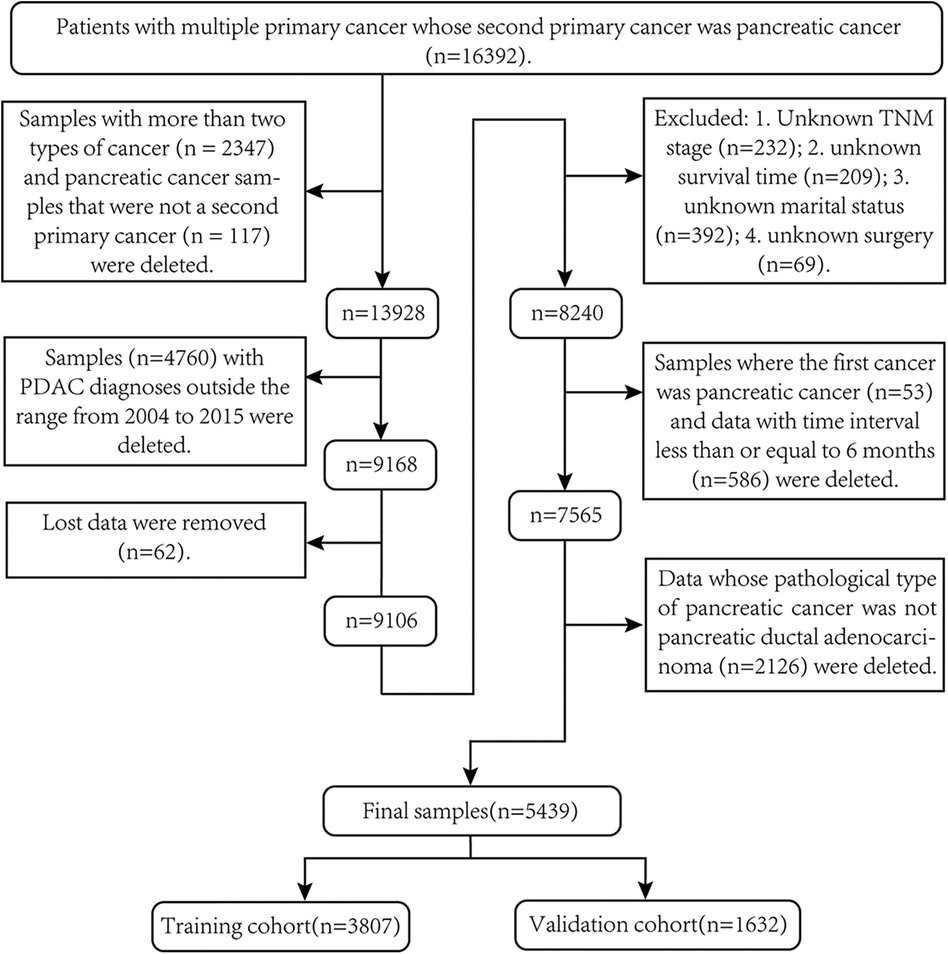
Figure 1. Screening process for second primary pancreatic ductal adenocarcinoma samples required for this study.
Numbers, percentage values, medians, quartiles, means, and variances were used to describe extreme baseline data. Survival differences between spPDAC and pPDAC samples were compared using KM survival curves and log-rank tests. All spPDAC samples were divided into a training set (n = 3,807) and a validation set (n = 1,632) according to the ratio of 7:3. The chi-square test was used to verify whether there were differences between categorical variables in the training and validation sets. Two independent sample t-tests were used to verify whether there was a difference in the interval between two primary cancers in the training and validation sets.
Causes of death were divided into pancreatic ductal adenocarcinoma-specific death (PDACSD) and death from other causes (DFOC). However, DFOC includes deaths from the first primary cancer. For the two events, PDACSD and DFOC, since one occurs, the other will not occur, so DFOC is an important competing event for PDACSD.
The Fine and Gray proportional subdistributed hazard method was used to analyze risk factors for PDACSD and DFOC. Using the risk factors of PDACSD, a competing risk model was constructed to predict the probability of PDACSD occurring in 6 months, 1 year, and 2 years. The effects of individual factors on the probability of occurrence of PDACSD and DFOC were analyzed by the univariate Fine–Gray test using the cumulative incidence function (CIF) (22, 23). The concordance index (C-index), the area under the curve (AUC), and the calibration curve were used to verify the accuracy and discrimination of the model. Decision curve analysis (DCA) (24) was used to analyze the benefit of patients after using the model.
All data analyses in this study were performed in R (version R-4.1.3). The “survival” and “survminer” packages were used for KM analysis and the log-rank test. The “chisq.test” package was used for chi-square tests. The “t.test” package was used for two independent sample t-tests. In the “cmprsk” package, the “crr()” function was used for the multivariate analysis of competing risk models, and the “cuminc()” function was used for the univariate Fine–Gray test. Packages “mstate,” “rms,” and “regplot” were used to draw competing risk nomograms. The “timeROC” and “survivalROC” packages were used to draw the area under the receiver operating characteristic curve. The “calPlot” package was used to draw calibration curves in competing risk models. The “Stdca” package is used to draw DCA (24). In all statistical tests in this paper, a two-sided p value less than 0.05 was considered statistically different.
The authors are accountable for all aspects of the work in ensuring that questions related to the accuracy or integrity of any part of the work are appropriately investigated and resolved. Institutional review board approval was waived for this study because the SEER database is a public anonymized database. All of the methods we used in this study were carried out in accordance with relevant guidelines and regulations.
After a series of screening, 5,439 spPDAC samples and 67,262 pPDAC samples were finally included in the study. As shown in Table 1, spPDAC and pPDAC samples differed significantly in terms of gender, age, race, and marital status. Compared with spPDAC, pPDAC samples were younger and had more females. In addition, the TNM stage was relatively high in pPDAC samples. The baseline characteristics of the spPDAC sample are shown in Table 2, and the median (interquartile range, IQR) values of time to diagnosis for FPC and spPDAC were 2005 (2003, 2008) and 2011 (2008, 2014), respectively. The median ages at diagnosis for FPC and spPDAC were 68 (61, 75) and 73 (66, 80) years, respectively. The mean ages at diagnosis of FPC and spPDAC were 67.45 (9.81) and 72.67 (9.64) years, respectively. The median (IQR) of the time interval between the diagnosis of two primary cancers was 55 (28, 89) months, and the mean (standard deviation, SD) was 62.61 (41.15) months. The median (IQR) from spPDAC diagnosis to endpoint, competing event, or end of the study was 5 (2, 13) months. More than half of the patients (61.37%) used chemotherapy after the diagnosis of spPDAC. Only a small number of patients underwent surgery (18.75%) and radiotherapy (17.26%).
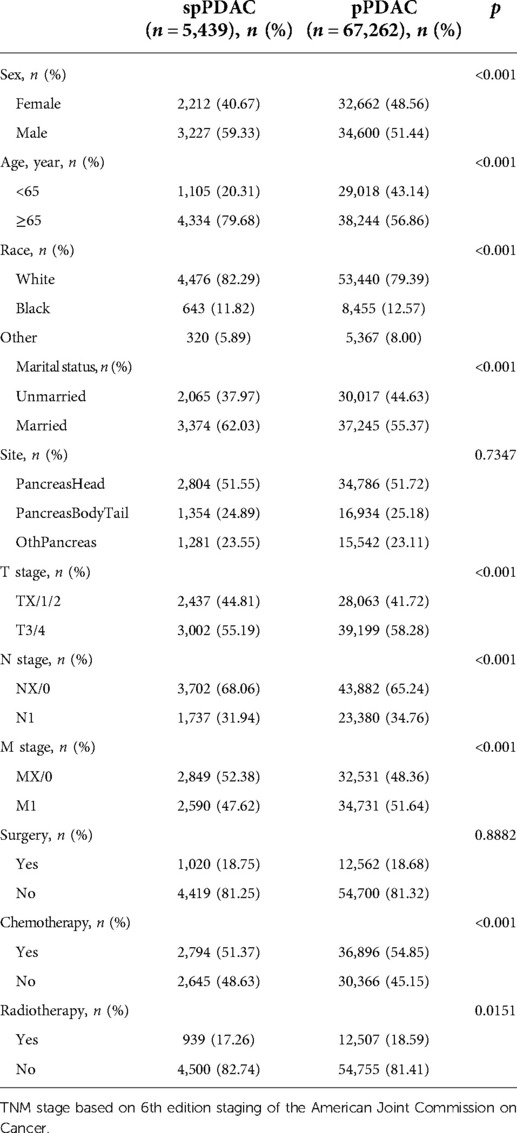
Table 1. Demographic characteristics of patients.
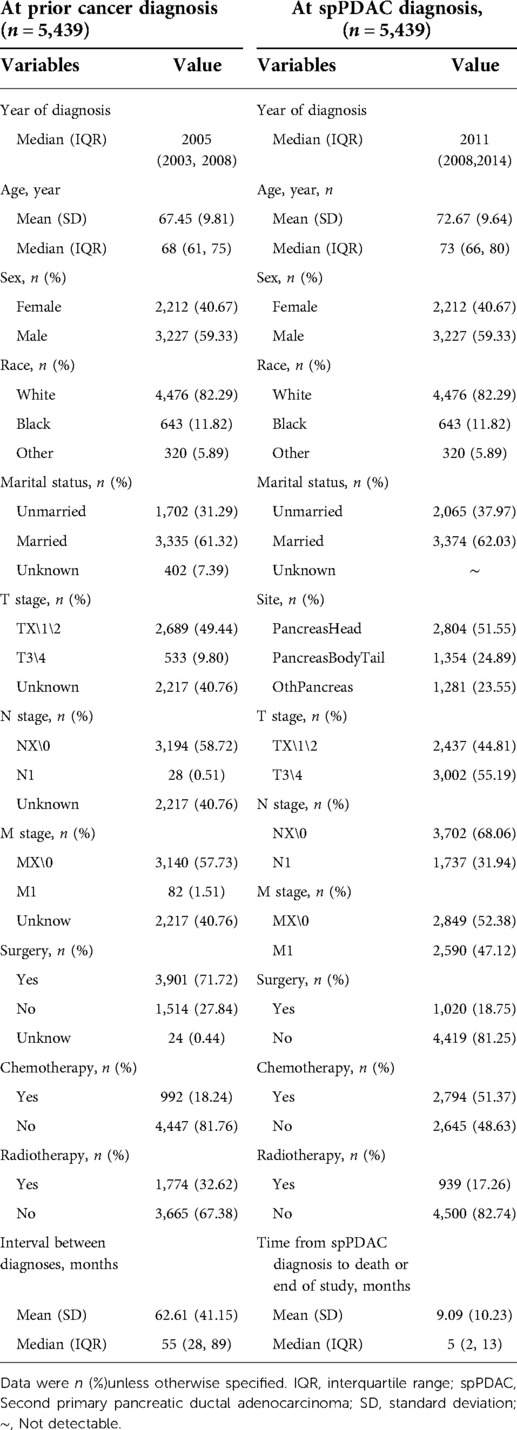
Table 2. Overview of demographic and clinical factors in spPDAC patients.
As shown in Figure 2, the three sites with the most FPCs were the prostate (n = 1,685), breast (n = 948), and digestive system (n = 826).
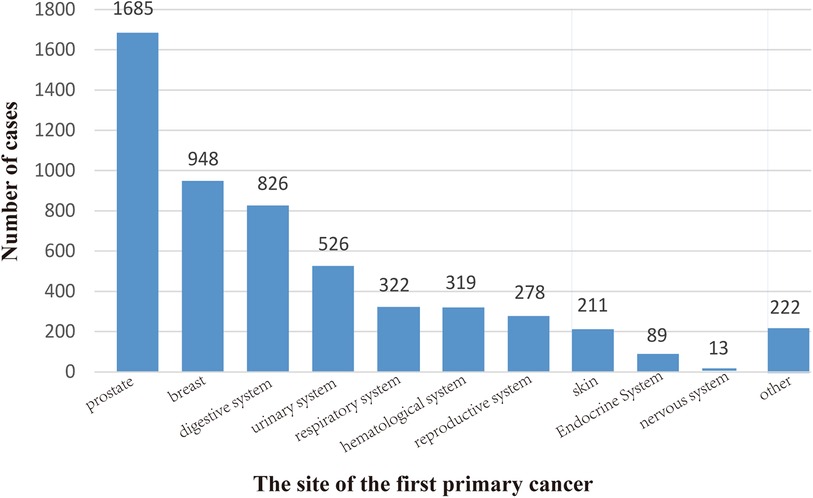
Figure 2. Location of the first primary cancer. We divided it into 11 sites, the most common of which is the prostate (1685), followed by the breast (948) and the digestive system (826). The locations of 5,439 cases are shown here.
At the end of follow-up (time = 3 years), 5,127 patients in the spPDAC group had died, accounting for 94.26% of the total study sample. In the pPDAC subgroup, 63,050 samples died at the end of follow-up, accounting for 93.74% of the total sample. As shown, we plotted KM survival curves and validated them using the log-rank test (Figure 3). The results showed that patients without a history of cancer had a better prognosis (p = 0.0017).
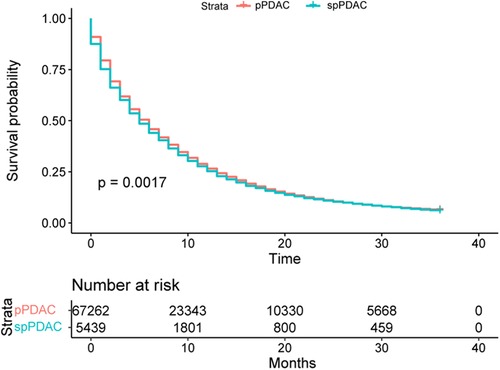
Figure 3. KM curve analysis of the difference in prognosis between spPDAC and pPDAC samples.
As shown in Figure 4, 4,239 patients died from spPDAC, leaving 888 patients from FPC or other causes. As can be seen from the figure, spPDAC was the leading cause of death in spPDAC patients regardless of the location of the FPC. Compared with other systems, the respiratory system, digestive system, and urinary system had lower PDACSD, accounting for 72.08%, 76.84%, and 79.64%, respectively. The proportion of PDACSD in other parts was more than 80%.
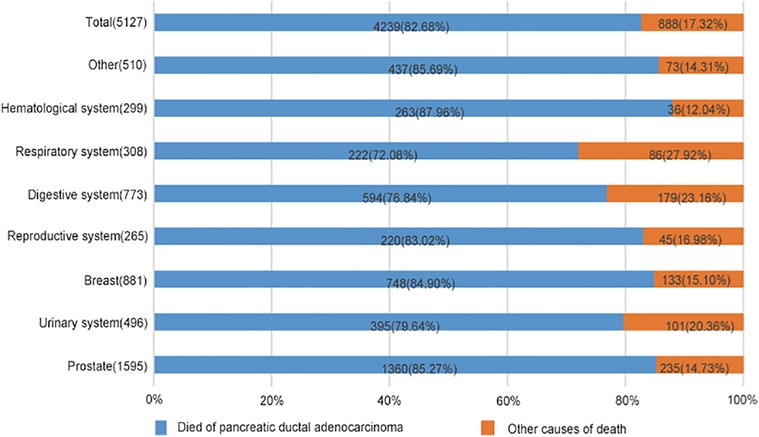
Figure 4. Percentage of spPDAC cancer-specific and other-cause-specific deaths, by location of first primary cancer. Compare the proportions of causes of death in this graph.
In a 7:3 ratio, the total study spPDAC sample (n = 5,439) was randomly divided into a training set (n = 3,807) and a validation set (n = 1,632). As shown in Table 3, gender, age, race, marital status, location of spPDAC, TNM stage, surgical treatment, chemotherapy, and the time interval between two primary cancers were not statistically different in the training set and validation set. The training set was used for the development and internal validation of the competing risk model. The validation set was used for external validation of the model. In the training cohort, there were more males, accounting for 59.50%, and the majority were elderly, accounting for 79.96%. More than half of the patients (51.12%) had spPDAC in the head of the pancreas. Most of the patients did not undergo surgery (81.46%) and radiotherapy (83.43%) after the diagnosis of spPDAC. About half of the patients (51.04%) used chemotherapy.
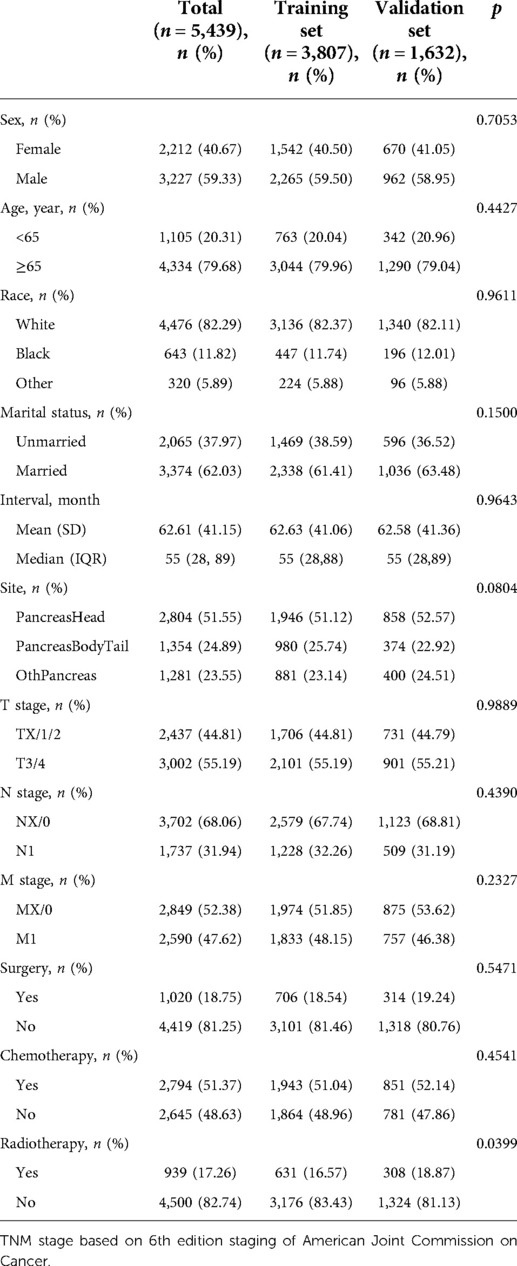
Table 3. Demographics of training and validation sets.
We divided the causes of death into PDACSD and DFOC and used the Fine and Gray proportional subdistributed hazard method to analyze the risk factors for death of patients (Table 4). Age (p < 0.001), race (p = 0.006), interval (p = 0.016), location (p < 0.001), T stage (p = 0.003), M stage (p < 0.001), chemotherapy (p < 0.001), and radiotherapy (p = 0.006) were risk factors for PDACSD. From Table 4, we can find that patients who were older at diagnosis [subdistribution hazard ratio (sdHR) 1.225 (95% CI, 1.121–1.338)] were more likely to develop PDACSD. The higher the clinical T (sdHR = 1.130, 95% CI, 1.043–1.224) and M (sdHR = 1.279, 95% CI, 1.172–1.397) stage, the higher the probability of PDACSD. Compared with no chemotherapy or radiotherapy, chemotherapy (sdHR = 0.733, 95% CI, 0.678–0.793) and radiotherapy (sdHR = 0.888, 95% CI, 0.810–0.973) could significantly reduce the incidence of PDACSD. Compared with White, black (sdHR = 0.818, 95% CI, 0.720–0.929) and other skin-colored races (sdHR = 0.888, 95% CI, 0.758–1.040) were less likely to develop PDACSD. The longer the interval between FPC diagnosis and spPDAC (sdHR = 1.001, 95% CI, 1.000–1.002), the higher the probability of PDACSD.
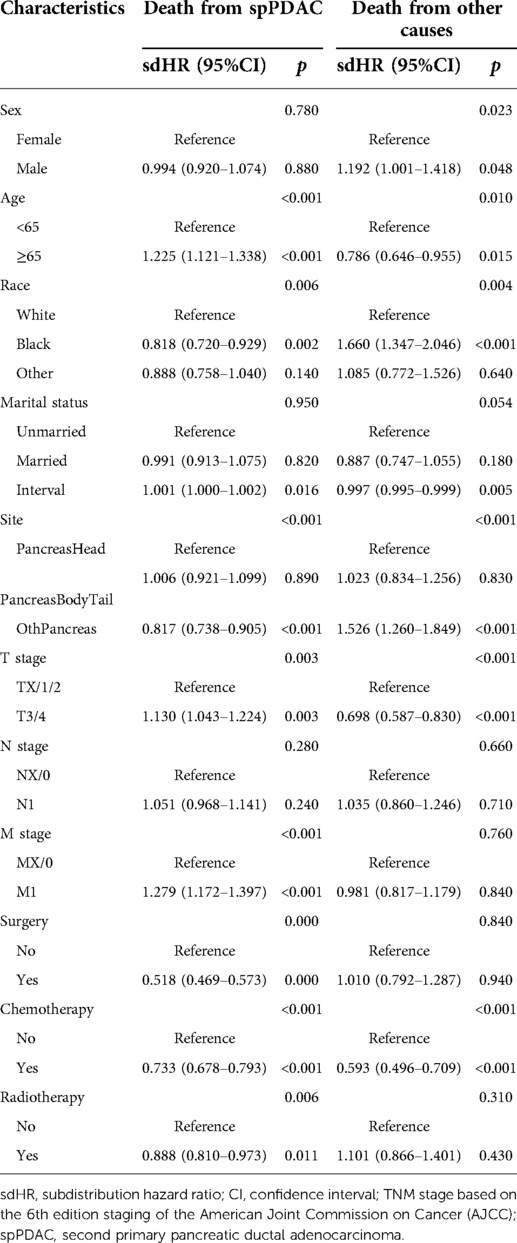
Table 4. Competing risk models for mortality from pancreatic ductal adenocarcinoma and death from other causes.
Similarly, gender (p = 0.023), age (p = 0.010), race (p = 0.004), time interval (p < 0.001), specific location of spPDAC (p < 0.001), T stage (p < 0.001), and chemotherapy (p < 0.001) were associated with the occurrence of DFOC. DFOC includes not only deaths due to FPC but also other causes of death such as car accidents and cardiovascular disease.
The univariate Fine–Gray test showed that the cumulative probability of occurrence of PDACSD and DFOC showed significant differences when the values of individual clinical variables were different (Figure 5).
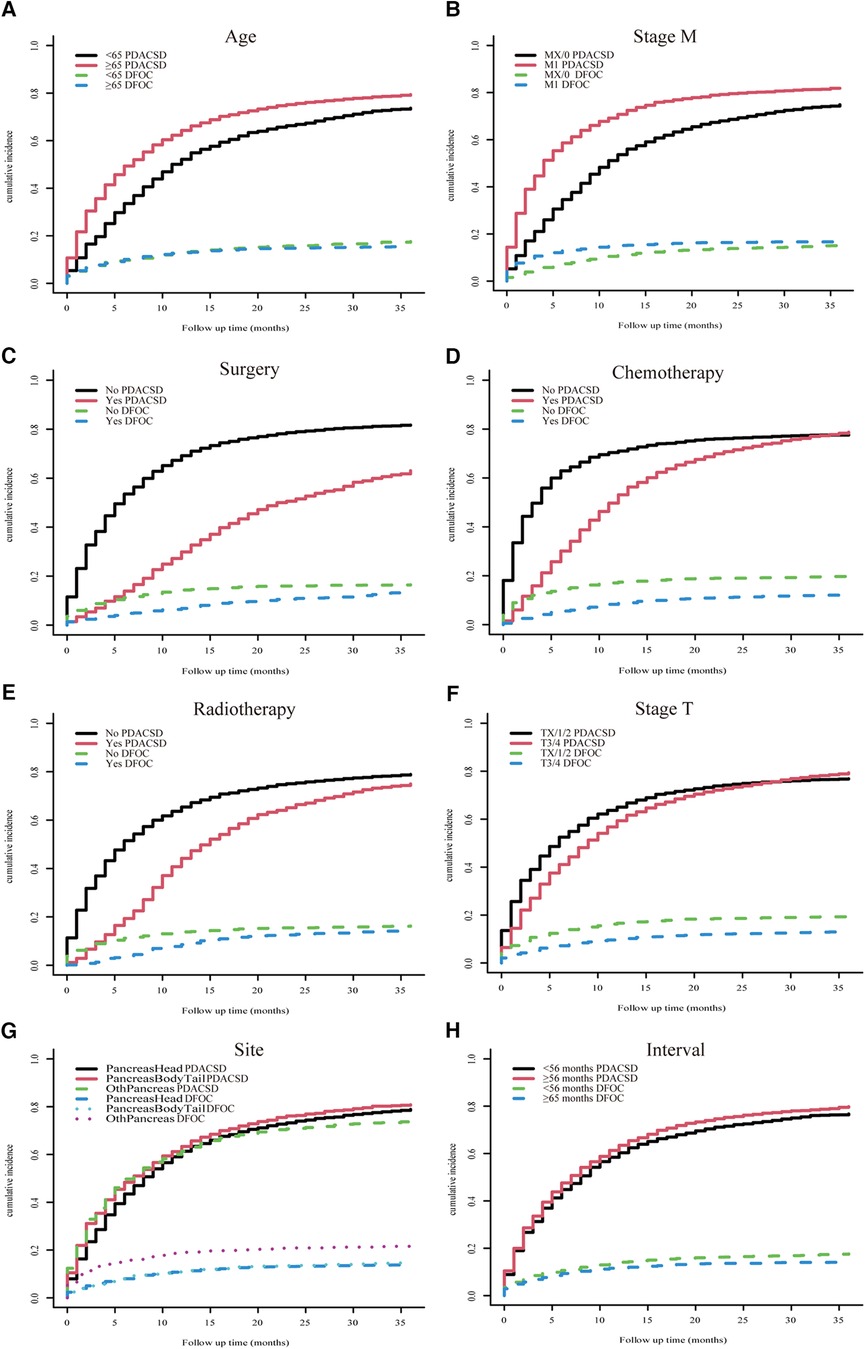
Figure 5. Univariate Fine–Gray test was used to analyze the cumulative incidence of pancreatic ductal adenocarcinoma-specific death and death from other causes. Age (A), M stage (B), surgery (C), chemotherapy (D), radiotherapy (E), T stage (F), location (G), and time interval (H).
To make the model more practical in clinical practice, we developed a nomogram of competing risk models. In our nomogram, there are eight clinical variables, including age, the specific site of spPDAC occurrence, interval, T stage, M stage, surgery, chemotherapy, and radiotherapy (Figure 6). The probability of occurrence of PDACSD in 6 months, 1 year, and 2 years can be predicted only by adding the scores of each variable of spPDAC patients. We used the C-index to verify the accuracy of the model. The C-index values were 0.665 (95% CI, 0.655, 0.675) and 0.666 (95% CI, 0.650, 0.682) for the training and validation sets, respectively. This showed that the model has a better discriminative ability. The training set and validation set AUC showed that our model has good discrimination (Figures 7A,B). The calibration curves showed that the predicted and actual observed values of the model were almost consistent (Figures 7C,D). DCA (Figures 7E–J) showed that the model had good clinical utility in predicting 6-month, 1-year, and 2-year PDACSD.
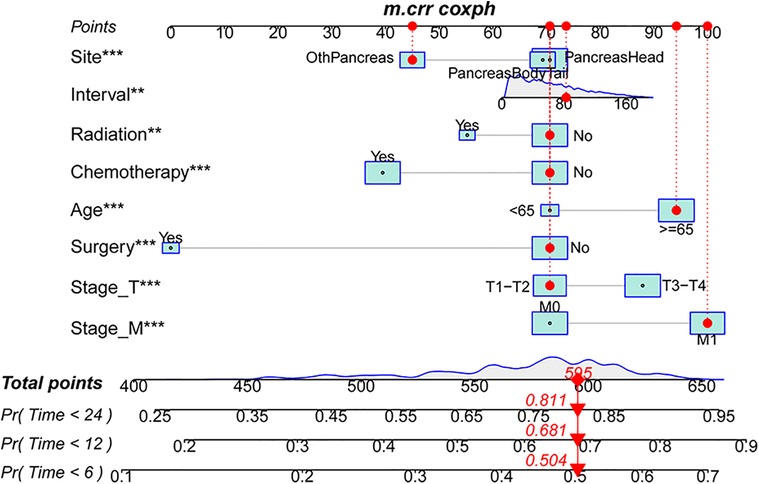
Figure 6. Nomogram for predicting 6-month, 1-year, and 2-year pancreatic ductal adenocarcinoma-specific mortality in patients with second primary pancreatic ductal adenocarcinoma.
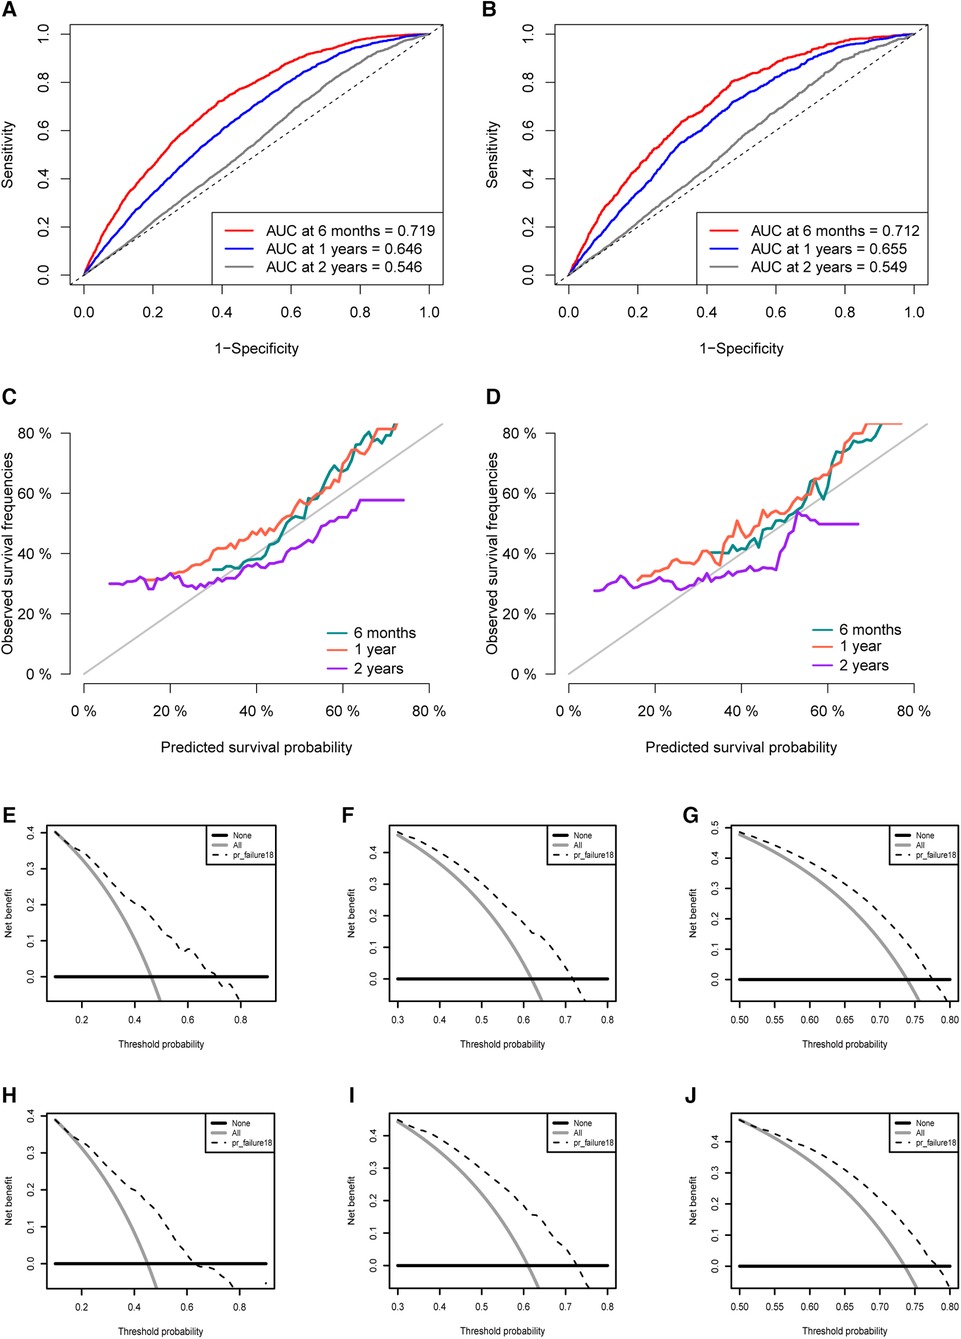
Figure 7. Area under the receiver operating characteristic curve for the training set (A) and validation set (B). Calibration curves in the training set (C) and validation set (D). Decision curves for half a year (E), 1 year (F), 2 years (G) in the training set. Decision curves for half a year (H), 1 year (I), 2 years (J) in the validation set.
In this study, we first analyzed the impact of previous cancer history on the prognosis of patients with PDAC. The results suggest that PDAC patients without a previous history of cancer have a better prognosis. The difference in prognosis between the spPDAC subgroup and the pPDAC subgroup also implies that previous studies on the prognostic characteristics of the pPDAC patient population were not applicable to the spPDAC population. Therefore, developing a prediction model suitable for the spPDAC population is of great significance for the precise treatment of spPDAC.
We used the Fine and Gray proportional subdistributed hazard method to identify risk factors significantly associated with PDACSD, including age, race, interval, location, T stage, M stage, chemotherapy, and radiotherapy. We constructed a competing risk model nomogram to assess the probability of developing PDACSD in spPDAC patients.
We identified the three most common FPCs in spPDAC patients followed by prostate cancer, breast cancer, and digestive malignancies. Similar to our conclusions, He et al. (25) found in a retrospective study that the most common sites of previous cancer in spPDAC patients were the prostate, breast, kidney, and bladder. Prostate cancer is the most common site, probably because of its higher incidence and better prognosis (26, 27). These key populations should be carefully screened.
Jo et al. (28) conducted a retrospective cohort study and found that the mean age of patients with spPDAC (n = 110) was significantly higher (66.5 vs. 62.2 years) compared with pPDAC patients (n = 1,606, p < 0.001). In our study, age was an important risk factor for developing PDACSD in spPDAC patients (p < 0.001). In all spPDAC samples, the mean age (SD) of patients was 72.67 (9.64) years old. In the training set, patients 65 years or older had a higher risk of developing PDACSD (sdHR = 1.225, 95% CI, 1.121–1.338). Studies have shown that there are significant differences in the treatment decisions and clinical prognosis of PDAC with different ages, and PDAC is age-dependent cancer (29). Age is considered an independent prognostic factor for PDAC (29, 30).
PDAC has always been a very malignant tumor. In the United States, PDAC is the third leading cause of cancer-related death (31). Due to the highly aggressive nature of PDAC, patients often have local invasion and distant metastasis at the time of diagnosis, resulting in poor prognosis in PDAC patients (32). According to research statistics, the average survival time after PDAC diagnosis is only 6–9 months (33–35). At the end of our 3-year follow-up, 94.26% of patients had died, including 82.68% of PDACSD. This also supports the characteristics of high malignancy and poor prognosis of PDAC.
The treatment methods of PDAC mainly include surgery, chemotherapy, radiation therapy, immunotherapy, and targeted therapy. Radical surgical resection is the most effective method for PDAC (36), but only 20% of patients achieve effective remission with surgical treatment (37). At present, there is no authoritative organization to formulate surgical treatment standards for spPDAC. Doctors often judge whether a patient can undergo surgical treatment according to the patient's physical condition and tumor progression, combined with the surgical treatment standards for PDAC(38–40). Therefore, for the special group of spPDAC, more research and authoritative diagnosis and treatment standards are urgently needed. Standard FOLFIRINOX or gemcitabine-based combination chemotherapy can slightly improve overall survival, but most patients die from disease progression (41–43). In recent years, preoperative neoadjuvant therapy for PDAC has gained wide acceptance (44–46). Studies have reported that preoperative neoadjuvant radiotherapy and chemotherapy can improve the resectability of locally advanced PDAC (47, 48). In this study, patients who underwent surgery, chemotherapy, and radiotherapy had a relatively lower probability of PDACSD, and their sdHR (95% CI) values were 0.518 (0.469–0.573), 0.733 (0.678–0.793), and 0.888 (0.810–0.973), respectively. Targeted therapy has developed rapidly in the treatment of breast and ovarian cancer, enabling treatment in a precise manner (49, 50). However, for PDAC, targeted therapy has been slow to develop, and the only approved precision therapy drug, erlotinib, has only marginally improved survival (51, 52). Not only that, but immunotherapy has a limited role in PDAC (53). Humans still have a long way to go in the treatment of PDAC.
The median time interval (IQR) between diagnosis of FPC and spPDAC was 55 (28, 89) months. To avoid the possibility of synchronous transfer, we only selected samples with time intervals greater than 6 months for study. The shortest and longest intervals were 7 months and 180 months, respectively. Our study found that the longer the interval (month), the higher the risk of developing PDACSD in spPDAC patients (p = 0.016).
Due to the lack of reliable criteria for evaluating spPDAC, clinicians often make empirical judgments based on imaging studies, TNM staging, and the patient's physical condition (54, 55). Through multivariate Cox regression analysis, He and his colleagues (25) identified age (p < 0.001), sex (p < 0.001), race (p < 0.001), tumor size (p < 0.001), prior history of cancer (p < 0.001), SEER stage (p < 0.001), grade (p < 0.001), surgery (p < 0.001), chemotherapy (p < 0.001), and radiotherapy (p < 0.001) were the risk factors affecting the overall survival of patients. In competing risk events, He et al. used traditional analytical methods (Cox regression analysis and Kaplan–Meier analysis), which tended to overestimate the probability of PDACSD, creating a competing risk bias. This kind of research bias is not uncommon, and one study found that this error may occur in 46% of the literature (22). Patients with spPDAC may die from other causes such as traffic accidents and cardiovascular disease. For these causes of death, spPDAC did not contribute, and these causes of death could not be combined with PDACSD to analyze risk factors for spPDAC. Therefore, in competing risk events, the Fine and Gray proportional sub-distributed hazard method is advocated (56, 57). To the best of our knowledge, researchers have used the Fine and Gray proportional subdistributed hazard method to construct competing risk models for multiple primary cancers associated with cervical cancer (58) and colorectal cancer (59). However, competing risk models for spPDAC cancer-specific mortality have not yet emerged. Hopefully, our results can fill this gap.
Although we investigated risk factors associated with PDACSD and established a good prognostic prediction model for spPDAC, there are inevitably some deficiencies. First, this is a retrospective study, and some selection differences cannot be avoided, which may lead to specific biases. Second, the SEER database lacks some key information related to PDACSD, such as smoking, alcohol consumption, obesity, type II diabetes, tumor markers, surgical methods, chemoradiotherapy regimens, immunotherapy, and so on. (60–62). This prevents us from analyzing patient information comprehensively. Finally, our model needs to be validated in a large-scale prospective study.
In conclusion, we analyzed the impact of previous cancer on the prognosis of spPDAC, screened risk factors for PDACSD in spPDAC patients, and constructed a competing risk model. The model has good accuracy and discriminative ability, which can assist doctors and patients in clinical decision-making.
Publicly available datasets were analyzed in this study. This data can be found here: All data used in this work can be acquired from the SEER database (SEER: https://seer.cancer.gov/). To download SEER*Stat, visit http://seer.cancer.gov/seerstat/download. The author Lishan Song has gotten access to the SEER database (accession number:23514-Nov2020). Select the following datasets: Incidence - SEER Research Plus Data, 18 Registries (excl AK), Nov 2020 Sub (2000–2018)—Linked To County Attributes—Total US, 1969–2019 Counties, National Cancer Institute, DCCPS, Surveillance Research Program, released April 2021, based on the November 2020 submission.
LS, CX, TZ, and XL contributed to the conception and design of the study. LS and CX organized the database. LS, CX, ZS, and SH performed the statistical analysis. LS wrote the first draft of the manuscript. LS, BC, HT, GW and SC wrote sections of the manuscript. All authors contributed to manuscript revision, read, and approved the submitted version. All authors contributed to the article and approved the submitted version.
This study was funded by Henan Province Medical Science and Technology Research Program Joint Construction Project (LHGJ20200473), Clinical study of neoadjuvant chemotherapy combined with nanometer ablation in the treatment of locally advanced pancreatic cancer (LHGJ20200473) and Beijing Kangmeng Charity Foundation-Anlotinib hydrochloride clinical study on biliary malignant tumors (KYBX2022000163).
The authors declare that the research was conducted in the absence of any commercial or financial relationships that could be construed as a potential conflict of interest.
All claims expressed in this article are solely those of the authors and do not necessarily represent those of their affiliated organizations, or those of the publisher, the editors and the reviewers. Any product that may be evaluated in this article, or claim that may be made by its manufacturer, is not guaranteed or endorsed by the publisher.
1. Warren S. Multiple primary malignant tumor. A surgery of the literature and statistical study. Am J Cancer. (1932) 16:1358–414. doi: 10.1016/0016-5085(87)90440-9
2. Miller KD, Siegel RL, Lin CC, Mariotto AB, Kramer JL, Rowland JH, et al. Cancer treatment and survivorship statistics, 2016. CA Cancer J Clin. (2016) 66(4):271–89. doi: 10.3322/caac.21349
3. DeSantis CE, Lin CC, Mariotto AB, Siegel RL, Stein KD, Kramer JL, et al. Cancer treatment and survivorship statistics, 2014. CA Cancer J Clin. (2014) 64(4):252–71. doi: 10.3322/caac.21235
4. Howlader N, Noone AM, Krapcho M, Miller D, Bishop K, Altekruse SF, et al. (eds). SEER Cancer Statistics Review, 1975–2013. Bethesda, MD: National Cancer Institute. (2016). https://seer.cancer.gov/archive/csr/1975_2013/, based on November 2015 SEER data submission, posted to the SEER web site, April 2016.
5. Ryerson A, Eheman C, Altekruse S, Ward J, Jemal A, Sherman R, et al. Annual report to the nation on the Status of cancer, 1975–2012, featuring the increasing incidence of liver cancer. Cancer. (2016) 122(9):1312–37. doi: 10.1002/cncr.29936
6. Sung H, Hyun N, Leach C, Yabroff K, Jemal AJJ. Association of first primary cancer with risk of subsequent primary cancer among survivors of adult-onset cancers in the United States. JAMA. (2020) 324(24):2521–35. doi: 10.1001/jama.2020.23130
7. Zang Y, Qi F, Cheng Y, Xia T, Xiao R, Li X, et al. Survival outcomes in prostate cancer patients with a prior cancer. Transl Androl Urol. (2021) 10(2):741–53. doi: 10.21037/tau-20-897
8. Park JY. Second primary cancer after treating gastrointestinal cancer. Korean J Gastroenterol. (2019) 74(4):193–6. doi: 10.4166/kjg.2019.74.4.193
9. Ko KH, Huang HK, Chen YI, Chang H, Tsai WC, Huang TW. Surgical outcomes of second primary lung cancer after the extrapulmonary malignancy. J Cancer Res Clin Oncol. (2020) 146(12):3323–32. doi: 10.1007/s00432-020-03310-x
10. Rombouts AJM, Hugen N, Elferink MAG, Poortmans PMP, Nagtegaal ID, de Wilt JHW. Increased risk for second primary rectal cancer after pelvic radiation therapy. Eur J Cancer. (2020) 124:142–51. doi: 10.1016/j.ejca.2019.10.022
11. Nandy N, Dasanu CA. Incidence of second primary malignancies in patients with esophageal cancer: a comprehensive review. Curr Med Res Opin. (2013) 29(9):1055–65. doi: 10.1185/03007995.2013.816276
12. Bray F, Ferlay J, Soerjomataram I, Siegel RL, Torre LA, Jemal A. Global cancer statistics 2018: GLOBOCAN estimates of incidence and mortality worldwide for 36 cancers in 185 countries. CA Cancer J Clin. (2018) 68(6):394–424. doi: 10.3322/caac.21492
13. Mizrahi JD, Surana R, Valle JW, Shroff RT. Pancreatic cancer. Lancet. (2020) 395(10242):2008–20. doi: 10.1016/s0140-6736(20)30974-0
14. Amin S, McBride RB, Kline JK, Mitchel EB, Lucas AL, Neugut AI, et al. Incidence of subsequent pancreatic adenocarcinoma in patients with a history of nonpancreatic primary cancers. Cancer. (2012) 118(5):1244–51. doi: 10.1002/cncr.26414
15. Shen M, Boffetta P, Olsen JH, Andersen A, Hemminki K, Pukkala E, et al. A pooled analysis of second primary pancreatic cancer. Am J Epidemiol. (2006) 163(6):502–11. doi: 10.1093/aje/kwj073
16. Ahn H, Kang T, Swan H, Kang M, Kim N, Kim H, et al. Incidence and mortality rates of second pancreatic cancer among survivors of digestive cancers: a nationwide population-based study. Pancreas. (2019) 48(3):412–9. doi: 10.1097/mpa.0000000000001254
17. Rahimi E, Batra S, Thosani N, Singh H, Guha S. Increased incidence of second primary pancreatic cancer in patients with prior colorectal cancer: a population-based US study. Dig Dis Sci. (2016) 61(6):1652–60. doi: 10.1007/s10620-016-4170-x
18. Surveillance E, and End Results (SEER) Program (www.seer.cancer.gov) SEER*Stat Database: Incidence - SEER Research Plus Data, 18 Registries (excl AK), Nov 2020 Sub (2000-2018) - Linked To County Attributes - Total U.S., 1969-2019 Counties, National Cancer Institute, DCCPS, Surveillance Research Program, released April 2021, based on the November 2020 submission.
19. Fritz APC, Jack A, Shanmugaratnam K, Sobin L, Parkin D, Whelan S. editors. International classification of diseases for oncology. 3rd ed. Geneva, Switzerland: World Health Organization (2013).
20. Shi S, Hua J, Liang C, Meng Q, Liang D, Xu J, et al. Proposed modification of the 8th edition of the AJCC staging system for pancreatic ductal adenocarcinoma. Ann Surg. (2019) 269(5):944–50. doi: 10.1097/sla.0000000000002668
21. Ansari D, Bauden M, Bergström S, Rylance R, Marko-Varga G, Andersson R. Relationship between tumour size and outcome in pancreatic ductal adenocarcinoma. Br J Surg. (2017) 104(5):600–7. doi: 10.1002/bjs.10471
22. Fine JP, Gray RJ. A proportional hazards model for the subdistribution of a competing risk. Publ Am Stat Assoc. (1999) 94(446):496–509. doi: 10.1080/01621459.1999.10474144
23. Haller B, Schmidt G, Ulm K. Applying competing risks regression models: an overview. Lifetime Data Anal. (2013) 19(1):33–58. doi: 10.1007/s10985-012-9230-8
24. Vickers AJ, Cronin AM, Elkin EB, Gonen M. Extensions to decision curve analysis, a novel method for evaluating diagnostic tests, prediction models and molecular markers. BMC Med Inform Decis Mak. (2008) 8(1):53. doi: 10.1186/1472-6947-8-53
25. He X, Li Y, Su T, Lai S, Wu W, Chen L, et al. The impact of a history of cancer on pancreatic ductal adenocarcinoma survival. United European Gastroenterol J. (2018) 6(6):888–94. doi: 10.1177/2050640618765505
26. Sung H, Ferlay J, Siegel RL, Laversanne M, Soerjomataram I, Jemal A, et al. Global cancer statistics 2020: GLOBOCAN estimates of incidence and mortality worldwide for 36 cancers in 185 countries. CA Cancer J Clin. (2021) 71(3):209–49. doi: 10.3322/caac.21660
27. Siegel DA, O’Neil ME, Richards TB, Dowling NF, Weir HK. Prostate cancer incidence and survival, by stage and race/ethnicity - United States, 2001–2017. MMWR Morb Mortal Wkly Rep. (2020) 69(41):1473–80. doi: 10.15585/mmwr.mm6941a1
28. Jo JH, Cho IR, Jung JH, Lee HS, Chung MJ, Bang S, et al. Clinical characteristics of second primary pancreatic cancer. PLoS One. (2017) 12(6):e0179784. doi: 10.1371/journal.pone.0179784
29. Liszka L, Pajak J, Mrowiec S, Zielinska-Pajak E, Lampe P, Golka D. Age distribution patterns of patients with conventional ductal adenocarcinoma of the pancreas. A single-institution study of 580 cases re-evaluated using current histopathological diagnostic criteria. Pol J Pathol. (2010) 61(2):65. PMID: 20924989
30. Donin N, Filson C, Drakaki A, Tan HJ, Castillo A, Kwan L, et al. Risk of second primary malignancies among cancer survivors in the United States, 1992 through 2008. Cancer. (2016) 122(19):3075–86. doi: 10.1002/cncr.30164
32. Siegel RL, Miller KD, Jemal A. Cancer statistics, 2018. A Cancer J Clin. (2018) 68(1)7–30. doi: 10.3322/caac.21442
33. Rahib L, Smith BD, Aizenberg R, Rosenzweig AB, Fleshman JM, Matrisian LM. Projecting cancer incidence and deaths to 2030: the unexpected burden of thyroid, liver, and pancreas cancers in the United States. Cancer Res. (2014) 74(11):2913–21. doi: 10.1158/0008-5472.Can-14-0155
35. Ryan DP, Hong TS, Bardeesy N. Pancreatic adenocarcinoma. N Engl J Med. (2014) 371(11):1039–49. doi: 10.1056/NEJMra1404198
36. Pancreatic Cancer Committee of Chinese Anticancer Association. [Comprehensive guidelines for the diagnosis and treatment of pancreatic cancer (2020 version)]. Zhonghua Wai Ke Za Zhi. (2021) 59(2):81–100. doi: 10.3760/cma.j.cn112139-20201113-00794
37. Tsai S, Evans DB. Therapeutic advances in localized pancreatic cancer. JAMA Surg. (2016) 151(9):862–8. doi: 10.1001/jamasurg.2016.1113
38. Murray L, Henry A, Hoskin P, Siebert FA, Venselaar J. Second primary cancers after radiation for prostate cancer: a systematic review of the clinical data and impact of treatment technique. Radiother Oncol. (2014) 110(2):213–28. doi: 10.1016/j.radonc.2013.12.012
39. Bae MK, Byun CS, Lee CY, Lee JG, Park IK, Kim DJ, et al. The role of surgical treatment in second primary lung cancer. Ann Thorac Surg. (2011) 92(1):256–62. doi: 10.1016/j.athoracsur.2011.02.034
40. Ono T, Nakamura T, Azami Y, Suzuki M, Wada H, Kikuchi Y, et al. Proton beam therapy is a safe and feasible treatment for patients with second primary lung cancer after lung resection. Thorac Cancer. (2019) 10(2):289–95. doi: 10.1111/1759-7714.12949
41. Conroy T, Hammel P, Hebbar M, Ben Abdelghani M, Wei AC, Raoul JL, et al. FOLFIRINOX Or gemcitabine as adjuvant therapy for pancreatic cancer. N Engl J Med. (2018) 379(25):2395–406. doi: 10.1056/NEJMoa1809775
42. Dhir M, Zenati MS, Hamad A, Singhi AD, Bahary N, Hogg ME, et al. FOLFIRINOX Versus gemcitabine/nab-paclitaxel for neoadjuvant treatment of resectable and borderline resectable pancreatic head adenocarcinoma. Ann Surg Oncol. (2018) 25(7):1896–903. doi: 10.1245/s10434-018-6512-8
43. Von Hoff DD, Ervin T, Arena FP, Chiorean EG, Infante J, Moore M, et al. Increased survival in pancreatic cancer with nab-paclitaxel plus gemcitabine. N Engl J Med. (2013) 369(18):1691–703. doi: 10.1056/NEJMoa1304369
44. Youngwirth LM, Nussbaum DP, Thomas S, Adam MA, Blazer DG 3rd, Roman SA, et al. Nationwide trends and outcomes associated with neoadjuvant therapy in pancreatic cancer: an analysis of 18,243 patients. J Surg Oncol. (2017) 116(2):127–32. doi: 10.1002/jso.24630
45. Hackert T, Sachsenmaier M, Hinz U, Schneider L, Michalski CW, Springfeld C, et al. Locally advanced pancreatic cancer: neoadjuvant therapy with folfirinox results in resectability in 60% of the patients. Ann Surg. (2016) 264(3):457–63. doi: 10.1097/sla.0000000000001850
46. Chung SY, Chang JS, Lee BM, Kim KH, Lee KJ, Seong J. Dose escalation in locally advanced pancreatic cancer patients receiving chemoradiotherapy. Radiother Oncol. (2017) 123(3):438–45. doi: 10.1016/j.radonc.2017.04.010
47. Moss RA, Lee C. Current and emerging therapies for the treatment of pancreatic cancer. Onco Targets Ther. (2010) 3:111–27. doi: 10.2147/ott.s7203
48. Greenblatt DY, Kelly KJ, Rajamanickam V, Wan Y, Hanson T, Rettammel R, et al. Preoperative factors predict perioperative morbidity and mortality after pancreaticoduodenectomy. Ann Surg Oncol. (2011) 18(8):2126–35. doi: 10.1245/s10434-011-1594-6
49. Lev S. Targeted therapy and drug resistance in triple-negative breast cancer: the EGFR axis. Biochem Soc Trans. (2020) 48(2):657–65. doi: 10.1042/bst20191055
50. Guan LY, Lu Y. New developments in molecular targeted therapy of ovarian cancer. Discov Med. (2018) 26(144):219–29. PMID: 30695681
51. Sinn M, Bahra M, Liersch T, Gellert K, Messmann H, Bechstein W, et al. CONKO-005: adjuvant chemotherapy with gemcitabine plus erlotinib versus gemcitabine alone in patients after R0 resection of pancreatic cancer: a multicenter randomized phase III trial. J Clin Oncol. (2017) 35(29):3330–7. doi: 10.1200/jco.2017.72.6463
52. Moore MJ, Goldstein D, Hamm J, Figer A, Hecht JR, Gallinger S, et al. Erlotinib plus gemcitabine compared with gemcitabine alone in patients with advanced pancreatic cancer: a phase III trial of the National Cancer Institute of Canada Clinical Trials Group. Am J Clin Oncol. (2007) 25(15):1960–6. doi: 10.1200/jco.2006.07.9525
53. Fan JQ, Wang MF, Chen HL, Shang D, Das JK, Song J. Current advances and outlooks in immunotherapy for pancreatic ductal adenocarcinoma. Mol Cancer. (2020) 19(1):32. doi: 10.1186/s12943-020-01151-3
54. Anderson EM, Thomassian S, Gong J, Hendifar A, Osipov A. Advances in pancreatic ductal adenocarcinoma treatment. Cancers (Basel). (2021) 13(21):5510. doi: 10.3390/cancers13215510
55. Kanno A, Masamune A, Hanada K, Kikuyama M, Kitano M. Advances in early detection of pancreatic cancer. Diagnostics (Basel). (2019) 9(1)18. doi: 10.3390/diagnostics9010018
56. Han S, Rivera GA, Cheng I, Gomez S, Plevritis SK, Wakelee H. PS01.77: risk-stratification for second primary lung cancer: topic: medical oncology. J Thorac Oncol. (2016) 11(11):S319–20. doi: 10.1016/j.jtho.2016.09.112
57. Andersen PK, Geskus RB, Witte TD, Putter H. Competing risks in epidemiology: possibilities and pitfalls. Int J Epidemiol. (2012) 3:861–70. doi: 10.1093/ije/dyr213
58. Li R, Zhang Y, Ma B, Tan K, Lynn HS, Wu Z. Survival analysis of second primary malignancies after cervical cancer using a competing risk model: implications for prevention and surveillance. Ann Transl Med. (2021) 9(3):239. doi: 10.21037/atm-20-2003
59. Jia H, Li Q, Yuan J, Sun X, Wu Z. Second primary malignancies in patients with colorectal cancer: a population-based analysis. Oncologist. (2020) 25(4):e644–50. doi: 10.1634/theoncologist.2019-0266
60. Inoue M, Iwasaki M, Otani T, Sasazuki S, Noda M, Tsugane S. Diabetes mellitus and the risk of cancer: results from a large-scale population-based cohort study in Japan. Arch Intern Med. (2006) 166(17):1871–7. doi: 10.1001/archinte.166.17.1871
61. Huxley R, Ansary-Moghaddam A, Berrington de González A, Barzi F, Woodward M. Type-II diabetes and pancreatic cancer: a meta-analysis of 36 studies. Br J Cancer. (2005) 92(11):2076–83. doi: 10.1038/sj.bjc.6602619
Keywords: second primary malignancy, SEER database, competing regression analysis, nomogram risk, pancreatic ductal adenocarcinoma
Citation: Song L, Xu C, Zhang T, Chen S, Shi Z, Hu S, Cheng B, Tong H, Wei G and Li X (2022) Development and validation of a competing risk model for second primary pancreatic ductal adenocarcinoma: A population-based study. Front. Surg. 9:934148. doi: 10.3389/fsurg.2022.934148
Received: 2 May 2022; Accepted: 22 July 2022;
Published: 30 August 2022.
Edited by:
Domenico Tamburrino, San Raffaele Hospital (IRCCS), ItalyReviewed by:
Joris Jaekers, University Hospitals Leuven, Belgium© 2022 Song, Xu, Zhang, Chen, Shi, Hu, Cheng, Tong, Wei and Li. This is an open-access article distributed under the terms of the Creative Commons Attribution License (CC BY). The use, distribution or reproduction in other forums is permitted, provided the original author(s) and the copyright owner(s) are credited and that the original publication in this journal is cited, in accordance with accepted academic practice. No use, distribution or reproduction is permitted which does not comply with these terms.
*Correspondence: Xiaoyong Li TGl4eUdEWVhXSzY0QDE2My5jb20=
†These authors have contributed equally to this work and share first authorship
Specialty Section: This article was submitted to Surgical Oncology, a section of the journal Frontiers in Surgery
Abbreviations SPM, second primary malignancies; spPDAC, second primary pancreatic ductal adenocarcinoma; pPDAC, primary pancreatic ductal adenocarcinoma; PDAC, pancreatic ductal adenocarcinoma; SEER, Surveillance, Epidemiology, and End Results; KM, Kaplan–Meier; PDACSD, pancreatic ductal adenocarcinoma-specific death; DFOC, death from other causes; CIF, cumulative incidence function; C-index, concordance index; AUC, the area under the curve; DCA, decision curve analysis; FPC, first-present cancer; IQR, interquartile range; SD, standard deviation.
Disclaimer: All claims expressed in this article are solely those of the authors and do not necessarily represent those of their affiliated organizations, or those of the publisher, the editors and the reviewers. Any product that may be evaluated in this article or claim that may be made by its manufacturer is not guaranteed or endorsed by the publisher.
Research integrity at Frontiers
Learn more about the work of our research integrity team to safeguard the quality of each article we publish.