
94% of researchers rate our articles as excellent or good
Learn more about the work of our research integrity team to safeguard the quality of each article we publish.
Find out more
ORIGINAL RESEARCH article
Front. Surg., 16 June 2022
Sec. Surgical Oncology
Volume 9 - 2022 | https://doi.org/10.3389/fsurg.2022.893977
Background: Hepatocellular carcinoma (HCC) is a common abdominal cancer with poor survival outcomes. Although there is growing evidence that N7-methylguanosine (m7G) is closely associated with tumor prognosis, development, and immune response, few studies focus on this topic.
Methods: The novel m7G risk signature was constructed through the Lasso regression analysis. Its prognostic value was evaluated through a series of survival analyses and was tested in ICGC-LIRI, GSE14520, and GSE116174 cohorts. CIBERSORT, ssGSEA, and ESTIMATE methods were applied to explore the effects of the m7G risk score on tumor immune microenvironment (TIM). The GSEA method was used to evaluate the impacts of the m7G risk score on glycolysis, ferroptosis, and pyroptosis. The human protein atlas (HPA) database was used to clarify the histological expression levels of five m7G signature genes. The biofunctions of NCBP2 in hepatocellular cancer (HC) cells were confirmed through qPCR, CCK8, and transwell assays.
Results: Five m7G regulatory genes comprised the novel risk signature. The m7G risk score was identified as an independent prognostic factor of HCC and could increase the decision-making benefit of traditional prognostic models. Besides, we established a nomogram containing the clinical stage and m7G risk score to predict the survival rates of HCC patients. The prognostic value of the m7G model was successfully validated in ICGC and GSE116174 cohorts. Moreover, high m7G risk led to a decreased infiltration level of CD8+ T cells, whereas it increased the infiltration levels of Tregs and macrophages. The glycolysis and pyroptosis processes were found to be enriched in the HCC patients with high m7G risk. Finally, overexpression of NCBP2 could promote the proliferation, migration, and invasion of HC cells.
Conclusions: The m7G risk score was closely related to the prognosis, antitumor immune process, glycolysis, and malignant progression of HCC. NCBP2 has pro-oncogenic abilities, showing promise as a novel treatment target.
Hepatocellular carcinoma (HCC) is a common digestive tumor, accounting for 6% of all cancer-related deaths in the United States (1). Despite considerable advances in its diagnosis and treatment, the overall survival (OS) is still unsatisfactory. Especially in China, the region having the largest number of HCC patients in the world, the median survival of patients is commonly less than 30 months (2). Regretfully, the effects of existing therapeutic approaches are unsatisfactory. Sorafenib is the first-line option for treating advanced HCC; the median OS of patients who receive sorafenib is only 18 months (3). Nivolumab, another commonly used immune checkpoint blockade (ICB) for HCC systemic treatment, only confers HCC patients with a median OS of 15 months (4). Meanwhile, its objective response rate (ORR) is less than 20% (5). Therefore, finding novel therapeutic strategies and establishing an accurate prognostic system are imperative.
RNA epigenetic modifications have been confirmed to be closely involved in the onset and progression of multiple cancers (6). One classic example is the N6-methyladenosine (m6A) modification. Ample evidence indicates that the m6A process profoundly affects the prognosis, tumor immune microenvironment (TIM), and therapeutic effects of various cancers, including adrenocortical carcinoma (ACC) (7), pancreatic adenocarcinoma (PAAD) (8, 9), lung adenocarcinoma (LADC) (10), HCC (11), etc. Unfortunately, extremely limiting research focuses on the N7-methylguanosine (m7G), which is another one of the most prevalent RNA modifications. m7G refers to the modification of the seventh N of RNA guanine with a methyl group (12). Mechanistically, this guanosine methylation at the 5′ cap of RNA relies on the catalyzation of METTL1 and its co-factor WD repeat domain 4 (WDR4) (13). Since m7G modification can improve the stability of mRNA, this process is speculated to mediate several biological functions through altering the expression levels of related genes (14, 15). Recently, Dai et al. found that m7G RNA modification could enhance oncogenic mRNA translation and promote intrahepatic cholangiocarcinoma (ICC) progression (16). Therefore, m7G, an unfamiliar epigenetic topic, has great potential to advance the paradigm of HCC treatment and clinical assessment.
To the best of our knowledge, no research has investigated the associations of m7G regulatory genes with the prognosis and immune response of cancers. Therefore, we constructed a novel m7G risk signature for the first time through the Lasso regression analysis. The roles of m7G risk score in prognosis, progression, TIM, and glycolysis metabolism of HCC were explored. Moreover, the biofunctions of NCBP2, a critical member of the m7G risk signature, were also confirmed through the experiments in vitro. It is conceivable that our findings could bring new insights into the treatment and prognosis assessment of HCC.
The clinical information and gene expression data were derived from TCGA (https://portal.gdc.cancer.gov/), ICGC (https://dcc.icgc.org/releases), and GEO (https://www.ncbi.nlm.nih.gov/geo/) databases. Given that the number of normal liver samples in TCGA (n = 50) did not well match that of HCC samples, we used 110 normal liver tissue samples from the GTEx database (https://xenabrowser.net/datapages/) to solve this shortage. The enrolled TCGA samples should provide both the gene expression matrix and the corresponding clinical information. Besides, 28 TCGA samples were excluded owing to their too short follow-up (less than 30 days). To minimize the batch effect between different datasets, we used the “ComBat” algorithm to correct it (17), which was implemented by the SVA package in R software. The normalized batch-corrected plots of TCGA-LIHC, ICGC-LIRI, GSE14520, and GSE116174 cohorts are shown in Supplementary Figure S1. Transcriptome data were standardized by log2 (FPKM + 1) transformation. The clinical characteristics of TCGA, ICGC, and GEO cohorts are presented in Supplementary Tables S1, S2.
In the present study, we established an m7G gene set using the Molecular Signatures Database (MSigDB) (https://www.gsea-msigdb.org/gsea/msigdb/). As mentioned in some m7G-related reviews, this RNA modification refers to the methylation of the seventh guanosine at the 5′ end of RNA. In this context, we screened out three core m7G-related gene sets from the MSigDB database, including “GOMF RNA 7-Methylguansosine Cap Binding,” “GOMF m7G 5-PPPN Diphosphatase Activity,” and “GOMF RNA Cap Binding.” The detailed description of these gene sets is shown in Supplementary Table S3. Using these three MSigDB gene sets, we constructed a comprehensive m7G gene set, whose gene members are presented in Supplementary Table S4.
The m7G differentially expressed genes (DEGs) were screened out by the “Limma” package in R software (Ver. 3.6.3). The threshold for the screening criterion was set at adjusted P-value <0.05 and the absolute value of log2FC ≥ 0.58 (1.5-fold difference in gene expression). The m7G regulatory genes with prognostic values were identified by cox univariate regression analysis. The intersection part between DEGs and prognostic genes was selected by the Venn diagram. Finally, these intersection genes were applied to construct a novel m7G risk signature through the Lasso regression analysis.
The m7G risk score of each HCC patient was calculated in terms of the novel risk signature. The Cutoff Finder online tool (http://molpath.charite.de/cutoff) was used to determine the optimal cutoff value of the m7G risk score (18). According to the value, patients were divided into high- and low-risk groups. Survival differences between different risk groups were compared based on the Kaplan–Meier method. Cox univariate and multivariate analyses were applied to identify the independent prognostic factors. The predictive accuracy of the m7G risk signature was evaluated by the receiver operating characteristic curve (ROC). Decision curve analysis (DCA) was used to determine whether the m7G risk score could improve the clinical decision-making benefit of two traditional prognostic models of HCC. The traditional model A was composed of age, histological grade, and TNM staging. The traditional model B was composed of age, histological grade, and clinical stage. Except for the M1 stage (n = 4), the clinical subgroup analyses were performed to assess the application scope of the m7G risk signature. A nomogram was constructed to predict the OSR of an individual at 1, 3, and 5 years. Besides, GSE14520 (n = 221), GSE116174 (n = 64) and ICGC-LIRI (n = 221) datasets as the validation cohorts were employed to further test the prognostic value of the m7G model.
The immune abundance of 21 lymphocyte subtypes in each HCC sample was calculated using the CIBERSORT algorithm (19). The activities of 10 immune-related pathways were calculated based on the ssGSEA (single-sample gene set enrichment analysis) method (20). The ESTIMATE algorithm is an approach to quantify the immune cell admixture in tumor parenchyma and stroma, by which the tumor immune microenvironment (TIM) could be depicted to some extent (21). The scores of stromal, immune, and ESTIMATE in different risk groups were calculated.
GSEA (Gene Set Enrichment Analysis) was utilized to analyze the impacts of m7G risk levels on the glycolysis process, ferroptosis, and pyroptosis. The used gene sets were obtained from the MsigDB database, including “GO Glycolytic Process,” “Hallmark Glycolysis,” “Reactome Pyroptosis,” and “WP Ferroptosis.” Phenotype labels were set as high-m7G risk samples versus low-m7G risk ones. The number of permutations was set as 1,000. There was no collapse in gene symbol. The descriptions of these gene sets are given in Supplementary Table S5.
The human protein atlas (HPA) database exhibits the landscape of cancer proteomes in 32 different tissues and organs (https://www.proteinatlas.org/) (22). Using the HPA database, we confirmed the histological expression levels of m7G signature genes between normal liver and HCC tissues.
Two human hepatocellular cancer cell lines (HepG2 and Huh-7) were purchased from Procell Life Science&Technology Company (Wuhan, China). One normal liver cell line (THLE-3) was purchased from Otwo Biotechnology (Guangzhou, China). HepG2 and THLE-3 cells were both cultured in MEM (minimum essential medium) containing 10% FBS (fetal bovine serum) and 1% P/S (penicillin/streptomycin) (Procell, Wuhan, China). Huh-7 cells were cultured in DMEM (Dulbecco’s modified Eagle’s medium) containing 10% FBS and 1% P/S (Procell, Wuhan, China). Specific siRNA and amplification plasmids were designed by HanHeng Biotechnology (Shanghai, China). Lentiviruses (HanHeng Biotechnology, Shanghai, China) are used to transfect liver cancer (LC) cells.
We collected 15 pairs of HCC and adjacent normal tissues from the Third Affiliated Hospital of Chongqing Medical University. qPCR and western blot tests were employed to confirm the differential expression of NCBP2 in HCC specimens. We received informed consent from all patients. The study protocol was approved by the Ethics Committees of the Third Affiliated Hospital of Chongqing Medical University.
Total RNA was extracted using TRIzol reagent (Thermo Fisher Scientific, Waltham, MA, USA). Reverse transcription (RT) was performed using the PrimeScript RT reagent kit with gDNA eraser (Takara, Japan). Transcript levels were measured using the SYBR-Green PCR reagent (Takara, Japan). Then, RT-qPCR was performed on an ABI Prism 7900 sequence detection system. GAPDH was used as an internal reference. mRNA expression was calculated based on the 2−ΔΔCT method. The primer list is presented in Supplementary Table S6.
The detailed manipulations were similar to those previously described (23). After washing with PBS twice, transfected cells were lysed on ice by RIPA buffer (Beyotime, China). Centrifugation was performed at 12,000 rpm for 4 min. Then, the supernatant was collected and moved into an EP tube. The protein concentration was measured by the BCA kit (Phygene Life Sciences Company, Fuzhou, China). Sample absorbance at 562 nm was measured after 30 min incubation with the BCA working reagent. The protein concentration of each sample was calculated according to the standard curve. Sample proteins were separated by 10% SDS-PAGE. After electrophoresis, protein samples were transferred to PVDF membranes (BestBio, Shanghai, China). The PVDF membranes were blocked by 5% skim milk at 37°C for 2 h and then were washed with TBST buffer (BIOSIC, Nanjing, China) three times. The treated membranes were incubated with the primary antibody overnight at 4°C. After washing again with TBST three times, the membranes were incubated with the secondary antibody. The primary and secondary antibodies were both purchased from Abcam Scientific (Shanghai, China). The primary antibodies were as follows: rabbit polyclonal anti-NCBP1 (anti-CBP80) (1:1000, ab154532) and rabbit polyclonal anti-GAPDH antibody (1:1,000, ab22555). The secondary antibody was the goat-anti rabbit IgG-HRP secondary antibody (1:2000, ab205718).
Cell counting kit-8 assays (CCK-8, Dojindo, Tokyo, Japan) were employed to evaluate the viability of HepG2 and HuH-7 cells. Transfected cells were plated into 96-well plates with a density of 5 × 10³ cells per well and incubated overnight at 37°C. At each observed time point, the cells were incubated with 10 μL of CCK-8 reagent for 2 h at 37°C. The absorbance of each well was detected at 450 nm by a spectrophotometer.
Transwell migration and invasion assays were carried out to assess the malignant behaviors of LC cells. The experiment procedure was as described in a previous study (7). Transfected cells (2 × 10⁴ per well) were placed into 24-well Transwell chambers (Corning, NY, USA). DMEM or MEM medium containing 0.1% FBS was added to upper chambers, while that with 10% FBS was added to the lower ones. After 48 h incubation, the migratory cells were fixed by paraformaldehyde and stained with 0.1% crystal violet. Cell counting was performed under a high-magnification microscope (100-fold) from five random visual fields. For invasion assays, the upper chambers were precoated with Matrigel.
The flowchart of this study is presented in Figure 1. Most of the m7G regulatory genes (73.5%, 25/34) are differentially expressed in HCC samples. Among them, NUDT4B, EIF4A1, NUDT10, EIF4E, NCBP3, and EIF4E3 were downregulated, while others were upregulated (Figure 2A). Meanwhile, 15 m7G genes were found to have abilities to affect the prognosis of HCC patients (Figure 2B). Interestingly, all these prognostic genes were risk factors for the poor prognosis. Finally, a total of 13 m7G genes were screened out to construct the risk signature (Figure 2C). Through the Lasso regression analysis (Figure 2DE), we established a novel m7G risk signature that comprised five members. The m7G risk score of each HCC patient was calculated according to the following formula (Figure 2F): m7G risk score = 0.249 * (WDR4 relative expression) + 0.334 * (EIF4E relative expression) + 0.065 * (NCBP1 relative expression) + 0.275 * (NCBP2 relative expression) + 0.011 * (NUDT1 relative expression). According to the optimal cutoff value of risk score (1.912), 442 HCC patients were divided into high- and low-risk groups. The m7G risk plots are exhibited in Supplementary Figure S2. Moreover, the m7G risk score could explain the 80.9% of the prognostic variation (Figure 1G), suggesting that the m7G risk signature had outstanding abilities to discriminate the HCC patients with different survival outcomes.
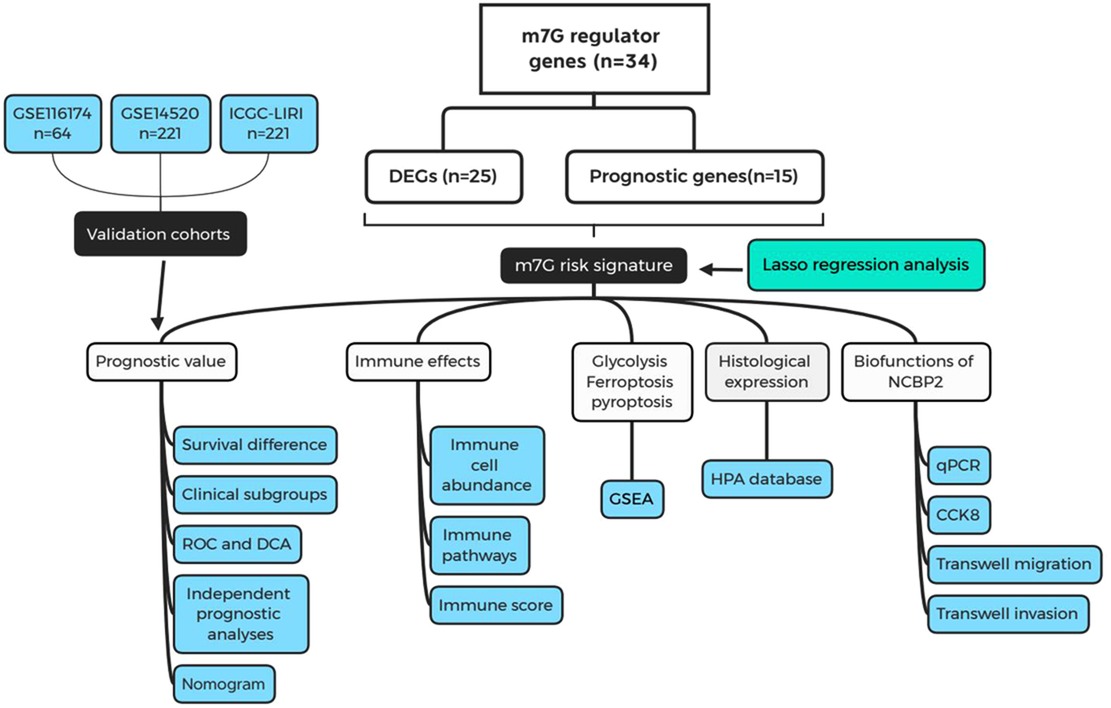
Figure 1. Flow chart of the present study. m7G, N7-methylguanosine; DEGs, differentially expressed genes; ROC, receiver operating characteristic curve; DCA, decision curve analysis; GSEA, gene set enrichment analysis; HPA, Human Protein Atlas.
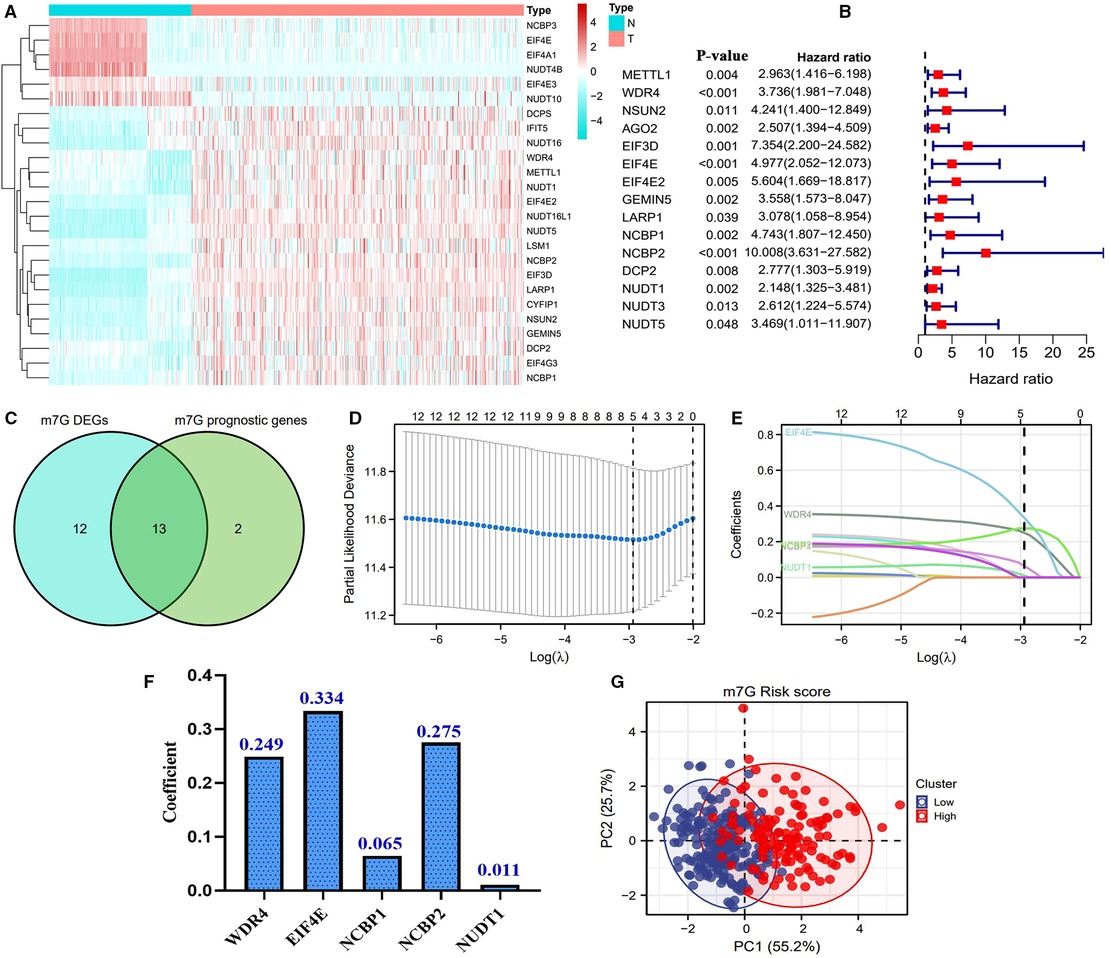
Figure 2. Construction of a novel m7G risk signature. (A) Heatmap of m7G DEGs. Blue represents downregulated expression, and red represents upregulated expression. The bar on the left side represents the expressive Z-score. (B) Identification of prognostic m7G genes through cox univariate analyses. (C) Venn plots showing the intersection of genes between DEGs and prognostic m7G genes. (D,E) Process of the Lasso regression analysis. (F) Coefficients of each member gene in the m7G risk signature. (G) PCA plots of the m7G risk score. Survival status is used as the outcome measure. The m7G risk level is used as the clustering criterion.
High m7G risk resulted in a poor prognosis (HR = 2.78, P < 0.01) (Figure 3A). In contrast to the clinicopathological features of HCC, the m7G risk score possessed an excellent predicted accuracy (AUC = 0.733) (Figure 3B). Besides, it had the highest accuracy for predicting the five-year survival rate (AUC = 0.747) (Figure 3C). Through the cox regression analyses, only the m7G risk score was identified as the independent prognostic factor of HCC (Figures 3D,E). More importantly, DCA plots revealed that the m7G risk score greatly increased the clinical-decision benefit of two traditional prognostic models (Figure 3F). Meanwhile, the combination of the m7G risk score with either TNM staging or AJCC stage could significantly improve the predicted accuracy of the previous prognostic system (Figures 3G,H vs. 3B).
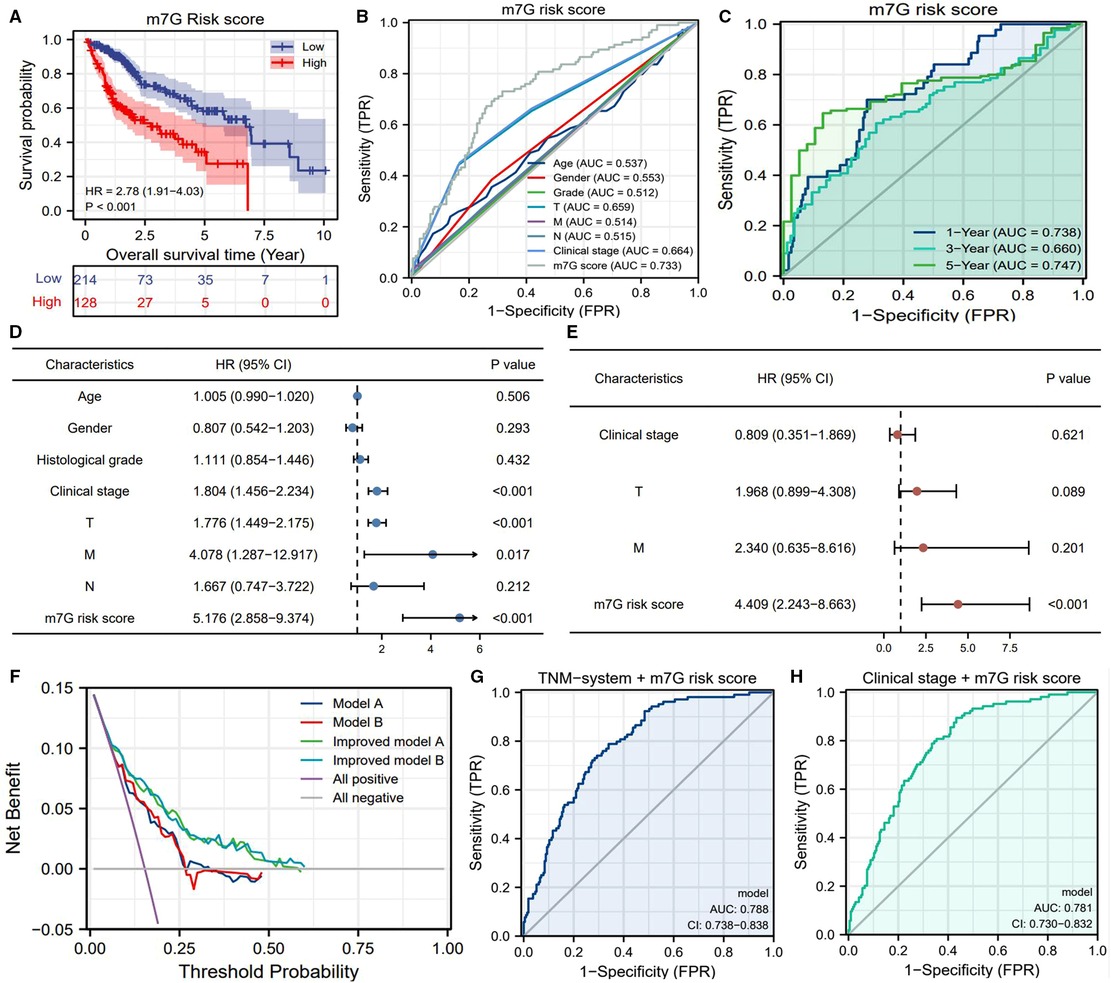
Figure 3. Prognostic value of m7G risk signature in HCC. (A) Overall survival difference between the high- and low-m7G-risk groups based on the Kaplan–Meier method. (B) ROC curves of clinicopathological features and m7G risk scores for predicting OSR. (C) Time-dependent ROC curves of the m7G risk score for predicting OSR. (D) Univariate independent prognostic analysis. (E) Multivariate independent prognostic analysis. (F) DCA results. “Model A” is the traditional prognostic model composed of age, histological grade, and TNM staging (blue line). “Model B” is the traditional prognostic model composed of age, histological grade, and clinical stage (red line). “Model C” is the improved model A with the m7G risk score (green line). “Model D” is the improved model B with the m7G risk score (light blue line). (G–H) Improvements brought by the m7G risk score in the predictive accuracy of TNM staging and clinical stage. OSR, overall survival rate; HR, hazards ratio; AUC, area under curve; TPR, true-positive rate; FPR, false-positive rate.
We also observed that the m7G risk score is equipped with a wide range of applicability. The m7G risk signature could distinguish the survival differences of HCC patients in most of the clinical subgroups (Figures 4A–I). For advancing clinical practice, we constructed a nomogram that consisted of clinical stage and m7G risk level (Figure 4J). The calibration plot showed that the predicted probabilities well-matched with actual survival rates (Figure 4K).
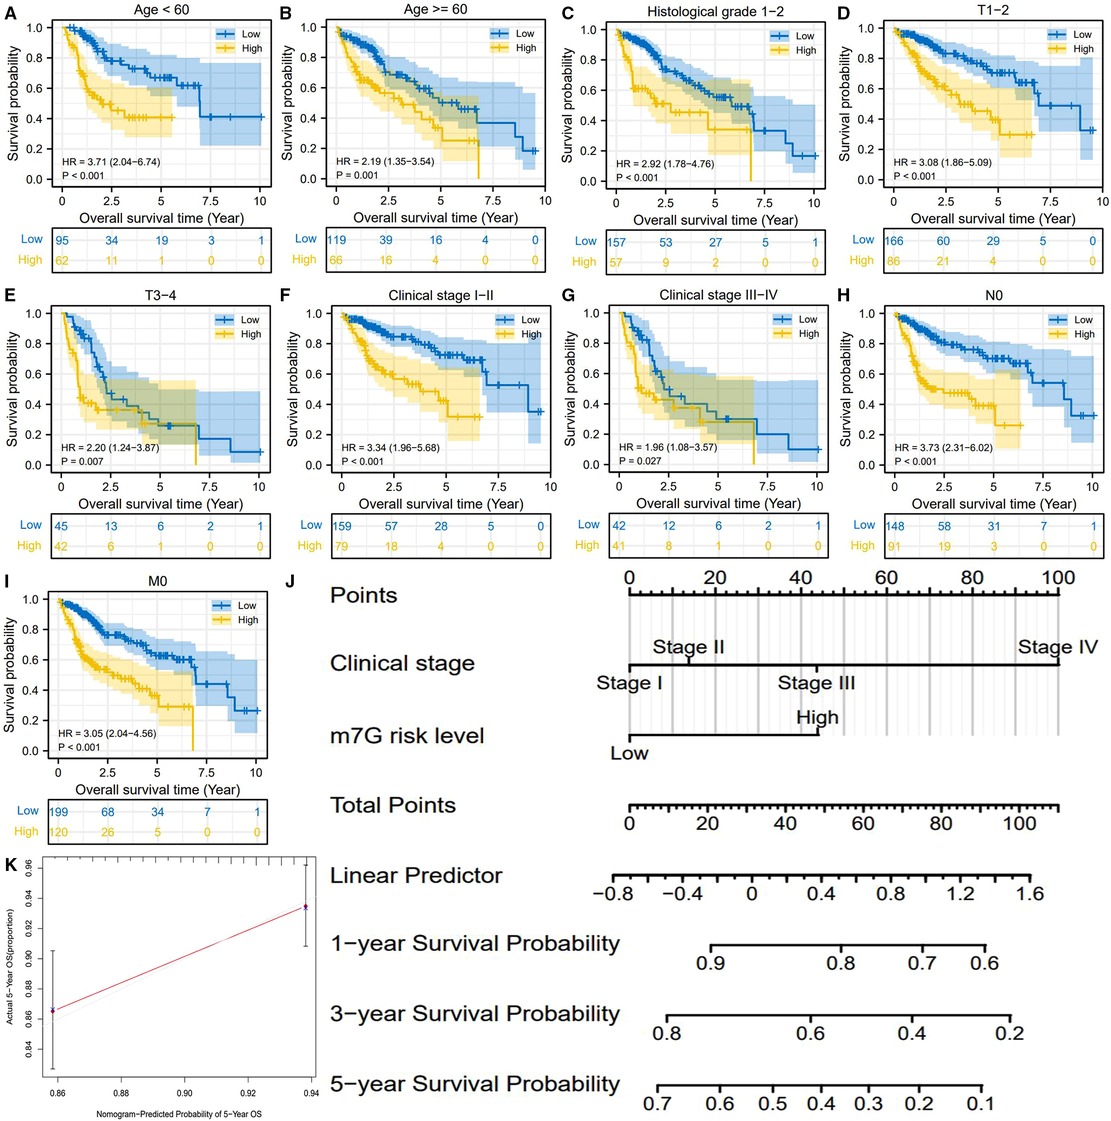
Figure 4. m7G risk signature is available for most of the clinical subgroups. (A–I) Overall survival difference between high- and low-m7G-risk groups in each clinical subgroup. (J) Nomogram is used for predicting 1-, 3-, 5-year overall survival probability of HCC patients. (K) Calibration curves for evaluating the predictive accuracy of the m7G nomogram.
Using three validation cohorts, we tested the prognostic value of the m7G risk signature. In the GSE14520 cohort, although the overall survival rates between different risk groups presented a certain difference, it was not statistically significant (HR = 1.48, P = 0.082) (Figure 5A). The predicted accuracy of the m7G risk score in GSE14520 was around 0.5 but was still higher than most HCC clinical indicators (Figure 5B). Besides, the m7G risk score in the patients with high AFP levels and advanced clinical stages was much higher than that in the patients with low AFP levels and local cases (Figure 5C,D). However, the m7G risk score was not associated with the clinical history of cirrhosis and ALT level (Figures 5E,F). Different findings were observed in GSE116174 and IGCG-LIRI cohorts. In these two cohorts, high risk conferred unfavorable survival outcomes (Figures 5G,I). Moreover, the m7G risk score was superior in predicting prognosis compared with the age and clinical stage (Figures 5H,J). Overall, the m7G risk signature was successfully validated in two external cohorts.
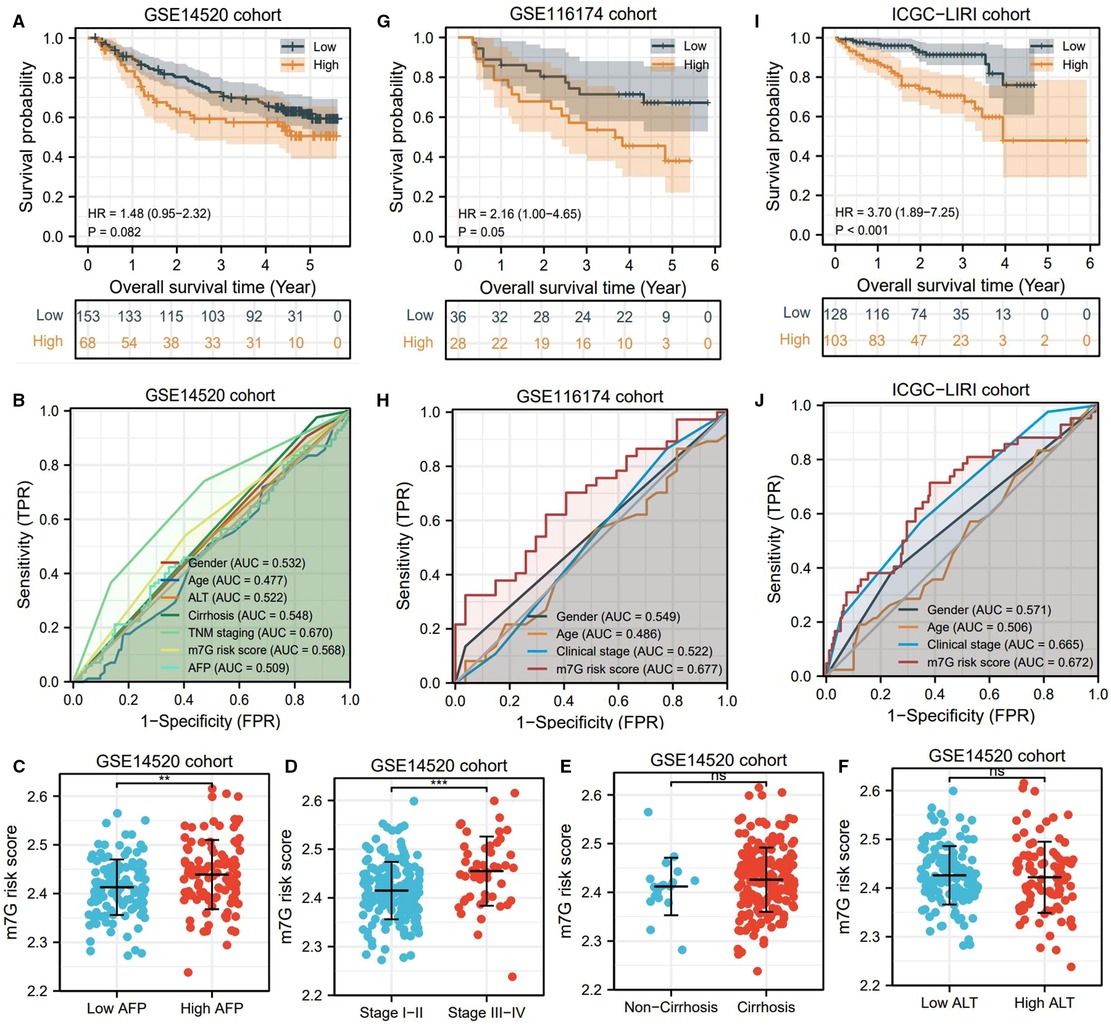
Figure 5. m7G risk signature is successfully tested in validation cohorts. (A,B) Survival difference and ROC analyses in the GSE14520 cohort. (C–F) Differences in m7G risk scores between different clinical markers in the GSE14520 cohort. (G,H) Survival differences and ROC analyses in the GSE116174 cohort. (I,J) Survival differences and ROC analyses in the ICGC-LIRI cohort. *P < 0.05, **P < 0.01, ***P < 0.001.
The infiltrating abundances of 21 immune cells in each HCC sample are presented in Supplementary Figure S3. High m7G risk significantly reduced the infiltrating levels of CD8 T cells, resting NK cells, gamma delta T cells, monocytes, M1macrophages, M2macrophages, and resting mast cells; inversely, it increased that of follicular helper T cells, regulatory T cells (Tregs), and macrophages M0 (Figure 6A). As shown in Table 1, most of the alterations of immune abundances suppressed the antitumor process and promoted the formation of the immunotolerant microenvironment. As for immune-related pathways, high m7G risk was accompanied by the low activities of cytolytic activity and type-II IFN (interferon) response (Figure 6B). ESTIMATE analyses showed that stromal and ESTIMATE scores in the high-risk group were all significantly lower than those in the low-risk group (Figure 6C), which indicated that high m7G risk was difficult to activate the antitumor immunity.
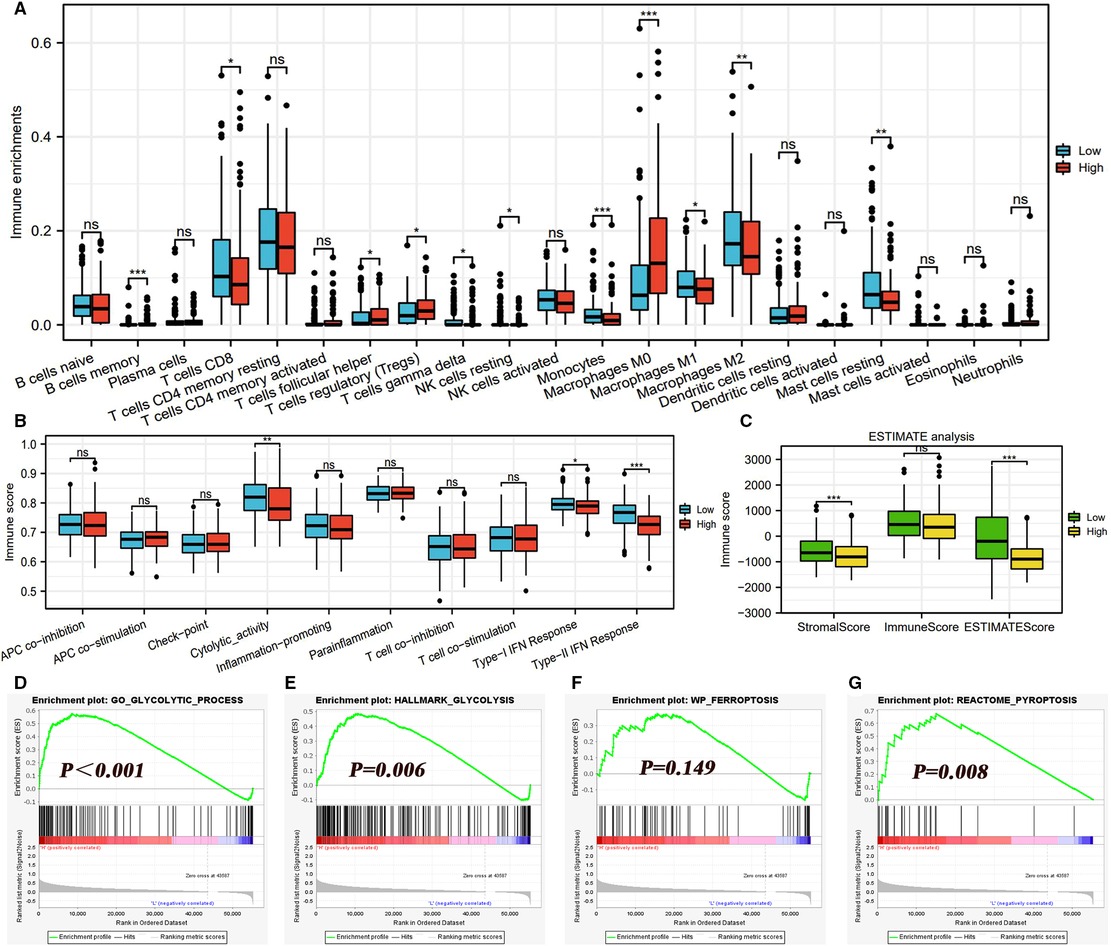
Figure 6. Effects of the m7G risk score on TIM. (A) Differences in infiltrating levels of 21 immune cells between high- and low-m7G-risk groups based on the CIBERSORT algorithm. High m7G risk is red, and low m7G risk is blue. (B) Differences in activities of 10 immune-related pathways between different m7G risk groups based on the ssGSEA algorithm. (C) Differences in immune scores between different m7G risk groups based on the ESTIMATE method. (D–G) Effects of m7G risk levels on the enrichments of glycolysis, ferroptosis, and pyroptosis based on GSEA analyses. TIM, tumor immune microenvironment; GSEA, gene set enrichment analysis; *P < 0.05, **P < 0.01, ***P < 0.001.
Glycolysis is the main hallmark of cancer metabolism. In view of this, we investigated the effects of the m7G risk score on the enrichments of the glycolytic process. As expected, glycolysis was significantly enriched in the HCC samples with high m7G risk (Figures 6D,E). Interestingly, m7G risk levels failed to affect the enrichment of ferroptosis (Figure 6F), whereas high m7G risk could stimulate pyroptosis (Figure 6G), which revealed that different patterns of programmed cell death (PCD) acted different roles in m7G-mediated HCC progression.
The mRNA expression levels of five m7G signature genes were all significantly upregulated in HCC tissues compared to normal liver tissues (Figures 7A–E). Using the HPA database, we investigated the histological expression levels of these genes (Figures 7F–J). All these signature genes presented low or nondetectable expression in normal tissues. In tumor tissues, EIF4E and NCBP2 were highly expressed, while WDR4 and NCBP1 were moderately expressed. Despite low expression of NUDT1 in tumor tissues, NUDT1 was not detectable in normal ones.
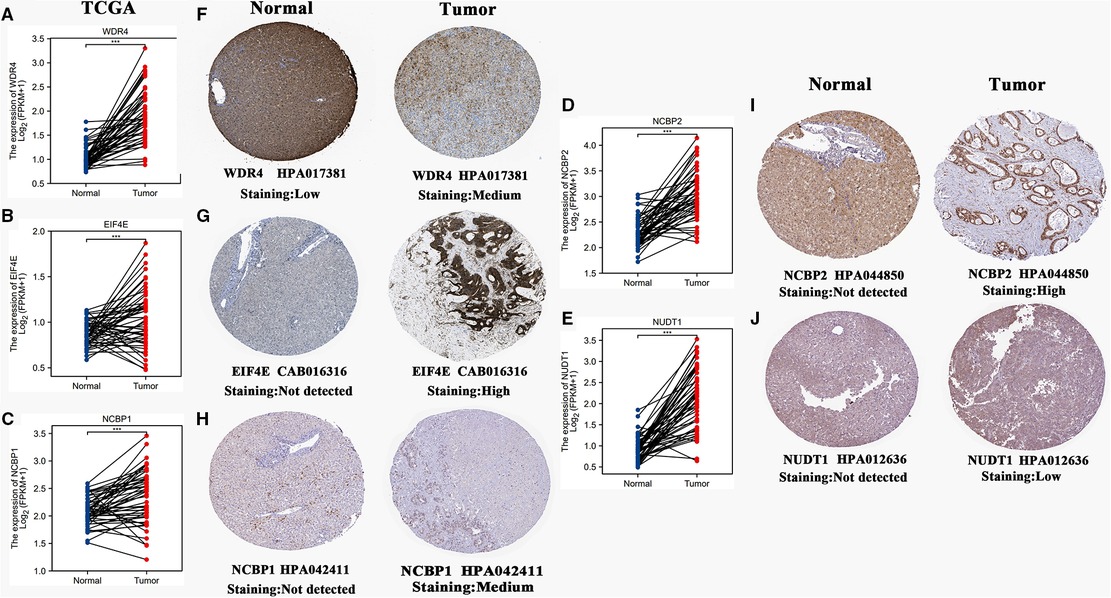
Figure 7. Histological expressions of five m7G signature genes. (A–E) Differences in mRNA expressions of 5 m7G genes between normal and HCC samples based on the TCGA-LIHC cohort. (F–J) Differences in histological expressions of 5 m7G genes between normal and HCC tissues based on the HPA database. The top of the figure indicates the category of the tissue specimen. The name of the m7G signature gene, the antibody type, and the staining intensity are listed at the bottom of each image. *P < 0.05, **P < 0.01, ***P < 0.001.
As shown in Table 2, there have been several studies that probed into the roles of m7G signature genes in multiple cancers. However, the biofunctions of NCBP2 in HCC remain elusive. In this context, NCBP2 was selected for further investigation. We first detected the NCBP2 expression in clinical specimens through RT-qPCR and western blot tests. RT-qPCR results showed that the mRNA expression of NCBP2 in HCC tissues was significantly higher than that in adjacent normal tissues (Figure 8A). The western blot detection on four pairs of clinical specimens also confirmed this expressive tendency. The protein expression levels of NCBP2 in tumor tissues were markedly upregulated compared to those in normal tissues (Figure 8B).
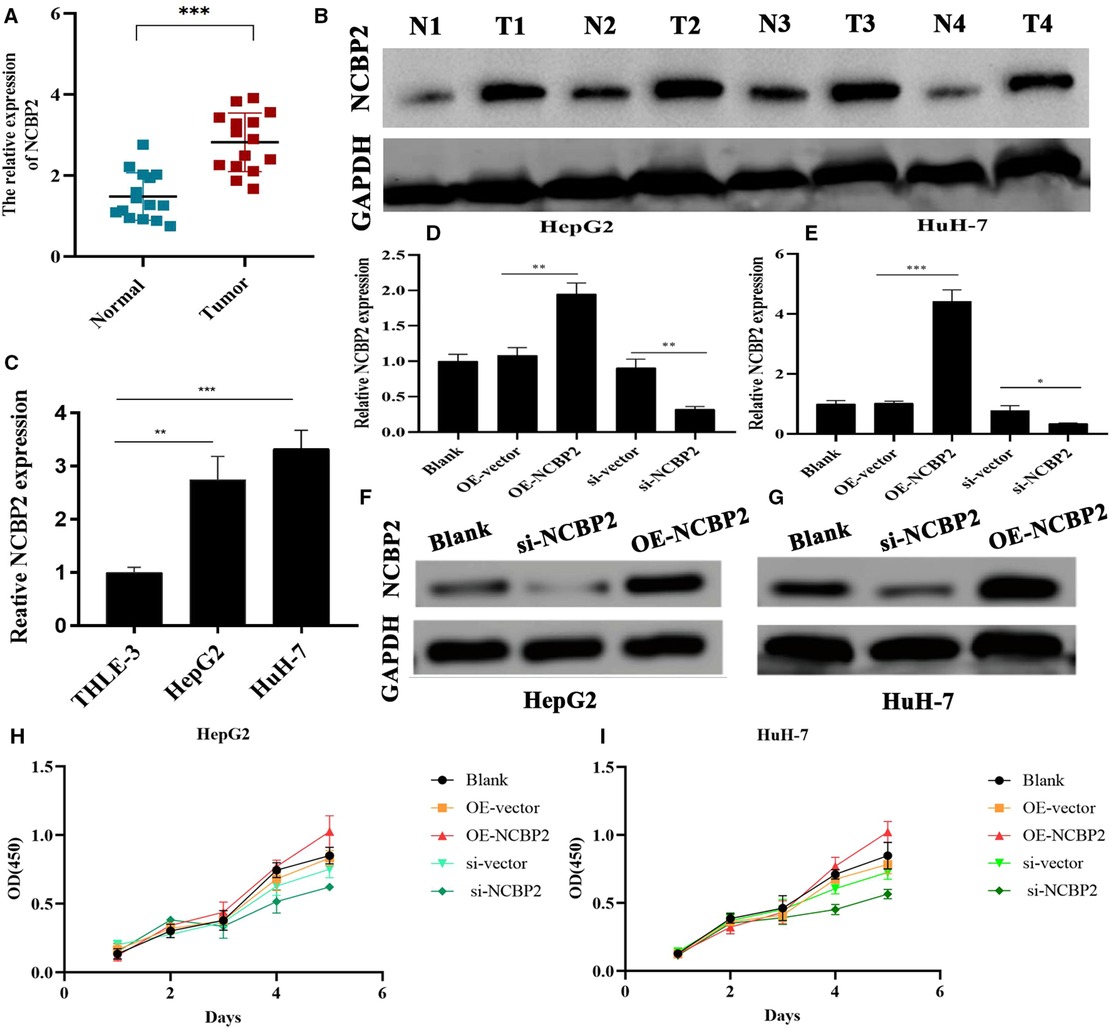
Figure 8. Overexpression of NCBP2 promotes the proliferation of LC cells. (A) RT-qPCR detection on 15 pairs of clinical samples confirmed the differential mRNA expressions of NCBP2 between adjacent normal and HCC tissues. (B) Western blot results for four pairs of clinical samples confirming the differential protein expressions of NCBP2. (C) Expressive differences of NCBP2 between normal liver and LC cells. (D,E) Transfection efficiency of si-NCBP2 and OE-NCBP2 in HepG2 and HuH-7 cells based on RT-qPCR tests. (F,G) Effects of si-NCBP2 and OE-NCBP2 on protein expression of NCBP2 in LC cells based on western blot assays. (H,I) CCK8 assays exhibited the proliferative abilities of LC cells in different groups. LC, liver cancer; si-NCBP2, small interfering RNA targeting NCBP2; OE, overexpression; *P < 0.05, **P < 0.01, ***P < 0.001.
NCBP2 was also significantly overexpressed in hepatoma cells (HepG2 and HuH-7) compared to that in normal liver epithelial cells (THLE-3) (Figure 8C). Meanwhile, we observed that si-NCBP2 and OE-NCBP2 could effectively manipulate the mRNA and protein expression levels of NCBP2 (Figures 8D–G). CCK8 assays revealed that overexpression of NCBP2 promoted the proliferation of hepatoma cells (Figures 8H,I). Inversely, silencing NCBP2 led to a decreased tendency (Figures 8H,I). Next, we applied transwell assays to evaluate the migrative and invasive abilities of hepatoma cells. Overexpression of NCBP2 was enhanced, whereas blocking NCBP2 expression suppressed the migration of hepatoma cells (Figures 9A–D). Similar alterations were observed in cellular invasive ability. Overexpression of NCBP2 increased the number of cells that penetrated Matrigel (Figures 9E–H). However, silencing NCBP2 retarded the invasive process (Figures 9E–H).
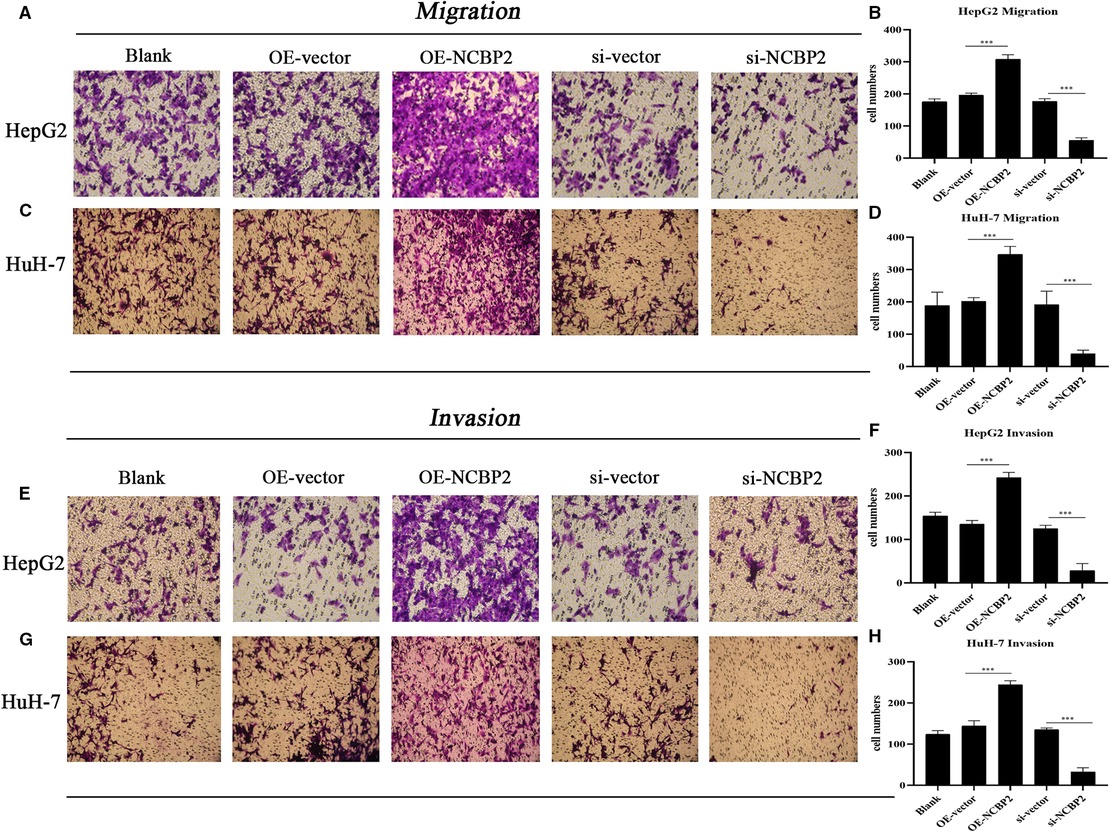
Figure 9. Overexpression of NCBP2 promotes the migration and invasion of LC cells. (A,B) Results of transwell migration assays in HepG2 and HuH-7 cells. (C,D) Migrative cell numbers in different experimental groups. (E–G) Results of transwell invasion assays in HepG2 and HuH-7 cells. (F,H) Invasive cell numbers in different experimental groups. *P < 0.05, **P < 0.01, ***P < 0.001.
Given that there have been some studies constructing signatures for HCC clinical assessments, we analyzed the similarities and differences between five existing signatures and ours (24–28) (Table 3). It was not difficult to perceive that our novel m7G model exhibited several strengths. First, we applied three validation cohorts to test the prognostic value of the m7G risk signature, which effectively assured its applicable scope due to the maximum sample size. Second, our risk signature (AUC = 0.733) presented a moderate preponderance in the predictive accuracy compared to the signatures of Wu et al. (AUC = 0.698) (28), Gao et al. (AUC = 0.614) (25), and He et al. (AUC = 0.705) (26). Although our model was not as accurate as the models of Deng et al. (AUC = 0.757) (24) and Shen et al. (AUC = 0.737) (27), the gene number of our signature is much smaller than their ones (5 vs. 19 and 10, respectively). Considering this fact, the calculation of the m7G risk score based on our model was more accessible, which was more beneficial for clinical practice. Third, other studies did not investigate the biofunctions of core signature genes in HCC through an experimental approach, which attenuated the credibility and value of the models. Nevertheless, in the present study, we ascertained the pro-oncogenic capacities of NCBP2 in HCC for the first time, providing new insights into HCC treatment. Briefly, our m7G signature was reliable and had great potential in the clinical assessment of HCC.
HCC is a common abdominal tumor with a poor prognosis, leading to more than 30,000 deaths across the United States in 2021 (1). Owing to the easy metastasis and the limited efficacy of current therapeutic approaches, finding breakthrough treatment and establishing an accurate prognostic assessment system are extremely meaningful. m7G is a pivotal RNA modification that widely exists in various types of RNA, especially in tRNA (29). Due to its stimulative effects on the stability of RNA, it has been demonstrated that the m7G process could promote cancer progression by upregulating the expressions of oncogenic genes (16, 30). In the present study, we preliminarily probed the functions of m7G regulatory genes in HCC.
Accurate prognostic evaluation has pivotal instructive significance for making therapeutic strategies. Regrettably, the current prognostic model has some defects. Beumer's team has reported that the American Joint Committee on Cancer (AJCC) system failed to operate in an external cohort (31). Meanwhile, its predictive C-index was less than 0.7 (31). Hence, utilizing the TNM or AJCC prognostic system could not completely meet the demand of accurately predicting the survival outcomes. In this work, the novel m7G risk score not only increased the clinical making-decision benefit of TNM and clinical stage models but also elevated their predicted accuracy. All of these findings highlighted that the m7G risk score was a critical supplement for the prognostic assessment of HCC.
Due to participating in the maturation and response function of immune cells, RNA methylation profoundly affects the TIM (12). For instance, m7G recognition is responsible for driving the retinoic acid-inducible gene-I (RIG-I)-mediated innate immune (32). In the current study, we confirmed that the m7G risk score was tightly associated with the TIM of HCC. Especially, high m7G risk obviously decreased the immune abundance of CD8+ T cells, whereas it increased that of Tregs and macrophages. As is well known, CD8+ T cells have potent abilities to eradicate tumor cells through the Fas/FasL pathway (33). However, Tregs and macrophages could make immunologic barriers against CD8+ T cell-mediated antitumor immune response (34). Therefore, high m7G risk may herald that the antitumor immune process is arrested.
Cancer progression is commonly accompanied by metabolic reprogramming. Glycolysis, also named the “Warburg effect”, acts as a core hallmark of cancer metabolism. It is now established that glycolysis contributes to tumor growth, drug resistance, and immune escape (35–37). For example, the glycolysis process was found to be remarkably upregulated in RCC samples, and its core regulatory genes PLOD1, PLOD2, and CD44 could promote the proliferation of renal cancer cells (38). Through GESA analyses, we observed that high m7G risk resulted in a similar metabolic alteration; for example, the glycolysis process was significantly enriched in the HCC samples with high m7G risk. We speculated the m7G signature gene, EIF4E, may act as the intrinsic driving force. Evidence has emerged that the mTORC1/EIF4E/HIF-1α pathway is capable of mediating glycolysis (39). Moreover, EIF4E-mediated glycolysis has been proven to be a critical link in PAAD development (40).
There has been some research to unravel the roles of some m7G signature genes in cancer progression. For example, Zeng et al. revealed that WDR4, the core subunit of the m7G functional complex, extensively affected the cancer immunity in pan cancer (41). Silencing METTL1 or WDR4 inhibits the malignant behavior of HCC cells (42). NCBP1 promotes the development of LUAD through upregulating CUL4B (43). Herein, we focused on the lesser-studied NCBP2. NCBP2 encodes a product that is a component of the nuclear cap-binding protein complex (CBC), which binds to the monomethylated 5′ cap of nascent pre-mRNA in the nucleoplasm (44). In the present study, we ascertained its tumorigenicity in HCC cells for the first time. Blocking NCBP2 markedly inhibited the proliferation, migration, and invasion of HCC cells, which indicated that NCBP2 is a potential therapeutic target for HCC.
Notably, there are several limitations to this study. First, the m7G risk signature has not been validated in a real clinical cohort. Second, we did not compare the differences in the m7G modification intensity between high- and low-m7G-risk groups. Third, the oncogenic capacities of NCBP2 have not been verified in a xenograft tumor model of nude mice. Fourth, the immune effects of NCBP2 in HCC were not confirmed by experiments in vitro. These issues warrant further research.
HCC is a common digestive tumor bringing a great health burden on patients. As one of the most common RNA modifications, m7G shows promising potential to improve cancer treatment. In view of this, we constructed a novel m7G risk signature through lasso regression analysis. The m7G risk score exhibited pivotal functions in the prognostic assessment of HCC. Meanwhile, it extremely improved the predictive performance of the TNM staging or AJCC system. Moreover, high m7G risk was detrimental to antitumor immune but increased the enrichments of glycolysis metabolism. Of note, we ascertained the cancer-promoting abilities of NCBP2 in HCC for the first time. In conclusion, these findings provide new clues for prognostic assessment and treatment of HCC.
The original contributions presented in the study are included in the article/Supplementary Material, further inquiries can be directed to the corresponding author/s
Ethical review and approval was not required for the study on human participants in accordance with the local legislation and institutional requirements. The patients/participants provided their written informed consent to participate in this study.
XQZ conceived and designed the study. KXZ, JQY, and XYL analyzed and interpreted the data. KXZ, JQY, WX, and PBZ wrote the manuscript. KXZ, JQY, XYL, WX, and PBZ conduced the in vitro experiments. KXZ, JQY, and XYL made a revised version. All authors contributed to the article and approved the submitted version.
The authors thank the “HOME for Researchers” website (https://www.home-for-researchers.com/) for its linguistic assistance. All authors thank Chongqing Medical University for its support.
The Supplementary Material for this article can be found online at: https://www.frontiersin.org/articles/10.3389/fsurg.2022.893977/full#supplementary-material.
The authors declare that the research was conducted in the absence of any commercial or financial relationships that could be construed as a potential conflict of interest.
All claims expressed in this article are solely those of the authors and do not necessarily represent those of their affiliated organizations, or those of the publisher, the editors and the reviewers. Any product that may be evaluated in this article, or claim that may be made by its manufacturer, is not guaranteed or endorsed by the publisher.
1. Siegel RL, Miller KD, Fuchs HE, Jemal A. Cancer statistics, 2021. CA Cancer J Clin. (2021) 71(1):7–33. doi: 10.3322/caac.21654
2. Yang JD, Hainaut P, Gores GJ, Amadou A, Plymoth A, Roberts LR. A global view of hepatocellular carcinoma: trends, risk, prevention and management. Nat Rev Gastroenterol Hepatol. (2019) 16(10):589–604. doi: 10.1038/s41575-019-0186-y
3. Gordan JD, Kennedy EB, Abou-Alfa GK, Beg MS, Brower ST, Gade TP, et al. Systemic therapy for advanced hepatocellular carcinoma: ASCO guideline. J Clin Oncol. (2020) 38(36):4317–45. doi: 10.1200/JCO.20.02672
4. Liu JKH, Irvine AF, Jones RL, Samson A. Immunotherapies for hepatocellular carcinoma. Cancer Med. (2022) 11(3):571–91. doi: 10.1002/cam4.4468
5. Llovet JM, Castet F, Heikenwalder M, Maini MK, Mazzaferro V, Pinato DJ, et al. Immunotherapies for hepatocellular carcinoma. Nat Rev Clin Oncol. (2022) 19(3):151–72. doi: 10.1038/s41571-021-00573-2
6. Wiener D, Schwartz S. The epitranscriptome beyond m(6)A. Nat Rev Genet. (2021) 22(2):119–31. doi: 10.1038/s41576-020-00295-8
7. Xu F, Guan Y, Ma Y, Xue L, Zhang P, Yang X, et al. Bioinformatic analyses and experimental validation of the role of m6A RNA methylation regulators in progression and prognosis of adrenocortical carcinoma. Aging (Albany NY). (2021) 13(8):11919–41. doi: 10.18632/aging.202896
8. Xu F, Zhang Z, Yuan M, Zhao Y, Zhou Y, Pei H, et al. M6A regulatory genes play an important role in the prognosis, progression and immune microenvironment of pancreatic adenocarcinoma. Cancer Invest. (2021) 39(1):39–54. doi: 10.1080/07357907.2020.1834576
9. Wang L, Zhang S, Li H, Xu Y, Wu Q, Shen J, et al. Quantification of m6A RNA methylation modulators pattern was a potential biomarker for prognosis and associated with tumor immune microenvironment of pancreatic adenocarcinoma. BMC Cancer. (2021) 21(1):876. doi: 10.1186/s12885-021-08550-9
10. Wu X, Sheng H, Wang L, Xia P, Wang Y, Yu L, et al. A five-m6A regulatory gene signature is a prognostic biomarker in lung adenocarcinoma patients. Aging (Albany NY). (2021) 13(7):10034–57. doi: 10.18632/aging.202761
11. Sivasudhan E, Blake N, Lu ZL, Meng J, Rong R. Dynamics of m6A RNA methylome on the hallmarks of hepatocellular carcinoma. Front Cell Dev Biol. (2021) 9:642443. doi: 10.3389/fcell.2021.642443
12. Zhang M, Song J, Yuan W, Zhang W, Sun Z. Roles of RNA methylation on tumor immunity and clinical implications. Front Immunol. (2021) 12:641507. doi: 10.3389/fimmu.2021.641507
13. Xie S, Chen W, Chen K, Chang Y, Yang F, Lin A, et al. Emerging roles of RNA methylation in gastrointestinal cancers. Cancer Cell Int. (2020) 20(1):585. doi: 10.1186/s12935-020-01679-w
14. Ramanathan A, Robb GB, Chan SH. mRNA capping: biological functions and applications. Nucleic Acids Res. (2016) 44(16):7511–26. doi: 10.1093/nar/gkw551
15. Zhang LS, Liu C, Ma H, Dai Q, Sun HL, Luo G, et al. Transcriptome-wide mapping of internal N(7)-methylguanosine methylome in mammalian mRNA. Mol Cell. (2019) 74(6):1304–16.e8. doi: 10.1016/j.molcel.2019.03.036
16. Dai Z, Liu H, Liao J, Huang C, Ren X, Zhu W, et al. N(7)-Methylguanosine tRNA modification enhances oncogenic mRNA translation and promotes intrahepatic cholangiocarcinoma progression. Mol Cell. (2021) 81(16):3339–55.e8. doi: 10.1016/j.molcel.2021.07.003
17. Zhang Y, Parmigiani G, Johnson WE. ComBat-seq: batch effect adjustment for RNA-seq count data. NAR Genom Bioinform. (2020) 2(3):lqaa078. doi: 10.1093/nargab/lqaa078
18. Budczies J, Klauschen F, Sinn BV, Győrffy B, Schmitt WD, Darb-Esfahani S, et al. Cutoff Finder: a comprehensive and straightforward Web application enabling rapid biomarker cutoff optimization. PLoS One. (2012) 7(12):e51862. doi: 10.1371/journal.pone.0051862
19. Chen B, Khodadoust MS, Liu CL, Newman AM, Alizadeh AA. Profiling tumor infiltrating immune cells with CIBERSORT. Methods Mol Biol. (2018) 1711:243–59. doi: 10.1007/978-1-4939-7493-1_12
20. Hänzelmann S, Castelo R, Guinney J. GSVA: gene set variation analysis for microarray and RNA-seq data. BMC Bioinformatics. (2013) 14(7):1471–2105. doi: 10.1186/1471-2105-14-7.
21. Meng Z, Ren D, Zhang K, Zhao J, Jin X, Wu H. Using ESTIMATE algorithm to establish an 8-mRNA signature prognosis prediction system and identify immunocyte infiltration-related genes in pancreatic adenocarcinoma. Aging (Albany NY). (2020) 12(6):5048–70. doi: 10.18632/aging.102931
22. Uhlén M, Fagerberg L, Hallström BM, Lindskog C, Oksvold P, Mardinoglu A, et al. Proteomics. Tissue-based map of the human proteome. Science. (2015) 347(6220):1260419. doi: 10.1126/science.1260419
23. Xu F, Wang H, Pei H, Zhang Z, Liu L, Tang L, et al. SLC1A5 prefers to play as an accomplice rather than an opponent in pancreatic adenocarcinoma. Front Cell Dev Biol. (2022) 10:800925. doi: 10.3389/fcell.2022.800925
24. Deng T, Ye Q, Jin C, Wu M, Chen K, Yang J, et al. Identification and validation of a glycolysis-associated multiomics prognostic model for hepatocellular carcinoma. Aging (Albany NY). (2021) 13(5):7481–98. doi: 10.18632/aging.202613
25. Gao W, Li L, Han X, Liu S, Li C, Yu G, et al. Comprehensive analysis of immune-related prognostic genes in the tumour microenvironment of hepatocellular carcinoma. BMC Cancer. (2021) 21(1):331. doi: 10.1186/s12885-021-08052-8
26. He D, Cai L, Huang W, Weng Q, Lin X, You M, et al. Prognostic value of fatty acid metabolism-related genes in patients with hepatocellular carcinoma. Aging (Albany NY). (2021) 13(13):17847–63. doi: 10.18632/aging.203288
27. Shen S, Wang R, Qiu H, Li C, Wang J, Xue J, et al. Development of an autophagy-based and stemness-correlated prognostic model for hepatocellular carcinoma using bulk and single-cell RNA-sequencing. Front Cell Dev Biol. (2021) 9:743910. doi: 10.3389/fcell.2021.743910
28. Wu Q, Jiang S, Cheng T, Xu M, Lu B. A novel pyroptosis-related prognostic model for hepatocellular carcinoma. Front Cell Dev Biol. (2021) 9:770301. doi: 10.3389/fcell.2021.770301
29. Tomikawa C. 7-Methylguanosine modifications in transfer RNA (tRNA). Int J Mol Sci. (2018) 19(12):4080–95. doi: 10.3390/ijms19124080
30. Orellana EA, Liu Q, Yankova E, Pirouz M, De Braekeleer E, Zhang W, et al. METTL1-mediated m(7)G modification of Arg-TCT tRNA drives oncogenic transformation. Mol Cell. (2021) 81(16):3323–38. e14. doi: 10.1016/j.molcel.2021.06.031
31. Beumer BR, Buettner S, Galjart B, van Vugt JLA, de Man RA, IJzermans JNM, et al. Systematic review and meta-analysis of validated prognostic models for resected hepatocellular carcinoma patients. Eur J Surg Oncol. (2021). 48(3):492–99. doi: 10.1016/j.ejso.2021.09.012
32. Devarkar SC, Wang C, Miller MT, Ramanathan A, Jiang F, Khan AG, et al. Structural basis for m7G recognition and 2′-O-methyl discrimination in capped RNAs by the innate immune receptor RIG-I. Proc Natl Acad Sci U S A. (2016) 113(3):596–601. doi: 10.1073/pnas.1515152113
33. Raskov H, Orhan A, Christensen JP, Gögenur I. Cytotoxic CD8(+) T cells in cancer and cancer immunotherapy. Br J Cancer. (2021) 124(2):359–67. doi: 10.1038/s41416-020-01048-4
34. Farhood B, Najafi M, Mortezaee K. CD8(+) cytotoxic T lymphocytes in cancer immunotherapy: a review. J Cell Physiol. (2019) 234(6):8509–21. doi: 10.1002/jcp.27782
35. Abbaszadeh Z, Çeşmeli S, Biray Avcı Ç. Crucial players in glycolysis: cancer progress. Gene. (2020) 726:144158. doi: 10.1016/j.gene.2019.144158
36. Tang J, Luo Y, Wu G. A glycolysis-related gene expression signature in predicting recurrence of breast cancer. Aging (Albany NY). (2020) 12(24):24983–94. doi: 10.18632/aging.103806
37. Yang X, Li X, Cheng Y, Zhou J, Shen B, Zhao L, et al. Comprehensive analysis of the glycolysis-related gene prognostic signature and immune infiltration in endometrial cancer. Front Cell Dev Biol. (2021) 9:797826. doi: 10.3389/fcell.2021.797826
38. Xu F, Guan Y, Xue L, Huang S, Gao K, Yang Z, et al. The effect of a novel glycolysis-related gene signature on progression, prognosis and immune microenvironment of renal cell carcinoma. BMC Cancer. (2020) 20(1):1207. doi: 10.1186/s12885-020-07702-7
39. Lin J, Fan L, Han Y, Guo J, Hao Z, Cao L, et al. The mTORC1/eIF4E/HIF-1α pathway mediates glycolysis to support brain hypoxia resistance in the gansu zokor, eospalax cansus. Front Physiol. (2021) 12:626240. doi: 10.3389/fphys.2021.626240
40. Ma X, Li B, Liu J, Fu Y, Luo Y. Phosphoglycerate dehydrogenase promotes pancreatic cancer development by interacting with eIF4A1 and eIF4E. J Exp Clin Cancer Res. (2019) 38(1):66. doi: 10.1186/s13046-019-1053-y
41. Zeng H, Xu S, Xia E, Hirachan S, Bhandari A, Shen Y. Aberrant expression of WDR4 affects the clinical significance of cancer immunity in pan-cancer. Aging (Albany NY). (2021) 13(14):18360–75. doi: 10.18632/aging.203284
42. Chen Z, Zhu W, Zhu S, Sun K, Liao J, Liu H, et al. METTL1 promotes hepatocarcinogenesis via m(7) G tRNA modification-dependent translation control. Clin Transl Med. (2021) 11(12):e661. doi: 10.1002/ctm2.661
43. Zhang H, Wang A, Tan Y, Wang S, Ma Q, Chen X, et al. NCBP1 promotes the development of lung adenocarcinoma through up-regulation of CUL4B. J Cell Mol Med. (2019) 23(10):6965–77. doi: 10.1111/jcmm.14581
Keywords: hepatocellular carcinoma, N7-methylguanosine, risk signature, prognosis, tumor immune microenvironment, NCBP2
Citation: Zhou K, Yang J, Li X, Xiong W, Zhang P and Zhang X (2022) N7-Methylguanosine Regulatory Genes Profoundly Affect the Prognosis, Progression, and Antitumor Immune Response of Hepatocellular Carcinoma. Front. Surg. 9:893977. doi: 10.3389/fsurg.2022.893977
Received: 11 March 2022; Accepted: 19 May 2022;
Published: 16 June 2022.
Edited by:
Zeming Liu, Huazhong University of Science and Technology, ChinaReviewed by:
Jinhui Liu, Nanjing Medical University, ChinaCopyright © 2022 Zhou, Yang, Li, Xiong, Zhang and Zhang. This is an open-access article distributed under the terms of the Creative Commons Attribution License (CC BY). The use, distribution or reproduction in other forums is permitted, provided the original author(s) and the copyright owner(s) are credited and that the original publication in this journal is cited, in accordance with accepted academic practice. No use, distribution or reproduction is permitted which does not comply with these terms.
*Correspondence: Xuqing Zhang emhhbmd4dXFpbmdjeUAxNjMuY29t
Specialty section: This article was submitted to Surgical Oncology, a section of the journal Frontiers in Surgery
Abbreviations: ACC, adrenocortical carcinoma; AJCC, American Joint Committee on Cancer; CBC, cap-binding protein complex; CC, intrahepatic cholangiocarcinoma; DCA, decision curve analysis; DEGs, differentially expressed genes; HCC, hepatocellular carcinoma; ICB, immune checkpoint blockade; ICC, intrahepatic cholangiocarcinoma; IFN, interferon; LADC, lung adenocarcinoma; m7G, N7-methylguanosine; m6A, N6-methyladenosine; MSigDB, Molecular Signatures Database; ORR, objective response rate; OS, overall survival; PAAD, pancreatic adenocarcinoma; RIG-I , retinoic acid inducible gene-I; ROC, receiver operating characteristic curve; TFH, T cells follicular helper; TIM, tumor immune microenvironment; Tregs, T cells regulator.
Disclaimer: All claims expressed in this article are solely those of the authors and do not necessarily represent those of their affiliated organizations, or those of the publisher, the editors and the reviewers. Any product that may be evaluated in this article or claim that may be made by its manufacturer is not guaranteed or endorsed by the publisher.
Research integrity at Frontiers

Learn more about the work of our research integrity team to safeguard the quality of each article we publish.