 Zhen Ye†Jichong Zhu†
 Chong LiuQing LuShaofeng WuChenxing Zhou
 Tuo LiangJie JiangHao Li
 Tianyou Chen
 Jiarui Chen
 Guobing DengYuanlin Yao
 Shian Liao
 Chaojie YuXuhua SunLiyi ChenHao GuoWuhua ChenWenyong JiangBinguang FanXiang TaoZhenwei YangWenfei GuYihan Wang
 Xinli Zhan*
- First Affiliated Hospital of Guangxi Medical University, Nanning, China
Background: Tuberculosis (TB) is a chronic infectious disease. Bone and joint TB is a common type of extrapulmonary TB and often occurs secondary to TB infection. In this study, we aimed to find the difference in the blood examination results of patients with bone and joint TB and patients with TB by using machine learning (ML) and establish a diagnostic model to help clinicians better diagnose the disease and allow patients to receive timely treatment.
Methods: A total of 1,667 patients were finally enrolled in the study. Patients were randomly assigned to the training and validation cohorts. The training cohort included 1,268 patients: 158 patients with bone and joint TB and 1,110 patients with TB. The validation cohort included 399 patients: 48 patients with bone and joint TB and 351 patients with TB. We used three ML methods, namely logistic regression, LASSO regression, and random forest, to screen the differential variables, obtained the most representative variables by intersection to construct the prediction model, and verified the performance of the proposed prediction model in the validation group.
Results: The results revealed a great difference in the blood examination results of patients with bone and joint TB and those with TB. Infectious markers such as hs-CRP, ESR, WBC, and NEUT were increased in patients with bone and joint TB. Patients with bone and joint TB were found to have higher liver function burden and poorer nutritional status. The factors screened using ML were PDW, LYM, AST/ALT, BUN, and Na, and the nomogram diagnostic model was constructed using these five factors. In the training cohort, the area under the curve (AUC) value of the model was 0.71182, and the C value was 0.712. In the validation cohort, the AUC value of the model was 0.6435779, and the C value was 0.644.
Conclusion: We used ML methods to screen out the blood-specific factors—PDW, LYM, AST/ALT, BUN, and Na+—of bone and joint TB and constructed a diagnostic model to help clinicians better diagnose the disease in the future.
Introduction
Tuberculosis (TB) is a chronic infectious disease mainly caused by Mycobacterium tuberculosis (1). The main transmission route of TB is respiratory tract transmission. The prevalence of TB in China is approximately 66/100,000 in sputum smear-positive patients and approximately 119/100,000 in sputum smear-negative patients (2). TB tends to occur in people with low immunity, such as patients with diabetes, infants, patients with AIDS, and immunosuppressant users (3). Common symptoms include cough, sputum, hemoptysis, and dyspnea (4). Severe complications can lead to cardiopulmonary failure and even death.
Extrapulmonary TB is reported in 14% of TB cases (5). Bone and joint TB is an infectious disease caused by tuberculosis bacilli through blood, lymph, or direct spread to bone tissue, most of which are secondary to TB. Bone and joint TB tends to occur in the spine, hip joint, and knee joint, often presenting with pain in the joints (6). Bone and joint TB is diagnosed by blood examination, imaging, and pathological biopsy. Commonly used treatment methods include drug therapy and surgery (7).
Machine learning (ML) is the science of how computers learn from data. ML has its roots in computer science and is a subfield of artificial intelligence. It is a cross between statistics, which deals with learning relationships from data, and computer science, which focuses on efficient algorithms. ML is extensively used in clinical data processing (8, 9).
Numerous studies have been conducted on TB, but few studies have focused on the differences between patients with bone and joint TB and patients with TB. The gold standard for the diagnosis of bone and joint TB is pathological results but many primary hospitals lack imaging tools and pathological examination and can thus judge bone and joint TB only by symptoms and blood examination results. In addition, bone and joint TB is often difficult to get TB infected tissues in minimally invasive puncture diagnosis, which easily affects the clinician's judgment of the condition. In this study, we collected the clinical data of patients with bone and joint TB and common TB to determine the differences by using ML methods to help clinicians better diagnose and treat bone and joint TB.
Patients and methods
Patients
This study was voluntary, and all patients signed an informed consent form. This study was approved by the Ethics Committee of the First Affiliated Hospital of Guangxi Medical University (Supplementary Materials 2) [No. 2022-KY-E-(287)].
From 2012 to 2022, we collected a total of 12,770 hospitalized patients diagnosed with TB in the First Affiliated Hospital of Guangxi Medical University. The inclusion criteria for patients with pulmonary TB were as follows: (1) Mycobacterium tuberculosis detected in sputum smears or lesions and diagnosed as TB by two or more specialists. (2) Complete erythrocyte sedimentation rate (ESR) examination, blood routine examination, liver function examination, renal function examination, high sensitivity C-reactive protein (hs-CRP), and plasma electrolyte examination data were available for the patient. (3) Patients voluntarily participated in the study. In the case of minors, their guardians signed on their behalf. (4) The patient exhibited good compliance and no serious cardiovascular and cerebrovascular diseases. The inclusion criteria for patients with bone and joint TB were as follows: (1) Patients were hospitalized in the Department of Spinal Bone Disease, the First Affiliated Hospital of Guangxi Medical University, and diagnosed as bone and joint TB by surgery or biopsy. (2) Complete erythrocyte sedimentation rate examination, blood routine examination, liver function examination, renal function examination, and hs-CRP and plasma electrolyte examination data were available for the patient. (3) Patients voluntarily participated in the study. In the case of minors, their guardians signed on their behalf. (4) The patient had good compliance and no serious cardiovascular and cerebrovascular diseases.
The exclusion criteria were as follows: (1) Patients who did not have Mycobacterium tuberculosis in sputum smears or lesions. (2) Patients with missing clinical data. (3) Patients with serious cardiovascular and cerebrovascular diseases. (4) Patients who did not agree to participate in the study.
A total of 1,667 patients were enrolled in the study. Among them, 206 patients were diagnosed with bone and joint TB, and 1,461 patients were diagnosed with common TB. Among the patients diagnosed with bone and joint TB, eight were hip TB, 14 were knee TB, eight were cervical TB, 63 were lumbar TB, two were thoracolumbar TB, and 111 were thoracic TB. We randomly assigned patients to the training and validation cohorts. There were 1,268 patients in the training cohort: 158 patients with bone and joint TB and 1,110 patients with TB. The validation cohort included 399 patients: 48 patients with bone and joint TB and 351 patients with TB.
All data were collected from the information system of the First Affiliated Hospital of Guangxi Medical University, and the patients' ID numbers were used for the search. Blood routine examination included white blood cell (WBC) count, red blood cell (RBC) count, hematocrit value (HCT), mean corpuscular volume (MCV), mean corpuscular hemoglobin (MCH), mean corpuscular hemoglobin concentration (MCHC), Platelet hematocrit (PLT), platelet distribution width (PDW), neutrophil percentage (NEUT), lymphocytes percentage (LYM), monocyte percentage (MO), eosinophils percentage (EO), RBC volume distributing width (CV), and thrombocytocrit (PCT). Liver and kidney function examination included total bilirubin (TBil), direct bilirubin (DBil), indirect bilirubin (IBil), total protein (TP), albumin (ALB), globulin (GLB), gamma-glutamyl transpeptidase (GGT), total bile acid (TBA), aspartate aminotransferase (AST), alanine aminotransferase (ALT), A alkaline phosphatase (ALP), prealbumin (PAB), cholinesterase (ChE), blood urea nitrogen (BUN), creatinine (Cr), uric acid (UA), bicarbonate radical (HCO), creatinine clearance rate (Ccr), and Cysteine C (Cys-C). Plasma electrolyte examination included K+, Na+, Cl−, Ca2+, and Mg2+. The data of all screened patients were complete, but hs-CRP was not tested in some patients, and hs-CRP was statistically analyzed separately.
Statistical analysis
IBM SPSS Statistics 23 and R software (version 4.1.3; https://www.R-project.org) were used for data analysis and visualization. Student's t-test was used to compare the means of continuous variables between the two cohorts (patients with bone and joint TB and patients with TB) (10). The t-test data were normally distributed with uniform variance (11). Hs-CRP and gender differences were tested by chi-square test (12). Multiple checks were performed on the calculations to ensure that they were correct. A two-sided probability of less than 0.05 was considered statistically significant for all analyzed data (13, 14).
Univariate and multivariate logistic regression were analyzed and visualized using the “rms,” “glmnet,” and “plyr” R packages. LASSO regression was analyzed and visualized using the “glmnet” package (15). The random forest was analyzed and visualized using the “randomForest” package. The nomogram construction and C value calculation were performed using the “rms” package (16). The area under the curve (AUC) of the ROC curve and Harrell's concordance index were used to evaluate the performance of nomogram predictions (17). Harrell's concordance index (C-index) was calculated to assess nomogram discrimination by using a bootstrap method with 1,000 samples (18). The “corrplot” package was used to analyze the correlation of the independent variables. The “rma” and “rmda” packages were used to calculate the net benefits and visualize the decision curve (19).
Random forest
Random forest is a learning machine based on decision trees and can be used to predict continuous variables and improve prediction accuracy (20, 21). An increase in mean squared (%IncMSE) and an increase in node purity (IncNodePurity) are two methods of random forest for prediction. %IncMSE is a random assignment of each predictor variable. If this variable is more important, the prediction error will be larger if it is randomly replaced. IncNodePurity is measured by the sum of squared residuals. In both cases, the larger the value, the more important the prediction variable. Both can be regarded as important indicators of predictive variables (22).
Results
Tables 1–3 list the differences in ESR, blood routine examination, liver function examination, renal function examination, and plasma electrolytes between patients with bone and joint TB and patients with TB. In the ESR and blood routine examination (Table 1), ESR was significantly increased in patients with TB, but patients with bone and joint TB had higher values than patients with TB. The RBC, HCT, PDW, and LYM of patients with bone and joint TB were lower than those of patients with TB. NEUT and CV of patients with bone and joint TB were higher than those of patients with pulmonary TB.
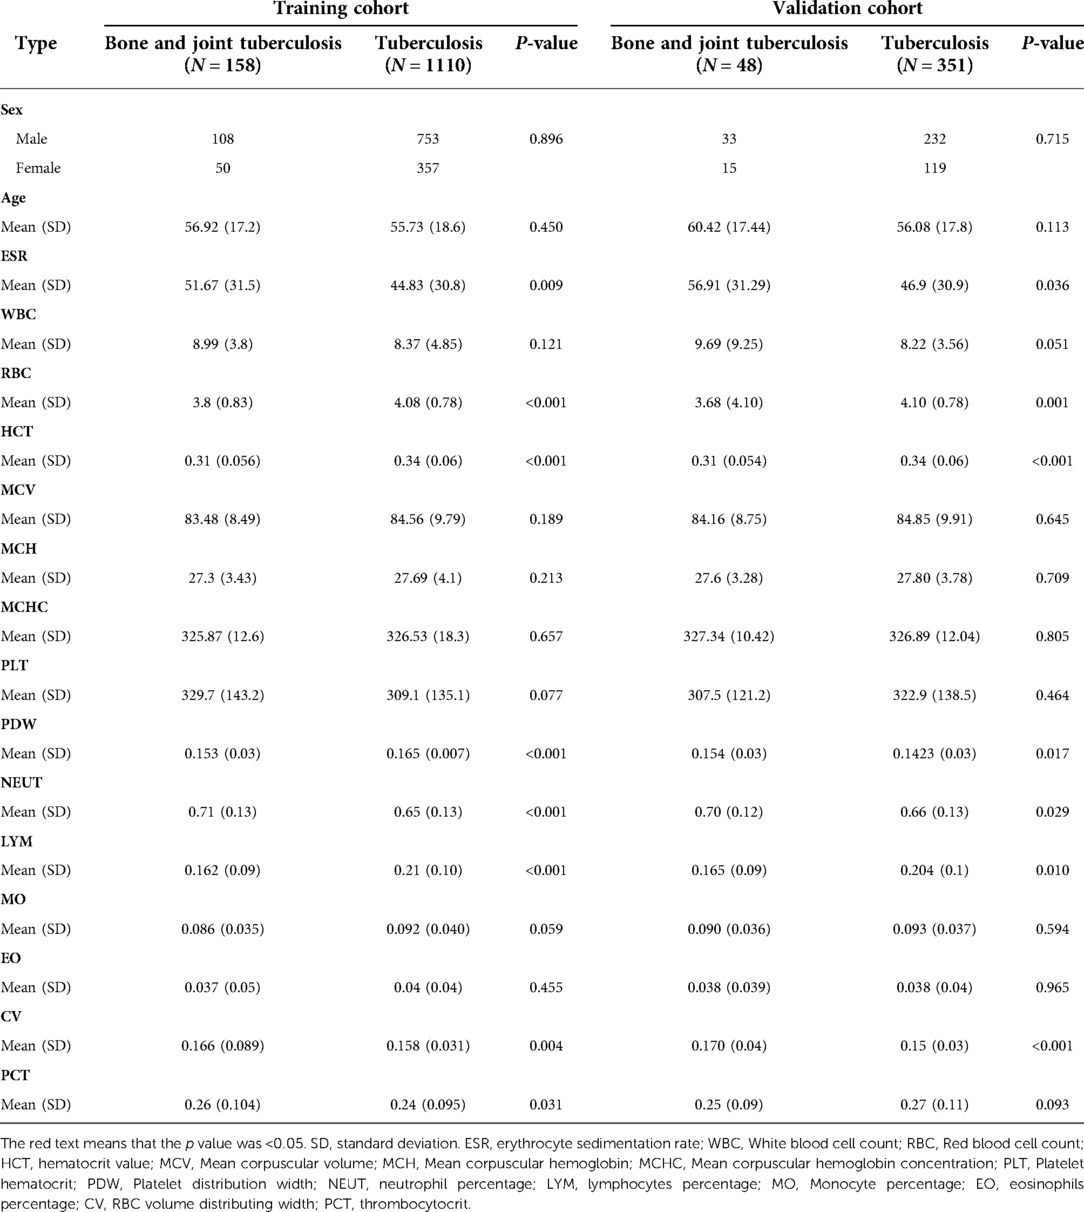
Table 1. The differences ESR and blood routine examination.
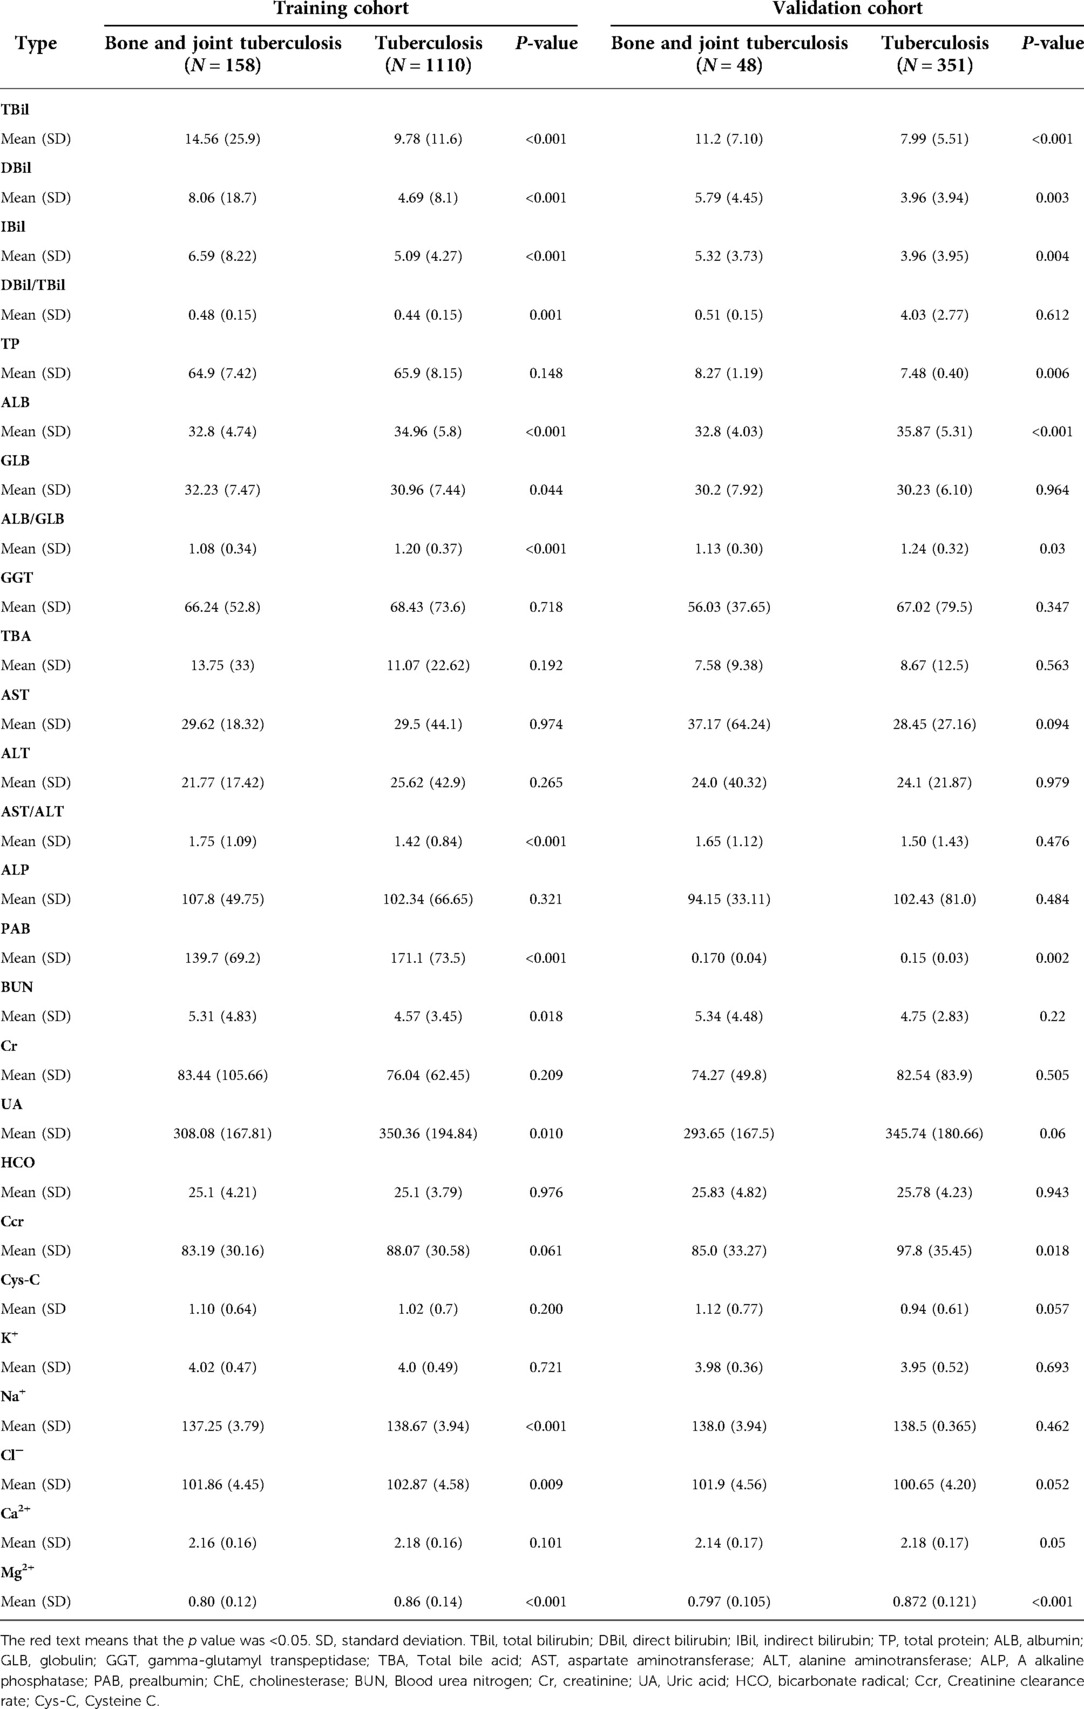
Table 2. The differences liver function examination, renal function examination and plasma electrolyte examination.
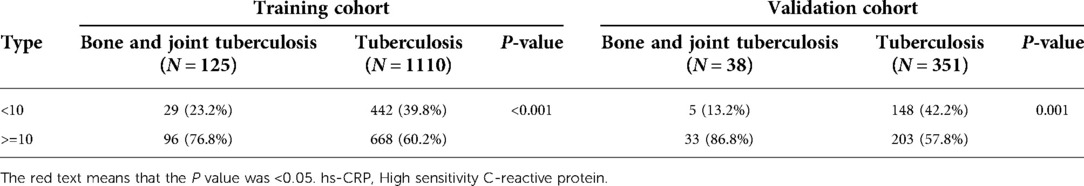
Table 3. The differences hs-CRP examination.
In the liver function examination (Table 2), TBil, DBil, IBil, DBil/IBil, GLB, and AST/ALT in patients with bone and joint TB were higher than those in patients with TB, and ALB, ALB/GLB, and PAB in patients with bone and joint TB were lower than those in patients with TB. In the renal function examination (Table 2), UA was lower, and BUN was higher in patients with bone and joint TB than in those with TB. Ccr was lower in patients with bone and joint TB in both training and validation cohorts, but there was no significant difference in the training cohort. In the examination of plasma electrolytes (Table 2), Na+, Cl, and Mg in patients with bone and joint TB were lower than those in patients with TB, and the differences were statistically significant. As can be seen in Table 3, the proportion of hs-CRP ≥ 10 was significantly higher in patients with bone and joint TB than in patients with TB.
The heat map (Figure 1) shows the distribution of all the variables in the training and validation cohorts. Figure 2 illustrates the relationship between all the variables. Positive correlations were noted between BUN and Cys-C, Cr and BUN, TBil and IBil, DBil and TBil, DBil and IBil, GLB and TB, PCT and PLT, ALT and AST, MCH and MCHC, MCH and MCV, ALB/GLB and ALB, HCT and RBC, and Cl− and Na+. a clear negative correlation was observed between LYM and NEUT, Ccr and Cys-C, and ALB/GLB and GLB.
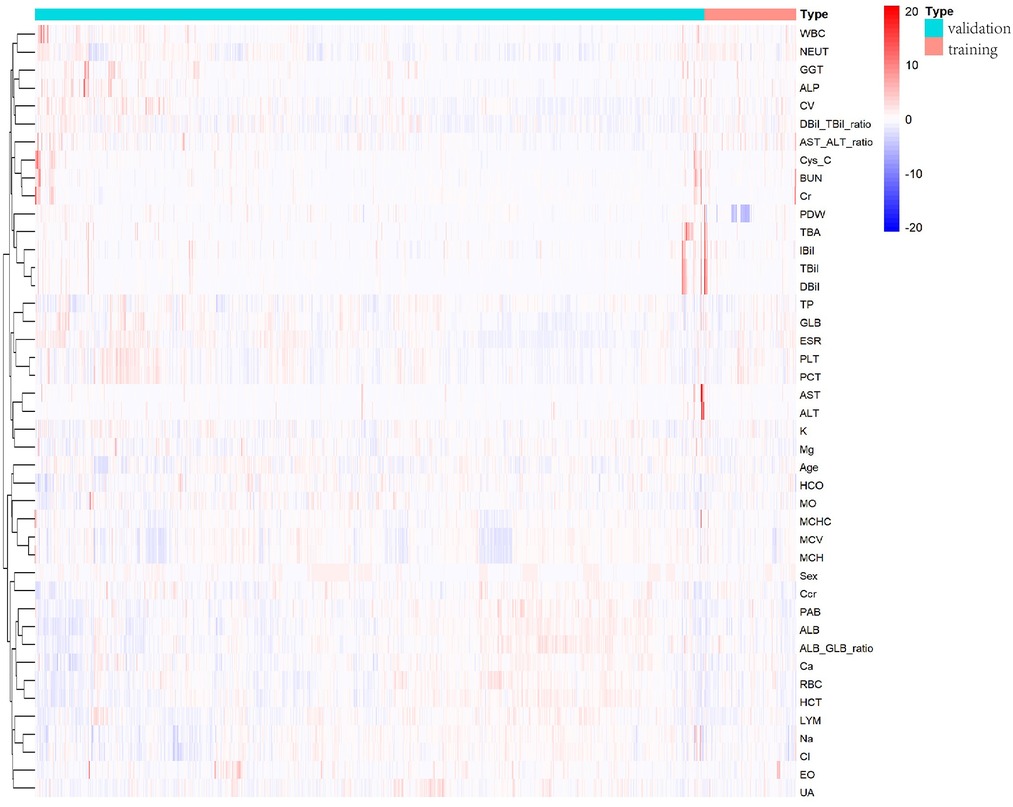
Figure 1. Bone and joint TB and TB training cohorts and validation cohorts heat maps.
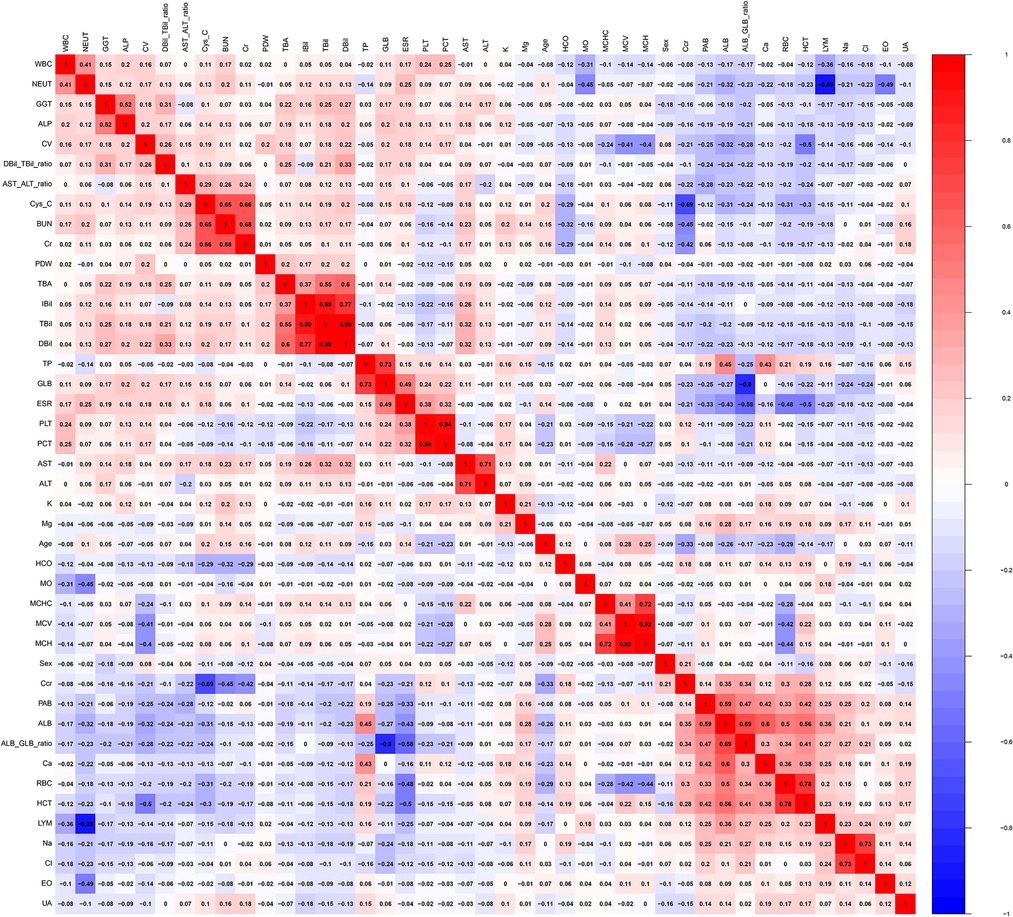
Figure 2. Correlation between all variables.
We screened the variables by using univariate and multivariate logistic regression, Lasso regression, and random forest to obtain the factors with the most obvious differences between the two cohorts. Table 4 presents the results of univariate regression and multivariate regression. Figure 3A shows the results of Lasso regression for all the variables. As can be seen from Figure 3B, the best effect was achieved when 19 factors were selected to be included in the Lasso regression model; Table 5 lists the 19 variables included in the Lasso regression results.
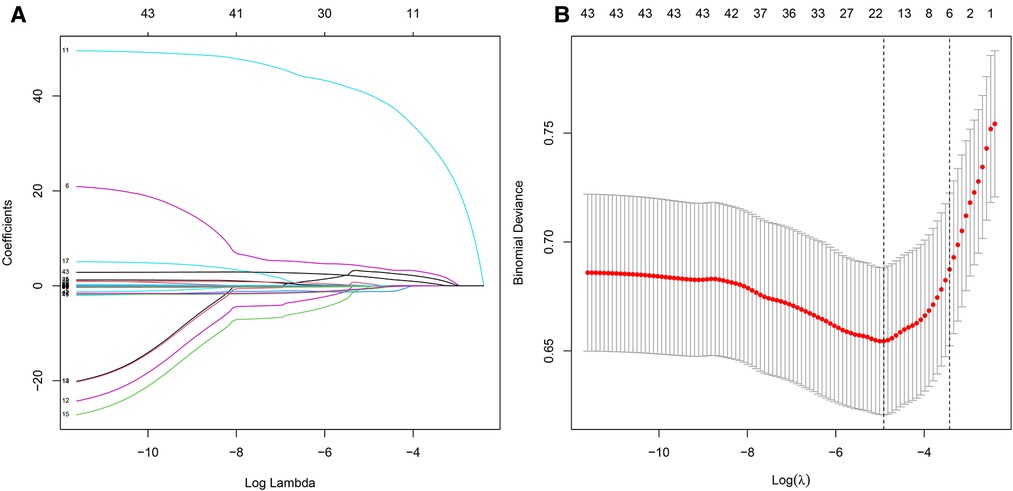
Figure 3. LASSO regression. (A) Results of LASSO regression for all variables. (B) There were significant differences in 17 factors between bone and joint TB and TB.
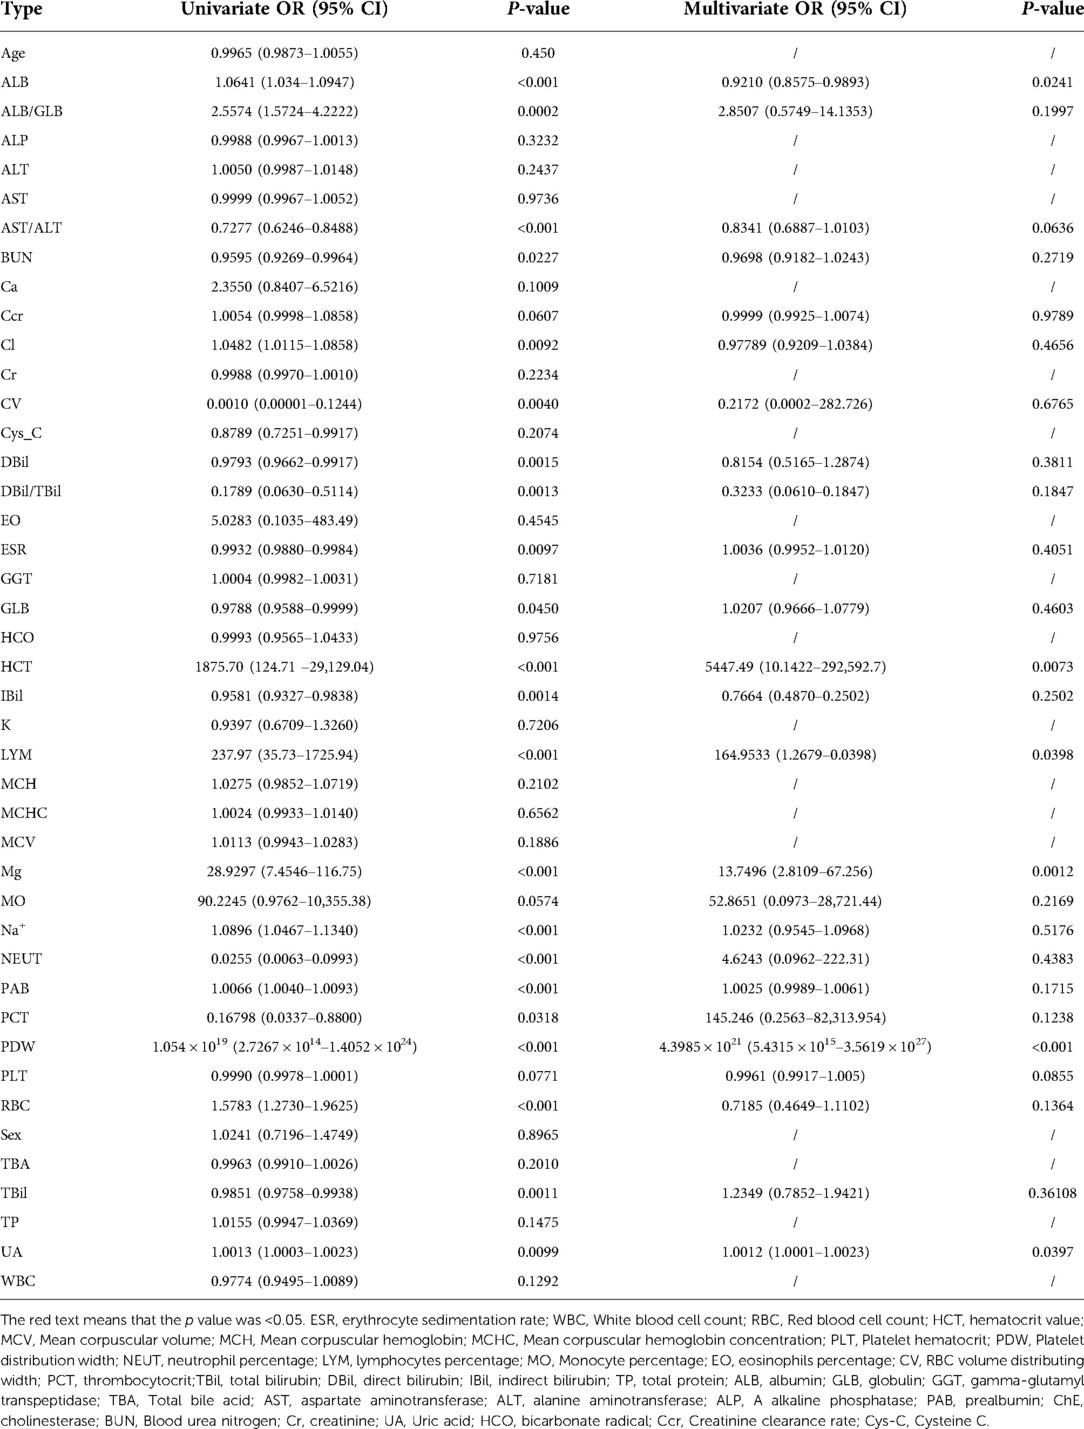
Table 4. Univariate logistic regression and multivariate logistic regression predicted bone tuberculosis.
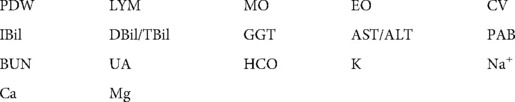
Table 5. Nineteen variables screened by lasso regression.
Figure 4A depicts the 30 most important variables screened by the two calculation methods of %IncMSE and IncNodePurity. The effect was better when 9–18 factors were screened out in the random forest and included in the model (Figure 4B). Finally, we used %IncMSE and IncNodePurity to screen out the first 18 important variables and combined them with the factors screened by univariate logistic regression and the 19 factors screened by Lasso regression to screen out five factors as the final model (Figure 5). The final five factors screened were PDW, LYM, AST/ALT, BUN, and Na+.
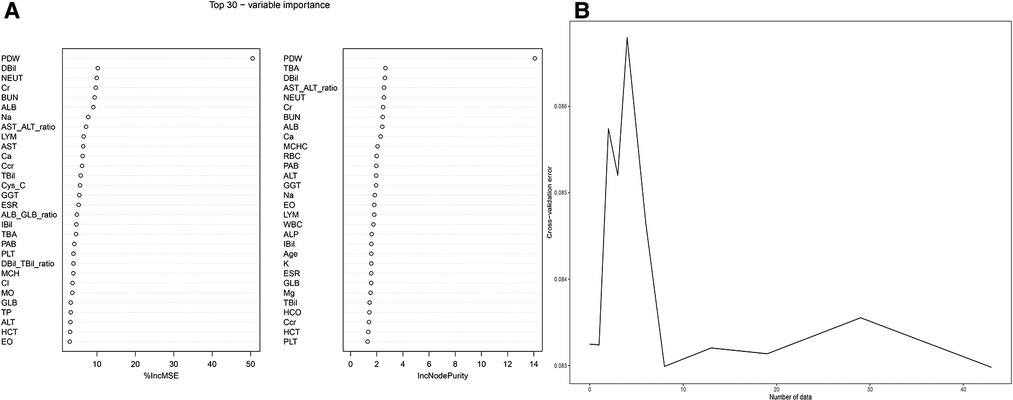
Figure 4. Random forest. (A) %IncMSE and IncNodePurity respectively screened the top 30 important factors. (B) The best diagnostic model was obtained when random forest included 18 factors.
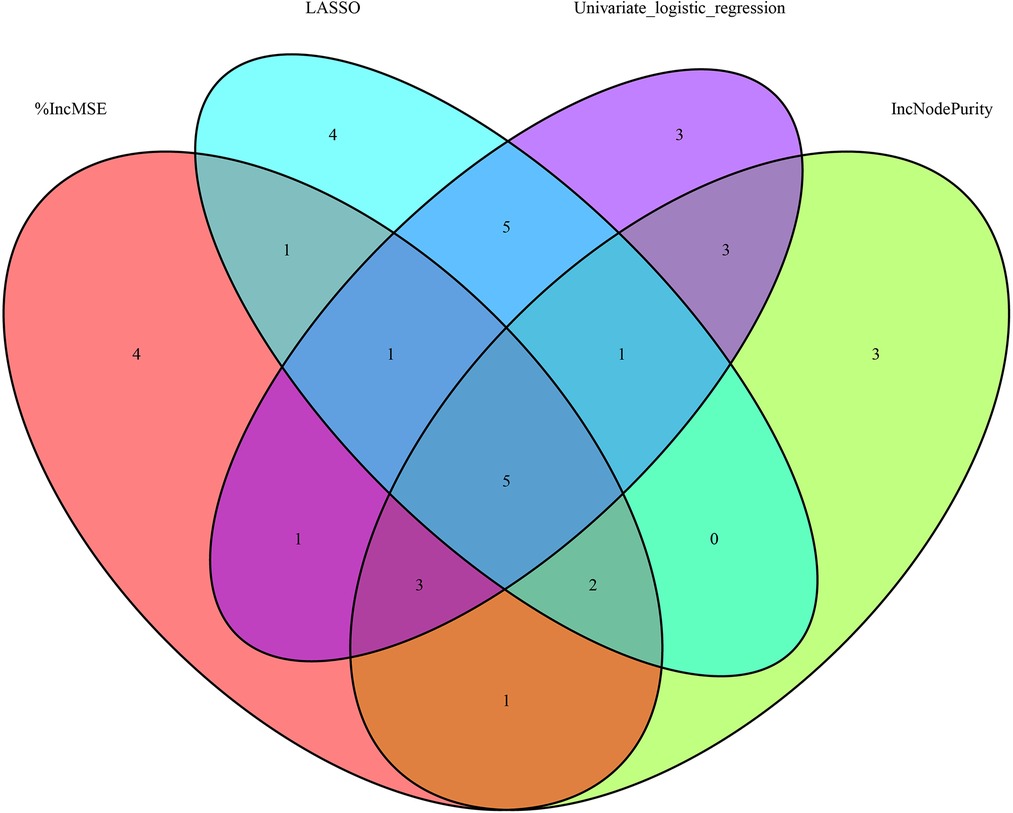
Figure 5. 4 methods venn diagram.
We applied PDW, LYM, AST/ALT, BUN, and Na+ to construct the nomogram diagnostic model (Figure 6A). The nomogram exhibited a good fitting degree (Figure 6B). The AUC value of the diagnostic model was 0.71182 (Figure 6C). A decision curve was constructed to analyze the clinical utility of the model; the model exhibited clinical utility when the threshold of the model was in the range of 3%–100%, and the NONE line of the decision curve was above the ALL line (Figure 6E). The AUC value obtained by placing the diagnostic model in the validation cohort was 0.6435779 (Figure 7A), and a good fit was obtained in the validation cohort (Figure 7B).
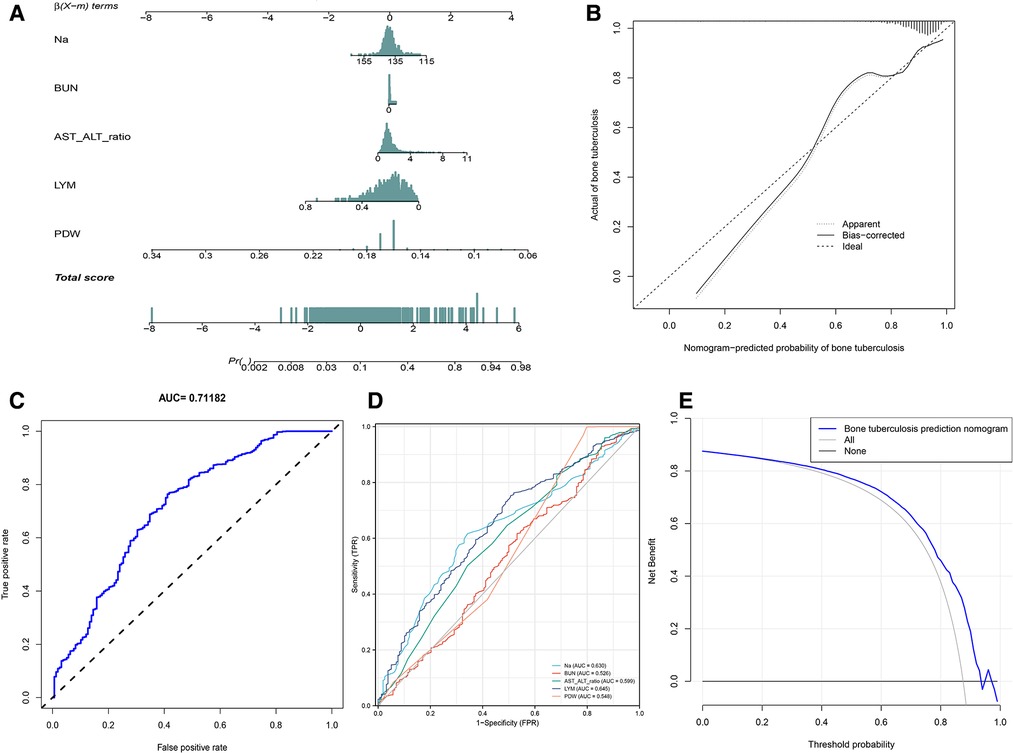
Figure 6. Diagnosis model. (A) Nomogram to predict the probability of bone and joint TB. (B) Calibration curves for predicting bone and joint TB. (C) The AUC value of the prediction model. (D) The AUC values of Na+, BUN, AST/ALT, LYM, and PDW. (E) Decision curve analysis for the prediction model.
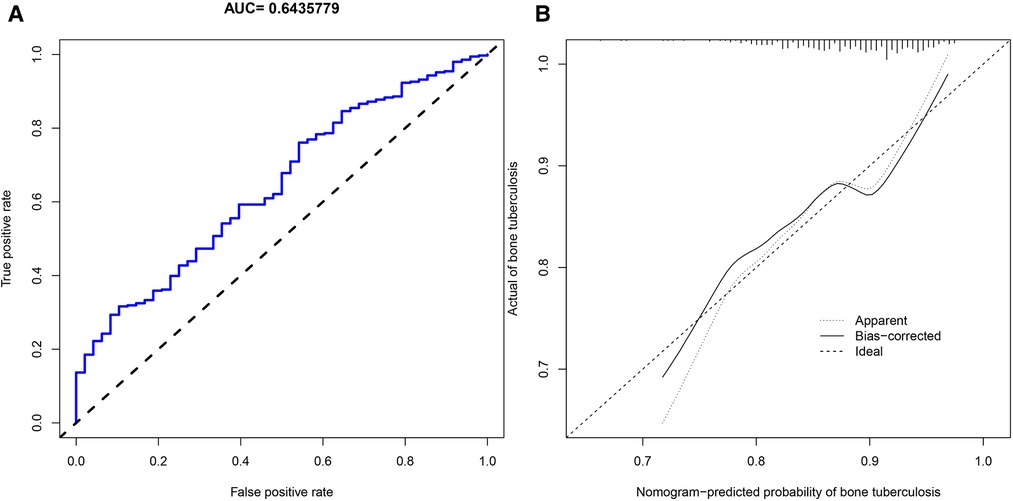
Figure 7. Validation cohort. (A) AUC values of the diagnostic model of bone and joint TB in the validation cohort. (B) Calibration curves for predicting bone and joint TB in the validation cohort.
Discussion
The aim of this study was to explore the differences between patients with bone and joint TB and patients with TB to screen out the most representative factors through the application of ML in the clinical data of the two groups. It is hoped that in the future, it will help clinicians to diagnose bone and joint TB earlier and more easily, and help patients get earlier treatment (23).
TB is a chronic inflammatory reaction caused by Mycobacterium tuberculosis. The specific response of humans to Mycobacterium tuberculosis is called “tuberculosis granuloma.” It is a nodular mass that mixes inflammatory cells and immune cells in the local collection (5). “Granulomatous inflammation” is used to describe a mononuclear infiltration of macrophages and lymphocytes (24). Tissue injury and inflammatory stimulation cause elevated hs-CRP and ESR levels. hs-CRP and ESR can be used as activity indicators to monitor diseases (25, 26). As can be seen in Table 1, the average values of these two factors are much greater in patients with TB than in normal controls. This is the same as observed in the study by Li et al. (27). WBC and NEUT are commonly used as indicators of bacterial infection in clinical practice (28). The mean values of hs-CRP, ESR, WBC, and NEUT in patients with TB were lower than those in patients with bone and joint TB, indicating that patients with bone and joint TB were more seriously infected.
PDW is a common indicator in routine blood examination; hemodilution or some blood-related diseases can lead to a decrease in PDW. In the PDW control study of TB and normal subjects by Xu et al., the mean PDW of TB subjects was lower than that of normal subjects (29). LYM is a type of WBC, originally derived from bone marrow hematopoietic stem cells, which differentiate into cells with different functions (30). Lymphocytes play an important role in adaptive immunity, enabling the immune system to recognize and remember antigens. LYM reduction is common in infections, TB, immune system diseases, and the use of hormones (31). LYM in patients with TB is lower than that in normal subjects (32).
We found that the mean PDW and LYM values of patients with bone and joint TB on routine blood tests were significantly lower than those of patients with TB. The lower mean value of LYM in patients with bone and joint TB indicates that such patients have lower immune capacity and are at higher levels of inflammation (30). This issue is also illustrated by the inverse relationship between LYM and NEUT inflammatory markers in Figure 2. Lymphocytes are divided into T lymphocytes, B lymphocytes, and NK cells. Different lymphocytes have different characteristics. Lymphocytopenia in patients with bone and joint TB is more obvious and needs further study. PLT was elevated in patients with bone and joint TB (Table 1), and the average value was higher than normal. PLT is an inflammatory marker and is elevated in patients with TB (33). PLT and PDW exhibited a negative correlation (Figure 2). We believe that the relative increase in PLT in patients with bone and joint TB leads to a decrease in PDW.
Bilirubin is a pigment made from hemoglobin in red blood cells. When hemoglobin dies, it breaks down to biliverdin, which in response to NADPH and H ions generates bilirubin (34). In the liver function test, TBil, DBil, and IBil of patients with bone and joint TB were higher than those of patients with TB, indicating a correlation between aging erythrocytes in patients with bone and joint TB. The decrease in RBC in patients with bone and joint TB proved our view (Table 1). However, AST/ALT was increased in patients with bone and joint TB, mainly due to the decrease in ALT. ALT is a sensitive indicator of liver damage (35). The higher average value of ALT in patients with TB indicates that patients with pulmonary TB may have a greater liver function burden. Antituberculous drugs also affect liver function, and the reason for the increase in ALT needs to be further investigated. ALB is commonly used as a measure of nutritional status, and TB is a wasting disease, which is confirmed by the fact that ALB was lower than normal in both groups (36). The average ALB of patients with bone and joint TB was lower than that in patients with TB, which may be related to the longer and more severe infection, leading to more decline in nutritional status. The increase in GLB is usually due to the invasion of viruses and bacteria. The immune system produces increased GLB against viruses and bacteria, which also indicates that patients with bone and joint TB are more severely attacked by Mycobacterium tuberculosis (37).
Furthermore, BUN increased, and UA decreased in patients with bone and joint TB.
BUN and Cr are both waste products of human metabolism. The kidney is also the only organ that clears Cys-C. In clinical practice, the increase of BUN, Cys-Cand Cr is often used to indicate abnormal renal function, so there is a positive correlation between them (38). BUN is the product of the catabolism of human protein; 90% of BUN needs to be excreted by the kidney (39). Protein breakdown in patients with bone and joint TB is greater than that in patients with TB, and the nutrient consumption is greater. UA content is usually proportional to the intake of purine content, and there was no difference in the diet between the two groups; Thus, only the endogenous reduction of purine production in UA can be considered. Currently, it is not known how UA works, and further research is required. In the examination of plasma electrolytes, Na+, Cl−, and Mg2+ were slightly decreased in patients with bone and joint TB, but there is no clear implication in clinical practice.
We used univariate logistic regression, LASSO regression, and random forest to screen the clinical data of 206 patients with bone and joint TB and 1,461 patients with TB to identify the five most variable factors. Finally, we constructed the nomogram diagnostic model by using five factors, namely PDW, LYM, AST/ALT, BUN, and Na+, and achieved relatively good efficiency. The proposed diagnostic model will help clinicians more easily diagnose patients with bone and joint TB, prevent the progression of TB in time, and give patients more timely treatment. Especially in the face of patients with atypical bone and joint TB, many doctors are afraid to use anti-TB drugs without clear pathological results. Our diagnostic model can help doctors to a certain extent. Of course, a more accurate diagnosis of bone and joint TB still requires the imaging and pathological results of TB and the experience of clinicians.
Few blood investigation studies on patients with bone and joint TB have been conducted. We used ML methods to screen patients' ESR, blood routine, liver and kidney function, and plasma electrolytes, which is a novel feature of our study. We used ML to process big data, screen out specific factors, and construct diagnostic models. However, our study also has some limitations. For example, the data used in the study belonged to a single hospital. The use of multicenter data will provide more convincing results. In addition, cases of bone and joint TB are relatively rare. The number gap between bone and joint TB and TB patients is also large, which can also cause errors in the accuracy of the model. The diagnostic performance of the nomogram is not good enough. This study is only a preliminary exploration of the blood characteristics of patients with bone and joint TB, and there are many directions for further research.
Conclusion
We used ML to screen out the blood-specific factors PDW, LYM, AST/ALT, BUN, and Na+ of bone and joint TB and constructed a diagnostic model to help clinicians better diagnose the disease in the future.
Data availability statement
The original contributions presented in the study are included in the article/Supplementary Material, further inquiries can be directed to the corresponding author/s.
Ethics statement
All the patients in the study volunteered and signed informed consent. Patients younger than 18 years old shall be signed by the patient's guardian. All subjects had their names and ID numbers hidden to protect data confidentiality. This study was approved by the Ethics Committee of the First Affiliated Hospital of Guangxi Medical University.
Author contributions
All the authors contributed to the research. ZY, JZ, CL, XZ and SW contributed to the design of the study and the writing and revision of the paper. QL, XS, TL, JJ, HL, TC and JC participated in data collection for the study. GD, SL, CY, LC, CZ and HG were mainly responsible for data collation and data analysis. YY, WC, WJ and BF were responsible for data visualization. XT, ZY, WG and YW were responsible for data verification. All authors contributed to the article and approved the submitted version.
Funding
This work was sponsored by the National Natural Science Foundation of China (81560359 and 81860393). Funding bodies had no role in the study design, collection, analysis, and interpretation of the data or in writing the manuscript.
Acknowledgments
We are grateful to Dr. Xinli Zhan and Dr. Chong Liu (Spine and Osteopathy Ward, The First Affiliated Hospital of Guangxi Medical University) for his kindly assistance in all stages of the present study.
Conflict of interest
The authors declare that the research was conducted in the absence of any commercial or financial relationships that could be construed as a potential conflict of interest.
Publisher's note
All claims expressed in this article are solely those of the authors and do not necessarily represent those of their affiliated organizations, or those of the publisher, the editors and the reviewers. Any product that may be evaluated in this article, or claim that may be made by its manufacturer, is not guaranteed or endorsed by the publisher.
Supplementary material
The Supplementary Material for this article can be found online at: https://www.frontiersin.org/articles/10.3389/fsurg.2022.1031105/full#supplementary-material.
References
1. Sia JK, Rengarajan J. Immunology of Mycobacterium tuberculosis infections. Microbiol Spectr. (2019) 7(4). doi: 10.1128/microbiolspec.GPP3-0022-2018
2. Li XX, Wang LX, Zhang H, Jiang SW, Fang Q, Chen JX, et al. Spatial variations of pulmonary tuberculosis prevalence co-impacted by socio-economic and geographic factors in People's Republic of China, 2010. BMC Public Health. (2014) 14:257. doi: 10.1186/1471-2458-14-257
3. MacNeil A, Glaziou P, Sismanidis C, Date A, Maloney S, Floyd K. Global epidemiology of Tuberculosis and progress toward meeting global targets—worldwide, 2018. MMWR Morb Mortal Wkly Rep. (2020) 69(11):281–5. doi: 10.15585/mmwr.mm6911a2
4. Suárez I, Fünger SM, Kröger S, Rademacher J, Fätkenheuer G, Rybniker J. The diagnosis and treatment of Tuberculosis. Dtsch Arztebl Int. (2019) 116(43):729–35. doi: 10.3238/arztebl.2019.0729
5. Basaraba RJ, Hunter RL. Pathology of tuberculosis: how the pathology of human tuberculosis informs and directs animal models. Microbiol Spectr. (2017) 5(3). doi: 10.1128/microbiolspec.TBTB2-0029-2016
6. Johansen IS, Nielsen SL, Hove M, Kehrer M, Shakar S, Wøyen AV, et al. Characteristics and clinical outcome of bone and joint Tuberculosis from 1994 to 2011: a retrospective register-based study in Denmark. Clin Infect Dis. (2015) 61(4):554–62. doi: 10.1093/cid/civ326
7. Tuli SM. General principles of osteoarticular tuberculosis. Clin Orthop Relat Res. (2002) 398:11–9. doi: 10.1097/00003086-200205000-00003
8. Deo RC. Machine learning in medicine. Circulation. (2015) 132(20):1920–30. doi: 10.1161/CIRCULATIONAHA.115.001593
9. Li W, Liu Y, Liu W, Tang ZR, Dong S, Li W, et al. Machine learning-based prediction of lymph node metastasis among osteosarcoma patients. Front Oncol. (2022) 12:797103. doi: 10.3389/fonc.2022.797103
10. Kim TK. T test as a parametric statistic. Korean J Anesthesiol. (2015) 68(6):540–6. doi: 10.4097/kjae.2015.68.6.540
11. Rochon J, Gondan M, Kieser M. To test or not to test: preliminary assessment of normality when comparing two independent samples. BMC Med Res Methodol. (2012) 12:81. doi: 10.1186/1471-2288-12-81
12. McHugh ML. The chi-square test of independence. Biochem Med (Zagreb). (2013) 23(2):143–9. doi: 10.11613/BM.2013.018
13. Guyatt G, Jaeschke R, Heddle N, Cook D, Shannon H, Walter S. Basic statistics for clinicians: 1. Hypothesis testing. CMAJ. (1995) 152(1):27–32.7804919
14. Li W, Wang H, Dong S, Tang ZR, Chen L, Cai X, et al. Establishment and validation of a nomogram and web calculator for the risk of new vertebral compression fractures and cement leakage after percutaneous vertebroplasty in patients with osteoporotic vertebral compression fractures. Eur Spine J. (2022) 31(5):1108–21. doi: 10.1007/s00586-021-07064-z
15. Guo C, Gao YY, Ju QQ, Zhang CX, Gong M, Li ZL. The landscape of gene co-expression modules correlating with prognostic genetic abnormalities in AML. J Transl Med. (2021) 19(1):228. doi: 10.1186/s12967-021-02914-2
16. Pavey TG, Gilson ND, Gomersall SR, Clark B, Trost SG. Field evaluation of a random forest activity classifier for wrist-worn accelerometer data. J Sci Med Sport. (2017) 20(1):75–80. doi: 10.1016/j.jsams.2016.06.003
17. Janssens A, Martens FK. Reflection on modern methods: revisiting the area under the ROC curve. Int J Epidemiol. (2020) 49(4):1397–403. doi: 10.1093/ije/dyz274
18. Zhang M, Wang X, Chen X, Zhang Q, Hong J. Novel immune-related gene signature for risk stratification and prognosis of survival in lower-grade glioma. Front Genet. (2020) 11:363. doi: 10.3389/fgene.2020.00363
19. Li W, Dong S, Wang B, Wang H, Xu C, Zhang K, et al. The construction and development of a clinical prediction model to assess lymph node metastases in osteosarcoma. Front Public Health. (2021) 9:813625. doi: 10.3389/fpubh.2021.813625
20. Li L, Prato CG, Wang Y. Ranking contributors to traffic crashes on mountainous freeways from an incomplete dataset: a sequential approach of multivariate imputation by chained equations and random forest classifier. Accid Anal Prev. (2020) 146:105744. doi: 10.1016/j.aap.2020.105744
21. Li W, Wang J, Liu W, Xu C, Li W, Zhang K, et al. Machine learning applications for the prediction of bone cement leakage in percutaneous vertebroplasty. Front Public Health. (2021) 9:812023. doi: 10.3389/fpubh.2021.812023
22. Zhang H, Zhang X, Hua L, Li L, Tian L, Zhang X, et al. An exploratory analysis of forme fruste keratoconus sensitivity diagnostic parameters. Int Ophthalmol. (2022) 42(8):2473–81. doi: 10.1007/s10792-022-02246-0
23. Li W, Liu W, Hussain Memon F, Wang B, Xu C, Dong S, et al. An external-validated prediction model to predict lung metastasis among osteosarcoma: a multicenter analysis based on machine learning. Comput Intell Neurosci. (2022) 2022:2220527. doi: 10.1155/2022/2220527
24. Wang X, Liu Y. Offense and defense in granulomatous inflammation disease. Front Cell Infect Microbiol. (2022) 12:797749. doi: 10.3389/fcimb.2022.797749
25. Stikbakke E, Richardsen E, Knutsen T, Wilsgaard T, Giovannucci EL, McTiernan A, et al. Inflammatory serum markers and risk and severity of prostate cancer: the PROCA-life study. Int J Cancer. (2020) 147(1):84–92. doi: 10.1002/ijc.32718
26. Lapić I, Padoan A, Bozzato D, Plebani M. Erythrocyte sedimentation rate and C-reactive protein in acute inflammation. Am J Clin Pathol. (2020) 153(1):14–29. doi: 10.1093/ajcp/aqz142
27. Li W, Liu Z, Xiao X, Xu Z, Sun Z, Zhang Z, et al. Early surgical intervention for active thoracic spinal tuberculosis patients with paraparesis and paraplegia. BMC Musculoskelet Disord. (2021) 22(1):213. doi: 10.1186/s12891-021-04078-y
28. Zheng S, Wang Z, Qin S, Chen JT. Usefulness of inflammatory markers and clinical manifestation for an earlier method to diagnosis surgical site infection after spinal surgery. Int Orthop. (2020) 44(11):2211–9. doi: 10.1007/s00264-020-04567-0
29. Xu F, Qu S, Wang L, Qin Y. Mean platelet volume (MPV): new diagnostic indices for co-morbidity of tuberculosis and diabetes mellitus. BMC Infect Dis. (2021) 21(1):461. doi: 10.1186/s12879-021-06152-1
30. Almezhghwi K, Serte S. Improved classification of white blood cells with the generative adversarial network and deep convolutional neural network. Comput Intell Neurosci. (2020) 2020:6490479. doi: 10.1155/2020/6490479
31. Adamstein NH, Ridker PM. The neutrophil-lymphocyte ratio: considerations for clinical application. Eur Heart J. (2021) 42(22):2216–7. doi: 10.1093/eurheartj/ehab166
32. Iliaz S, Iliaz R, Ortakoylu G, Bahadir A, Bagci BA, Caglar E. Value of neutrophil/lymphocyte ratio in the differential diagnosis of sarcoidosis and tuberculosis. Ann Thorac Med. (2014) 9(4):232–5. doi: 10.4103/1817-1737.140135
33. Zhao Y, Yin L, Patel J, Tang L, Huang Y. The inflammatory markers of multisystem inflammatory syndrome in children (MIS-C) and adolescents associated with COVID-19: a meta-analysis. J Med Virol. (2021) 93(7):4358–69. doi: 10.1002/jmv.26951
34. Shibahara S, Kitamuro T, Takahashi K. Heme degradation and human disease: diversity is the soul of life. Antioxid Redox Signaling. (2002) 4(4):593–602. doi: 10.1089/15230860260220094
35. Ladue JS, Wroblewski F. Serum glutamic pyruvic transaminase SGP-T in hepatic disease: a preliminary report. Ann Intern Med. (1956) 45(5):801–11. doi: 10.7326/0003-4819-45-5-801
36. Mendez CM, McClain CJ, Marsano LS. Albumin therapy in clinical practice. Nutr Clin Pract. (2005) 20(3):314–20. doi: 10.1177/0115426505020003314
37. Ballow M. Mechanisms of action of intravenous immune serum globulin in autoimmune and inflammatory diseases. J Allergy Clin Immunol. (1997) 100(2):151–7. doi: 10.1016/S0091-6749(97)70217-3
38. Gao F, Qian M, Liu G, Ao W, Dai D, Yin C. USP10 Alleviates sepsis-induced acute kidney injury by regulating Sirt6-mediated Nrf2/ARE signaling pathway. J Inflamm (Lond). (2021) 18(1):25. doi: 10.1186/s12950-021-00291-7
Keywords: tuberculosis, bone tuberculosis, joint tuberculosis, machine learning algorithms, prediction model, nomogram
Citation: Ye Z, Zhu J, Liu C, Lu Q, Wu S, Zhou C, Liang T, Jiang J, Li H, Chen T, Chen J, Deng G, Yao Y, Liao S, Yu C, Sun X, Chen L, Guo H, Chen W, Jiang W, Fan B, Tao X, Yang Z, Gu W, Wang Y and Zhan X (2023) Difference between the blood samples of patients with bone and joint tuberculosis and patients with tuberculosis studied using machine learning. Front. Surg. 9:1031105. doi: 10.3389/fsurg.2022.1031105
Received: 29 August 2022; Accepted: 21 October 2022;
Published: 6 January 2023.
Edited by:
Wenle Li, Xiamen University, ChinaReviewed by:
Shengtao Dong, Second Affiliated Hospital of Dalian Medical University, ChinaCheng Xu, Zhejiang Taizhou Hospital, China
Haosheng Wang, Nanjing Drum Tower Hospital, China
© 2023 Ye, Zhu, Liu, Lu, Wu, Zhou, Liang, Jiang, Li, Chen, Chen, Deng, Yao, Liao, Yu, Sun, Chen, Guo, Chen, Jiang, Fan, Tao, Yang, Gu, Wang and Zhan. This is an open-access article distributed under the terms of the Creative Commons Attribution License (CC BY). The use, distribution or reproduction in other forums is permitted, provided the original author(s) and the copyright owner(s) are credited and that the original publication in this journal is cited, in accordance with accepted academic practice. No use, distribution or reproduction is permitted which does not comply with these terms.
*Correspondence: Xinli Zhan emhhbnhpbmxpQHN0dS5neG11LmVkdS5jbg==
†These authors have contributed equally to this work
Specialty Section: This article was submitted to Orthopedic Surgery, a section of the journal Frontiers in Surgery