 Xiao-Nan Zhang†
 Jing-Liang Cheng
94% of researchers rate our articles as excellent or good
Learn more about the work of our research integrity team to safeguard the quality of each article we publish.
Find out more
ORIGINAL RESEARCH article
Front. Surg., 10 September 2021
Sec. Obstetrics and Gynecological Surgery
Volume 8 - 2021 | https://doi.org/10.3389/fsurg.2021.726067
Objective: The present study aimed to explore the application value of magnetic resonance imaging (MRI) histograms with multiple sequences in the preoperative differential diagnosis of endometrial stromal sarcoma (ESS) and degenerative hysteromyoma (DH).
Methods: The clinical and preoperative MRI data of 20 patients with pathologically confirmed ESS and 24 patients with pathologically confirmed DH were retrospectively analyzed, forming the two study groups. Mazda software was used to select the MRI layer with the largest tumor diameter in T2WI, the apparent diffusion coefficient (ADC), and enhanced T1WI (T1CE) images. The region of interest (ROI) was outlined for gray-scale histogram analysis. Nine parameters—the mean, variance, kurtosis, skewness, 1st percentile, 10th percentile, 50th percentile, 90th percentile, and 99th percentile—were obtained for intergroup analysis, and the receiver operating curves (ROCs) were plotted to analyze the differential diagnostic efficacy for each parameter.
Results: In the T2WI histogram, the differences between the two groups in seven of the parameters (mean, skewness, 1st percentile, 10th percentile, 50th percentile, 90th percentile, and 99th percentile) were statistically significant (P < 0.05). In the ADC histogram, the differences between the two groups in three of the parameters (skewness, 10th percentile, and 50th percentile) were statistically significant (P < 0.05). In the T1CE histogram, no significant differences were found between the two groups in any of the parameters (all P > 0.05). Of the nine parameters, the 50th percentile was found to have the best diagnostic efficacy. In the T2WI histogram, ROC curve analysis of the 50th percentile yielded the best area under the ROC curve (AUC; 0.742), sensitivity of 70%, and specificity of 83.3%. In the ADC histogram, ROC curve analysis of the 50th percentile yielded the best area under the ROC curve (AUC; 0.783), sensitivity of 81%, and specificity of 76.9%.
Conclusion: The parameters of the mean, 10th percentile and 50th percentile in the T2WI histogram have good diagnostic efficacy, providing new methods and ideas for clinical diagnosis.
Endometrial stromal sarcoma (ESS) is a rare gynecological tumor and the second most malignant mesenchymal tumor after uterine smooth-muscle sarcoma (1), accounting for 0.2–1% of uterine malignancies and <10% of uterine mesenchymal tumors (2). Endometrial mesenchymal tumors and related tumors can be categorized into different subtypes, including low-grade malignant ESS, highly malignant ESS, and undifferentiated uterine sarcoma (UUS) (3). In general, ESS manifests as a large polypoid mass in the endometrial cavity with varying degrees of myometrial infiltration, and distant metastases can occur at an early stage.
Uterine fibroids are the most common benign tumors of the female reproductive system. When the fibroids grow to a certain extent and degeneration occurs within the tumor (degenerative hysteromyoma, DH), the manifestation in conventional magnetic resonance imaging (MRI) is similar to that of ESS and, therefore, is easily misdiagnosed. Early differentiation between these two types of tumors is crucial in guiding treatment and the choice of surgical approach. For example, uterine fibroids can be treated with a range of approaches, including observation, hormonal therapy, uterine artery embolization, myomectomy, and simple hysterectomy (4), whereas ESS requires staged surgery, including total extrafascial hysterectomy with or without bilateral salpingo-oophorectomy (5), which minimizes the risk of abdominal spread.
Texture analysis is a form of radiomics that refers to the quantitative measurement of histograms and the distribution or relationship of the pixel intensities within a region of interest (ROI) on an image. It provides a more complex characterization of a lesion than traditional metrics by assessing the lesion's heterogeneity and reflecting the characteristic parameters in the overall lesion (6). The quantitative measurements this method generates can also provide useful information for the identification of tumors. Histograms have been shown to be valuable in the diagnosis of gastrointestinal tumors (7, 8), breast tumors (9), prostate tumors (10), and head and neck tumors (11). Some studies have used the histograms of the apparent diffusion coefficient (ADC) to differentiate the uterine sarcoma from endometrial cancer (12) and to diagnose the histological grading of endometrial cancer (13). However, few studies have used multiple MRI parameters for analysis and differential diagnosis.
The present study aimed to evaluate the role of histograms with multiple MRI sequences in the analysis and differential diagnosis of ESS and DH.
The data of patients meeting the following criteria from January 2016 to December 2020 were retrospectively analyzed.
Inclusion criteria: (1) patients with ESS or DH confirmed by surgical pathology; (2) patients who underwent routine MRI within 2 weeks before surgery, including axial T1WI, T2WI, diffusion-weighted imaging (DWI), ADC, and contrast-enhanced (CE) T1WI (T1CE); (3) patients with a single tumor with a maximum diameter ≥2.0cm or multiple tumors with a maximum diameter of the largest lesion ≥2.0cm (only the largest lesion was analyzed).
Exclusion criteria: (1) patients who had received other relevant treatment before the MRI examination; (2) patients with other uterine diseases; (3) patients with poor MR image quality that affected analysis.
A total of 44 patients were enrolled, including 20 with ESS (15 cases with low-grade ESS, five cases with high-grade ESS), and 24 with DH. The age range in the ESS group was 21–76 years (44.8 ± 15.01), the main symptom was irregular vaginal hemorrhage, and the maximum diameter of the lesion was 3.0–8.5 cm. The age range in the DH group was 22–77 years (42.6 ± 11.63), the lesion was mainly detected by physical examination, and the maximum diameter of the lesion was 2.5–10.5 cm. The details are shown in Table 1.
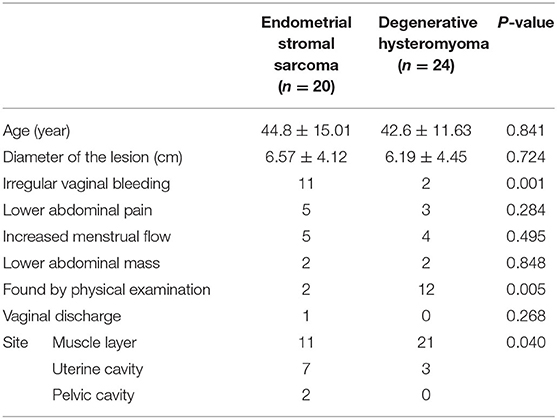
Table 1. The clinical characteristics in the patients.
The ethics committee of our hospital approved the study, and the requirement for informed consent was waived.
Conventional plain MRI, DWI, and enhanced scanning with a Siemens Skyra 3.0T superconducting MR scanner (Siemens, Germany) was conducted in all patients, with a body coil and a scan center located 2 cm above the pubic symphysis. Patients were instructed to lie in a supine position and maintain steady breathing. Conventional MRI scan sequences included the plain T1WI (transverse axial), T2WI (transverse and sagittal), DWI (transverse axial), and DWI images, with b-values of 0 and 800 s/mm2, respectively. ADC maps were automatically reconstructed after scanning. Enhancement scans were performed by a rapid (<10 s) bolus injection of gadopentetate dimeglumine (Gd-DTPA) via the elbow vein with a high-pressure syringe at a dose of 0.2 mmol/kg and a rate of 2–3 ml/s. One phase of plain scanning was conducted before injection, and 23 phases of uninterrupted repeat scanning were performed after injection. Delayed scanning was then performed. The sequences and parameters are shown in Table 2.
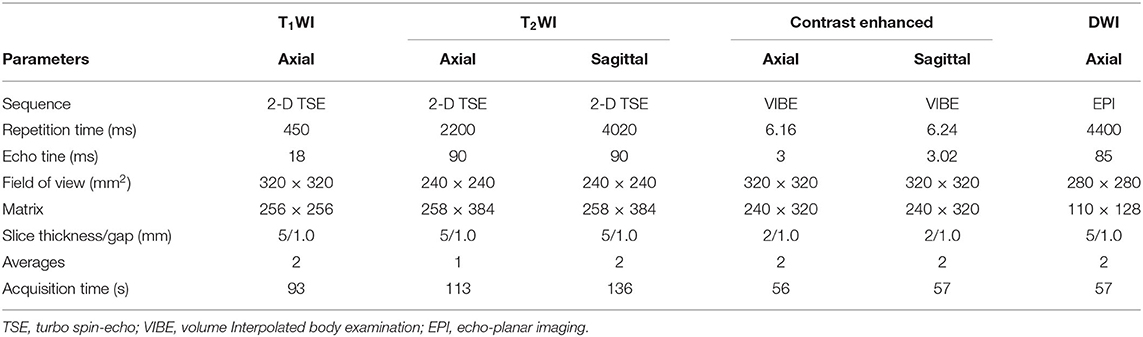
Table 2. Imaging protocol for MRI sequences.
The MR images of all patients were exported from the PACS workstation and stored in.bmp format. For each patient, the T2WI, ADC, and T1CE images in the transaxial plane on the largest layer of the tumor were selected. The window width and position were adjusted so that all images were consistent. The selected transverse-plane T2WI, ADC, and T1CE images were analyzed using MaZda version 4.6 (Technical University of Lodz, Poland, http://www.eletel.p.lodz.pl/programy/mazda/). Before extraction of the texture feature, all images were normalized in the range of [μ – 3δ, μ + 3δ] (μ and δ were the average gray value and standard deviation, respectively) for the gray level to minimize the effects of contrast and luminance variations. The region of interest (ROI) was manually outlined along the edge of the lesion, the tumor area was filled with red, and the histogram was automatically generated by the software (see Figures 1–4). The horizontal coordinate in the histogram represented the different gray values within the ROI, and the vertical coordinate represented the frequency of occurrence of each gray value. The software automatically calculated the corresponding nine histogram parameters—the mean, variance, skewness, kurtosis, 1st percentile, 10th percentile, 50th percentile, 90th percentile, and 99th percentile. Two physicians with 5 and 3 years, respectively, of experience in MR imaging, then analyzed and measured the images using a double-blind method, and the average of the two was taken for analysis.
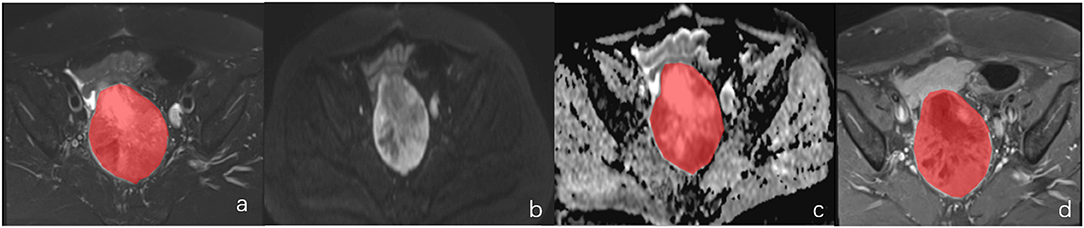
Figure 1. A female of 60 years with endometrial mesenchymal sarcoma. (a–d) represented the localization of the lesion on DWI and the ROI selection schematic for T2WI, ADC and T1CE, respectively.
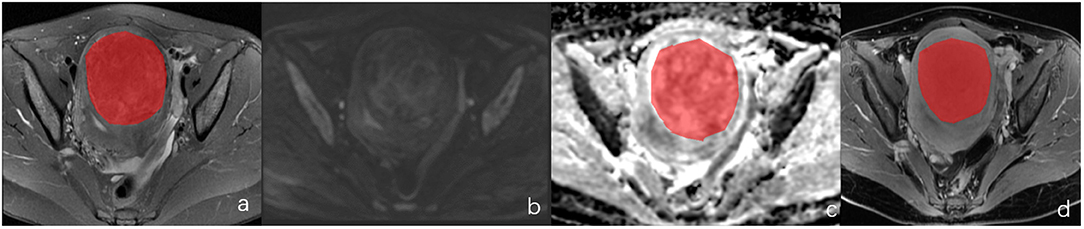
Figure 2. A female of 46 years with degenerative hysteromyoma. (a–d) represented the localization of the lesion on DWI and the ROI selection schematic for T2WI, ADC and T1CE, respectively.
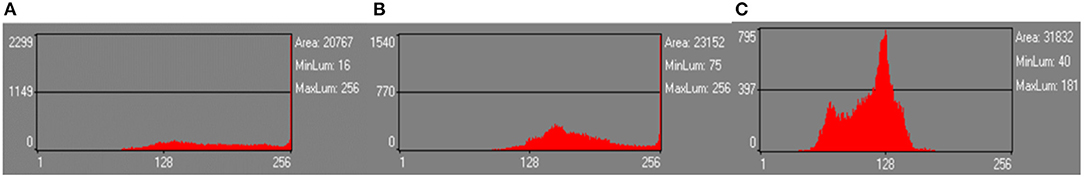
Figure 3. The same case as in Figure 1. (A–C) was the histograms of T2WI, ADC, and T1CE plots, respectively.
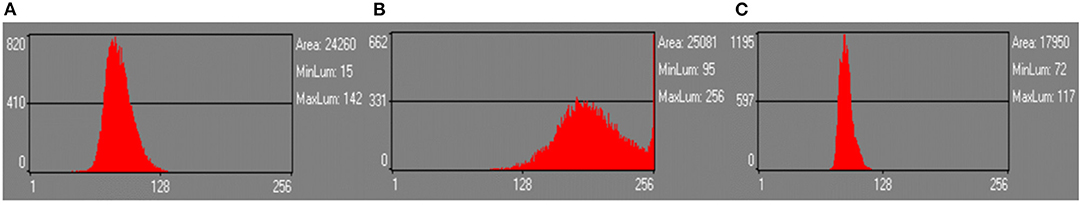
Figure 4. The same case as in Figure 2. (A–C) were the histograms of T2WI, ADC, and T1CE plots, respectively.
SPSS 21.0 statistical software was used for analysis, and the intra-class correlation coefficient (ICC) was utilized to evaluate the consistency of the results measured by the two observers. Data satisfying the normal distribution were expressed as mean ± standard deviation and tested using an independent sample t-test. Those not satisfying the normal distribution were expressed as median ± interquartile range and tested using the Mann–Whitney U test. P < 0.05 was considered statistically significant. The ROC curve and Youden index were used to evaluate the diagnostic efficacy of each histogram parameter.
The nine parameters (mean, variance, skewness, kurtosis, 1st percentile, 10th percentile, 50th percentile, 90th percentile, and 99th percentile) obtained from the T2WI, ADC, and T1CE images of the two types of tumors measured by the two observers were in good agreement, with the ICC ranging from 0.990 to 0.741 (P < 0.001). Therefore, the average value measured by the two observers was taken as the final evaluation index. The details are shown in Table 3.
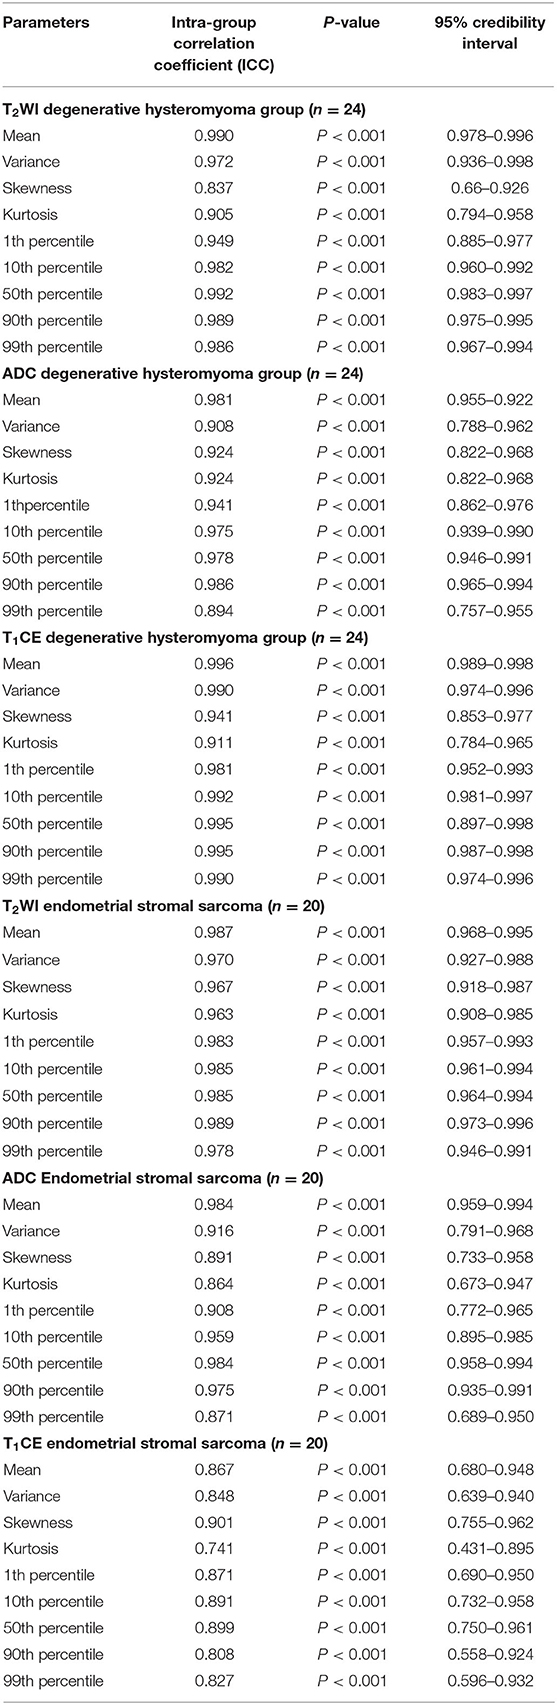
Table 3. Consistency or correlation test for different parameter values between two observers.
The variance and kurtosis parameters in the T2WI, ADC, and T1CE histograms did not satisfy either the normal distribution or variance χ2 test, so the Mann–Whitney U test was used to compare the two groups for these parameters. The remaining parameters in the T2WI, ADC, and T1CE histograms (mean, skewness, 1st percentile, 10th percentile, 50th percentile, 90th percentile, and 99th percentile) all satisfied the normal distribution and homogeneity of variance, so an independent sample t-test was adopted for comparison between groups for these parameters.
The results showed that, of the nine gray-scale parameters obtained from T2WI histograms, seven (mean, skewness, 1st percentile, 10th percentile, 50th percentile, 90th percentile, and 99th percentile) had statistically significant differences between the two groups (P < 0.05). However, the differences between the two groups in the variance and kurtosis parameters were not statistically significant (P > 0.05). In the comparison of ADC histogram parameters, there was a statistically significant difference between the two groups in three of the parameters (skewness, 10th percentile, and 50th percentile) (all P < 0.05). There was no statistically significant difference between the two groups in six of the parameters (mean, variance, kurtosis, 1st percentile, 90th percentile, and 99th percentile) (all P > 0.05). None of the nine parameters in the T1CE histogram showed statistically significant differences between the two groups (P > 0.05).
The statistical results of the histogram parameters across the two groups are shown in Table 4.
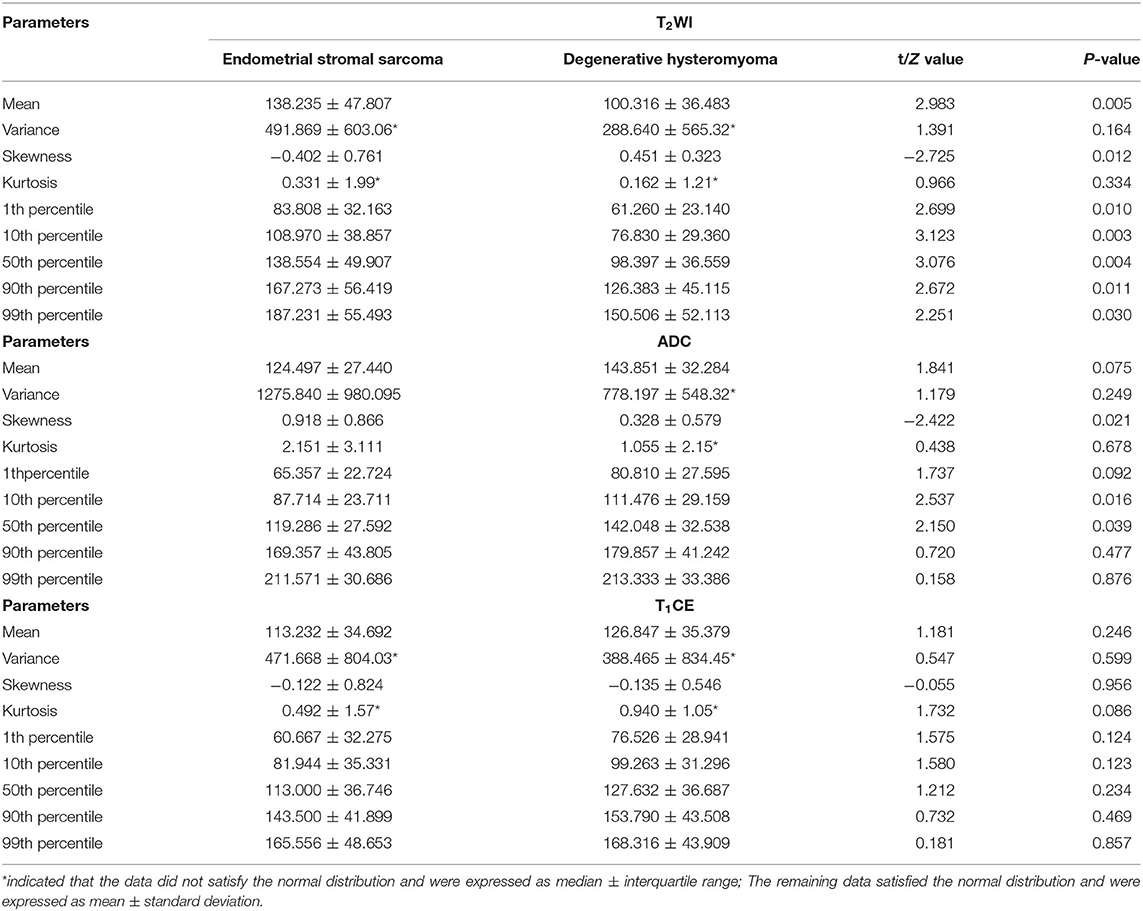
Table 4. Comparison of histogram parameters between the endometrial mesenchymal sarcoma and degenerative hysteromyoma.
The ROC and Youden indexes were used to evaluate the differential diagnostic efficacy of the seven meaningful parameters in the T2WI histogram and the three meaningful parameters in the ADC histogram in ESS and DH, respectively. The area under the curve (AUC), optimal threshold, sensitivity, specificity, Youden index, and P-values are shown in Table 5.
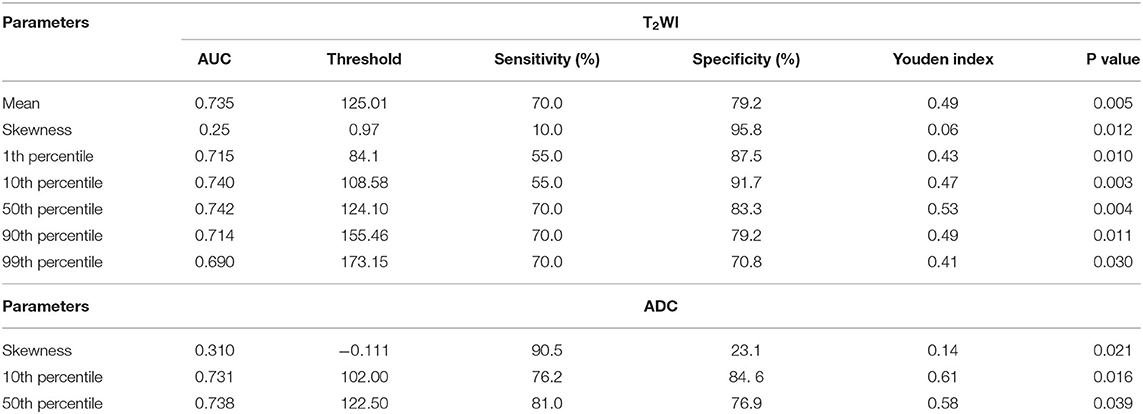
Table 5. Diagnostic efficacy of the histogram parameters for endometrial mesenchymal sarcoma and degenerative hysteromyoma.
Of the seven meaningful parameters in the T2WI histogram, five had an AUC > 0.7 (see Figures 5, 6), with the AUC for the 50th percentile being the largest (AUC = 0.742; P < 0.01) and having a sensitivity of 70% and a specificity of 83.3%. Of the three meaningful parameters in the ADC histogram, two had an AUC > 0.7 (see Figures 7, 8), with the AUC for the 50th percentile also being the largest (AUC = 0.738; P < 0.05) and having a sensitivity of 81% and a specificity of 76.9%.

Figure 5. The ROC curves of the mean, 1st percentile, 10th percentile, 50th percentile, 90th percentile, and 99th percentile in T2WI histogram between the endometrial mesenchymal sarcoma group and degenerative hysteromyoma group.
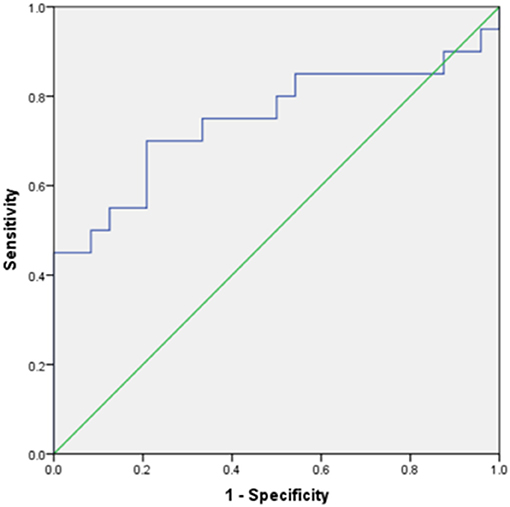
Figure 6. The ROC curve of skewness in the T2WI histogram between the endometrial mesenchymal sarcoma group and degenerative hysteromyoma group.
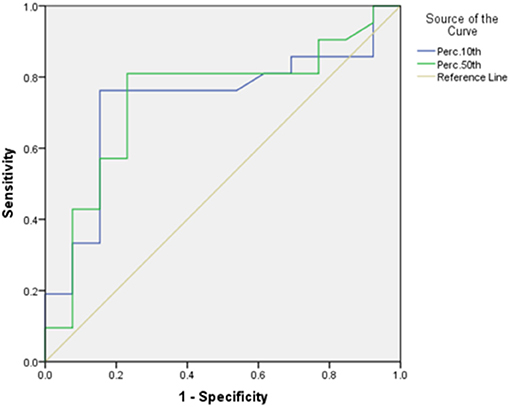
Figure 7. The ROC curves of the 10th percentile, 50th percentile in the ADC histogram between the endometrial mesenchymal sarcoma group and degenerative hysteromyoma group.
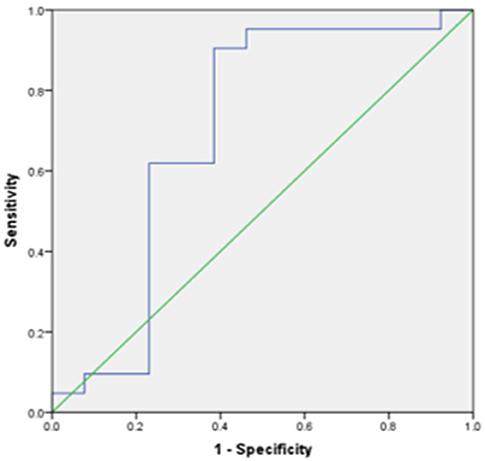
Figure 8. The ROC curve of skewness in the ADC histogram between the endometrial mesenchymal sarcoma group and degenerative hysteromyoma group.
ESS is a rare clinical malignancy of the female reproductive system originating from the endometrial mesenchymal cells, with a prevalence age of 40–60 years (14). It occurs mainly in the myometrium or endometrium and occasionally in extrauterine sites, such as the ovaries, peritoneum, and vagina (15). In the present study, ESS was located in the myometrium in 11 cases, in the uterine cavity in seven cases, and in the pelvis in two cases. Common symptoms of ESS are irregular vaginal bleeding, asymptomatic uterine enlargement, and lower abdominal or pelvic masses. On MRI, ESS appears as a heterogeneous high signal on T2WI, depending on the number of tumor components with cystic changes, hemorrhage, and necrosis. Previous studies have shown that the low signal bands within the infiltrated areas of the myometrium on T2WI, which correlate with the histopathologically preserved normal muscle bundles in the myometrium, are characteristic of ESS (16).
Uterine fibroids originate from the proliferation of uterine smooth-muscle cells and connective tissues and are most common in women of childbearing age. When the uterine fibroids degenerate, the lesion components are more complex, and the signal in T2WI is mostly heterogeneous. There is considerable overlap between ESS and DH regarding age and site of onset, clinical presentation, and imaging manifestations (17). This creates difficulties in the clinical differential diagnosis of the two conditions.
It has been previously reported that ADC values help to differentiate uterine sarcomas from DH (18), and the average ADC value in uterine sarcomas has been found to be significantly lower than in DH. In the present study, the differences in the average ADC values between the ESS and DH groups were statistically significant, and the average ADC value in the ESS group was smaller than that in the DH group, further demonstrating the importance of ADC values in the differential diagnosis between the two diseases. The present study also found that the differences in the average values between the ESS and DH groups were statistically significant in the T2WI histogram parameters and the parameters in the ESS group were slightly larger. This indicates that the lesions in the ESS group had higher signal intensity in the imaging, which might correlate with the fact that an ESS tumor resembles proliferative endometrial interstitial cell components and contains abundant mucus components, and the literature consistently reports this (19).
ESS has a rich blood supply and high microvessel density, showing obvious enhancement in the early stage and maintaining a high enhancement level in later stages. In contrast, enhancement in DH occurs later and is slightly lower (20). The differences in the average values between the two groups in the T1CE histogram were not statistically significant. However, the average value in the DH group was slightly higher than that in the ESS group, which was not consistent with previous literature. This may be because the T1CE delayed sequence scan time of 125 s after drug injection was adopted in the present study, meaning the delayed sequence failed to reflect the degree of enhancement at the early stage.
Previous studies have usually been limited to comparing the average values in ADC or T2WI, ignoring the heterogeneous features within a tumor. Gray-scale histogram analysis is a pixel distribution-based image analysis method that can extract the gray-scale intensity distribution of an ROI in a lesion in multi-parameter MR images for evaluation and obtain multiple histogram parameters. It can thereby objectively evaluate the heterogeneity of different types of tumors in a non-invasive and quantitative way. This technology can capture information about nuances that are invisible to the naked eye. With this image processing tool, the extracted histogram features can also be correlated with the biological behavior of tumors, which has clinical implications for tumor treatment and prognosis (21). Previous studies have mainly used the ADC histogram for tumor differentiation, but the histogram parameters in multiple MRI sequences for tumor analysis are less frequently studied. Currently, no relevant literature has been reviewed nationally or internationally on ESS identification using multiple MRI sequence histogram parameters.
In the present study, the histogram parameters in the T2WI, ADC, and T1CE histograms were analyzed. The results showed statistically significant differences in seven parameters in the T2WI histogram and three parameters in the ADC histogram, with the 10th percentile and 50th percentile showing better diagnostic efficacy. Of the seven T2WI histogram parameters, the 50th percentile had the best diagnostic efficacy (with an AUC of 0.742) and good sensitivity and specificity.
The percentile value describes the distribution of each gray value between the maximum and minimum values and is correlated with the heterogeneity of a tumor. The nth percentile means that n% of the data in the present column has a value less than or equal to this value (22). In the T2WI histogram, the 50th percentile in the ESS group was higher than that in the DH group, indicating that the 50th percentile voxel values in the ESS group were higher than those in the DH group. In the ADC histogram, the 50th percentile in the ESS group was lower than that in the DH group, indicating that the 50th percentile voxel values in the DH group were higher than those in the ESS group, and all the percentile values in the DH group were higher than those in the ESS group. This was correlated with the restricted diffusion of water molecules and lower ADC values caused by the active proliferation, increased cell density, tighter arrangement, and reduced extracellular space in the ESS group.
Kurtosis and skewness are parameters that describe the distribution of histogram curves and are commonly used indicators reflecting tumor heterogeneity (23). Kurtosis reflects the steepness of the distribution pattern of histogram gray-scale values—the larger the kurtosis, the greater the slope of distribution. In the present study, there was no statistically significant difference in kurtosis between the two groups of tumors on the T2WI, ADC, and T1CE histograms. The ESS group had higher kurtosis values on the T2WI and ADC histograms than the DH group, which might be attributable to the internal structure and greater heterogeneity of the various components of ESS than DH. Skewness reflects the asymmetry of the distribution of histogram gray-scale values—the larger the absolute value of the skewness, the greater the skewness of the distribution (24). In the present study, the differences between the two groups in skewness in the T2WI and ADC histograms were statistically significant. In the T2WI histogram, the skewness was negative in value, and the absolute value of skewness between the ESS and DH groups was not significantly different. This might be due to the complex composition of both types of tumors and the large heterogeneity within the tumors. However, the difference in skewness between the two groups in the ADC histogram has a better diagnostic value and high sensitivity.
The present study had some limitations. First, it was a retrospective analysis study, using a small sample without external validation; especially, the ESS group was not compared hierarchically. Further research will need to expand the sample size. Second, for the ROI, only the largest tumor layer was selected for histogram analysis, and the image texture information was not extracted comprehensively. Last, the correlation between the significance of each parameter and the biological mechanisms and clinical indicators of tumors was not sufficiently studied and needs to be investigated more thoroughly in future research. The research on the texture analysis of uterine tumors is still in the preliminary stage. Further studies are necessary before introducing radiomics features into the clinical workflow of uterine tumors.
The findings in the present study suggest that the application of T2WI and ADC histogram analysis has clinical diagnostic value for the differentiation between ESS and DH. The mean, 10th percentile and 50th percentile parameters in the T2WI histogram have good diagnostic efficacy, providing new methods and ideas for clinical diagnosis.
The original contributions presented in the study are included in the article/supplementary material, further inquiries can be directed to the corresponding author/s.
The studies involving human participants were reviewed and approved by ethics committee of The First Affiliated Hospital of Zhengzhou University. The patients/participants provided their written informed consent to participate in this study.
X-NZ, MB, and J-LC conceived the idea, conceptualized the study, and drafted and reviewed the manuscript. K-RM collected the data. YZ, C-RS, and Z-XZ analyzed the data. All authors read and approved the final draft.
The authors declare that the research was conducted in the absence of any commercial or financial relationships that could be construed as a potential conflict of interest.
All claims expressed in this article are solely those of the authors and do not necessarily represent those of their affiliated organizations, or those of the publisher, the editors and the reviewers. Any product that may be evaluated in this article, or claim that may be made by its manufacturer, is not guaranteed or endorsed by the publisher.
1. D'Angelo E, Prat J. Uterine sarcomas: a review. Gynecol Oncol. (2010) 116:131–9. doi: 10.1016/j.ygyno.2009.09.023
2. Puliyath G, Nair MK. Endometrial stromal sarcoma: a review of the literature. Indian J Med Paediatr Oncol. (2012) 33:1–6. doi: 10.4103/0971-5851.96960
3. Huang YT, Huang YL, Ng KK, Lin G. Current status of magnetic resonance imaging in patients with malignant uterine neoplasms: a review. Korean J Radiol. (2019) 20:18–33. doi: 10.3348/kjr.2018.0090
4. Marret H, Fritel X, Ouldamer L, Bendifallah S, Brun JL, De Jesus I, et al. Therapeutic management of uterine fibroid tumors: updated French guidelines. Eur J Obstet Gynecol Reprod Biol. (2012) 165:156–64. doi: 10.1016/j.ejogrb.2012.07.030
5. Gadducci A, Cosio S, Romanini A, Genazzani AR. The management of patients with uterine sarcoma: a debated clinical challenge. Crit Rev Oncol Hematol. (2008) 65:129–42. doi: 10.1016/j.critrevonc.2007.06.011
6. Thomas JV, Abou Elkassem AM, Ganeshan B, Smith AD. MR imaging texture analysis in the abdomen and pelvis. Magn Reson Imaging Clin N Am. (2020) 28:447–56. doi: 10.1016/j.mric.2020.03.009
7. Lu J, Hu D, Tang H, Hu X, Shen Y, Li Z, et al. Assessment of tumor heterogeneity: differentiation of periampullary neoplasms based on CT whole-lesion histogram analysis. Eur J Radiol. (2019) 115:1–9. doi: 10.1016/j.ejrad.2019.03.021
8. Zhang H, Li W, Hu F, Sun Y, Hu T, Tong T. MR texture analysis: potential imaging biomarker for predicting the chemotherapeutic response of patients with colorectal liver metastases. Abdom Radiol. (2019) 44:65–71. doi: 10.1007/s00261-018-1682-1
9. Jin YN, Zhang Y, Cheng JL, Zhang XP, Hu Y, Shao XN. The role of histogram analysis in diffusion-weighted imaging in the differential diagnosis of benign and malignant breast lesions. BMC Med Inform Decis Mak. (2020) 20:239. doi: 10.1186/s12911-020-01257-0
10. Hameed M, Ganeshan B, Shur J, Mukherjee S, Afaq A, Batura D. The clinical utility of prostate cancer heterogeneity using texture analysis of multiparametric MRI. Int Urol Nephrol. (2019) 51:817–24. doi: 10.1007/s11255-019-02134-0
11. Ma G, Zhu LN, Su GY, Hu H, Qian W, Bu SS, et al. Histogram analysis of apparent diffusion coefficient maps for differentiating malignant from benign parotid gland tumors. Eur Arch Otorhinolaryngol. (2018) 275:2151–7. doi: 10.1007/s00405-018-5052-y
12. Takahashi M, Kozawa E, Tanisaka M, Hasegawa K, Yasuda M, Sakai F. Utility of histogram analysis of apparent diffusion coefficient maps obtained using 3.0T MRI for distinguishing uterine carcinosarcoma from endometrial carcinoma. J Magn Reson Imaging. (2016) 43:1301–7. doi: 10.1002/jmri.25103
13. Woo S, Cho JY, Kim SY, Kim SH. Histogram analysis of apparent diffusion coefficient map of diffusion-weighted MRI in endometrial cancer: a preliminary correlation study with histological grade. Acta Radiol. (2014) 55:1270–7. doi: 10.1177/0284185113514967
14. Flicker K, Smolle E, Haybaeck J, Moinfar F. Genomic characterization of endometrial stromal sarcomas with array comparative genomic hybridization. Exp Mol Pathol. (2015) 98:367–74. doi: 10.1016/j.yexmp.2015.03.009
15. Amant F, Coosemans A, Debiec-Rychter M, Timmerman D, Vergote I. Clinical management of uterine sarcomas. Lancet Oncol. (2009) 10:1188–98. doi: 10.1016/S1470-2045(09)70226-8
16. Koyama T, Togashi K, Konishi I, Kobayashi H, Ueda H, Kataoka ML, et al. MR imaging of endometrial stromal sarcoma: correlation with pathologic findings. AJR Am J Roentgenol. (1999) 173:767–72. doi: 10.2214/ajr.173.3.10470920
17. Kim TH, Kim JW, Kim SY, Kim SH, Cho JY. What MRI features suspect malignant pure mesenchymal uterine tumors rather than uterine leiomyoma with cystic degeneration? J Gynecol Oncol. (2018) 29:e26. doi: 10.3802/jgo.2018.29.e26
18. Namimoto T, Yamashita Y, Awai K, Nakaura T, Yanaga Y, Hirai T, et al. Combined use of T2-weighted and diffusion-weighted 3-T MR imaging for differentiating uterine sarcomas from benign leiomyomas. Eur Radiol. (2009) 19:2756–64. doi: 10.1007/s00330-009-1471-x
19. Rahimifar P, Hashemi H, Malek M, Ebrahimi S, Tabibian E, Alidoosti A, et al. Diagnostic value of 3 T MR spectroscopy, diffusion-weighted MRI, and apparent diffusion coefficient value for distinguishing benign from malignant myometrial tumours. Clin Radiol. (2019) 74:571.e9–571.e18. doi: 10.1016/j.crad.2019.03.011
20. Goto A, Takeuchi S, Sugimura K, Maruo T. Usefulness of Gd-DTPA contrast-enhanced dynamic MRI and serum determination of LDH and its isozymes in the differential diagnosis of leiomyosarcoma from degenerated leiomyoma of the uterus. Int J Gynecol Cancer. (2002) 12:354–61. doi: 10.1046/j.1525-1438.2002.01086.x
21. Ravanelli M, Grammatica A, Maddalo M, Ramanzin M, Agazzi GM, Tononcelli E, et al. Pretreatment DWI with histogram analysis of the ADC in predicting the outcome of advanced oropharyngeal cancer with known human papillomavirus status treated with chemoradiation. AJNR Am J Neuroradiol. (2020) 41:1473–9. doi: 10.3174/ajnr.A6695
22. Just N. Improving tumour heterogeneity MRI assessment with histograms. Br J Cancer. (2014) 111:2205–13. doi: 10.1038/bjc.2014.512
23. Zhang YD, Wang Q, Wu CJ, Wang XN, Zhang J, Liu H, et al. The histogram analysis of diffusion-weighted intravoxel incoherent motion (IVIM) imaging for differentiating the gleason grade of prostate cancer. Eur Radiol. (2015) 25:994–1004. doi: 10.1007/s00330-014-3511-4
Keywords: endometrial stromal sarcoma, degenerative hysteromyoma, magnetic resonance imaging, histogram analysis, preoperative differential diagnosis
Citation: Zhang X-N, Bai M, Ma K-R, Zhang Y, Song C-R, Zhang Z-X and Cheng J-L (2021) The Value of Magnetic Resonance Imaging Histograms in the Preoperative Differential Diagnosis of Endometrial Stromal Sarcoma and Degenerative Hysteromyoma. Front. Surg. 8:726067. doi: 10.3389/fsurg.2021.726067
Received: 16 June 2021; Accepted: 26 July 2021;
Published: 10 September 2021.
Edited by:
Vito Andrea Capozzi, University Hospital of Parma, ItalyReviewed by:
Luciano Monfardini, University of Parma, ItalyCopyright © 2021 Zhang, Bai, Ma, Zhang, Song, Zhang and Cheng. This is an open-access article distributed under the terms of the Creative Commons Attribution License (CC BY). The use, distribution or reproduction in other forums is permitted, provided the original author(s) and the copyright owner(s) are credited and that the original publication in this journal is cited, in accordance with accepted academic practice. No use, distribution or reproduction is permitted which does not comply with these terms.
*Correspondence: Jing-Liang Cheng, Y2hlbmdqaW5nbGlhbmcwMDNAMTYzLmNvbQ==
†These authors have contributed equally to this work
Disclaimer: All claims expressed in this article are solely those of the authors and do not necessarily represent those of their affiliated organizations, or those of the publisher, the editors and the reviewers. Any product that may be evaluated in this article or claim that may be made by its manufacturer is not guaranteed or endorsed by the publisher.
Research integrity at Frontiers
Learn more about the work of our research integrity team to safeguard the quality of each article we publish.