- 1School of Management, China Institute for Studies in Energy Policy, Collaborative Innovation Center for Energy Economics and Energy Policy, Xiamen University, Xiamen, China
- 2Belt and Road Research Institute, Xiamen University, Fujian, China
The global phenomenon of environmental deterioration often signifies the increase in ecological footprint and emissions levels that adversely affect the earth's biocapacity. This results from the use of substantial fossil fuels energy sources, industrialization, and extensive economic activities in developing countries. In this context, the study examine the impact of energy depletion, technical cooperation grants, and industrialization, on the load capacity factor of Pakistan from 1970 to 2022. To accomplish this, this study employs the innovative dynamic autoregressive distributed lag (ARDL) simulation approach, providing fresh insights that contrast with earlier conclusions. The authors contribute to focusing the supply-side dynamics of ecological deterioration indicators, namely load capacity, from the viewpoint of Pakistan, distinguishing our research from existing academic publications. Our results, however, demonstrate a markedly favorable effect of technical cooperation grants on the load capacity factor in enhancing environmental safety. Furthermore, energy depletion and industrialization adversely impact the load capacity dynamics, exacerbating environmental deterioration. Moreover, the study conducts a sensitivity analysis by comparing the results obtained using the load capacity factor with those derived from ecological footprints. Consequently, we advocate for the development of realistic policies to mitigate the adverse impacts of energy depletion and industrialization via the effective use of energy sources to preserve biodiversity.
1 Introduction
Due to the rapid advancements of industrialization, carbon emissions into the Earth's atmosphere have been significantly increased by human activities (United Nations, 2023). The primary cause of this increase is attributed to the burning of fossil fuels, including natural gas, coal, and petroleum (Lin and Ullah, 2024a). As a result, the Earth's average surface temperature has been rising gradually, which has had disastrous consequences in the form of rising sea levels, heat waves, floods, and droughts. Moreover, the acidification of seas, depletion of biodiversity, and several other biological and environmental consequences have been ascribed to carbon emissions produced by human activity (Tang and Kim, 2023). The weather patterns pose a significant threat to the existence of humanity as a result of global warming. It is crucial to address this problem and take action to decrease CO2 emissions, therefore mitigating the impacts of climate change on our world and safeguarding the wellbeing of future generations. In order to achieve this, it is necessary to identify climate-triggering indicators. Our research emphasizes the significance of END, TCG, and IND as significant environmental factors, all of which have hitherto been disregarded concerning environmental sustainability.
Pakistan is a populous country with expanding industrial and agricultural sectors, and addressing energy and environmental challenges is crucial for sustainable development. Energy scarcity and dependence on fossil fuels affect Pakistan's economic and social wellbeing and exacerbate global concerns such as climate change and air pollution. Moreover, Pakistan's diverse ecosystems, like mangroves and glaciers, are at risk of degradation and loss, affecting global biodiversity and water resources (Liu et al., 2022). Pakistan is the sixth most populous country in the world, and its energy demands are growing to support economic development and improve the quality of life of its citizens (Raza et al., 2022). Meeting these energy needs sustainably and efficiently is critical for Pakistan and global energy security and stability (Tao et al., 2022; Jiakui et al., 2023). Energy depletion has received widespread attention in recent years as an urgent issue. Fossil fuels have been the primary energy source for centuries, but their use is rapidly diminishing due to their finite nature (Brodny and Tutak, 2023; Verelst et al., 2023). Finding sustainable energy alternatives has become most important as energy demand rises. There are numerous adverse effects associated with energy depletion, including resource scarcity, greenhouse gas emissions, pollution, and loss of habitats (Wang et al., 2023b; Yousaf Raza and Lin, 2023). The demand for fossil fuels has increased by 2.3% over the last 10 years, while global energy consumption has doubled (IEA, 2022).
Furthermore, the growing demand for electricity has increased energy consumption by 50% (Sun et al., 2023a). A rapid rise in the production of domestic and industrial products is causing developing countries to generate waste, extract resources, consume fossil fuels, and expand their ecological footprints (Kaplan et al., 2023). Overuse of ecosystem services, however, can also have negative consequences; for instance, it can lead to global warming, exacerbating the physical effects of climate change. The current issue with the ecosystem is that it lacks physical points of sale where one could say something like, “Sorry, we're out of stock.” We must decide how much of the ecosystem to deplete and when to expect a return (Gupta and Verma, 2023; Zhan et al., 2023). In this context, Pakistan possesses a plentiful supply of fossil fuels, raising questions about how the country's ecological wealth is reflected in exploiting these resources. According to the Energy Statistics, Pakistan used 61.59% fossil fuels to produce all the energy it consumed in 2014. According to a recent report by the IEA (2022), the transport sector in Pakistan accounts for 70% of the nation's carbon emissions, with the most widely used energy sources being petrol and oil (Raza and Lin, 2020). The transportation sector became the primary fuel-using Industry in 2018, with a 1.0373% increase in consumption, while the power generation and industrial sectors fell behind. Long- and short-term effects of Pakistan's ongoing energy resource depletion are detrimental to the country's environmental sustainability.
TCG play an essential role in tackling challenges posed by energy depletion. Developed countries and international organizations provide technical cooperation grants to developing countries to promote sustainable development and increase technological capabilities (Pandey et al., 2023). TCG can help reduce dependence on non-renewable energy sources and promote environmentally friendly practices by transferring knowledge, expertise, and advanced technologies (Engel-Cox and Chapman, 2023; Traoré and Asongu, 2023). Pakistan has provided technical assistance and training to scientists and engineers from other countries through the TCAP of the IAEA. In addition, Pakistan is a party to several international, bilateral, and multilateral agreements with the IAEA in nuclear power and safeguards (IAEA, 2023). In 2021, the PTCG (BoP, in current U.S. dollars) was valued at $23,102,000 (SBP, 2023). Moreover, IND is widely regarded as a tool for fostering economic growth and prosperity. On the contrary, rapid industrialization can also adversely affect the environment. The expected results of industrialization are the uncontrolled consumption of natural resources, excessive waste generation, and pollution (Usman and Balsalobre-Lorente, 2022; Huang et al., 2023). Using sustainable practices to balance industrialization with economic benefits is essential for a green and resilient economy.
The extant literature has examined several indicators of environmental degradation, including CO2 emissions (Raza and Lin, 2022), NO2 emissions (Martins da Silveira et al., 2023; Shen et al., 2023), SO2 emissions (Civan et al., 2015; Marć et al., 2016), methane (Guo et al., 2023; Ma et al., 2023), and overall greenhouse gases. However, it is not easy to access the data for SO2, NO2, and methane emissions, which account for a minimal percentage of GHG emissions. In contrast, the most studied proxy for environmental degradation is undoubtedly CO2 emissions. However, it contributes to 65% of greenhouse gas emissions, and the data is readily available (Lin and Ullah, 2024b). Environmental degradation may not be adequately measured by CO2 emissions only because they absorb airborne pollutants. This is especially true when ecological degradation occurs in soil, forests, and water resources (Ali et al., 2023a; Ullah et al., 2023). Some studies used ecological footprints as proxy measures of environmental degradation. These metrics cover the demand side of nature by using at least six indices, which include built-up land, cropland, grazing fields, fishing grounds, and carbon demand on land and forest (Aydin et al., 2019). In general, it indicates the magnitude of environmental pressures caused by human activities. This measure identifies how human consumption affects the environment and how naturally the planet regenerates (Bashir et al., 2023). Despite its superiority over CO2 emissions, the ecological footprint ignores nature's supply side (biocapacity). Thus, using an ecological footprint rather than a more comprehensive indicator may result in conflicting policy recommendations. The LCf is an essential tool for assessing inclusive ecological contamination. The LCF is calculated using the biocapacity/ecological footprint ratio. The LCF of an unsustainable environment is ≤ 1, whereas that of a sustainable environment is ≥1 (Siche et al., 2010).
Recently, LCF have received academic attention for their apparent applicability and contribution to the sustainability debate. Therefore, no study has examined the determinants of LCF in Pakistan. Against this background, the authors offer the following contributions to the literature: First, as far as the author knows, this study is the first that explored the dynamic nexus between END, TCG, IND, GDP, TO, and LCF. Second, the LCF variant yields more consistent and comprehensive results than the EFP variant. The comparison with EFP gives more insight into how various measurements reflect and portray environmental quality while acknowledging the varied character of sustainability. Thirdly, the most recent econometric techniques—like DARDL approaches—are applied to investigate the connections among END, TCG, IND, GDP, TO, and LCF. The results of the empirical analysis indicate that TCG help promote environmental sustainability in Pakistan. Fourth, we performed a machine learning technique, KLRS, for robustness. Therefore, with new variables and robust results, this analysis will likely add something new to the body of current knowledge. The study's final contribution shows how the factors under investigation—namely, END, TCG, and IND—affect environmental degradation. Policymakers are given recommendations based on these findings, which may help create Pakistan's ecological sustainability.
Five sections make up the study; the second part is a summary of earlier research. Data and methods are covered in the third part. Section four presents the results of the empirical research and their discussion. Section five offers conclusion and policies implication.
2 Theoretical setting and literature review
2.1 Theoretical settings
Energy depletion is the reduction in the supply of conventional energy sources, such as fossil fuels, due to depletion. As these resources become increasingly scarce, the extraction process tends to cause more damage to the environment. This leads to increased environmental degradation, including habitat destruction, water pollution and air pollution, which adversely affects sustainable development (Huang et al., 2024). Energy depletion can lead to higher energy costs and economic instability. Such economic pressures may undermine investment in sustainable practices and technologies. In addition, price increases resulting from END can make renewable energy more competitive, but this transition can be slow and uneven, thus affecting overall environmental sustainability efforts (Bota-Avram et al., 2024). Continued reliance on depleting fossil fuels will lead to increased greenhouse gas emissions and exacerbate climate change. As traditional energy sources diminish, more radical and less efficient extraction methods (e.g., deep sea drilling, tar sands) may be used, which will exacerbate pollution and climate impacts and directly challenge environmental sustainability (Sun and Yao, 2023). The threat of END tends to drive technological innovation and a shift to renewable energy sources. Investments in alternative energy technologies and improvements in energy efficiency are essential to mitigate the adverse effects of END. Such innovations can support environmentally sustainable development by reducing dependence on harmful energy sources and promoting cleaner energy solutions (Pang et al., 2024).
TCG are typically used to fund projects that increase the capacity of institutions and communities to implement sustainable practices. By providing specialized technical expertise and resources, these grants help local entities to adopt environmentally sound technologies and management practices, thereby contributing to the achievement of long-term sustainable development goals (Yang et al., 2024). Grants often support the transfer of innovative technologies and best practices from more developed to less developed regions. This may include advanced renewable energy technologies, efficient waste management systems or sustainable agricultural methods. By facilitating technology transfer, technical cooperation grants play a crucial role in the global diffusion of environmentally sustainable practices (Zhao, 2022). Technical cooperation grants can fund research and development (R&D) in environmental sustainability. This research may focus on finding new ways to mitigate environmental impacts, develop sustainable materials, or improve resource efficiency. The results of this research can lead to the development of new solutions that support sustainable development (Du et al., 2024). Grants are often used to support the development and implementation of environmental policies and regulations. By funding policy research, capacity-building and the establishment of regulatory frameworks, technical cooperation can help to establish and enforce standards that promote environmental protection and sustainability (Bega and Lin, 2024).
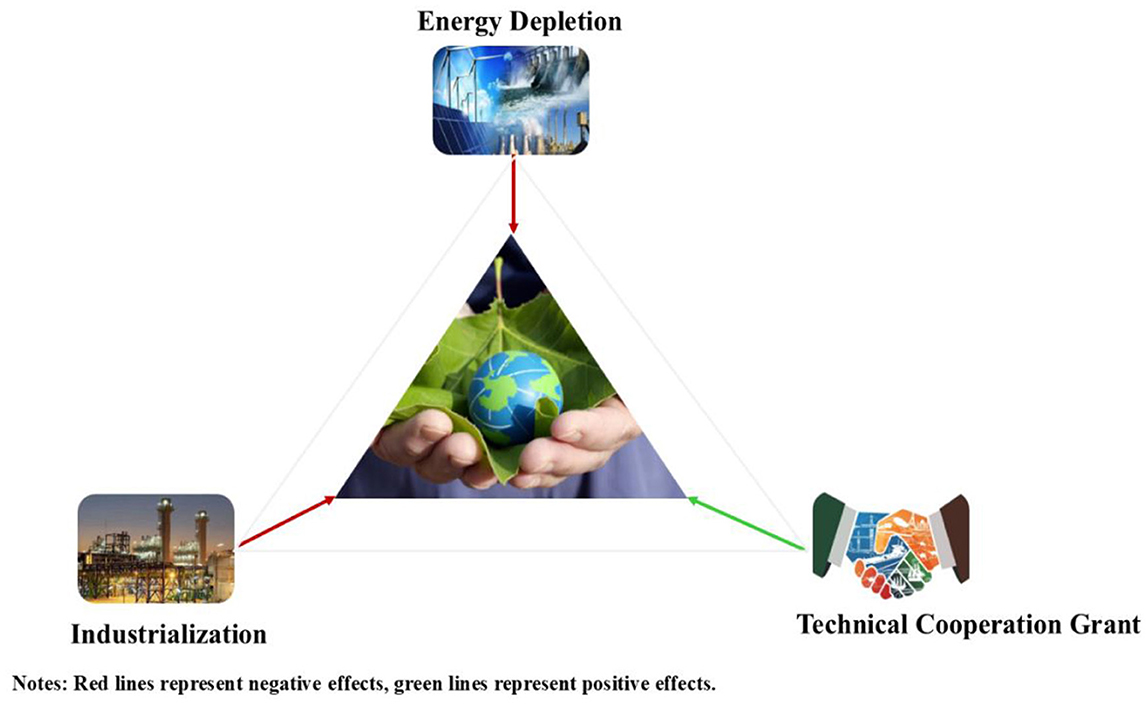
IND often leads to increased consumption of natural resources such as minerals, energy and water. However, industrialization also provides opportunities for the development and implementation of more efficient resource-use methods and technologies. Sustainable industrial practices aim to minimize resource use and waste generation and improve overall resource efficiency (Kaffo Fotio and Karim, 2024). IND usually stimulates economic growth, which can lead to increased environmental pressures as a result of higher levels of production and consumption. However, economic growth can also provide financial means and incentives to invest in environmental protection and sustainable development initiatives. Balancing economic development and environmental management is key to achieving sustainable development (Kyule and Wang, 2024). IND often leads to urbanization and infrastructure development, which can have environmental impacts through habitat loss and increased pollution. Sustainable industrialization aims to integrate green infrastructure, sustainable urban planning and eco-friendly building practices to reduce the negative environmental impacts of urban growth (Djeunankan et al., 2024). Further, Figure 1 illustrates how these indicators affect environmental sustainability through various channels.
2.2 Literature review
The previous literature is divided into the following sub-sections under these headings.
2.2.1 Energy depletion and environment nexus
Energy security has become a significant concern for many countries due to the world's growing energy demand, highlighting the significance of supplying adequate energy to fulfill everyone's demands while maintaining environmental integrity (Khan and Sun, 2023). Ecosystem services have been overexploited, causing our natural environment to lose its ability to regenerate. A growing corpus of scholarly work for energy research examines the negative and positive relationships between the wealth of natural resources and environmental pollution. For instance, a recent study by Kuang et al. (2023) examined a panel of BRICS economies from 1990 to 2022 and discovered a negative correlation between natural resources and environmental degradation. Further, Kibria (2023) pointed out that natural resources fostered ecological quality in Bangladesh. In contrast, studying the case of China (Cai et al., 2023) explored the fact that natural resource extraction is causing the environment to deteriorate. Besides, Zhang and Chen (2023) also investigated that natural resources exhibit a non-positive impact on environmental sustainability in China. In addition, the study by Sun et al. (2022) for G-11 nations, the work of Ali et al. (2022) for ECOWAS economies, the study of Ullah and Lin (2024a) for Pakistan, and the study of Xu et al. (2022) for emerging G-7 economies concluded that natural resources are responsible for environmental contamination in these regions.
While assessing END as a primary indicator (Abbasi et al., 2021) examined the influence of END, green power, and fossil fuel on environmental deterioration in Thailand, between 1980 and 2018. Through DARDL analysis, they found that END and green power consumption enhance the quality of the environment, but fossil fuels energy and GDP exacerbate environmental pollution in the long run. Additionally, a new investigation by Hossain et al. (2023) concerning the USA spanning 1980–2019 presents concrete proof that END and GDP enhance ecological health by reducing CO2 emissions. Saqib et al. (2023) examined the influence of FDI, energy composition, green electricity, and GDP on EFP of 16 European nations. The application of CS-ARDL model yielded long-term estimations, indicating that GDP and energy structure enhance EFP, whilst the utilization of green electricity mitigates EFP. At the same time, a number of sources of evidence show that energy use increases ecological pollution (Bashir et al., 2023; Huang and Ren, 2024). Notwithstanding the persistent debate on END, overall, END substantially undermines environmental sustainability. We propose Hypothesis 1:
Hypothesis 1: END degrades environmental sustainability.
2.2.2 Technical cooperation grants and environmental degradation
As a form of international assistance, technical cooperation grants benefit developing countries by improving their technical capabilities and encouraging growth (Khan et al., 2021a). Providing financial services and expertise to developing countries through technical cooperation grants can significantly impact the environment (Asongu and Ezeaku, 2022). These grants contribute to implementing sustainable development projects such as renewable energy initiatives, waste management systems, and conservation efforts (Babenko et al., 2019; Lin and Ullah, 2023). By sharing technical knowledge and resources, these grants have helped countries improve their capacity to address environmental challenges, reduce pollution, conserve biodiversity, and promote sustainable practices (Sinha et al., 2020). Eventually, technical cooperation grants help to create a healthier and more sustainable environment for present and future generations (De Marchi, 2012). However, researchers have grown to realize that the potential trade-off between these grants and pollution is a genuine concern. The existing literature mostly investigates the effects of technological innovation on ecological quality and analyzes how such innovation might facilitate sustainable development by mitigating pollution. However, no research has investigated the impact of TCG on ecological sustainability (LCF), thus becoming the major contribution of the study. Technological innovation has significantly affected ecological quality in light of the fourth industrial revolution. The STIRPAT model, which evaluates environmental aspects, comprehensively explains how technology improves and destroys the environment (Dietz and Rosa, 1994).
Numerous studies have examined this dynamic, revealing both favorable results and persistent challenges. Studies indicate that technological innovation significantly influences environmental sustainability. These investigations employ numerous common metrics to assess the levels of Technological Innovation, encompassing patent development, effectiveness, and R&D activities (Bergougui, 2024). While the above stated studies collectively recognize the beneficial impact of technological innovation in mitigating greenhouse gases and improving environmental quality, there exists contradictory evidence indicating that it may result in increased pollution. Adebayo and Kirikkaleli (2021) performed a research on Japan, revealing that technological innovation might exacerbate greenhouse gases and lead to a deterioration in environmental health. Likewise, Islam et al. (2023) found that an adverse shock to technological innovation might boost CO2 emissions. Consequently, owing to the absence of agreement in prior studies, more study is essential to elucidate the influence of TCG on environmental sustainability. Based on the aforementioned evidence, the following hypothesis is put forward.
H2: TCG increase environmental sustainability in Pakistan.
2.2.3 Industrialization and environmental degradation
Industrialization refers to the growth of manufacturing activities related to other economic sectors. A country is on the path to industrialization if its industrial sector outpaces other sectors in production (Bano et al., 2022). IND refers to changing from an agricultural to a manufacturing economy that transforms raw materials into valuable products (Khan et al., 2021b). Since the Industrial Revolution, IND has enabled economic development and structural change. An endogenous growth model based on a two-sector framework emphasizes industrialization as an essential component of growth (Muhammad et al., 2023). According to existing research, IND has been acknowledged as a driver of economic growth. Thus, many nations, especially emerging ones, are concentrating on accelerating industrialization. Despite the increasing force for IND, upholding a sustainable environment is challenging.
Researchers have explored both positive and negative relationships between industrialization and environmental pollution. For example, a recent by Liao et al. (2023) explored that IND had an adverse impact on environmental quality in OECD nations from 1990 to 2019. Besides, Yang et al. (2021) identified that industrialization and health expenditures have accelerated ecological contamination in a panel of the top 10 countries in health expenditures. Wang et al. (2022) also pointed out a non-negative relationship between industrialization and ecological degradation in the case of G-7 countries. Moreover, the research work of many scholars, like Patel and Mehta (2023) for India, Sikder et al. (2022) for a panel of 23 developing countries, Ullah and Lin (2024b) for Pakistan, Aslam et al. (2021) for China, and Ullah and Lin (2024c) for Pakistan explored that industrialization leads to an upsurge in environmental degradation in these regions. IND fosters technological innovation, leading to enhanced production methods and reduced ecological damage. Ali et al. (2023b) suggested that ecological health in Saudi Arabia has dropped as a result of technological developments in industrialization. Research indicates that IND does not influence the expansion of the EFP. According to their experimental calculations (Opoku and Boachie, 2020) indicate that IND did not influence the EFP in 26 chosen African nations. In contrast, the empirical work of Opoku and Aluko (2021) demonstrated that IND has fostered environmental quality in 37 African countries from 2000 to 2016. These contradictory findings underscore the desire for more investigation in this domain. Thus, we proposed the following hypothesis.
H3: IND hinders the environmental sustainability.
2.2.4 Literature gap
The current literature mostly emphasizes the effects of END on environmental quality, using several methodologies, although many studies also investigate the influence of technological innovations. A notable vacuum exists in the research about the impact of technical cooperation grants on environmental sustainability, given their potential to foster transformative changes. Moreover, no research has comprehensively examined the cumulative effects of END, technological cooperation grants, and industrialization on the load capacity factor, a crucial metric of environmental sustainability in the context of Pakistan. This disparity is especially evident in the Pakistani context, where no study has synthesized these factors to provide a comprehensive knowledge necessary for successful environmental policy. This study seeks to address a significant gap by examining the interactive effects of END, technical cooperation grants, and industrialization on environmental sustainability in Pakistan, utilizing innovative dynamic ARDL methods, thereby providing practical recommendations for policymakers and enhancing the comprehension of these interconnected variables.
3 Data and methods
3.1 Data
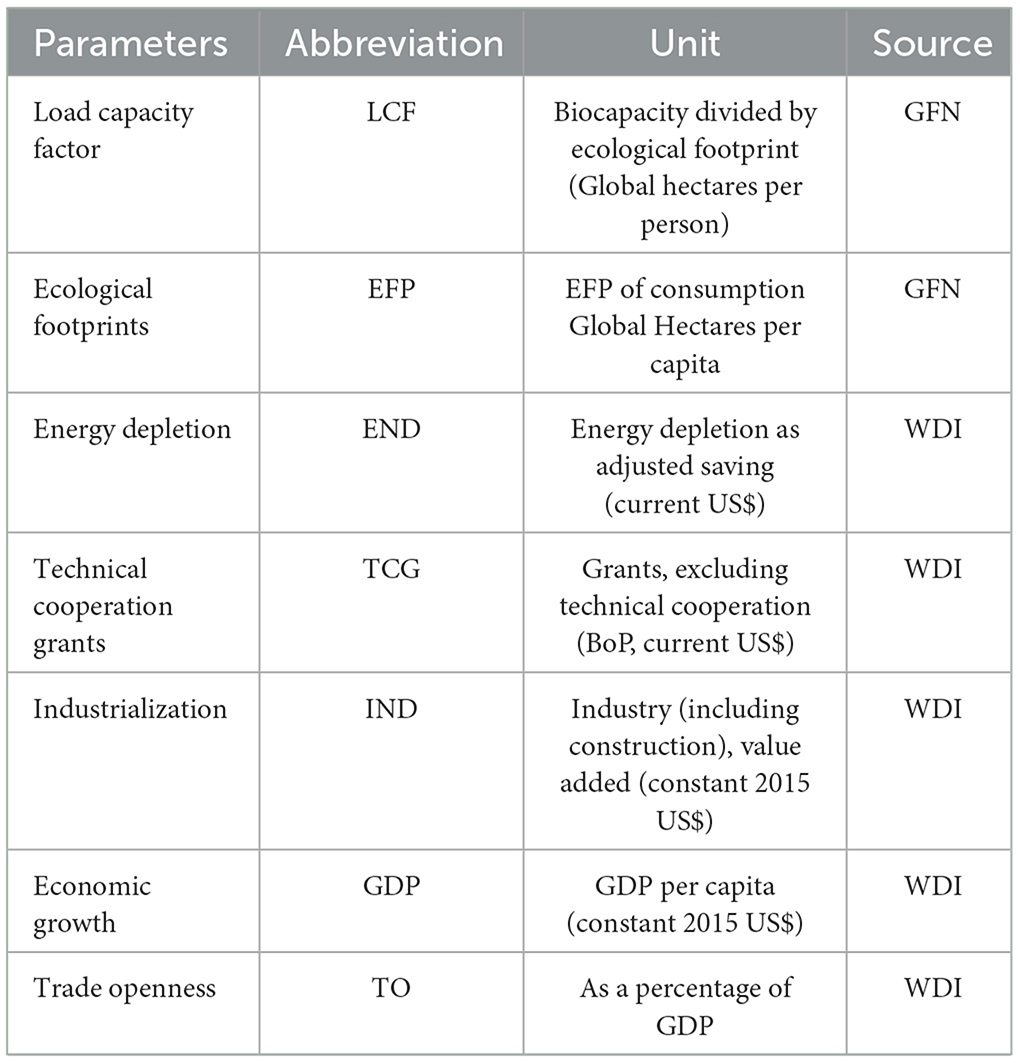
The load capacity factor is determined by dividing biocapacity by ecological footprint and used as the dependent variable. In recent studies, some scholars have utilized the indicator load capacity factor as a proxy for environmental pollution (Dam and Sarkodie, 2023; Jahanger et al., 2023; Sun et al., 2023b; Wang et al., 2023a). The data for these variables were extracted from the GFN (2023) database. Other determinants included in this study are END, TCG, and IND as significant independent variables, while GDP and TO are employed as control variables. The END variable is expressed as Adjusted savings: END (current U.S. dollars), follows by Hossain et al. (2023), TCG are measured as grants, excluding technical cooperation (BoP, current U.S. $) as observed by Chen et al. (2023), IND is estimated as Industry (including construction), value added (constant 2015 US$) as used in the study of Jin and Huang (2023), Yang et al. (2021), and Liao et al. (2023). Finally, the study substitutes the GDP per capita variable—more significant in the environmental literature—for economic growth. GDP is taken as GDP (constant 2015 US$); the other control variable is TO, measured as % of GDP. The data set of all these variables is drawn from WDI (2022). We transform all these data sets into their logarithmic forms. Table 1 offers comprehensive details regarding the metric and source of the data.
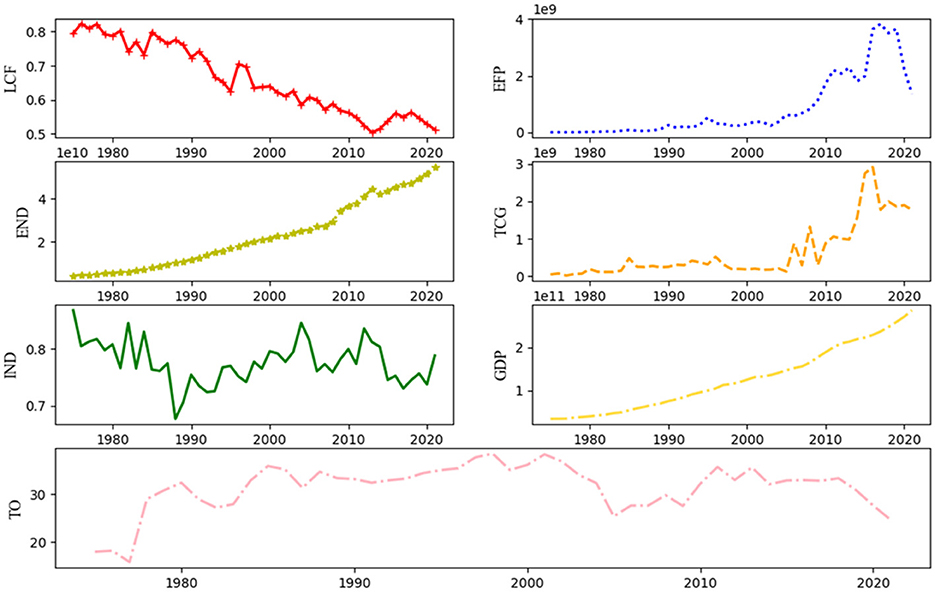
Additionally, Figure 2 displays the trend analysis of the variables over various time lags.
3.2 Methodology
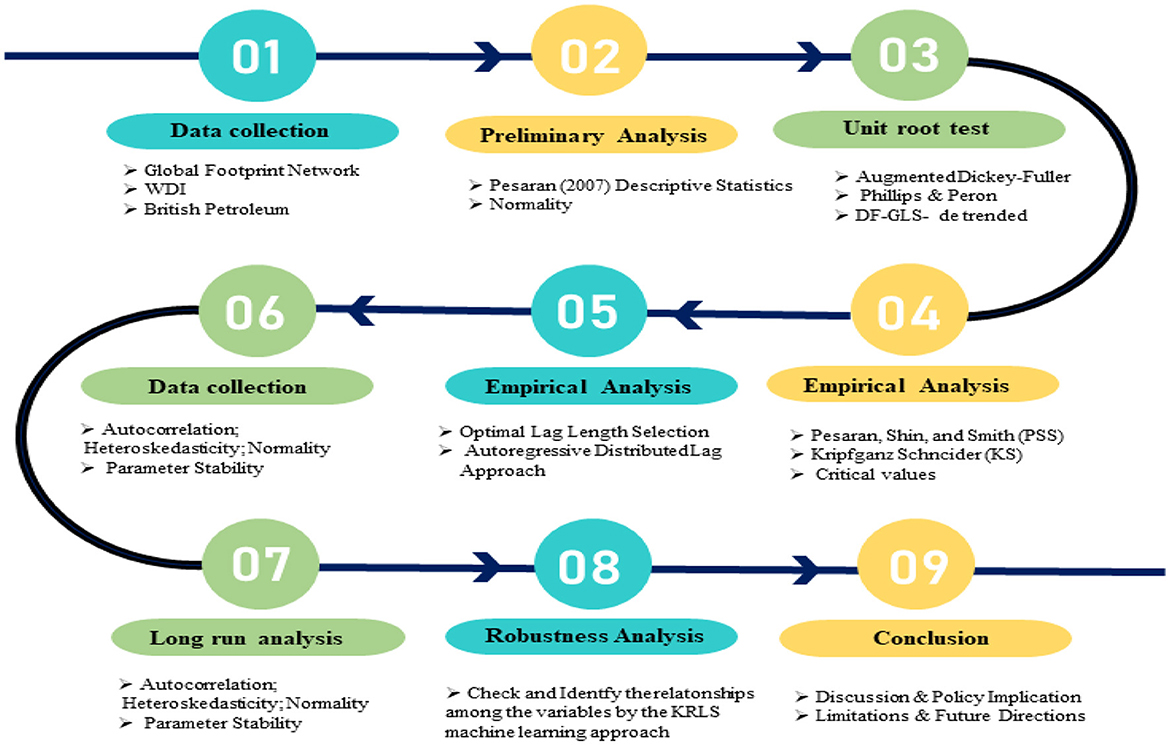
Figure 3 displays the methodological framework for this investigation. The following nine steps illustrate a methodology that we used to examine the impact of TO, IND, GDP, END, and TCG on Pakistan's LCf:
In this study, the impacts of explanatory variables on the dependent variable are modeled using the following equation.
LCF denotes load capacity factor, END depicts energy depletion, TCG represents technical cooperation grants, IND indicates industrialization, GDP indicates economic growth, and TO represents trade openness. The variables END, IND, and GDP are anticipated to exhibit a negative sign and have the capacity to increase environmental contamination . On the other hand, TCG and TO are expected to increase LCF significantly .
3.2.1 Dynamic ARDL method
Various lag lengths and difference factors complicate the structure of traditional ARDL models. The DARDL approach was created by Jordan and Philips (2018), which eliminates complexity by specifying a single lag length for every variable. DARDL also shows counterfactual variations in variables. The DARDL model simulations show how exogenous factors impose shocks on endogenous variables. Throughout the analysis, this technique depicts counterfactual responses to the explanatory factors, holding constant all other explanatory variables that may impact regress. The dependent variable's order of integration must be I(1), and the parameters must be cointegrated to apply the DARDL approach. As part of the DARDL approach, a limits test by Pesaran et al. (2001) is utilized to determine the cointegration connection after many stationarity checks are carried out to see if the dependent variable is I(1). When the F and t statistics are more significant than the crucial I(1) value, the bound test verifies cointegration (Kripfganz and Schneider, 2020). Critical values are paired with probability estimates derived from response surface regression in order to execute bound tests in DARDL. Upon confirmation of the cointegration relationship, the next stage in the DARDL process is to use Equation 2 to get the coefficients.
LCF is employed as an endogenous parameter, λ for intercept, δ represents the error correction term, γ1 to γ5 denote short-term coefficients, δ1 to δ5 show prolonged coefficients, and Ω is a residual term. The following test is used to determine the null hypothesis on the non-appearance of cointegration: H0: δ0 = γ1 = γ2 = γ3 = γ4 = γ5 = 0. The DARDL process ended with a graphic representation of counterfactual changes.
3.2.2. Kernel regularized least square (KRLS) method
Partial derivatives are utilized in KRLS estimation to display the marginal influence of each independent variable (Hainmueller et al., 2014). Compared with prevailing machine-learning techniques, the parameters of KRLS are flexible and interpretable. With various adjustments, this method also reduces variance and susceptibility (Ferwerda et al., 2017).
The KRLS approach to social science research has several advantages, including being nonlinear, utilizing radial-based functions to identify the most suitable surfaces, providing easy access to rate-of-change effects, avoiding robust parametric assumptions, and facilitating the interpretation of intricate relationships (Hainmueller et al., 2014). The partial derivative mathematical statement is displayed in Equation 3.
Where, show how the predictor x variable and the regressand point derivation work. Scale-weighted predictors can be found byci, kernel bandwidth by σ2, and the total and single numbers of observations are represented by the symbols i and j. The KRLS approach examines marginal effects by separating independent and dependent variables. In Equation 4, the KRLS estimation is expressed as follows;
Here, ∀ and Ω1 to Ω5 show the KRLS-based mean marginal effects estimators. Based on closed-form estimation of point marginal derivatives, KRLS models calculate the rate of change effects of covariates for each data point (Ferwerda et al., 2017). We may see the average binary marginal effect using the KRLS approach by graphing increasing and decreasing returns. Furthermore, through pointwise marginal derivatives, this approach also allows for interaction between variables (Awan et al., 2022).
4 Results and discussion
4.1 Descriptive statistics
To ascertain the distribution of the variables, we computed the statistics for central tendency and variance for the variables chosen for the investigation. Preliminary statistics for the series are shown in Table 2. This table presents a complete picture of the dataset's nature. For all variables, a natural log transformation is applied to reduce heteroskedasticity. For LCF and EFP, the resultant mean of lagged values is negative, while it is positive for END, TCG, IND, GDP, and TO. Compared to the other variables, GDP exhibits the highest mean, while EFP has the lowest. There is less variation between the data points and fewer outliers because the standard deviations of all the chosen variables are low. Kurtosis analysis revealed that END and TO had heavy tails, while LCF, EFP, TCG, IND, and GDP's tails became lighter as their values fell short of the crucial milestone. All variables, except for LCF, which was right-skewed, were left-skewed, according to skewness analysis. This analysis reports Jarque-Bera test statistics for six variables: LCF, EFP, END, TCG, IND, GDP, and TO. There is a p-value greater than 0.05 for LCF, EFP, TCG, IND, and GDP, indicating they are typically distributed. However, END and TO are not generally distributed as their p-values surpass the 0.05 threshold value.
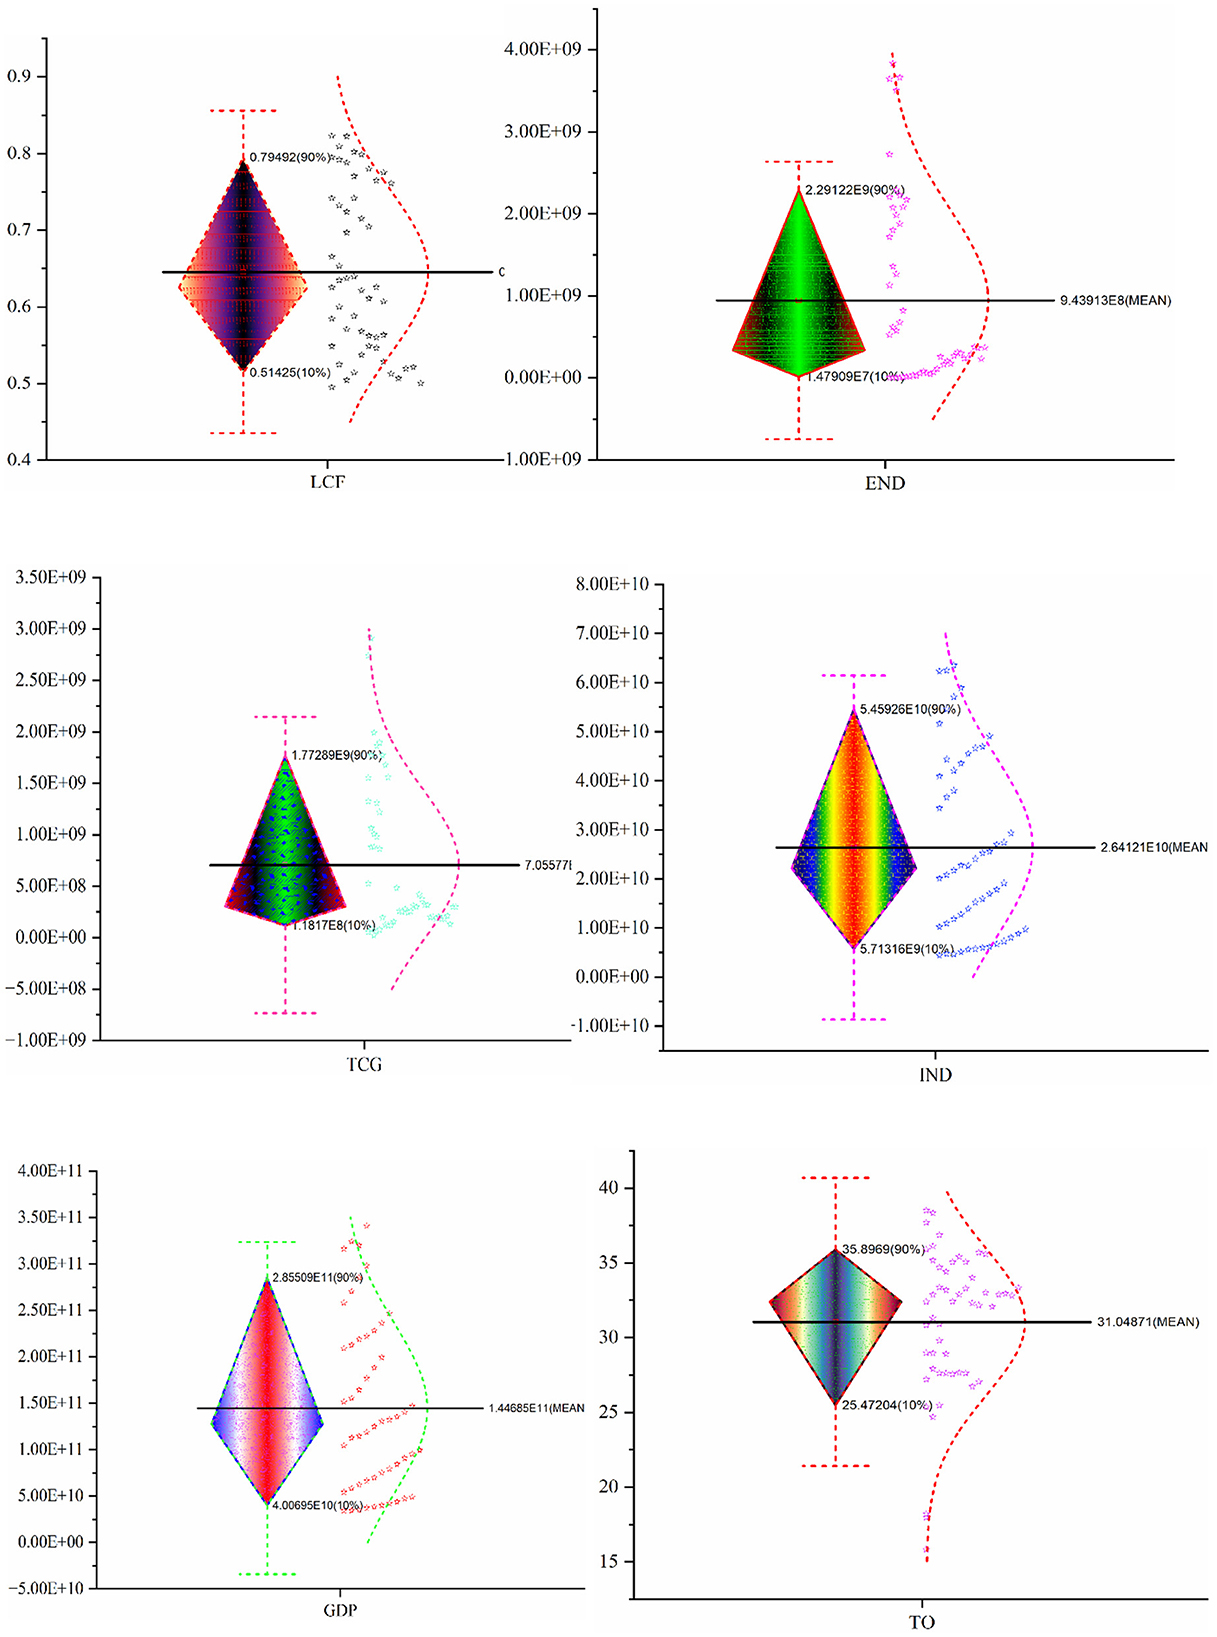
In addition, Figure 4 presents summary statistics for the variables using box plots. From 1970 to 2021, Pakistan's descriptive statistics are shown in Figure 4. The box and scatter plots represent 10%, 25%, 75%, and 90%, respectively, and the whisker tops represent 1/99%. The top (lowest) and bottom (minimum) values are each shown by a dot.
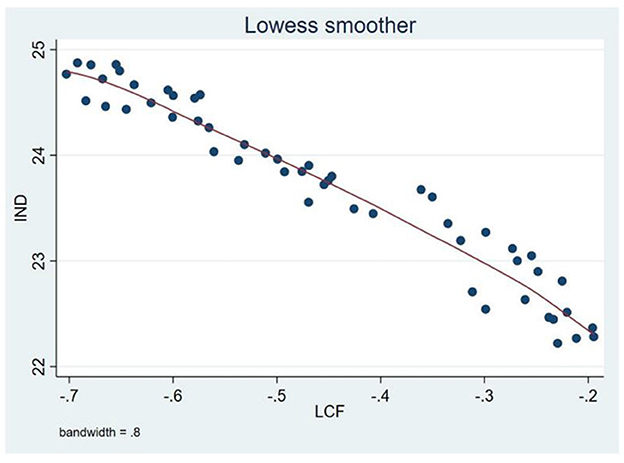
The correlation relationship between each variable is also shown in Figure 5. This figure provides detailed information about Pearson's correlation coefficient, histograms, and bivariate scatter plots. Figure 5's upper right triangle displays bivariate Pearson correlation coefficients between −1 and +1. Correlations close to +1 or −1 indicate one-to-one positive or negative relationships. According to Figure 5, there is evidence of a negative correlation between LCF, END, TCG, IND, GDP, and TO. Pearson correlation coefficient results indicate that all variables in the study are statistically significantly correlated. A scatter plot of two variables is shown in the lower left triangle of Figure 5. This part indicates the relationship's magnitude and direction. Thus, it can be noticed that LCF decreases if END, TCG, IND, and GDP increase, but for TO, this relationship is reversed. Finally, diagonal graphs in Figure 5 show the distribution features of various variables.
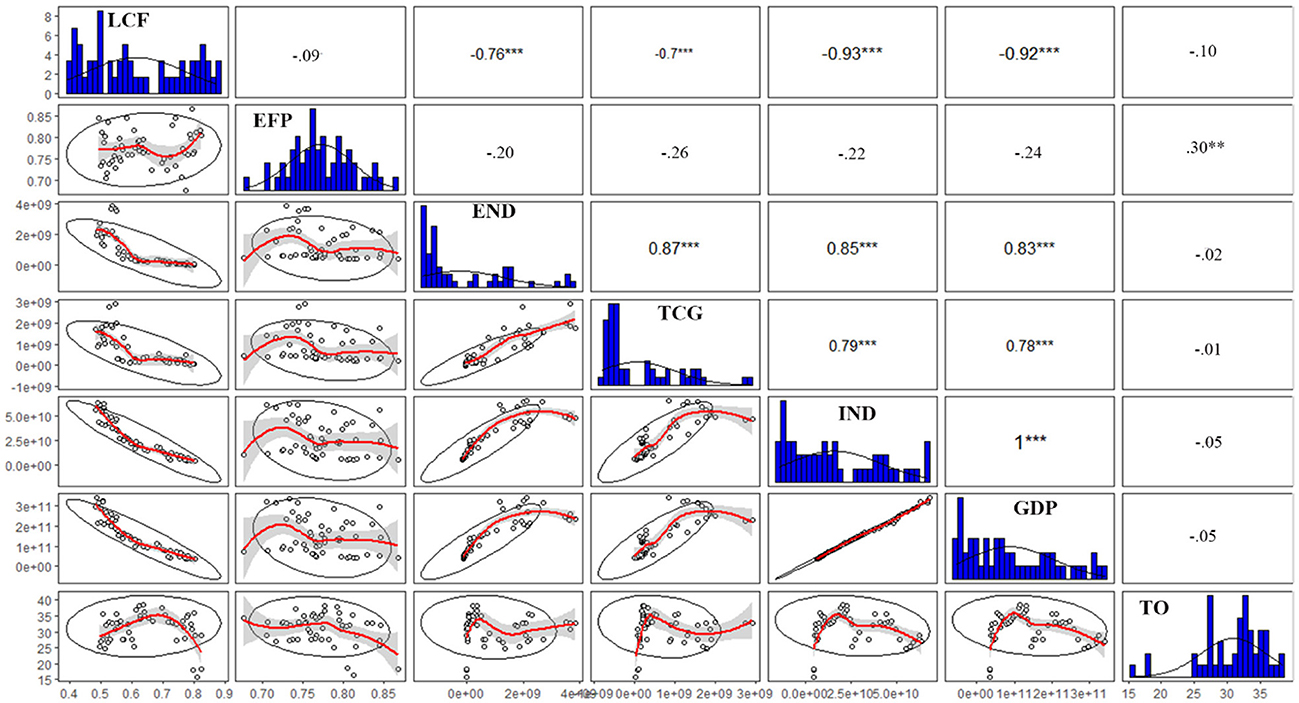
Figure 5. Display of the correlation structure graphically. The asterisks represents the significance level.
4.2 Stationarity tests
In Step 3, we verified the variables' stationarity using the ADF (Dickey and Fuller, 1979), PP (Phillips and Perron, 1988), and DF-GLS (Vougas, 2007) tests. Table 3 provides the results. The t-statistics for all variables except EFP and TO were not statistically significant at the 5% level. Hence, all of these variables have a unit root and are non-stationary. In contrast, these parameters exhibit statistically significant t-statistics at the 5% level for the first difference.
4.3 Bounds tests
After completing stationarity tests, the long-term cointegration relationship was assessed by bound test using the K.S. critical value. The outcome is signified in Table 4.
Considering that the p-value of the bound test is less than 0.05, it can be concluded that the null hypothesis that there is no cointegration between the variables can be rejected at a 1% significance level. Therefore, examining long-term relationships' characteristics in more detail seems appropriate.
4.4 Optimal lag selection criteria
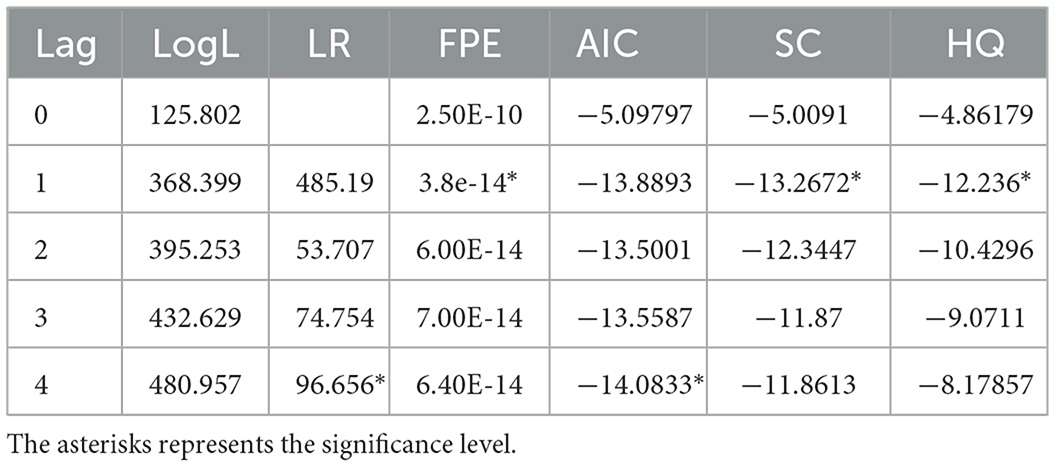
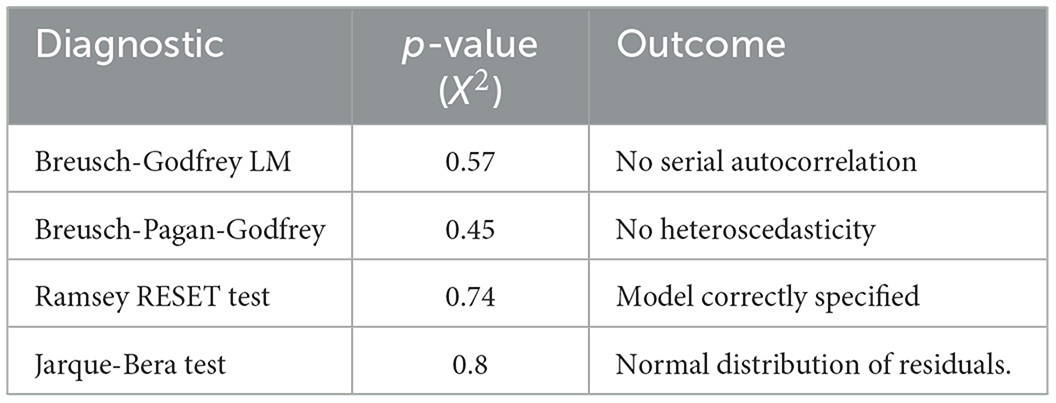
The Schwarz Bayesian information criteria (SBC), Akaike (AIC), likelihood ratio (LR), log-likelihood (LL), Hannan-Quinn (HQ), and final prediction error (FPE) are used to determine the optimal lag lengths for ARDL and DYNADL. The results of these methods are summarized in Table 5. According to Table 5, “1” was determined as the optimal lag length. Various diagnostic tests reported in Table 6 confirm the reliability and stability of the coefficients obtained through the ARDL models.
4.5 ARDL and DARDL outcome
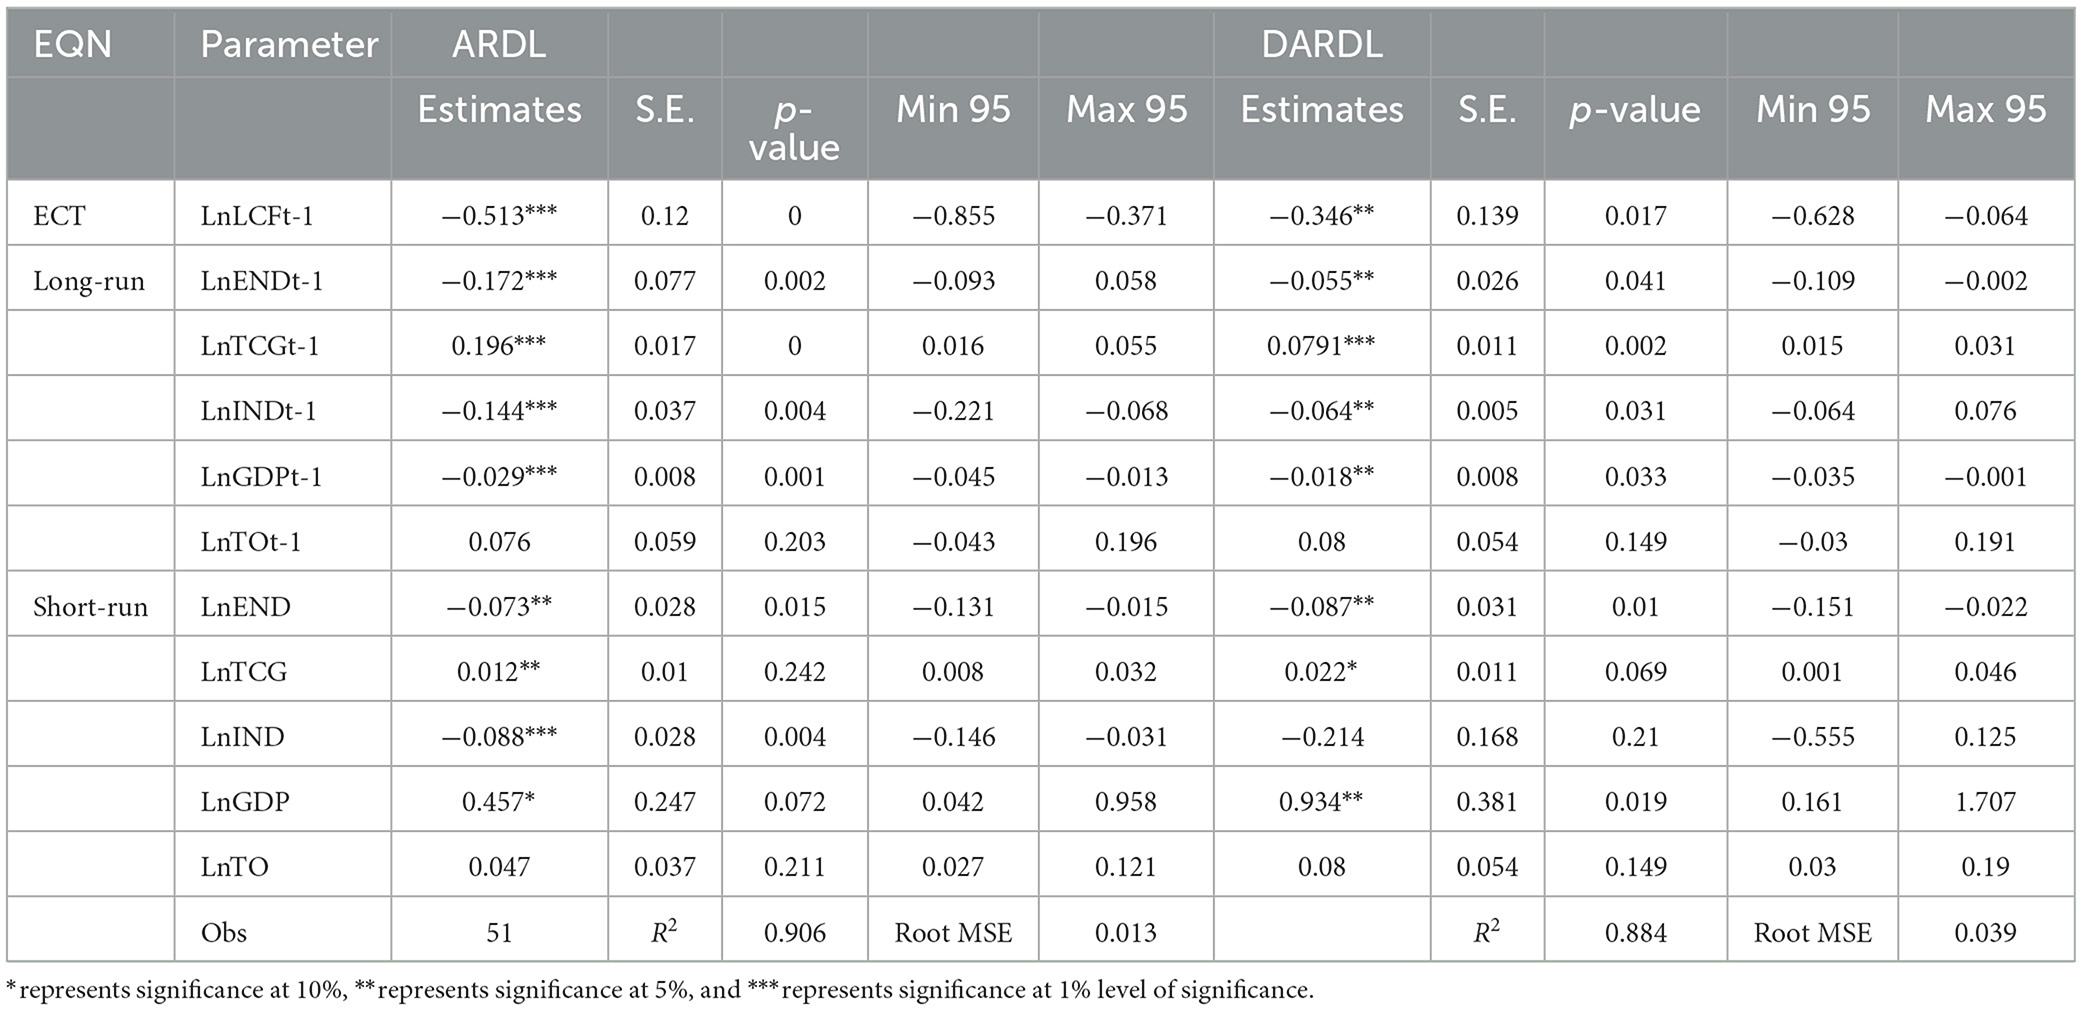
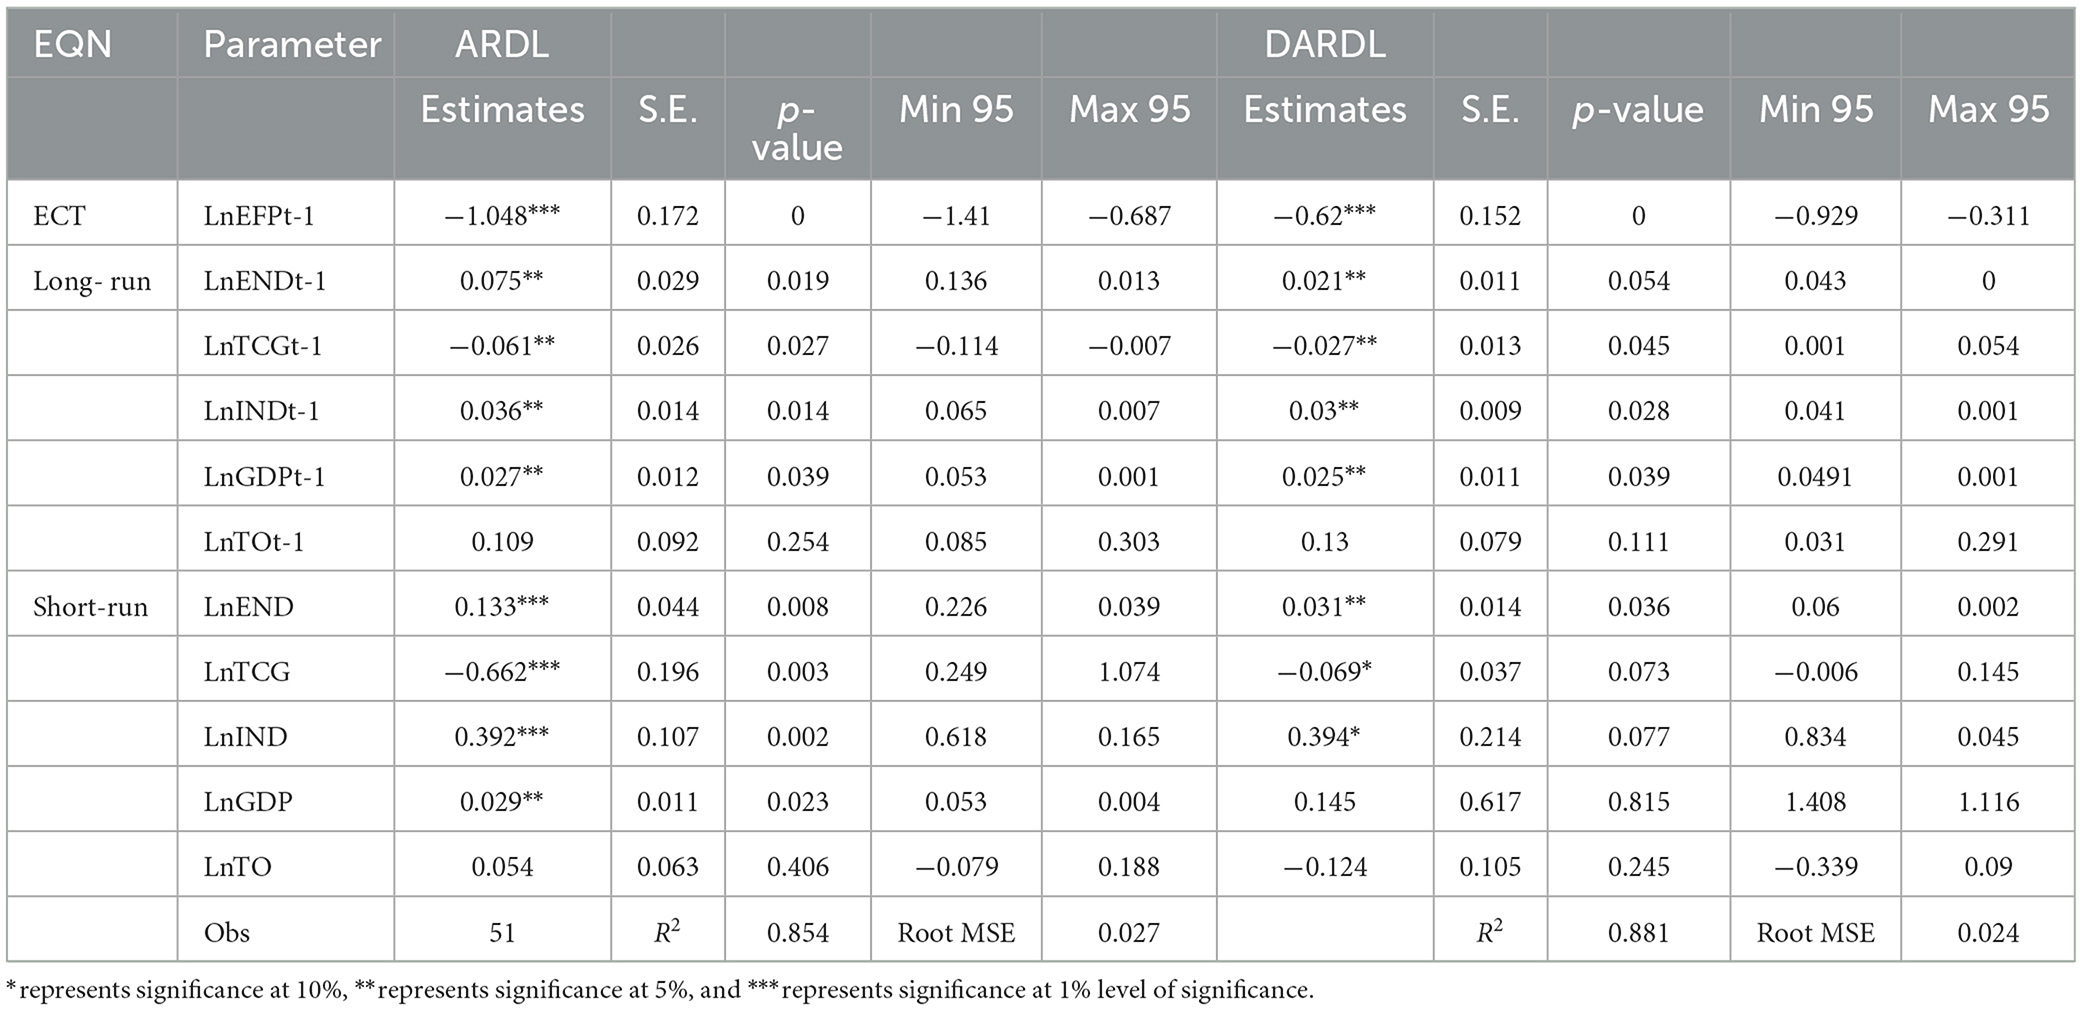
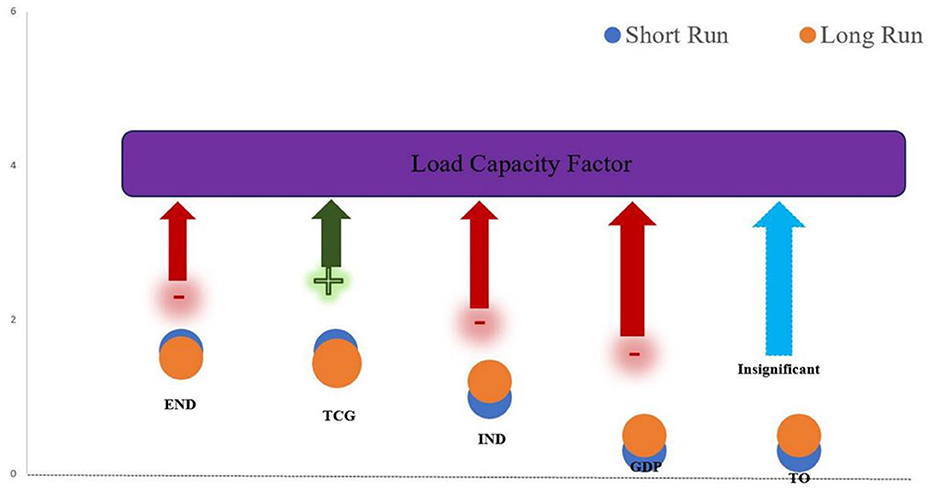
The outcomes of the ARDL and DARDL are offered in Table 7, and a graphic summary of the long- and short-term results is demonstrated in Figure 11. As we expected, the ARDL results show that END, IND, and GDP lead to environmental degradation by reducing the load capacity factor. Contrary to this, TCG is responsible for fostering environmental sustainability by increasing load capacity. The coefficient of determination obtained through ARDL is 90.60%, which means that END, TCG, IND, GDP, and TO can explain 90.60% of the variation in LCF. In the short run, for each percentage point increase in END, IND, and GDP, the LCF declines by 0.07, 0.08, and 0.45 percentage points, respectively. The long-term effects of these parameters are 0.17, 0.14, and 0.02, respectively—moreover, an upsurge of one percent in TCG results in an increase of 0.19 percent in LCF. The role of TO was found to be insignificant on LCF both in the short run and long run.
In addition, our findings report that END boosts the extent of environmental degradation in Pakistan by reducing LCF levels. The negative relationship between END and environmental degradation can be attributed to the following reasons: First, Pakistan relies significantly on fossil fuels, mainly coal and oil, to meet its energy demands. The extraction and burning of these fuels emit toxic pollutants such as carbon dioxide, sulfur dioxide, and nitrogen oxides, leading to air pollution and climate change (Hussain et al., 2020). Second, Pakistan's energy infrastructure is antiquated and inefficient, resulting in energy losses during transmission and distribution. This inefficiency requires more energy output to match demand, worsening resource depletion and environmental damage (Khan et al., 2023). END often results in deforestation as individuals turn to the use of wood and biomass for cooking and heating when other energy sources are not accessible or too costly. Deforestation is a major cause of soil erosion, biodiversity loss, and habitat destruction, which ultimately leads to environmental deterioration (Khan and Sun, 2023). Further, these conclusion are corroborates with the previous finding of Akram et al. (2024) and Lin and Ullah (2024a). Consequently, hypothesis 1 has been proved. However, these outcomes contrast those of Ullah et al. (2023) and Abbasi et al. (2021), who determined that END is fostering environmental sustainability.
Conversely, the study's conclusions show that TCG promotes environmental sustainability in Pakistan and has a strong, positive relationship with LCF. The findings are in line with (Hu et al., 2023; Jahanger et al., 2023). Therefore, hypothesis 2 is also corroborated. The positive relationship between TCG and LCF can be attributed to several reasons: First, the TCG provided much-needed financial support to improve energy infrastructure and enhance the capacity of the power sector. Such financial assistance facilitates investment in upgrading power plants, transmission lines, and distribution networks. As of 2021, the latest value of the Pakistan Technical Cooperation Grant (BoP, current US$) was $23,102,000. TCG includes free-standing grants to improve a country's overall capacity by transferring technical and managerial skills or technology and strengthening investment-related technical cooperation. Second, TCG usually involves moving technology from donor countries or international organizations to Pakistan. Technology transfer may include advanced equipment, systems, and practices that help optimize power infrastructure operation and maintenance. Recently, 14 research teams led by U.S. and Pakistani researchers received grants from their governments for cooperative scientific and technical research. Through the program, the two countries are funding S&T research for the seventh time. The joint study carried out through these grants has strengthened scientific and technical cooperation between the two countries, thereby supporting Pakistan's economic development in health, water, agriculture, and energy.
Moreover, the observed findings reveal that the long-term impact of IND on LCF is negative and significant. The results are in accordance with (Yang et al., 2021; Jin and Huang, 2023). Thus, hypothesis 3 is also proved. This result was anticipated, given that fossil fuels dominate the energy source used by developing countries' industrial sectors (Lin et al., 2022). As emerging economies transition from rural to industrialized countries, pollution-intensive industrial outputs continue to grow, contributing significantly to environmental degradation.
The ECT of the dynamic model varies from 0 to 1, indicating the speed of restoration of equilibrium. Therefore, ECT measures the rate at which the system reaches equilibrium if it is not positive and significant. The model designates a statistically substantial negative ECT. This implies that the long run deviation will equalize at a rate of 0.51. Moreover, there is a similarity in coefficients between the ARDL and DARDL models. Consequently, it indicates that changes in these parameters have effectively reduced LCF in Pakistan.
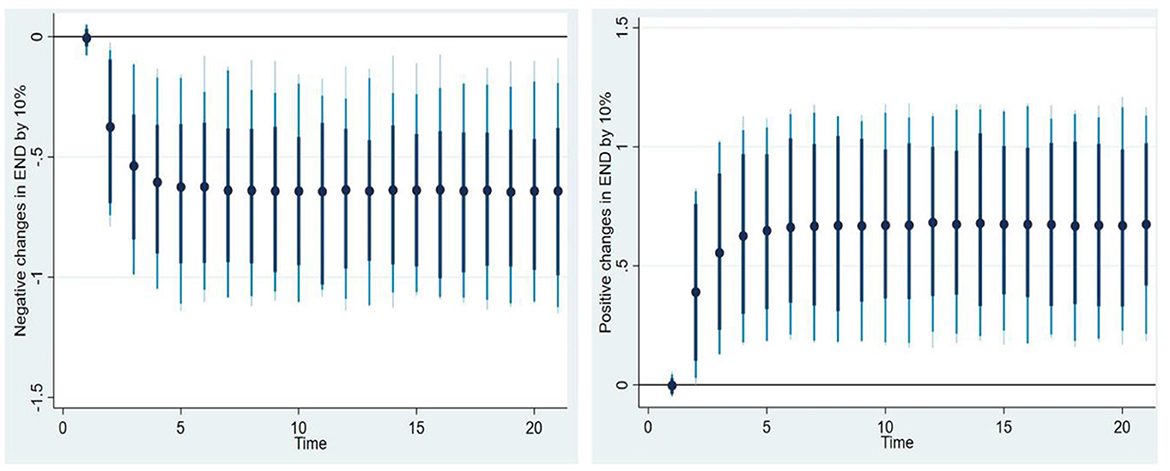
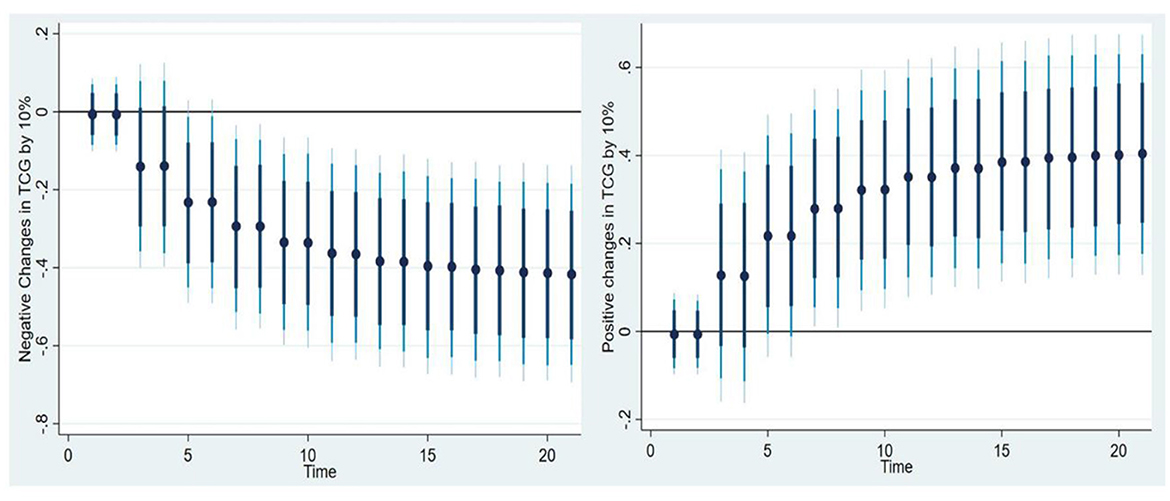
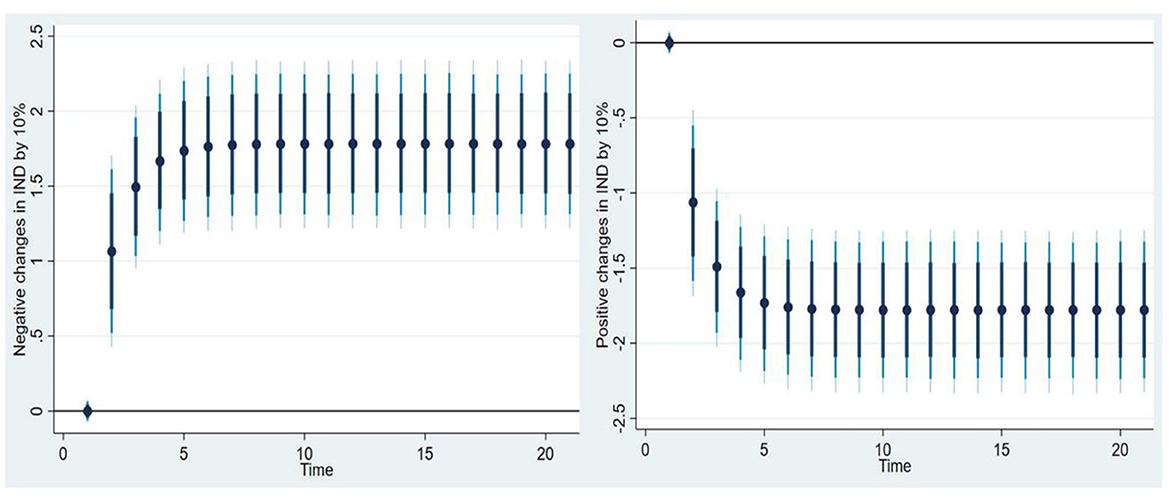
Once the short and long-run impacts of the determinants of the LCF have been predicted, we analyze the load capacity factor's response to a counterfactual variation in one parameter at a given point in time while holding all other parameters constant in Figures 6–8. Plots illustrate changes in LCF when one explanatory variable is shocked by ±10%. LCF is lower when END is increased by 10%, and environmental quality improves when END is lowered by 10%. The effects of negative and positive shocks to TCG and IND, respectively, by 10% are shown in Figures 7, 8. An LCF decreases by 10% when the TCG changes negatively, assuming all other factors remain unchanged.
Nonetheless, 10% positive shocks in TCG are good for the environment, assuming nothing changes. The dynamic ARDL diagram demonstrates that TCG is the only factor contributing to better LCF and environmental quality. On the other hand, a 10% negative shock to IND has a beneficial impact on environmental quality, as illustrated in Figure 8. Furthermore, a 10% upsurge in IND hinders environmental quality in Pakistan.
4.6 Result of KRLS
Pointwise derivatives are utilized to analyze the explanatory variables and LCF in KRLS. Table 8 presents the findings. KRLS demonstrates that TCG has a favorable impact on LCF while END, IND, and GDP have adverse effects, which is in line with the ARDL and DARDL methodologies. Similar to ARDL and DARDL, these effects have slightly different magnitudes. The P25, P50, and P75 quartiles examine the marginal pointwise impact. While the marginal effects of GDP, END, and IND decline, the marginal impact of TCG rises from the low to the high quartiles. Let's put it this way: The KRLS robustness check produces results comparable to ARDL and DARDL.
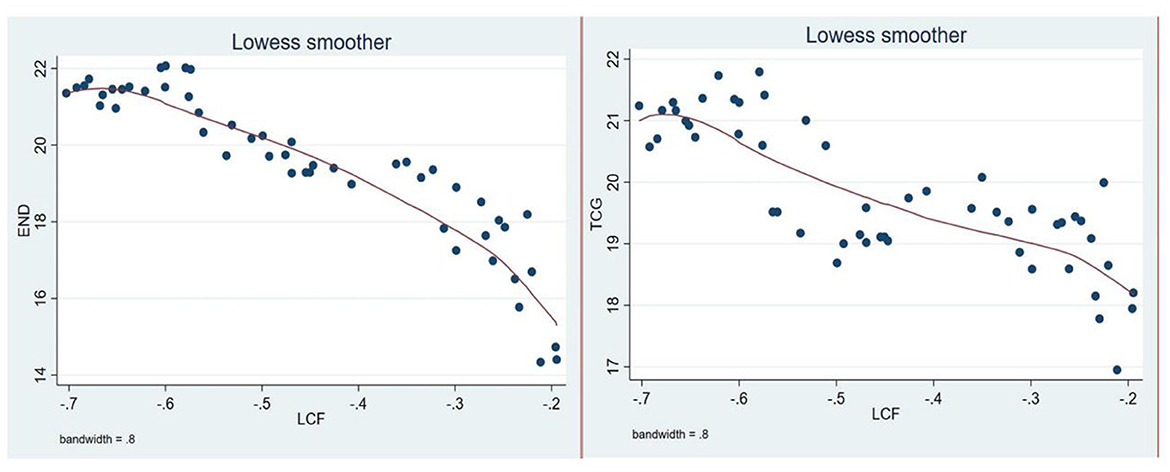
The graphs in Figures 9, 10 show the pointwise marginal effects of END, TCG, and IND on LCF in Pakistan. Figure 8 exposes that the rate of change effect of END is positive at a −0.7 level of LCF, and END remains positive at a −0.2 level, decreasing LCF and hence environmental contamination. Contrary to this, TCG's rate of change effect converts non-negative at the rudimentary non-positive level of LCF. This effect upsurges LCF and environmental sustainability in Pakistan. Further, Figure 10 shows that IND also has a pointwise marginal effect on LCF. Whenever LCF ranges between −0.7 and −0.2, IND values are relatively high to low but remain positive.
For the robustness of the long-run results, we utilized ecological footprints as a dependent variable and again tested for the long-run relationships. All coefficients have similar magnitudes and directions, so the outcomes are consistent. Thus, these results can be used for policy and forecasting purposes. The robustness results obtained through ARDL and DARDL are reported in Table 9. Furthermore, the graphical representation of the results obtained is given in Figure 11 below.
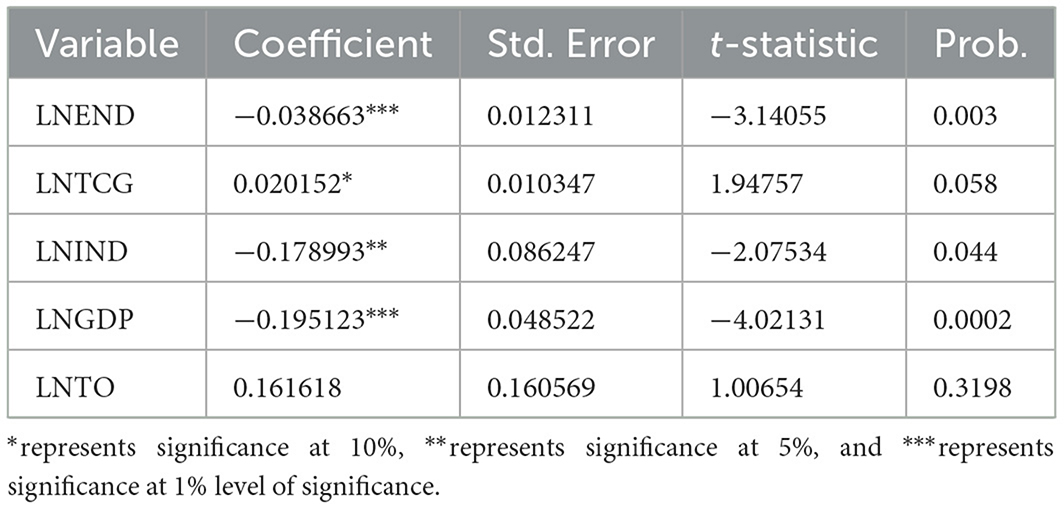
Further, this study used the Fully Modified Ordinary Least Squares (FMOLS) method developed by Phillips and Hansen [107] to assess the robustness of the long-term estimates derived from the dynamic ARDL. This novel approach guarantees that the parameters stay consistent even with small sample sizes, in addition to calculating the long-term parameters using a semiparametric approach (Merlin and Chen, 2021). The FMOLS approach is especially beneficial because it accommodates the effects of long-term parameter heterogeneity while avoiding the complexities brought about by endogeneity, serial correlation, and omitted-variable bias (Liddle, 2012). The findings are given in Table 10. The long-run results are robust because all of the coefficients appear to have similar directions and magnitudes, according to the results. As such, using these results for forecasting and policy purposes is valid.
5 Conclusion and policy implications
The research utilized the DARDL method to test the impacts of END, TCG, industrialization, economic growth, and trade openness on the load capacity factor in Pakistan. The data from 1970 to 2021 were used for the analysis. The findings indicate a significant long-term relationship between END, TCG, IND, GDP, and LCF.
The authors of this work contributed the following: first, as an indicator of environmental sustainability, this study defines a new variable, the load capacity factor. Secondly, this study is the first to introduce a novel area of inquiry. In earlier research, variables like CO2 emissions, greenhouse gas emissions, and ecological footprint have been used to quantify environmental quality. While calculating environmental contamination, these indicators ignore the supply side of nature. To this end, for true environmental sustainability, the contribution of environmental resources should not be overlooked. To mitigate these glitches, recent studies such as Jin and Huang (2023), Dam and Sarkodie (2023), and Sun et al. (2023b) have utilized the LCF as an indicator of ecological sustainability. However, as nations' ecological deficits increase, the LCF value declines, making estimation more difficult. The LCF variable was thus created by the authors as a stand-in for environmental quality, considering both the supply and demand sides of nature. Third, the impact of counterfactual shocks in END, TCG, and IND on LCF is investigated using the DARDL simulation technique. Marginal effects were also considered in the robustness testing using the KRLS approach. Fourth, the authors make several policy recommendations based on the empirical results, impulses, and rate-of-change outcomes discovered using DARDL and KRLS.
Policy recommendations can be derived from these empirical results. First, data indicates that non-renewables primarily drive Pakistan's economy. As a result of the high consumption of petroleum products in the country, LNG imports, LPG imports, and petroleum imports are not only costly, but they also contribute to the diminution of energy resources and the dilapidation of the environment. Government incentives can stimulate investment in renewable energy projects like solar, wind, and hydropower. Subsidies, tax breaks, and feed-in tariffs for renewable energy can make these options more attractive to investors and consumers. Enforcing more stringent energy efficiency regulations for industrial, commercial, and residential structures may decrease energy use. Initiatives aimed at providing financial support for energy-efficient appliances and lights, coupled with educational campaigns promoting energy-saving behaviors, may have a substantial impact. Pakistan should prioritize installing power-saving devices, constructing small dams, implementing energy-efficient technologies, and educating the public about the importance of turning off lights. Investing in the modernization of the energy transmission and distribution infrastructure has the potential to decrease energy loss. Enhancing the functionality of power networks and enhancing the dependability of energy systems may also aid in the more efficient management of energy use. Second, to lessen Pakistan's reliance on fossil fuels, particular attention must be paid to technological advancements and other recommended policies. Direct technical cooperation funding is needed to establish and improve environmental monitoring systems. This includes monitoring air quality, water quality, and biodiversity evaluations to monitor changes in environmental health and identify areas of concern. The government should utilize technical cooperation funding to facilitate capacity-building seminars, training programs, and knowledge-sharing initiatives that specifically target environmental conservation and sustainable development approaches. This has the potential to provide local communities, government agencies, and key stakeholders with the essential skills and knowledge required to carry out efficient environmental management initiatives successfully. Must execute waste management initiatives financed by TCG to enhance trash collection, recycling, and disposal methodologies. This includes the allocation of resources toward the development of waste segregation facilities, composting infrastructure, and public awareness programs aimed at fostering trash reduction and recycling practices. The government should provide money from TCG specifically for ecosystem restoration projects, including reforestation, wetland conservation, and habitat restoration activities. Preserving and recovering natural habitats may amplify biodiversity, promote ecosystem services, and alleviate the consequences of environmental deterioration. Finally, the adverse environmental effects of industrialization emphasize the need for a knowledge-based or service-based economy. In addition, the nation must switch from fossil fuels to renewable energy. Investing more in green innovations and energy efficiency is crucial for advancing renewable energy.
Even though the study attempts to use a fully applicable empirical methodology, There are certain restrictions. (i) Because this study only looks at Pakistan, future empirical research could look at other Asian nations like India, Bangladesh, Turkey, Iran, and a panel of nations. (ii) Explanatory variables, including END, TCG, and IND, were employed in this investigation. Subsequent research endeavors may employ additional factors, specifically digitalization, green innovation, and renewable energy. (iii) Since yearly data was readily available, we used it for our study. As a result, significantly more frequent data can be used in future research, improving the prediction capacity of models. (iv) The primary model in this work is DARDL, and the robust method for analyzing how these factors affect LCF is KRLS. Using this method, models can simulate counterfactual shocks. Future studies may employ additional econometric techniques, including rolling-window causality, quantile-based Granger causality, and machine-learning algorithms. Examining the case of a new nation might expand the literature by applying various methods.
Data availability statement
The original contributions presented in the study are included in the article/supplementary material, further inquiries can be directed to the corresponding author.
Author contributions
SU: Conceptualization, Methodology, Software, Data curation, Writing – original draft, Writing – review & editing. BL: Conceptualization, Methodology, Formal analysis, Project administration, Writing – original draft, Writing – review & editing.
Funding
The author(s) declare financial support was received for the research, authorship, and/or publication of this article. This work was supported by the National Natural Science Foundation of China (Key Program, No. 72133003) and Key Projects of Philosophy and Social Sciences Research, Ministry of Education (No. 22JZD008).
Conflict of interest
The authors declare that the research was conducted in the absence of any commercial or financial relationships that could be construed as a potential conflict of interest.
Publisher's note
All claims expressed in this article are solely those of the authors and do not necessarily represent those of their affiliated organizations, or those of the publisher, the editors and the reviewers. Any product that may be evaluated in this article, or claim that may be made by its manufacturer, is not guaranteed or endorsed by the publisher.
Abbreviations
DARDL, dynamic autoregressive distributed lag; END, Energy depletion; EFP, ecological footprints; GDP, Economic growth; IEA, International Energy Agency; IAEA, International Atomic Energy Agency; IND, Industrialization; KRLS, Kernel Regularized Least Square; LCF, Load capacity factor; OECD, Organization for Economic Co-operation and Development; PTCG, Pakistan Technical Cooperation Grant; TCG, Technical cooperation grants; TO, Trade openness; TCAP, Technical Cooperation and Assistance Programme; GFN, Global Footprint Network; WDI, World Development Indicators.
References
Abbasi, K. R., Adedoyin, F. F., Abbas, J., and Hussain, K. (2021). The impact of energy depletion and renewable energy on CO2 emissions in Thailand: fresh evidence from the novel dynamic ARDL simulation. Renew. Energy 180, 1439–1450. doi: 10.1016/j.renene.2021.08.078
Adebayo, T. S., and Kirikkaleli, D. (2021). Impact of renewable energy consumption, globalization, and technological innovation on environmental degradation in Japan: application of wavelet tools. Environ. Dev. Sustain. 23, 16057–16082. doi: 10.1007/s10668-021-01322-2
Akram, R., Ai, F., Srivastava, M., and Sharma, R. (2024). Considering natural gas rents, mineral rents, mineral depletion, and natural resources depletion as new determinants of sustainable development. Resour. Policy 96:105200. doi: 10.1016/j.resourpol.2024.105200
Ali, K., Jianguo, D., and Kirikkaleli, D. (2022). Modeling the natural resources and financial inclusion on ecological footprint: the role of economic governance institutions. Evidence from ECOWAS economies. Resour. Policy 79:103115. doi: 10.1016/j.resourpol.2022.103115
Ali, S., Hamid, A. B. B. A., Ya'akub, N. I. B., and Iqbal, S. (2023a). Environmental impacts of international tourism: examining the role of policy uncertainty, renewable energy, and service sector output. Environ. Sci. Pollut. Res. 31, 46221–46234. doi: 10.1007/s11356-023-28377-0
Ali, U., Guo, Q., Nurgazina, Z., Sharif, A., Kartal, M. T., Kiliç Depren, S., et al. (2023b). Heterogeneous impact of industrialization, foreign direct investments, and technological innovation on carbon emissions intensity: evidence from Kingdom of Saudi Arabia. Appl. Energy 336:120804. doi: 10.1016/j.apenergy.2023.120804
Aslam, B., Hu, J., Shahab, S., Ahmad, A., Saleem, M., Shah, S. S. A., et al. (2021). The nexus of industrialization, GDP per capita and CO2 emission in China. Environ. Technol. Innov. 23:101674. doi: 10.1016/j.eti.2021.101674
Asongu, S. A., and Ezeaku, H. C. (2022). Aid grants versus technical cooperation grants: implications for inclusive growth in Sub-Saharan Africa, 1984–2018. J. Public Aff. 22:e2587. doi: 10.1002/pa.2587
Awan, A., Sadiq, M., Hassan, S. T., Khan, I., and Khan, N. H. (2022). Combined nonlinear effects of urbanization and economic growth on CO2 emissions in Malaysia. An application of QARDL and KRLS. Urban Clim. 46:101342. doi: 10.1016/j.uclim.2022.101342
Aydin, C., Esen, Ö., and Aydin, R. (2019). Is the ecological footprint related to the Kuznets curve a real process or rationalizing the ecological consequences of the affluence? Evidence from PSTR approach. Ecol. Indic. 98, 543–555. doi: 10.1016/j.ecolind.2018.11.034
Babenko, V., Sidorov, V., Koniaieva, Y., and Kysliuk, L. (2019). Global journal of environmental science and management features in scientific and technical cooperation in the field of non-conventional renewable energy. Glob. J. Environ. Sci. Manag. 5, 105–112. doi: 10.22034/gjesm.2019.SI.12
Bano, S., Liu, L., and Khan, A. (2022). Dynamic influence of aging, industrial innovations, and ICT on tourism development and renewable energy consumption in BRICS economies. Renew. Energy 192, 431–442. doi: 10.1016/j.renene.2022.04.134
Bashir, M. A., Dengfeng, Z., Filipiak, B. Z., Bilan, Y., and Vasa, L. (2023). Role of economic complexity and technological innovation for ecological footprint in newly industrialized countries: does geothermal energy consumption matter? Renew. Energy 217:119059. doi: 10.1016/j.renene.2023.119059
Bega, F., and Lin, B. (2024). China's Belt & Road initiative hydropower cooperation: what can be improved? Renew. Energy 221:119789. doi: 10.1016/j.renene.2023.119789
Bergougui, B. (2024). Moving toward environmental mitigation in Algeria: asymmetric impact of fossil fuel energy, renewable energy and technological innovation on CO2 emissions. Energy Strateg. Rev. 51:101281. doi: 10.1016/j.esr.2023.101281
Bota-Avram, C., Apostu, S. A., Ivan, R., and Achim, M. V. (2024). Exploring the impact of macro-determinant factors on energy resource depletion: evidence from a worldwide cross-country panel data analysis. Energy Econ. 130:107341. doi: 10.1016/j.eneco.2024.107341
Brodny, J., and Tutak, M. (2023). Assessing the energy security of European Union countries from two perspectives – a new integrated approach based on MCDM methods. Appl. Energy 347:121443. doi: 10.1016/j.apenergy.2023.121443
Cai, Y., Zhou, P., Zhang, Y., and Shen, Y. (2023). Natural resources extraction and sustainable environment: COP26 perspective for China. Resour. Policy 82:103530. doi: 10.1016/j.resourpol.2023.103530
Chen, X., Rahaman, M. A., Murshed, M., Mahmood, H., and Hossain, M. A. (2023). Causality analysis of the impacts of petroleum use, economic growth, and technological innovation on carbon emissions in Bangladesh. Energy 267:126565. doi: 10.1016/j.energy.2022.126565
Civan, M. Y., Elbir, T., Seyfioglu, R., Kuntasal, Ö. O., Bayram, A., Dogan, G., et al. (2015). Spatial and temporal variations in atmospheric VOCs, NO2, SO2, and O3 concentrations at a heavily industrialized region in Western Turkey, and assessment of the carcinogenic risk levels of benzene. Atmos. Environ. 103, 102–113. doi: 10.1016/j.atmosenv.2014.12.031
Dam, M. M., and Sarkodie, S. A. (2023). Renewable energy consumption, real income, trade openness, and inverted load capacity factor nexus in Turkiye: revisiting the EKC hypothesis with environmental sustainability. Sustain. Horizons 8:100063. doi: 10.1016/j.horiz.2023.100063
De Marchi, V. (2012). Environmental innovation and R&D cooperation: empirical evidence from Spanish manufacturing firms. Res. Policy 41, 614–623. doi: 10.1016/j.respol.2011.10.002
Dickey, D. A., and Fuller, W. A. (1979). Distribution of the estimators for autoregressive time series with a unit root. J. Am. Stat. Assoc. 74, 427–431. doi: 10.1080/01621459.1979.10482531
Dietz, T., and Rosa, E. (1994). Rethinking the environmental impacts of population, affluence and technology. Hum. Ecol. Rev.. 1, 277–300.
Djeunankan, R., Tadadjeu, S., and Kamguia, B. (2024). Linking energy poverty and industrialization: empirical evidence from African countries. Energy 292:130374. doi: 10.1016/j.energy.2024.130374
Du, Y., Wang, M., and Yin, Y. (2024). Research on innovation cooperation network of Chinese universities based on patent data. J. Eng. Technol. Manag. 71:101784. doi: 10.1016/j.jengtecman.2023.101784
Engel-Cox, J. A., and Chapman, A. (2023). Accomplishments and challenges of metrics for sustainable energy, population, and economics as illustrated through three countries. Front. Sustain. Energy Policy 2:1203520. doi: 10.3389/fsuep.2023.1203520
Ferwerda, J., Hainmueller, J., and Hazlett, C. J. (2017). Kernel-based regularized least squares in R (KRLS) and Stata (KRLS). J. Stat. Softw. 79, 1–26. doi: 10.18637/jss.v079.i03
GFN (2023). Global Footprint Network - Advancing the Science of Sustainability. Available at: https://data.footprintnetwork.org/#/countryTrends?cn=165&type=BCpc,EFCpc (accessed February 9, 2023).
Guo, D., Cao, X., Ma, L., Zhang, P., Liu, Y., and Bian, J. (2023). Bulk and interfacial properties of methane-heavy hydrocarbon mixtures. Energy 284:128679. doi: 10.1016/j.energy.2023.128679
Gupta, S., and Verma, J. K. (2023). Reverse traceability framework for identifying liability of crashes for self-driving vehicles using blockchains. J. Glob. Inf. Manag. 31, 1–21. doi: 10.4018/JGIM.329961
Hainmueller, J., Hazlett, C., and Michael Alvarez, R. (2014). Kernel regularized least squares: reducing misspecification bias with a flexible and interpretable machine learning approach. Polit. Anal. 22, 143–168. doi: 10.1093/pan/mpt019
Hossain, M. R., Singh, S., Sharma, G. D., Apostu, S.-A., and Bansal, P. (2023). Overcoming the shock of energy depletion for energy policy? Tracing the missing link between energy depletion, renewable energy development and decarbonization in the USA. Energy Policy 174:113469. doi: 10.1016/j.enpol.2023.113469
Hu, J., Chen, H., Dinis, F., and Xiang, G. (2023). Nexus among green finance, technological innovation, green fiscal policy and CO2 emissions: a conditional process analysis. Ecol. Indic. 154:110706. doi: 10.1016/j.ecolind.2023.110706
Huang, H., Ali, S., and Solangi, Y. A. (2023). Analysis of the impact of economic policy uncertainty on environmental sustainability in developed and developing economies. Sustainability 15:5860. doi: 10.3390/su15075860
Huang, Y., Hossain, M. R., and Haseeb, M. (2024). Energy transition at the crossroads of energy depletion and environmental policy stringency: energy policy framework for energy giants in the indo-pacific belt. Energy Policy 194:114311. doi: 10.1016/j.enpol.2024.114311
Huang, Z., and Ren, X. (2024). Impact of natural resources, resilient economic growth, and energy consumption on CO2 emissions. Resour. Policy 90:104714. doi: 10.1016/j.resourpol.2024.104714
Hussain, J., Khan, A., and Zhou, K. (2020). The impact of natural resource depletion on energy use and CO2 emission in Belt & Road initiative countries: a cross-country analysis. Energy 199:117409. doi: 10.1016/j.energy.2020.117409
IAEA (2023). Nuclear Technology for Development used Safely, Peacefully, Securely | IAEA. Available at: https://www.iaea.org/services/technical-cooperation-programme (accessed August 19, 2023).
IEA (2022). International Energy Agency. Available at: https://www.iea.org/ (accessed February 9, 2023).
Islam, M. M., Shahbaz, M., Sultana, T., Wang, Z., Sohag, K., and Abbas, S. (2023). Changes in environmental degradation parameters in Bangladesh: the role of net savings, natural resource depletion, technological innovation, and democracy. J. Environ. Manage. 343:118190. doi: 10.1016/j.jenvman.2023.118190
Jahanger, A., Ogwu, S. O., Onwe, J. C., and Awan, A. (2023). The prominence of technological innovation and renewable energy for the ecological sustainability in top SDGs nations: insights from the load capacity factor. Gondwana Res. 129, 381–397. doi: 10.1016/j.gr.2023.05.021
Jiakui, C., Abbas, J., Najam, H., Liu, J., and Abbas, J. (2023). Green technological innovation, green finance, and financial development and their role in green total factor productivity: empirical insights from China. J. Clean. Prod. 382:135131. doi: 10.1016/j.jclepro.2022.135131
Jin, G., and Huang, Z. (2023). Asymmetric impact of renewable electricity consumption and industrialization on environmental sustainability: evidence through the lens of load capacity factor. Renew. Energy 212, 514–522. doi: 10.1016/j.renene.2023.05.045
Jordan, S., and Philips, A. Q. (2018). Cointegration testing and dynamic simulations of autoregressive distributed lag models. Stata J. 18, 902–923. doi: 10.1177/1536867X1801800409
Kaffo Fotio, H., and Karim, A. (2024). Unravelling the impact of political risk on industrialization: evidence from Africa. Int. Econ. 179:100528. doi: 10.1016/j.inteco.2024.100528
Kaplan, A., Ronen-Eliraz, G., Ratner, S., Aviv, Y., Wolanov, Y., and Avisar, D. (2023). Impact of industrial air pollution on the quality of atmospheric water production. Environ. Pollut. 325:121447. doi: 10.1016/j.envpol.2023.121447
Khan, A., Chenggang, Y., Hussain, J., and Kui, Z. (2021a). Impact of technological innovation, financial development and foreign direct investment on renewable energy, non-renewable energy and the environment in Belt & Road Initiative countries. Renew. Energy 171, 479–491. doi: 10.1016/j.renene.2021.02.075
Khan, A., Sicen, L., Khan, B., and Salman, N. (2021b). On the influence of demographic structure and industrial growth on environmental quality. J. Environ. Manage. 288:112453. doi: 10.1016/j.jenvman.2021.112453
Khan, A., and Sun, C. (2023). The asymmetric nexus of energy-growth and CO2 emissions: an empirical evidence based on hidden cointegration analysis. Gondwana Res. 125, 15–28. doi: 10.1016/j.gr.2023.07.012
Khan, A., Sun, C., Xu, Z., and Liu, Y. (2023). Geopolitical risk, economic uncertainty, and militarization: significant agents of energy consumption and environmental quality. Environ. Impact Assess. Rev. 102:107166. doi: 10.1016/j.eiar.2023.107166
Kibria, M. G. (2023). Ecological footprint in Bangladesh: identifying the intensity of economic complexity and natural resources. Heliyon 9:e14747. doi: 10.1016/j.heliyon.2023.e14747
Kripfganz, S., and Schneider, D. C. (2020). Response surface regressions for critical value bounds and approximate p-values in equilibrium correction models1. Oxf. Bull. Econ. Stat. 82, 1456–1481. doi: 10.1111/obes.12377
Kuang, H., Liang, Y., Zhao, W., and Cai, J. (2023). Impact of natural resources and technology on economic development and sustainable environment – analysis of resources-energy-growth-environment linkages in BRICS. Resour. Policy 85:103865. doi: 10.1016/j.resourpol.2023.103865
Kyule, B. M., and Wang, X. (2024). Quantifying the link between industrialization, urbanization, and economic growth over Kenya. Front. Archit. Res. 13, 799–808. doi: 10.1016/j.foar.2024.03.009
Liao, J., Liu, X., Zhou, X., and Tursunova, N. R. (2023). Analyzing the role of renewable energy transition and industrialization on ecological sustainability: can green innovation matter in OECD countries. Renew. Energy 204, 141–151. doi: 10.1016/j.renene.2022.12.089
Liddle, B. (2012). The importance of energy quality in energy intensive manufacturing: evidence from panel cointegration and panel FMOLS. Energy Econ. 34, 1819–1825. doi: 10.1016/j.eneco.2012.07.013
Lin, B., and Ullah, S. (2023). Towards the goal of going green: do green growth and innovation matter for environmental sustainability in Pakistan. Energy 285:129263. doi: 10.1016/j.energy.2023.129263
Lin, B., and Ullah, S. (2024a). Effectiveness of energy depletion, green growth, and technological cooperation grants on CO2 emissions in Pakistan's perspective. Sci. Total Environ. 906:167536. doi: 10.1016/j.scitotenv.2023.167536
Lin, B., and Ullah, S. (2024b). Modeling the impacts of changes in nuclear energy, natural gas, and coal in the environment through the novel DARDL approach. Energy 287:129572. doi: 10.1016/j.energy.2023.129572
Lin, B., Zhu, R., and Raza, M. Y. (2022). Fuel substitution and environmental sustainability in India: perspectives of technical progress. Energy 261:125309. doi: 10.1016/j.energy.2022.125309
Liu, Y., Sadiq, F., Ali, W., and Kumail, T. (2022). Does tourism development, energy consumption, trade openness and economic growth matters for ecological footprint: testing the Environmental Kuznets Curve and pollution haven hypothesis for Pakistan. Energy 245:123208. doi: 10.1016/j.energy.2022.123208
Ma, D., Qin, B., Zhong, X., Sheng, P., and Yin, C. (2023). Effect of flammable gases produced from spontaneous smoldering combustion of coal on methane explosion in coal mines. Energy 279:128125. doi: 10.1016/j.energy.2023.128125
Marć, M., Bielawska, M., Simeonov, V., Namieśnik, J., and Zabiegała, B. (2016). The effect of anthropogenic activity on BTEX, NO2, SO2, and CO concentrations in urban air of the spa city of Sopot and medium-industrialized city of Tczew located in North Poland. Environ. Res. 147, 513–524. doi: 10.1016/j.envres.2016.03.014
Martins da Silveira, L. H., Cataldi, M., and Marcial de Farias, W. C. (2023). Development of multi-scale indices of human mobility restriction during COVID-19 based on air quality from local and global NO2 concentration. iScience 26:107599. doi: 10.1016/j.isci.2023.107599
Merlin, M. L., and Chen, Y. (2021). Analysis of the factors affecting electricity consumption in DR Congo using fully modified ordinary least square (FMOLS), dynamic ordinary least square (DOLS) and canonical cointegrating regression (CCR) estimation approach. Energy 232:121025. doi: 10.1016/j.energy.2021.121025
Muhammad, F., Khan, A., Hussain, J., Baig, T., and Baig, S. (2023). Influence of military expenditures, industrial growth, and financial development on economic growth, and environment in heterogeneous political regimes in Pakistan. J. Knowl. Econ. 15, 1–21. doi: 10.1007/s13132-023-01261-5
Opoku, E. E. O., and Aluko, O. A. (2021). Heterogeneous effects of industrialization on the environment: evidence from panel quantile regression. Struct. Chang. Econ. Dyn. 59, 174–184. doi: 10.1016/j.strueco.2021.08.015
Opoku, E. E. O., and Boachie, M. K. (2020). The environmental impact of industrialization and foreign direct investment. Energy Policy 137:111178. doi: 10.1016/j.enpol.2019.111178
Pandey, J., Majumdarr, S., Hassan, Y., and Benuyenah, V. (2023). Role of digital leadership capability in shaping IT innovation: a digital agility perspective. J. Glob. Inform. Manag. 31, 1–20. doi: 10.4018/JGIM.333168
Pang, L., Liu, L., Zhou, X., Hafeez, M., Ullah, S., and Sohail, M. T. (2024). How does natural resource depletion affect energy security risk? New insights from major energy-consuming countries. Energy Strateg. Rev. 54:101460. doi: 10.1016/j.esr.2024.101460
Patel, N., and Mehta, D. (2023). The asymmetry effect of industrialization, financial development and globalization on CO2 emissions in India. Int. J. Thermofluids 20:100397. doi: 10.1016/j.ijft.2023.100397
Pesaran, M. H., Shin, Y., and Smith, R. J. (2001). Bounds testing approaches to the analysis of level relationships. J. Appl. Econom. 16, 289–326. doi: 10.1002/jae.616
Phillips, P. C. B., and Perron, P. (1988). Testing for a unit root in time series regression. Biometrika 75, 335–346. doi: 10.1093/biomet/75.2.335
Raza, M. A., Khatri, K. L., Israr, A., Ul Haque, M. I., Ahmed, M., Rafique, K., et al. (2022). Energy demand and production forecasting in Pakistan. Energy Strateg. Rev. 39:100788. doi: 10.1016/j.esr.2021.100788
Raza, M. Y., and Lin, B. (2020). Decoupling and mitigation potential analysis of CO2 emissions from Pakistan's transport sector. Sci. Total Environ. 730:139000. doi: 10.1016/j.scitotenv.2020.139000
Raza, M. Y., and Lin, B. (2022). Renewable energy substitution and energy technology impact in a transitional economy: a perspective from Pakistan. J. Clean. Prod. 360:132163. doi: 10.1016/j.jclepro.2022.132163
Saqib, N., Ozturk, I., Usman, M., Sharif, A., and Razzaq, A. (2023). Pollution Haven or Halo? How European countries leverage FDI, energy, and human capital to alleviate their ecological footprint. Gondwana Res. 116, 136–148. doi: 10.1016/j.gr.2022.12.018
SBP (2023). State Bank of Pakistan. Available at: https://www.sbp.org.pk/ (accessed April 9, 2023).
Shen, Y., Jiang, F., Feng, S., Xia, Z., Zheng, Y., Lyu, X., et al. (2023). Increased diurnal difference of NO2 concentrations and its impact on recent ozone pollution in eastern China in summer. Sci. Total Environ. 858:159767. doi: 10.1016/j.scitotenv.2022.159767
Siche, R., Pereira, L., Agostinho, F., and Ortega, E. (2010). Convergence of ecological footprint and emergy analysis as a sustainability indicator of countries: Peru as case study. Commun. Nonlinear Sci. Numer. Simul. 15, 3182–3192. doi: 10.1016/j.cnsns.2009.10.027
Sikder, M., Wang, C., Yao, X., Huai, X., Wu, L., KwameYeboah, F., et al. (2022). The integrated impact of GDP growth, industrialization, energy use, and urbanization on CO2 emissions in developing countries: evidence from the panel ARDL approach. Sci. Total Environ. 837:155795. doi: 10.1016/j.scitotenv.2022.155795
Sinha, A., Sengupta, T., and Alvarado, R. (2020). Interplay between technological innovation and environmental quality: formulating the SDG policies for next 11 economies. J. Clean. Prod. 242:118549. doi: 10.1016/j.jclepro.2019.118549
Sun, C., Khan, A., and Kakar, S. A. (2023a). Pakistan's safe nuclear energy generation: an essential source to target sustainable development. Prog. Nucl. Energy 164:104850. doi: 10.1016/j.pnucene.2023.104850
Sun, W., and Yao, G. (2023). Impact of mineral resource depletion on energy use: role of energy extraction, CO2 intensity, and natural resource sustainability. Resour. Policy 86:104175. doi: 10.1016/j.resourpol.2023.104175
Sun, Y., Guan, W., Mehmood, U., and Yang, X. (2022). Asymmetric impacts of natural resources on ecological footprints: exploring the role of economic growth, FDI and renewable energy in G-11 countries. Resour. Policy 79:103026. doi: 10.1016/j.resourpol.2022.103026
Sun, Y., Usman, M., Radulescu, M., Korkut Pata, U., and Balsalobre-Lorente, D. (2023b). New insights from the STIPART model on how environmental-related technologies, natural resources and the use of the renewable energy influence load capacity factor. Gondwana Res. 129, 398–411. doi: 10.1016/j.gr.2023.05.018
Tang, T., and Kim, H. (2023). Linking energy policy, energy insecurity, and health outcomes. Front. Sustain. Energy Policy 2:1231821. doi: 10.3389/fsuep.2023.1231821
Tao, J., Waqas, M., Ali, M., Umair, M., Gan, W., and Haider, H. (2022). Pakistan's electrical energy crises, a way forward towards 50% of sustain clean and green electricity generation. Energy Strateg. Rev. 40:100813. doi: 10.1016/j.esr.2022.100813
Traoré, A., and Asongu, S. (2023). The diffusion of green technology, governance and CO2 emissions in Sub-Saharan Africa. Manag. Environ. Qual. An Int. J. ahead-of-print. doi: 10.2139/ssrn.4569640
Ullah, S., and Lin, B. (2024a). Assessing the environmental impacts of clean energy investment in Pakistan using a dynamic autoregressive distributed lag model. J. Environ. Manage. 365:121549. doi: 10.1016/j.jenvman.2024.121549
Ullah, S., and Lin, B. (2024b). Harnessing the synergistic impacts of financial structure, industrialization, and ecological footprint through the lens of the EKC hypothesis. Insights from Pakistan. Energy 307:132540. doi: 10.1016/j.energy.2024.132540
Ullah, S., and Lin, B. (2024c). Natural resources, renewable energy-environment nexus for Pakistan: a policy perspective. Resour. Policy 90:104788. doi: 10.1016/j.resourpol.2024.104788
Ullah, S., Tang, S., and Yousaf Raza, M. (2023). How the energy depletion rate and financial structure can promote environmental sustainability: empirical evidence from Pakistan using ecological footprints. Energy Strateg. Rev. 50:101208. doi: 10.1016/j.esr.2023.101208
United Nations (2023). COP26: Together for Our Planet | United Nations. Available at: https://www.un.org/en/climatechange/cop26 (accessed March 30, 2023).
Usman, M., and Balsalobre-Lorente, D. (2022). Environmental concern in the era of industrialization: can financial development, renewable energy and natural resources alleviate some load? Energy Policy 162:112780. doi: 10.1016/j.enpol.2022.112780
Verelst, L., De Cooman, R., and Verbruggen, M. (2023). Crafting when teleworking: a daily diary study on the combinations of job and home crafting and their relationship with energy depletion. J. Vocat. Behav. 143:103880. doi: 10.1016/j.jvb.2023.103880
Vougas, D. V. (2007). GLS detrending and unit root testing. Econ. Lett. 97, 222–229. doi: 10.1016/j.econlet.2007.03.016
Wang, Q., Sun, J., Li, R., and Korkut Pata, U. (2023a). Linking trade openness to load capacity factor: the threshold effects of natural resource rent and corruption control. Gondwana Res. 129, 371–380. doi: 10.1016/j.gr.2023.05.016
Wang, Q., Sun, Z., Guo, J., and Li, R. (2023b). The more effective option to combat environmental degradation: energy efficiency vs. renewable energy vs. natural gas? Energy 283:128512. doi: 10.1016/j.energy.2023.128512
Wang, W., Rehman, M. A., and Fahad, S. (2022). The dynamic influence of renewable energy, trade openness, and industrialization on the sustainable environment in G-7 economies. Renew. Energy 198, 484–491. doi: 10.1016/j.renene.2022.08.067
WDI (2022). World Bank Open Data | Data. Available at: https://data.worldbank.org/ (accessed February 10, 2023).
Xu, P., Hussain, M., Ye, C., Wang, J., Wang, C., Geng, J., et al. (2022). Natural resources, economic policies, energy structure, and ecological footprints' nexus in emerging seven countries. Resour. Policy 77:102747. doi: 10.1016/j.resourpol.2022.102747
Yang, B., Usman, M., and jahanger, A. (2021). Do industrialization, economic growth and globalization processes influence the ecological footprint and healthcare expenditures? Fresh insights based on the STIRPAT model for countries with the highest healthcare expenditures. Sustain. Prod. Consum. 28, 893–910. doi: 10.1016/j.spc.2021.07.020
Yang, X., Kong, L., and Qu, S. (2024). Evolution of technology cooperation networks based on networked evolutionary games model: an industrial heterogeneity perspective. Technol. Soc. 78:102631. doi: 10.1016/j.techsoc.2024.102631
Yousaf Raza, M., and Lin, B. (2023). Development trend of Pakistan's natural gas consumption: a sectorial decomposition analysis. Energy 278:127872. doi: 10.1016/j.energy.2023.127872
Zhan, Y., Lin, B., and Sun, C. (2023). How does pollution heterogeneity affect the role of cleaner production regulations? Evidence from Chinese enterprises' domestic value-added in exports. Energy Econ. 122:106681. doi: 10.1016/j.eneco.2023.106681
Zhang, S., and Chen, K. (2023). Green finance and ecological footprints: natural resources perspective of China's growing economy. Resour. Policy 85:103898. doi: 10.1016/j.resourpol.2023.103898
Keywords: environmental sustainability, energy shocks, industrialization, technical cooperation grants, load capacity factor
Citation: Ullah S and Lin B (2025) An environmental assessment through load capacity factor: the dynamic effects of technological cooperation grants and energy depletion in Pakistan. Front. Sustain. Energy Policy 3:1438573. doi: 10.3389/fsuep.2024.1438573
Received: 26 May 2024; Accepted: 09 December 2024;
Published: 07 January 2025.
Edited by:
Kentaka Aruga, Saitama University, JapanReviewed by:
Mohammad Haseeb, Wuhan University, ChinaMuhammad Yousaf Raza, Economics School of Shandong Technology and Business University, China
Copyright © 2025 Ullah and Lin. This is an open-access article distributed under the terms of the Creative Commons Attribution License (CC BY). The use, distribution or reproduction in other forums is permitted, provided the original author(s) and the copyright owner(s) are credited and that the original publication in this journal is cited, in accordance with accepted academic practice. No use, distribution or reproduction is permitted which does not comply with these terms.
*Correspondence: Boqiang Lin, YnFsaW5AeG11LmVkdS5jbg==; YnFsaW4yMDA0QHZpcC5zaW5hLmNvbQ==
 Sami Ullah
 Boqiang Lin