 Keiichiro Hata
 Toshio Yanagiya1,2,†
 Yoshio Suzuki
94% of researchers rate our articles as excellent or good
Learn more about the work of our research integrity team to safeguard the quality of each article we publish.
Find out more
ORIGINAL RESEARCH article
Front. Sports Act. Living, 10 January 2025
Sec. Exercise Physiology
Volume 6 - 2024 | https://doi.org/10.3389/fspor.2024.1522214
This article is part of the Research TopicPhysiological Aspects of Marathon RunningView all articles
Introduction: Marathon running has become increasingly popular among amateur athletes, many of whom maintain speeds of 8–9 km/h. However, existing methods for estimating oxygen consumption (VO2) during running and walking—such as the American College of Sports Medicine (ACSM) equations and commercial activity monitors—often lack accuracy and transparency. This study introduces the Hata-Yanagiya Physical Activity Calculation (HYPAC) system, a novel approach for estimating VO2 using Global Positioning System (GPS) and map data.
Methods: The HYPAC system was developed through regression equations based on metabolic equivalents (METs) and slope data. To validate the system, 10 university students (5 runners, 5 non-runners) completed a 5 km course while equipped with a GPS device and a portable metabolic measurement system. VO2 estimates from the HYPAC system were compared with measured values and those calculated using ACSM equations.
Results: The HYPAC system demonstrated high accuracy in estimating VO2, with a relative error of −0.03 [95% confidence intervals (CI): −0.14, 0.08] compared to measured values. For the running group, the HYPAC system achieved the lowest absolute mean relative error (0.02). In the mixed running/walking group, the HYPAC system maintained strong performance with a relative error of −0.07 (95% CI: −0.26, 0.12).
Discussion: The HYPAC system provides a transparent and accurate method for estimating VO2 during walking and running, outperforming existing methods under varied conditions. Its open-source framework encourages further validation and improvement by researchers and practitioners. Future studies should address limitations such as sample size and population diversity to enhance the system's applicability.
Marathon running, a demanding endurance sport, has become increasingly popular worldwide, providing participants with immense satisfaction upon completing the 42.195-km course. Driven by rising health consciousness and the appeal of personal challenge, many amateur runners now undertake full marathons. Most amateur events set a time limit of approximately six hours, with a substantial portion of finishers maintaining an average pace of 8–9 km/h. For example, at the 17th Shonan International Marathon in Kanagawa, Japan, held on December 4, 2022, the average speeds for male and female runners were 9.4 ± 1.8 km/h (n = 10,585) and 8.6 ± 1.4 km/h (n = 1,645), respectively. Among these, 41.7% of men and 55.7% of women finished with an average speed between 7 and 9 km/h, according to the official event data (1).
The American College of Sports Medicine (ACSM) provides equations for estimating VO2 during walking and running (2):
Walking (<8 km/h)
Running (≥8 km/h)
However, an inconsistency arises at exactly 8 km/h with a flat slope (0), yielding VO2 values of 16.8 ml/kg/min for walking and 30.2 ml/kg/min for running, potentially causing errors around this speed. Various commercial activity monitors also estimate energy expenditure during exercise. Typically, worn on the wrist or arm, these devices utilize acceleration sensors, heart rate monitors, or measures like heat or galvanic skin response to estimate energy consumption. However, these devices tend to underestimate energy consumption, and discrepancies among devices are common (3). Additionally, none of these devices disclose their calculation algorithms.
In soccer, Global Positioning System (GPS)-based devices estimate physical activity based on movement data, though they often underestimate energy expenditure. Accuracy improves when anaerobic components, such as excess postexercise oxygen consumption, are excluded (4); however, these devices also lack published calculation algorithms. Consequently, no scientifically validated method currently exists to reliably measure VO2, and thereby energy expenditure, for recreational marathon runners.
A GPS device can record the latitude, longitude, and time of a marathon runner with high temporal resolution. Altitude data at each GPS-measured point can be derived from map information, allowing for the calculation of altitude differences and slope between points. Therefore, both speed and slope between each measured point can be determined from GPS and map data. The metabolic equivalents (METs) for various physical activities are cataloged in the Compendium of Physical Activities (5), an internationally recognized resource that includes METs for horizontal walking and running at different speeds. Additionally, VO2 requirements for walking and running on slopes at various speeds have been documented (6).
We hypothesized that a regression equation for estimating VO2 during walking and running could be developed using the METs table and slope data from Minetti et al. (6), enabling VO2 estimation based on speed and slope from GPS and map data. In this study, we present the Hata-Yanagiya Physical Activity Calculation (HYPAC) system, a calculation method derived from regression equations based on this hypothesis, and validate its effectiveness in a sample of university students.
The exercise intensities for various horizontal speeds and standing still were extracted from the Compendium of Physical Activities (Supplementary Table S1). Although no single equation accurately represented the data, two regression models using the natural logarithm of METs as the dependent variable (Equations 1, 2) demonstrated a strong fit, with high coefficients of determination, using 8.69 km/h as a threshold (Figure 1). VO2 was calculated with the standard conversion of 1 MET to 3.5 ml/kg/min.
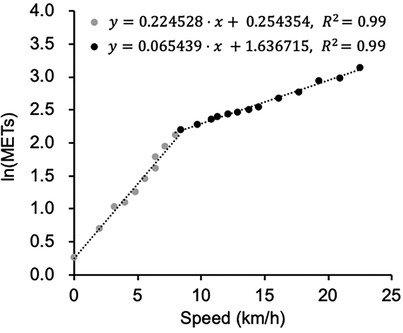
Figure 1. The relationship between speed and ln(METs). Gray dots represent speeds <8.69 km/h, while black dots indicate speeds ≥8.69 km/h.
Speed < 8.69 km/h
Speed ≥ 8.69 km/h
Minetti et al. reported VO2 values for running at various speeds on gradients up to ±45% (6). VO2 for horizontal travel at each speed was determined using regression equations (Equations 1, 2) and then compared with the VO2 values from Minetti et al. (6). The cost of slope, defined as the ratio of oxygen consumption for inclined travel relative to horizontal travel, was closely approximated by a quadratic regression curve with a Y-intercept of 1, using slope (%) as the independent variable (Equation 3; Figure 2):
where:
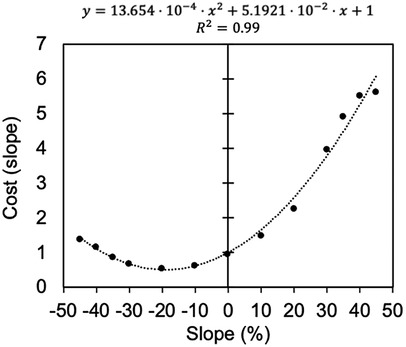
Figure 2. Relationship between slope and cost (slope) in terms of VO2. The horizontal axis represents the slope (%), and the vertical axis represents the slope cost in VO2 terms.
Slope is defined as (vertical/horizontal) × 100 (%).
Based on this relationship, exercise intensity during running or walking on a slope was calculated as follows (Equation 4):
where:
METsslope: METs on a slope
METshorizon: METs for horizontal movement calculated from speed (km/h) using Equations 1, 2
Cost (slope): The VO2 rate in slope travel compared to horizontal travel
Using these equations, a system was developed to calculate VO2 from GPS and map data. For each GPS-measured coordinate, altitude data can be obtained via the application program interface of the Geospatial Information Authority of Japan (7). From this data, the Euclidean distance, slope, and speed between each adjacent point were calculated. Exercise intensity (METs × h) for each segment can then be computed, and the total exercise (METs × h) for on-foot travel as measured by GPS can be obtained. VO2 for the entire travel can be calculated using the individual's body mass and a standard VO2 value of 3.5 ml/kg/min per 1 MET.
This novel calculation method, termed the HYPAC system, is available as a Python script on GitHub (https://github.com/KH-SPORTSBIOMECH/HYPAC-Hata-YanagiyaPhysicalActivityCalculationSystem; (8).
Ten healthy university students participated in this study (Age: 23.7 ± 2.4 years, Height: 1.67 ± 0.10 m, Body Weight: 59.7 ± 7.0 kg). Their characteristics were summarized in Table 1. Five males were recreational runners with regular exercise habits (Participants A to E in Table 1), while one male and four females had no exercise habits (Participants F to J in Table 1). Body mass measurements included the apparatus, shoes, and gear. Percentage body fat was assessed using a body composition analyzer (InBody 730, InBody Japan Inc., Japan). All participants completed the study and were included in the analysis. The study was approved by the Ethics Committee of Juntendo University Graduate School of Health and Sport Science (approval code: 2023-143) and conducted in accordance with the Declaration of Helsinki.
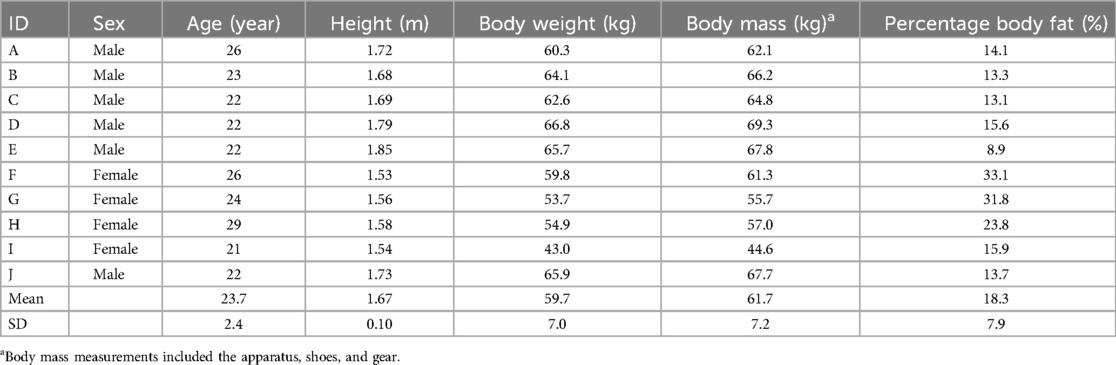
Table 1. Characteristics of participants.
Participants were divided into two groups: a running group (participants A to E) and a running/walking group (participants F to J). GPS data and VO2 measurements were collected using a wearable smartwatch device (Garmin Foreathlete 745, Garmin Ltd., USA) and a breath-by-breath wearable metabolic system K5 (Cosmed, Italy)—the golden standard system for oxygen consumption, respectively.
Participants traveled a 5-kilometer (km) route that included downhill, uphill, and flat terrain. The running group ran at a moderate speed, with the requirement of completing the route without walking, while the running/walking group completed the route by alternating between running and walking, according to individual preferences and abilities. The route was set up using a route within our university and an outdoor route with minimal car traffic. During the measurement, we followed the subject on a bicycle to ensure the safety of the participants and give directions.
VO2 values were calculated by the HYPAC system using GPS data obtained from the 5 km runs and walks. For comparison, VO2 was also calculated using the ACSM method, which included two equations based on a speed threshold of 8 km/h. For each adjacent point, VO2 was calculated using the ACSMRW equation, while the ACSMRun equation was applied only to speeds of 8 km/h and above.
The VO2 calculated by each of the three methods (HYPAC, ACSMRW, and ACSMRun) was then compared with the measured VO2 obtained from the K5. The distribution of VO2 values for K5, HYPAC, ACSMRW, and ACSMRun was assessed using the Shapiro–Wilk test, which indicated that normality could be assumed. Relative error against K5, calculated as (Method—K5)/K5, was tested with a one-sample t-test, using 0 as the reference value. A generalized linear model was applied to compare the VO2 values obtained using the four methods and to analyze differences between each method and the K5 measurements. These statistical analyses were conducted using IBM SPSS version 29.0 (IBM Japan, Tokyo, Japan), with significance set at less than 0.05. Bland–Altman plot was used to analyze the agreement in VO2 between each method and K5 measurement using MATLAB (MATLAB R2021b, MathWorks, USA).
The VO2, mean speed, and finish time for each participant are presented in Table 2.
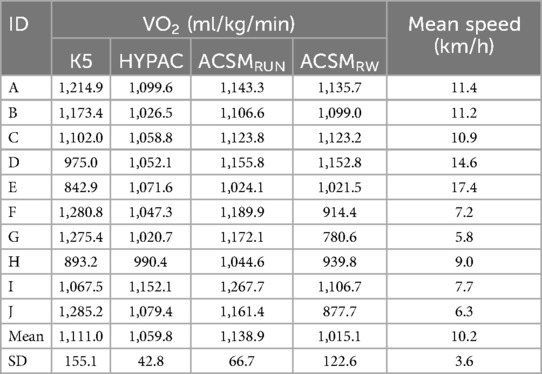
Table 2. The VO2, mean speed, and finish time for each participant.
The VO2 measured by K5 showed no significant differences from the VO2 values calculated by HYPAC, ACSMRW, or ACSMRun. However, ACSMRun values were significantly higher than those calculated by HYPAC (p < 0.001) and ACSMRW (p = 0.029) (Figure 3).
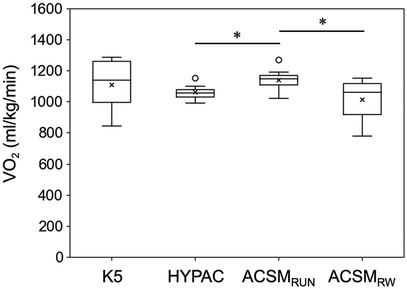
Figure 3. VO2 measured by K5 and calculated by HYPAC, ACSMRW, and ACSMRun. *Indicates significant differences between methods.
Relative errors and 95% confidence intervals (CIs) for HYPAC, ACSMRun, and ACSMRW in VO2 compared to K5 were shown in Figure 4.
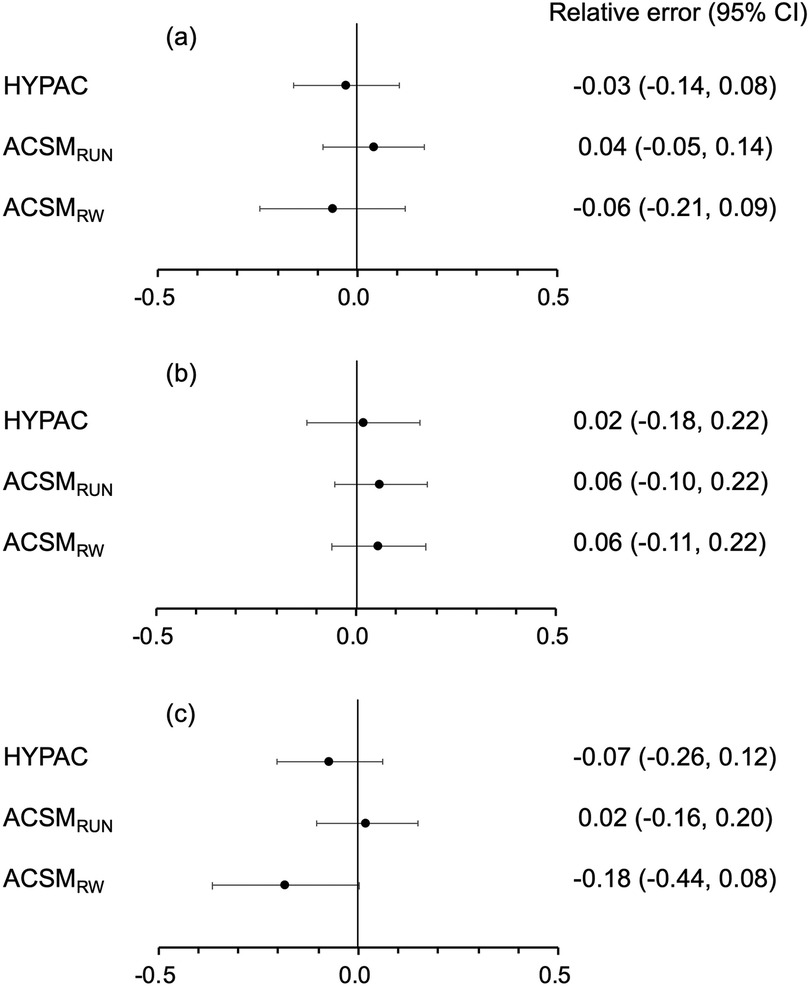
Figure 4. Relative errors and 95% confidence intervals (CI) in VO2 for HYPAC, ACSMRun, and ACSMRW compared to K5: (a) whole group, (b) running group, and (c) running/walking group.
Across all groups, including both the running and running/walking groups, HYPAC had the smallest mean relative error (0.03) against K5, while ACSMRW showed the largest (0.06) (Figure 4a). When analyzed separately, the running group (mean speed: 10.9–17.4 km/h) had a smaller mean relative error with HYPAC (0.02) than with ACSMRun and ACSMRW (Figure 4b). Notably, in the running/walking group (mean speed: 5.8–9.0 km/h), ASCMRun showed the smallest error (0.02), while ACSMRW had the largest error (0.18) (Figure 4c).
Statistical analysis showed no significant differences in the relative error against K5 for any of the methods, nor were there significant differences between the methods in terms of relative error against K5.
From the Bland–Altman analysis, all samples for each method for VO2 estimation were distributed within the limits of agreement, confirming a strong agreement in VO2 between the K5 and each method (Figure 5).

Figure 5. Bland–Altman plot of differences in VO2 between the K5 and HYPAC (a), ACSMRUN (b), ACSMRW (c) the solid line indicates the bias, which refers to the systematic difference (mean difference) between the K5 method and each method for calculating VO2. The dashed lines indicate the limits of agreement (±1.96 standard deviation).
In this study, the HYPAC system demonstrated a low relative error in estimating VO2 during both walking and running compared to the K5 respiratory gas meter, particularly during running. Energy expenditure, calculated from VO2 using a conversion rate of 5 kcal/L of oxygen consumed, can therefore be accurately estimated with the HYPAC system during these activities.
As mentioned in the Introduction, the ACSM formula has long been the standard for estimating VO2 in walking and running (2), providing two equations—one for walking (<8 km/h) and one for running (≥8 km/h). However, a notable gap exists at 8 km/h on level ground, where the calculated VO2 jumps from 16.8 ml/kg/min (walking) to 30.2 ml/kg/min (running) (Supplementary Table S1). Given that the average speed for many amateur marathon runners is between 7 and 9 km/h, the applicability of the ACSM formula to all marathon runners is unclear. For instance, at the 2022 Shonan International Marathon, this speed range was common (1). Similarly, approximately 11% of the 26,622 finishers in the 2023 Boston Marathon ran between 7 and 9 km/h (9). Therefore, the ACSM formula may not accurately estimate VO2 of all marathon runners.
The HYPAC system aims to provide accurate VO2 estimates for walking and running by calculating METs for horizontal movement based on speed and adjusting for incline. In this study, participants walked and ran on a 5 km road course at average speeds ranging from 5.8 to 17.4 km/h, and their VO2 measurements from the HYPAC system closely aligned with K5 measurements, showing a relative error of only 3%.
While numerous wearable devices are available to measure physical activity, they often show significant variability. The accuracy of wrist-worn GPS devices is high and continues to improve. According to a 2013 report, the relative error of the Garmin® Forerunner 110 ranged from 0.8% to 6.2% (10). A 2020 study comparing different models reported that the relative error of GPS in wearable devices ranged from 0.6% ± 0.3% to 1.9% ± 1.5% (11). Regarding energy expenditure, a 2020 meta-analysis by O'Driscoll et al. reported a pooled mean bias, Hedges’ g, for running of −0.08. Although the differences from the reference measurements (indirect calorimetry, room calorimeters, and doubly labeled water) were minor, significant heterogeneity was observed across devices (3). Additionally, the 95% CIs for each device indicated a standard error greater than 0.3 for all devices (3). In a recent review by Germini et al., a meta-analysis could not be performed due to large heterogeneity between devices, and the mean absolute percentage error exceeded 30% for all devices in estimating energy consumption (12). In addition to this substantial margin of error, the calculation methods used in commercially available devices have not been disclosed.
In contrast, the HYPAC system demonstrated a higher degree of accuracy in estimating VO2, with a relative error of −0.03 (95% CI: −0.14, 0.08), achieved by directly measuring VO2 rather than relying on indirect methods. The Python code for the HYPAC system used in this study is also available on GitHub (https://github.com/KH-SPORTSBIOMECH/HYPAC-Hata-YanagiyaPhysicalActivityCalculationSystem) (8). This allows researchers and practitioners to verify and enhance the system. Therefore, the HYPAC system is superior to commercially available devices for estimating VO2 during walking and running, as its calculation methods are transparent and validated.
Furthermore, when walking and running were mixed, the estimate using ACSMRun was closest to the actual VO2. Since ACSMRun is a formula applicable to running speeds of 8 km/h or more, VO2 was likely overestimated when walking was included at speeds below 8 km/h. We hypothesized that ACSMRW, a modification of the ACSM formula based on speed, would provide more accurate estimates; however, this hypothesis was rejected. Although the HYPAC system had lower estimation accuracy than ACSMRun in this mixed walking/running condition, the relative error in actual VO2 was −0.07 (95% CI: −0.26, −0.12), which is considered sufficiently acceptable. Additionally, the HYPAC system, like ACSMRun, underestimated VO2. Therefore, the HYPAC system may require further refinement to accommodate variations in speed and activity. However, these results were derived from a small sample size (n = 5). Further research is warranted to re-examine the applicability of ACSMRun at speeds of 8 km/h or greater in mixed walking and running conditions with a larger sample size. In addition, The Bland–Altman analysis confirmed a strong agreement in VO₂ between the K5 and each method. The bias in VO₂ measurements was 3.8 ml/kg/min for the HYPAC method and −3.3 ml/kg/min for the ACSMRUN method, both of which represent small biases. A trend was observed where both the HYPAC and ACSMRUN methods tended to overestimate below approximately 1,100 ml/kg/min and underestimate them above approximately 1,100 ml/kg/min compared to the values measured by K5. However, the small sample size may have contributed to this trend.
When comparing VO2, the normality of the distribution could be assumed, but this may be due to the small sample size. Therefore, we compared the methods using the distribution-free generalized linear model. Several factors, such as weight, sex, and body composition, could confound the comparison. However, due to the small sample size, which may lead to overfitting, these factors were not controlled for in the comparison between methods using the generalized linear model. Instead, all data were presented in tabular form, allowing researchers to make their own judgments.
This study has several limitations. First, the sample size for the validity study was small, with n = 5 for each of the running and walking/running groups. This may have resulted in wider 95% CIs for relative error. The sample size needs to be increased to provide more accurate measurement accuracy. Second, the participants in this study were physically active university students with a narrow age range. Therefore, further research is needed to adapt the HYPAC system to other subjects, such as older recreational runners and sedentary individuals. In addition, this study did not examine the effects of sex or body composition. The METs that form the basis of the HYPAC system are defined based on VO2 at rest and are not affected by sex. Although body fat consumes less oxygen than lean mass, it contributes to total VO2 as weight. The GPS data was collected using Germin, but there may be a potential for bias in GPS data. Therefore, in order to clarify and further improve the characteristics of the HYPAC system, it is necessary to also consider the effects of sex differences and body fat percentage.
This study demonstrated that the HYPAC system, which uses estimation formulas for VO2 based on published VO2 data during exercise, along with speed and elevation data obtained from GPS-map data at nearly one-second intervals, can estimate VO2 during running and walking with high accuracy, showing a relative error of −0.03 (95% CI: −0.14, 0.08). The HYPAC system offers a transparent, evidence-based calculation method, and the Python script has also been made publicly available. However, there remains significant limitations due to small sample size and homogeneity of the participants. Consequently, further dissemination, verification, and refinement of the system are expected in the future.
The original contributions presented in the study are included in the article/Supplementary Material, further inquiries can be directed to the corresponding author.
The studies involving humans were approved by the Ethics Committee of Juntendo University Graduate School of Health and Sport Science. The studies were conducted in accordance with the local legislation and institutional requirements. The participants provided their written informed consent to participate in this study. Written informed consent was obtained from the individuals for the publication of any potentially identifiable images or data included in this article.
KH: Methodology, Validation, Writing – review & editing, Data curation, Investigation, Writing – original draft. TY: Methodology, Writing – review & editing, Conceptualization, Funding acquisition, Project administration, Resources. HN: Methodology, Writing – review & editing. YS: Methodology, Writing – review & editing, Conceptualization, Formal Analysis, Funding acquisition, Supervision, Validation.
The authors declare financial support was received for the research, authorship, and/or publication of this article. This study was supported by a grant from the Joint Research Program of Juntendo University, Faculty of Health and Sports Science, and the Institute of Health and Sports Science & Medicine, Juntendo University. The APC was supported by the Research Encouragement Program of Juntendo University, Faculty of Health and Sports Science.
The development of the HYPAC system was inspired by the challenge of estimating energy consumption for the Trans Japan Alps Race. We extend our thanks to all participants and TJAR staff, especially Mr. Tomohiko Yukawa and Mr. Hiroshi Iijima, for their support and to Mr. Kuwahara (IBUKI, OND Inc., Kyoto, Japan) for his guidance on GPS.
The authors declare that the research was conducted in the absence of any commercial or financial relationships that could be construed as a potential conflict of interest.
The author(s) declare that no Generative AI was used in the creation of this manuscript.
All claims expressed in this article are solely those of the authors and do not necessarily represent those of their affiliated organizations, or those of the publisher, the editors and the reviewers. Any product that may be evaluated in this article, or claim that may be made by its manufacturer, is not guaranteed or endorsed by the publisher.
The Supplementary Material for this article can be found online at: https://www.frontiersin.org/articles/10.3389/fspor.2024.1522214/full#supplementary-material
1. 2022 Shonan International Marathon. The 17th Shonan International Marathon (2022). Available online at: https://www.shonan-kokusai.jp/17th/news/221204-2.html (Accessed September 30, 2024)
2. Glass S, Dwyer GB, American College of Sports Medicine. ACSM’s Metabolic Calculations Handbook. Baltimore: Lippincott Williams & Wilkins (2007).
3. O’Driscoll R, Turicchi J, Beaulieu K, Scott S, Matu J, Deighton K, et al. How well do activity monitors estimate energy expenditure? A systematic review and meta-analysis of the validity of current technologies. Br J Sports Med. (2020) 54:332–40. doi: 10.1136/bjsports-2018-099643
4. Dasa MS, Friborg O, Kristoffersen M, Pettersen G, Sundgot-Borgen J, Rosenvinge JH. Accuracy of tracking devices’ ability to assess exercise energy expenditure in professional female soccer players: implications for quantifying energy availability. Int J Env Res Public Health. (2022) 19:4770. doi: 10.3390/ijerph19084770
5. Ainsworth BE, Haskell WL, Herrmann SD, Meckes N, Bassett DR, Tudor-Locke C, et al. 2011 compendium of physical activities. Med Sci Sports Exerc. (2011) 43:1575–81. doi: 10.1249/MSS.0b013e31821ece12
6. Minetti AE, Moia C, Roi GS, Susta D, Ferretti G. Energy cost of walking and running at extreme uphill and downhill slopes. J Appl Physiol. (2002) 93:1039–46. doi: 10.1152/japplphysiol.01177.2001
7. Geospatial Information Authority of Japan. Geospatial Information Authority of Japan website terms of use (version 2.0) (2024). Available online at: https://www.gsi.go.jp/ENGLISH/index.html (Accessed September 30, 2024)
8. Hata K. HYPAC: Hata-yanagiya physical activity calculation system, KH-SPORTSBIOMECH. Github repository (2024). Available online at: https://github.com/KH-SPORTSBIOMECH/HYPAC-Hata-Yan (Accessed September 30, 2024).
9. Boston Athletic Association. Boston Marathon 2023 results: runner. Boston Athletic Association (2023). Available online at: https://results.baa.org/2023/?page=1012&pid=list&p (Accessed September 30, 2024).
10. Nielsen RO, Cederholm P, Buist I, Sørensen H, Lind M, Rasmussen S. Can GPS be used to detect deleterious progression in training volume among runners? J Strength Cond Res. (2013) 27:1471–8. doi: 10.1519/JSC.0b013e3182711e3c
11. Johansson RE, Adolph ST, Swart J, Lambert MI. Accuracy of GPS sport watches in measuring distance in an ultramarathon running race. Int J Sports Sci Coa. (2020) 15:212–9. doi: 10.1177/1747954119899880
Keywords: HYPAC system, oxygen consumption, GPS, energy expenditure, marathon, metabolic equivalents, METs, physical activity
Citation: Hata K, Yanagiya T, Noro H and Suzuki Y (2025) Hata-Yanagiya physical activity calculation system: a novel global positioning system-based method for accurate estimation of oxygen consumption during walking and running. Front. Sports Act. Living 6:1522214. doi: 10.3389/fspor.2024.1522214
Received: 4 November 2024; Accepted: 20 December 2024;
Published: 10 January 2025.
Edited by:
Hun-Young Park, Konkuk University, Republic of KoreaReviewed by:
Sung-Woo Kim, Konkuk University, Republic of KoreaCopyright: © 2025 Hata, Yanagiya, Noro and Suzuki. This is an open-access article distributed under the terms of the Creative Commons Attribution License (CC BY). The use, distribution or reproduction in other forums is permitted, provided the original author(s) and the copyright owner(s) are credited and that the original publication in this journal is cited, in accordance with accepted academic practice. No use, distribution or reproduction is permitted which does not comply with these terms.
*Correspondence: Yoshio Suzuki, eXNzdXp1a2lAanVudGVuZG8uYWMuanA=
†These authors have contributed equally to this work and share first authorship
Disclaimer: All claims expressed in this article are solely those of the authors and do not necessarily represent those of their affiliated organizations, or those of the publisher, the editors and the reviewers. Any product that may be evaluated in this article or claim that may be made by its manufacturer is not guaranteed or endorsed by the publisher.
Research integrity at Frontiers
Learn more about the work of our research integrity team to safeguard the quality of each article we publish.