 Francis E. Holway1
 Francesco Campa
- 1Departamento de Medicina Aplicada a los Deportes, Club Atlético River Plate, Buenos Aires, Argentina
- 2Department of Biomedical Sciences, University of Padua, Padova, Italy
- 3Department of Sport and Informatics, Section of Physical Education and Sport, Pablo de Olavide University, Sevilla, Spain
- 4Medical Department of A.C.F. Fiorentina S.r.l., Florence, Italy
- 5Departamento de Nutrición, Universidad de Morón, Buenos Aires, Argentina
- 6Departamento de Medicina, CEFAR, Buenos Aires, Argentina
Introduction: Evaluating the body composition and dietary habits of non-professional athletes can help identify areas for improvement to enhance sports performance. The present study aimed to describe the anthropometric and body composition features, as well as the dietary habits, of non-professional rugby players in Argentina.
Methods: Fifty-seven rugby players from a Group III Club of the Unión de Rugby de Buenos Aires (URBA) were assessed using extensive anthropometric measurements according to the International Society for the Advancement of Kinanthropometry (ISAK) protocol. Reference data from professional rugby players in Group I clubs were used as a control for body composition comparisons. Dietary intake was evaluated using the 24-h recall method, and nutrient analysis was performed with SARA software.
Results: Non-professional rugby players were shorter (Forwards: 175.9 vs. 181.5 cm; Backs: 172.5 vs. 175.7 cm), had higher body fat percentages (Forwards: 16.4 vs. 12.3%; Backs: 11.0 vs. 9.3%), and were less muscular (Forwards: 46.0 vs. 48.8%; Backs: 48.4 vs. 50.2%) compared to professional rugby players. The average dietary intake was 3,363 Kcal, with protein and carbohydrate intakes of 1.4 g kg−1 day−1 and 4.1 g kg−1 day−1, respectively, and 35% of energy intake from fat. Backs reported a higher caloric intake than forwards (3,682 vs. 2,827 Kcal). There was a high prevalence of insufficient intake of calcium (58%), vitamin A (49%), and vitamin C (65%), the latter two corresponding with a low intake of fruits and vegetables (6% of total energy intake). Meal pattern analysis showed that 46% of total energy was ingested at dinner.
Conclusions: The body composition of non-professional rugby players from low-income clubs could be improved to enhance rugby performance, as compared to players in more competitive tiers. Economic constraints might contribute to a sub-optimal nutritional profile, potentially affecting body composition and on-field performance negatively. Recommendations to improve dietary intake should be made considering the budget constraints of these players.
1 Introduction
Body composition describes the various components that make up body mass. These components can be described and organized according to increasing levels of complexity, divided into five distinct levels (1), as shown in Figure 1. For example, an oxygen atom combined with two hydrogen atoms forms a water molecule, which is then incorporated into different cells, albeit in varying quantities, as well as into extracellular spaces. Different groups of cells are then organized to form tissues, which generate organs and result in systems that are part of the fourth level of organization. Regarding this fourth level, each component results from the sum of different types of molecules. For instance, visceral and internal adipose tissue not only include non-essential lipids that constitute fat mass at the molecular level but also small amounts of water, proteins, and other molecules that combine to form vessels and connective components, which are part of the adipose tissue (2).
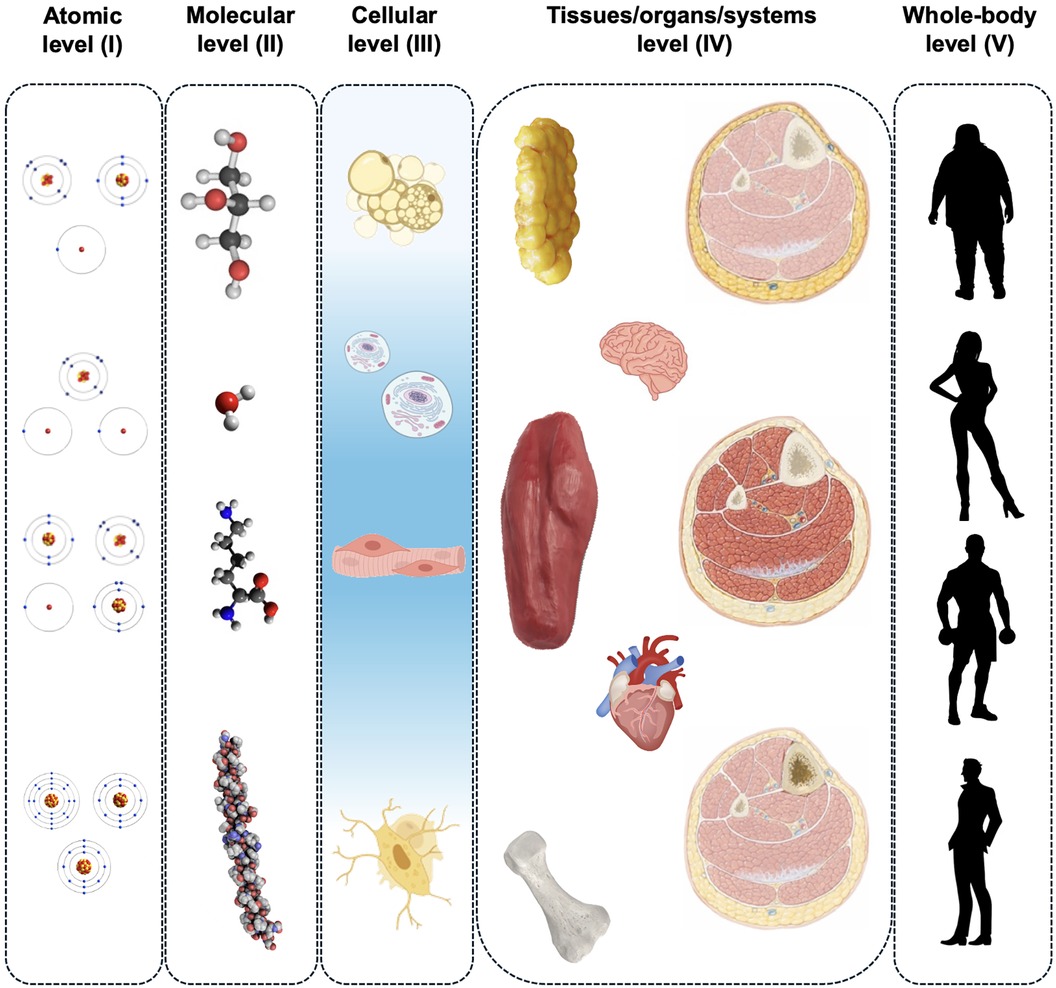
Figure 1 The five levels of body composition.
The quantification of body composition parameters can be achieved through indirect methods or using predictive formulas based on anthropometric or bioimpedance measurements and is generally tailored to the specific needs of the groups being assessed. In sports, it is common to consider parameters such as fat mass, body water, adipose tissue, and muscle tissue. Additionally, raw parameters based on anthropometric measurements can be used in a qualitative approach by assessing somatotype components or simply comparing them with reference values using z-scores (3).
Rugby is a high-intensity intermittent contact sport that relies on glycogen as a principal fuel source and requires a moderate-to-high carbohydrate intake (7–8 g kg−1 day−1) to replenish stores (4, 5). Additionally, the evolution of rugby players' physiques, especially since the adoption of professionalism in 1995, necessitates dietary and exercise intervention programs to increase size and muscle mass and reduce body fat (6). The dimensional characteristics of players can result by selection pressures, with lower competitive gradient leagues presenting smaller players (7). Different playing positions in rugby can also lead to variations in the size and body composition of the players. For instance, forwards, who are often involved in physical confrontations and scrums, tend to have greater body mass and higher fat percentages compared to backs, who generally require more speed and agility and thus have leaner and more muscular physiques (8).
The nutritional recommendations for increasing muscle mass include consuming 1.2–1.6 g kg−1 day−1 of protein, along with sufficient energy and carbohydrate intake to support growth. These dietary guidelines should be combined with proper resistance training programs to maximize muscle hypertrophy (9). To optimize muscle growth, it is recommended that moderate protein intake should come from high-quality sources such as milk, eggs, and meat (10). Although health concerns regarding fat, saturated fat, and cholesterol intake have been highlighted in American football and rugby league, the primary focus of nutrition for athletes has been on performance. Consequently, the recommended total fat intake for athletes is between 20% and 25% of their energy intake (5).
Sport-specific nutrition recommendations may be influenced by socio-economic factors affecting food choices. Non-professional athletes with limited budgets might opt for high-energy density foods, particularly in low socio-economic status areas of countries like Argentina, where rugby has not yet fully embraced professionalism (11, 12). Despite the worldwide popularity of rugby, there is a lack of studies pertaining to the dietary intake of these athletes (13, 14).
Therefore, the purpose of this study is to present the dietary intake and anthropometric profile of non-professional rugby players in Argentina. This research aims to fill the gap in dietary information on this sport and highlight how low budgets influence food selection and nutrient composition.
2 Materials and methods
2.1 Subjects
A battery of anthropometric variables (body mass, height, sitting height, bone breadths, limb and trunk girths, and skinfolds) was collected on 57 rugby union players from a Group III Club of the Unión de Rugby de Buenos Aires (URBA) set in a low-income neighborhood. Measurements were performed by level 2 and 3 anthropometrists who adhered to the International Society for the Advancement of Kinanthropometry (ISAK) protocol (15).
2.2 Anthropometry
Anthropometric tools included an Aspen EB6571 digital strain-gauge scale (Jinli Electronic, Zhongshan, China), wall-mounted portable stadiometers with headboards (Rosscraft SRL, Argentina), a 50-cm sturdy wooden box for sitting height, bone breadth calipers (Rosscraft SRL, Argentina), measuring tapes (Rosscraft, Canada), and Holtain skinfold calipers (Crymych, UK). Body composition was assessed using the Five-Way Fractionation Method (16) which divided the body into anatomically defined tissue masses: adipose, muscle, residual, bone, and skin. Fat mass was estimated using the Yuhasz percent fat equation (17). Body mass index (BMI), weight/height2, sum of six skinfolds (S6skf) as the sum in millimeters of triceps, subscapular, supra-spinale, abdominal, front thigh and medial calf skinfolds, and muscle-to-bone ratio (MBR) as muscle mass/skeletal mass (8) were calculated. Registered dietitians interviewed the players to record a 24-hour dietary recall of the previous day's (a Friday) food and beverage intake, using memory cues and strategies to optimize recall. Diet analysis (energy, macro-, micro-nutrients, meal, and food-type energy distribution) was carried out using the SARA nutrition software (version 1.2.12, Ministerio de Salud, Argentina; http://www.msal.gov.ar/htm/Site/ennys/site/sara.asp). Micro-nutrient adequacy was established by comparing the reported intakes with the Daily Reference Intakes (DRI) for adult males suggested by the Food and Nutrition Board, Institute of Medicine, USA (http://www.nap.edu/catalog/dri/). Additional information on weekly training and daily activities was collected to estimate a physical activity level (PAL) using the Factorial Method (Energy and protein requirements. Report of a joint FAO/WHO/UNU Expert Consultation., 1985). Total energy expenditure estimation (TEE) was calculated by multiplying the PAL by the estimated basal metabolic rate (BMR) using the Schofield equation (18). Validity of reported food intakes was assessed using the suggestions of Black (19), comparing reported energy intake (EI) against calculated TEE. To avoid over-estimating BMR in over-fat players, the Hamwi formula was used to adjust the body weight used in calculating BMR (20). Before testing, the purpose of the study was explained to the players, who signed an informed consent form. Approval for the study was obtained from the Ethics Board at the Departamento de Medicina at River Plate Club.
2.3 Statistical analysis
The SPSS software (v27.0.0.0, SPSS Inc., Chicago, USA) was used for all statistical analyses. Data were presented as the mean ± standard deviation (SD). Assumptions of normality were verified using the Shapiro-Wilk test and student's independent t-test and Mann-Whitney U-test were used for comparison analyses. For all analyses, the criterion for significance was set at an alpha level of p < 0.05.
3 Results
The participants trained for two hours on Tuesdays and Thursdays and played games on Saturdays. They began playing rugby at an average age of 15.9 ± 5.2 years, with an average rugby-playing history of 11.7 ± 7.4 years. PAL was 1.83 ± 0.23.
Table 1 presents body composition characteristics and comparison analyses for Group III non-professional players (G3) against reference data of Group I players (G1) (8). Figure 2 schematizes the main body mass components for the two groups.
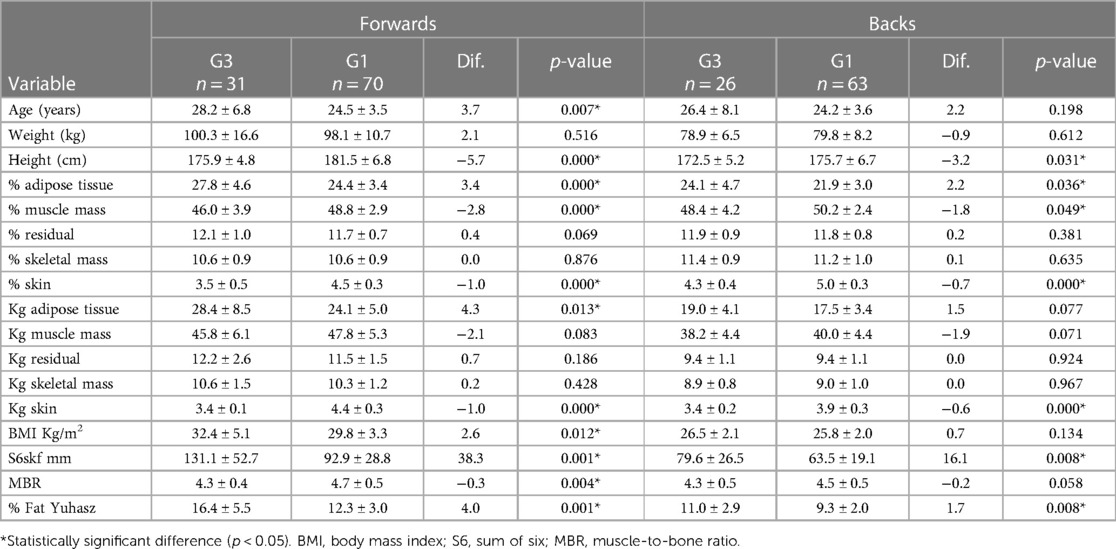
Table 1 Body composition features by position of group III non-professional players (G3) against professional group I reference players (G1). Data are mean ± standard deviation.
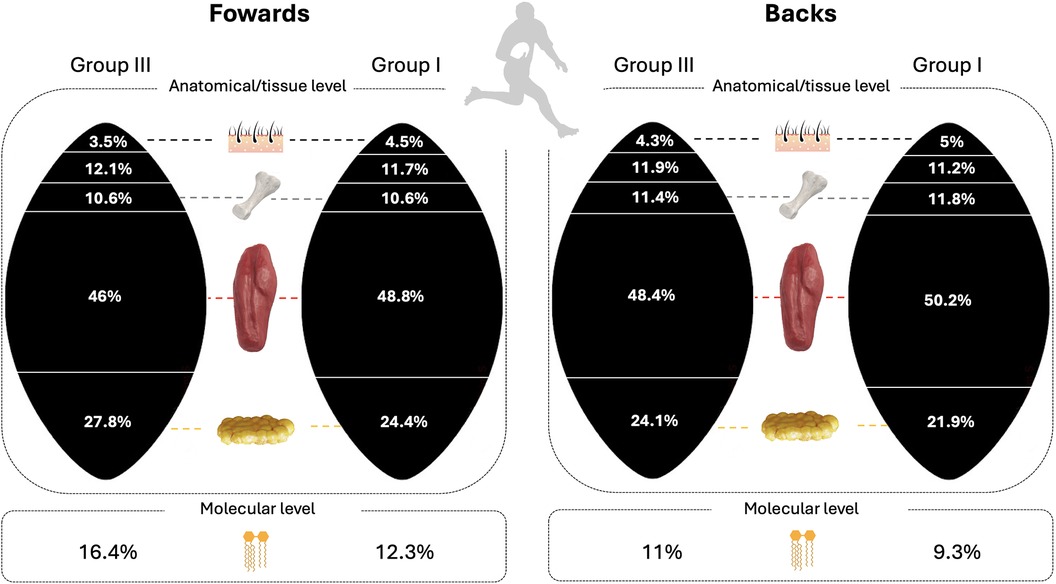
Figure 2 Body composition characteristics of professional and non-professional rugby players grouped by roles.
Energy and macro-nutrient intake were reported in Table 2. Backs players presented a higher energy intake than forward players, resulting from higher macro-nutrients intake. Micro-nutrient intake was reported in Table 3.
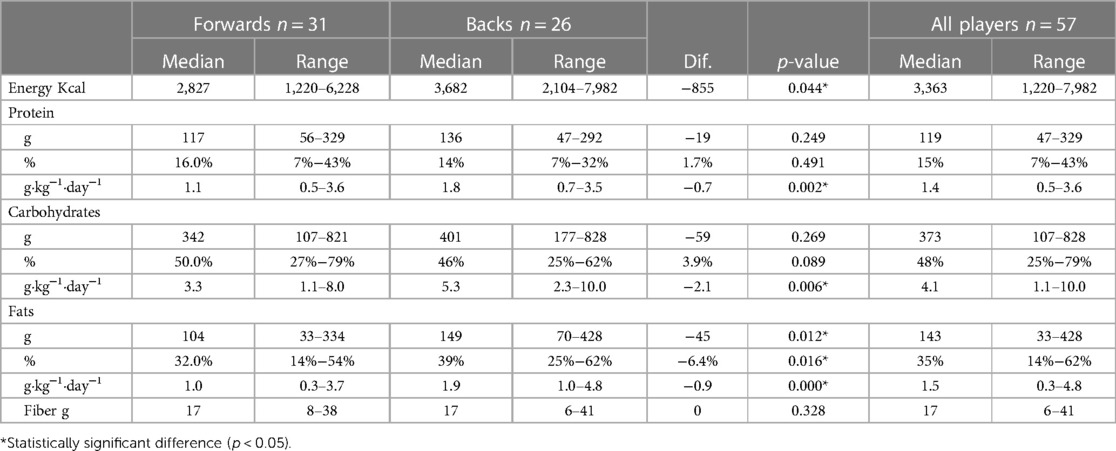
Table 2 Energy and macro-nutrient intake.
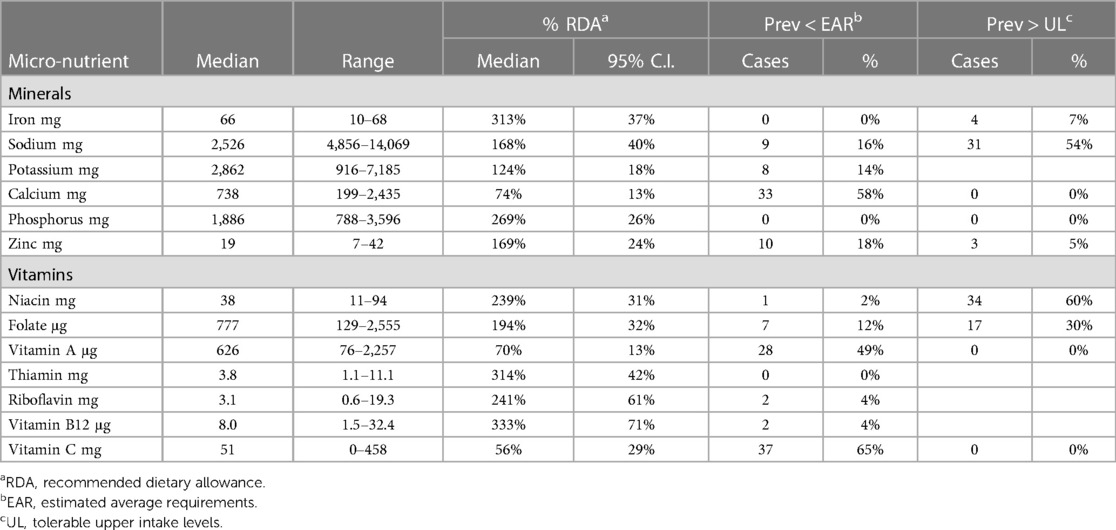
Table 3 Micro-nutrient intake of non-professional rugby players showing adequacy and prevalence of insufficient and excessive intakes.
Twenty-three percent of the players surveyed skipped breakfast, while another 37% consumed less than 10% of their daily energy intake during this meal. This means that 60% of the players had deficient breakfasts. Figure 3 illustrates the average distribution of energy intake per meal.
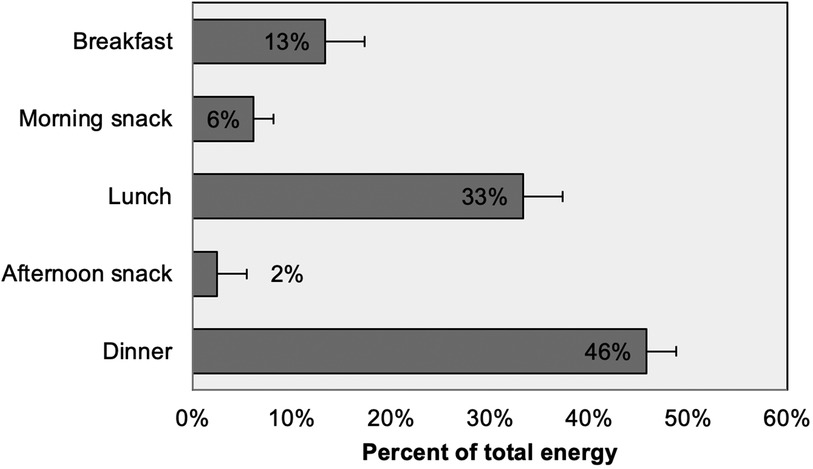
Figure 3 Average distribution of energy intake per meal. Error bars are 95% C.I.
Five players reported to have drunk alcohol on the recorded day, with beer as the main option, followed by wine and spirits, as shown in Figure 4.

Figure 4 Average distribution of energy intake per type of food. Error bars are 95% C.I.
4 Discussion
The objective of the study was to present the anthropometric characteristics of non-professional rugby players along with their dietary habits. Understanding the characteristics of athletes included in low-income teams can help guide specific training or nutritional programs aimed at improving health status and sports performance.
4.1 Size and body composition
When compared to professional rugby players (Table 1), both forwards and backs from the non-professional team were shorter, had more adiposity, and possessed less muscle mass. These differences were anticipated due to the less competitive nature of their rugby environment, where such physical attributes are crucial for performance (7). The reasons for these disparities may include selection processes, living in disadvantaged socio-economic settings, genetics, the amount of training, and/or nutrition.
The use of the five-way fractionation model allowed for the quantification of important components such as muscle, bone, and adipose tissue. This enabled the calculation of the MBR, an index that can be particularly useful since muscle mass is correlated with strength and performance (21). Adipose tissue is defined as the anatomical entity, encompassing lipids, proteins, electrolytes, and water, and differs from chemically-defined fat mass which only refers to lipids (22). This explained why adiposity values were higher than percent fat values, as shown in Table 1. Considering previous findings, the fat mass calculated in the participants included in this study show resulted higher compared to elite rugby players as well as athletes from other sports teams (3, 23, 24).
4.2 Energy and macronutrients
Back players had a higher energy intake compared to the heavier forward players (Table 2). The median energy intake was 3,363 Kcal (range 1,220–7,982), which is lower than that of Australian rugby league players, whose median intake is 4,230 Kcal (range 2,671–6,917 Kcal) (13), presumably because the amateur players trained less. Since the PAL was not different between the two groups (Forwards 1.84, Backs 1.83), there may have been over-reporting of food intake by backs and/or under-reporting by forwards. When the ratio of energy intake to basal metabolic rate was derived, forwards had a ratio of 1.68 ± 0.67, which was less than the backs' ratio of 2.11 ± 0.63. These ratios suggest that the heavier forwards might have been underestimating their food intake, and backs overestimating it, assuming accurate food intake assessment would result in values similar to their PAL values.
Macronutrient intake (protein, carbohydrate, and fat) was higher in backs (1.8, 5.3, and 1.9 g kg−1 day−1, respectively) compared to forwards (1.1, 3.3, and 1.0 g kg−1 day−1, respectively). This discrepancy was expected since forwards were heavier and possibly under-reported their intake. The protein and carbohydrate intake for forwards were below the recommended values of 1.6 and 7–8 g kg−1 day−1. It may be worth considering that larger athletes might require smaller per-kilogram nutrient recommendations, or that some adjustment for lean mass could be necessary.
4.3 Micronutrient intake
The median values for the whole group exceeded the RDAs for all vitamins and minerals (Table 3), except for calcium (74%), vitamin A (70%), and vitamin C (56%). For these three micronutrients, the prevalence of players consuming less than the Estimated Average Requirement (EAR) was also the highest. Although the median calcium intake was 738 mg, which is not particularly low, the recommended daily allowance (RDA) of 1,000 mg is considered by some to be excessively high and is a topic of ongoing debate (25). The low intake of vitamins A and C, along with the low fiber intake, indicated a low intake of fruits and vegetables (Figure 4). The participants of this study reported a low intake of calcium and vitamin C than professional (13) and semi-professional rugby players (26) who reported consuming 1,400–1700 mg of calcium and 150–200 mg of vitamin C.
4.4 Energy intake per meal and type of food
Figure 3 showed that almost half of the daily energy intake was at dinner, while only 13% was at breakfast, with 23% of the participants used to skip breakfast. Training sessions for these players were schedule at night and were followed by dinner. This eating pattern may not optimize the balance between exercise and nutrition, as it involves insufficient intake before training and excessive consumption afterward. Although dietary periodicity studies are not very common, research including team sport athletes in Australia also found that these athletes tended to eat larger meals at night (27). Cereal and starches contributed most of the energy to the diets of these rugby players, followed by meat and eggs, sweets and sugars, and fats and oils (Figure 4). Less energy came from dairy products, and fruits and vegetables. Alcohol contributed 1% of energy intake, less than the 4%–5% reported by Lundy et al. (13), but this figure most likely underestimated real intake since the survey included a Friday before Saturday morning training. One of the impacts of a restricted budget on dietary choices was increasing the consumption of inexpensive starches, sugars, and oils, while diminishing that of higher-priced, nutrient-dense meats, dairy, fruits, and vegetables, as was found with these players, except for the high meat intake, which, although declining, is abundant in Argentina (28).
Some study limitations should be listed. For example, the 24-h dietary recall method had many pitfalls, including under-reporting by fatter individuals, and the software used for nutrient analysis might have had its own limitations; for instance, we were perplexed by the median value for iron intake, which at 66 mg was about two to three times larger than that data reported in previous studies (13, 26). Future studies should aim to obtain nutritional data from three-day weighted food records.
5 Conclusions
Rugby players from a low socio-economic area playing in a third-division level in Argentina were shorter, fatter, and had less muscle than their division one counterparts, and their diets were high in starches, sugars, and fats, and low in fruits and vegetables. To improve health, body composition, and sport-specific performance, this information might aid dietitians in suggesting food intake patterns and choices that improve this nutritional scenario within the budget constraints of the players.
Data availability statement
The raw data supporting the conclusions of this article will be made available by the authors, without undue reservation.
Ethics statement
The studies involving humans were approved by approval for the study was obtained from the Ethics Board at the Departamento de Medicina at River Plate Club. The studies were conducted in accordance with the local legislation and institutional requirements. The participants provided their written informed consent to participate in this study.
Author contributions
FH: Conceptualization, Investigation, Methodology, Project administration, Writing – original draft. FC: Data curation, Formal Analysis, Methodology, Writing – original draft, Writing – review & editing. CP: Methodology, Supervision, Writing – review & editing. LS: Conceptualization, Investigation, Methodology, Writing – review & editing. NS: Methodology, Supervision, Visualization, Writing – review & editing.
Funding
The author(s) declare that financial support was received for the research, authorship, and/or publication of this article.
Open Access funding provided by Università degli Studi di Padova | University of Padua, Open Science Committee.
Conflict of interest
The authors declare that the research was conducted in the absence of any commercial or financial relationships that could be construed as a potential conflict of interest.
The reviewer CM declared a past co-authorship with the author FC to the handling editor.
The author(s) declared that they were an editorial board member of Frontiers, at the time of submission. This had no impact on the peer review process and the final decision.
Publisher's note
All claims expressed in this article are solely those of the authors and do not necessarily represent those of their affiliated organizations, or those of the publisher, the editors and the reviewers. Any product that may be evaluated in this article, or claim that may be made by its manufacturer, is not guaranteed or endorsed by the publisher.
References
1. Wang ZM, Pierson RN, Heymsfield SB. The five-level model: a new approach to organizing body-composition research. Am J Clin Nutr. (1992). doi: 10.1093/ajcn/56.1.19
2. Paoli A, Campa F. Problems and opportunities in the use of bioelectrical impedance analysis for assessing body composition during ketogenic diets: a scoping review. Curr Obes Rep. (2024). doi: 10.1007/s13679-024-00573-0
3. Petri C, Campa F, Holway F, Pengue L, Arrones LS. ISAK-Based Anthropometric standards for elite male and female soccer players. Sports. (2024) 12(3):69. doi: 10.3390/sports12030069
4. Williams C, Rollo I. Carbohydrate nutrition and team sport performance. Sports Med. (2015) 45(Suppl 1):S13–22. doi: 10.1007/s40279-015-0399-3
5. Black KE, Black AD, Baker DF. Macronutrient intakes of male rugby union players: a review. Int J Sport Nutr Exerc Metab. (2018) 28:664–73. doi: 10.1123/ijsnem.2017-0400
6. Duthie G, Pyne D, Hooper S. Applied physiology and game analysis of rugby union. Sports Med. (2003) 33:973–91. doi: 10.2165/00007256-200333130-00003
7. Till K, Cobley S, O’Hara J, Brightmore A, Cooke C, Chapman C. Using anthropometric and performance characteristics to predict selection in junior UK rugby league players. J Sci Med Sport. (2011) 14:264–9. doi: 10.1016/j.jsams.2011.01.006
8. Holway FE, Garavaglia R. Kinanthropometry of group I rugby players in Buenos Aires, Argentina. J Sports Sci. (2009) 27:1211–20. doi: 10.1080/02640410903207408
9. Stokes T, Hector AJ, Morton RW, McGlory C, Phillips SM. Recent perspectives regarding the role of dietary protein for the promotion of muscle hypertrophy with resistance exercise training. Nutrients. (2018) 10(2):180. doi: 10.3390/nu10020180
10. Loveday SM. Food proteins: technological, nutritional, and sustainability attributes of traditional and emerging proteins. Annu Rev Food Sci Technol. (2019) 10:311–39. doi: 10.1146/annurev-food-032818-121128
11. Darmon N, Ferguson E, Briend A. Do economic constraints encourage the selection of energy dense diets? Appetite. (2003) 41:315–22. doi: 10.1016/s0195-6663(03)00113-2
12. Birkenhead KL, Slater G. A review of factors influencing Athletes’ food choices. Sports Med. (2015) 45:1511–22. doi: 10.1007/s40279-015-0372-1
13. Lundy B, O’Connor H, Pelly F, Caterson I. Anthropometric characteristics and competition dietary intakes of professional rugby league players. Int J Sport Nutr Exerc Metab. (2006) 16:199–213. doi: 10.1123/ijsnem.16.2.199
14. Dupuy O, Fargeas-Gluck M-A. Analyse des statuts nutritionnels selon les postes de jeu en rugby. Sci Sports. (2008) 23:22–5. doi: 10.1016/j.scispo.2007.11.003
15. International Society for Advancement of Kinanthropometry. International Standards for Anthropometric Assessment. Potchefstroom, South Africa: International Society for the Advancement of Kinanthropometry (2001).
16. Ross WD, Kerr DA. Fraccionamiento de la Masa Corporal: Un Nuevo Método para Utilizar en Nutrición, Clínica y Medicina Deportiva. Revista de Actualización en Ciencias del Deporte Vol. 1 Nº3. (1993).
17. Yuhasz MS. The Effects of Sports Training on Body fat in man with Predictions of Optimal Body Weight. (1962). Available online at: https://worldcat.org/title/54023609 (Accessed January 20, 2003).
18. Schofield WN. Predicting basal metabolic rate, new standards and review of previous work. Hum Nutr Clin Nutr. (1985) 39(Suppl 1):5–41.4044297
19. Black AE. Dietary assessment for sports dietetics. Nutr Bull. (2001) 26:29–42. doi: 10.1046/j.1467-3010.2001.00096.x
20. Krenitsky J. Adjusted body weight, pro: evidence to support the use of adjusted body weight in calculating calorie requirements. Nutr Clin Pract. (2005) 20:468–73. doi: 10.1177/0115426505020004468
21. Campa F, Semprini G, Judice PB, Messina G, Toselli S. Anthropometry, physical and movement features, and repeated-sprint ability in soccer players. Int J Sports Med. (2019) 40:100–9. doi: 10.1055/a-0781-2473
23. Mala L, Maly T, Zahalka F, Bunc V, Kaplan A, Jebavy R, et al. Body composition of elite female players in five different sports games. J Hum Kinet. (2015) 45:207–15. doi: 10.1515/hukin-2015-0021
24. Hartmann Nunes RF, de Souza Bezerra E, Orssatto LB, Moreno YM, Loturco I, Duffield R, et al. Assessing body composition in rugby players: agreement between different methods and association with physical performance. J Sports Med Phys Fitness. (2020) 60:733–42. doi: 10.23736/S0022-4707.20.10487-0
25. Hitendre S, Jordan R, Theodorakopoulos C, White L. Dietary intakes, knowledge, and perceptions of semi-professional rugby athletes in Scotland. J Int Soc Sports Nutr. (2022) 19:49–69. doi: 10.1080/15502783.2022.2036436
26. Jonnalagadda SS, Rosenbloom CA, Skinner R. Dietary practices, attitudes, and physiological status of collegiate freshman football players. J Strength Cond Res. (2001) 15:507–13.11726265
27. Burke LM, Slater G, Broad EM, Haukka J, Modulon S, Hopkins WG. Eating patterns and meal frequency of elite Australian athletes. Int J Sport Nutr Exerc Metab. (2003) 13:521–38. doi: 10.1123/ijsnem.13.4.521
Keywords: body composition, anthropometry, nutrition, sports team, multicomponent models
Citation: Holway FE, Campa F, Petri C, Spena LR and Szydlowski NY (2024) Kinanthropometry and dietary habits of non-professional rugby players. Front. Sports Act. Living 6:1439358. doi: 10.3389/fspor.2024.1439358
Received: 27 May 2024; Accepted: 24 June 2024;
Published: 8 July 2024.
Edited by:
Roberto Cannataro, University of Calabria, ItalyReviewed by:
Andrea Giorgi, Azienda USL Toscana Sud Est, ItalyCatarina Matias, Lusofona University, Portugal
© 2024 Holway, Campa, Petri, Spena and Szydlowski. This is an open-access article distributed under the terms of the Creative Commons Attribution License (CC BY). The use, distribution or reproduction in other forums is permitted, provided the original author(s) and the copyright owner(s) are credited and that the original publication in this journal is cited, in accordance with accepted academic practice. No use, distribution or reproduction is permitted which does not comply with these terms.
*Correspondence: Francesco Campa, ZnJhbmNlc2NvLmNhbXBhQHVuaXBkLml0